Category Archives: Deep South

Fog/Low Ceilings over Southwest Georgia

GOESR_IFRP_0200_1300_27June2016anim

GOES-R IFR Probability fields on 27 June 2016 at 0200, 0400, and then hourly from 0700 through 1300 UTC (Click to enlarge)

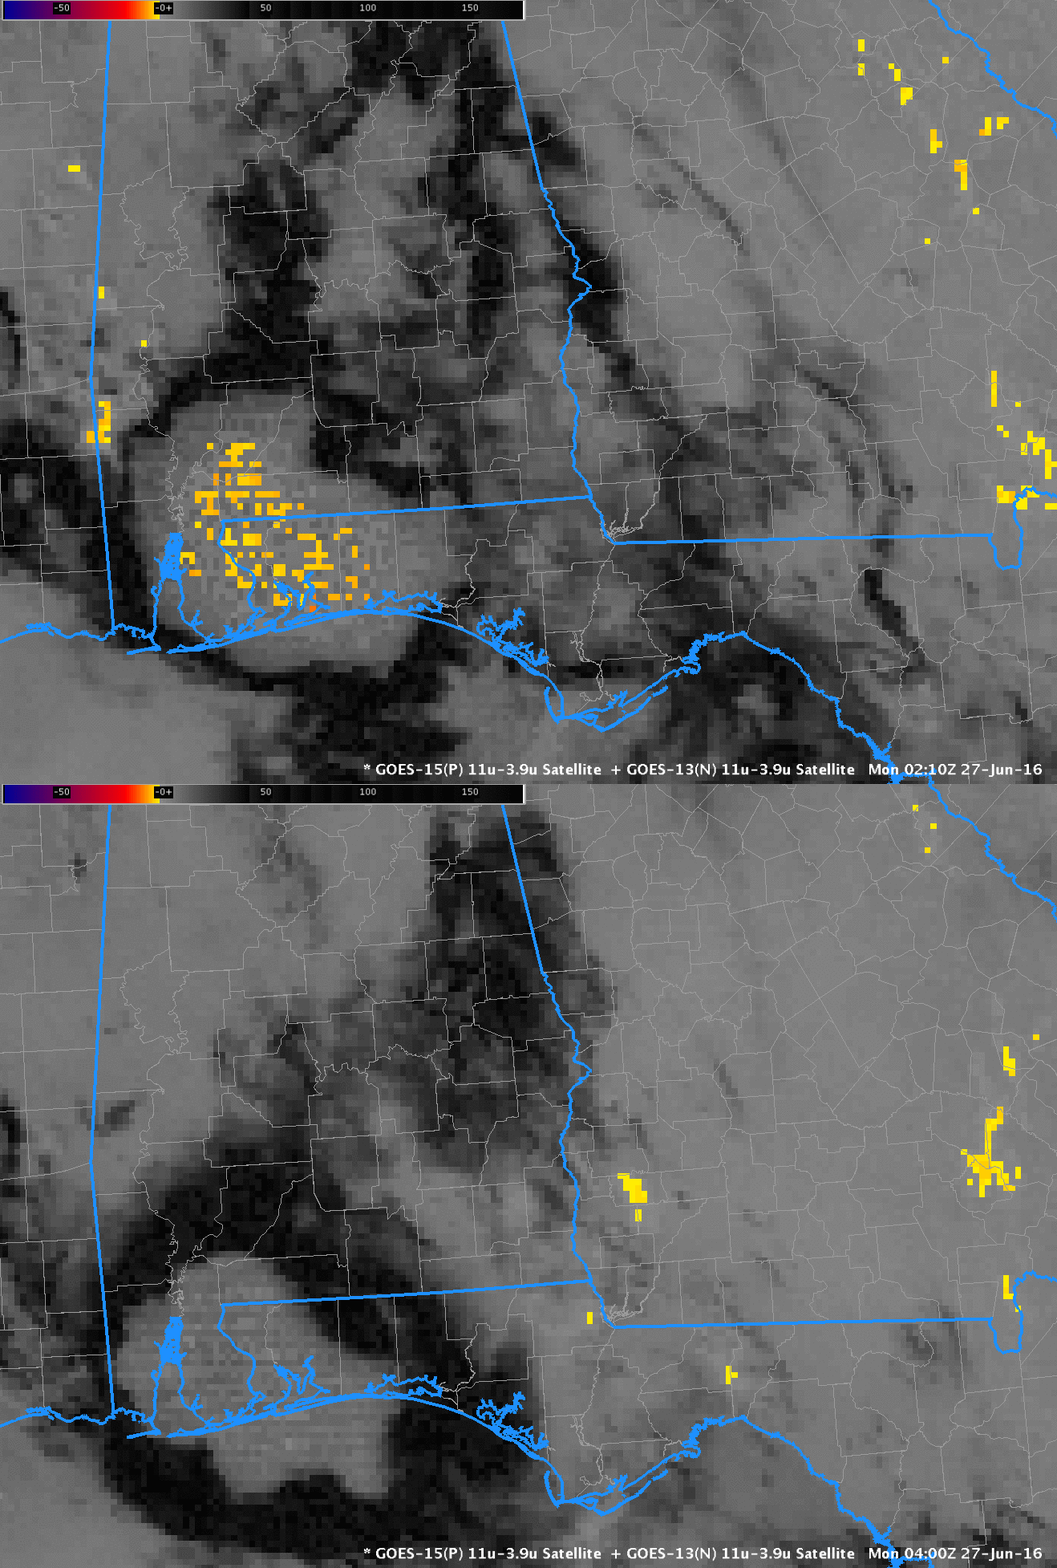
Late-day thunderstorms on 26 June 2016 set the scene for the development of fog overnight over southwestern Georgia. The animation above shows the GOES-R IFR Probability fields.  An enhancement in the fields that is initially driven by Rapid Refresh Model data showing near-saturation at low levels is apparent at 0200 UTC.  As clouds associated with the departing convection dissipate, satellite data could also be used as input into the IFR Probability fields.  The toggle below of GOES-13 Brightness Temperature Difference fields (3.9 µm – 10.7 µm), at 0200 and 0400 UTC, shows the appearance of low-level clouds as mid-level and higher clouds (dark in the enhancement used) dissipate.  By 0400 UTC, when satellite pixels finally start to suggest low clouds, fog had already started to develop.  IFR Probability fields gave an early alert to the possibility of fog development on this day that was not possible from satellite data alone.

GOES_BTD_0200_0400_27June2016toggle

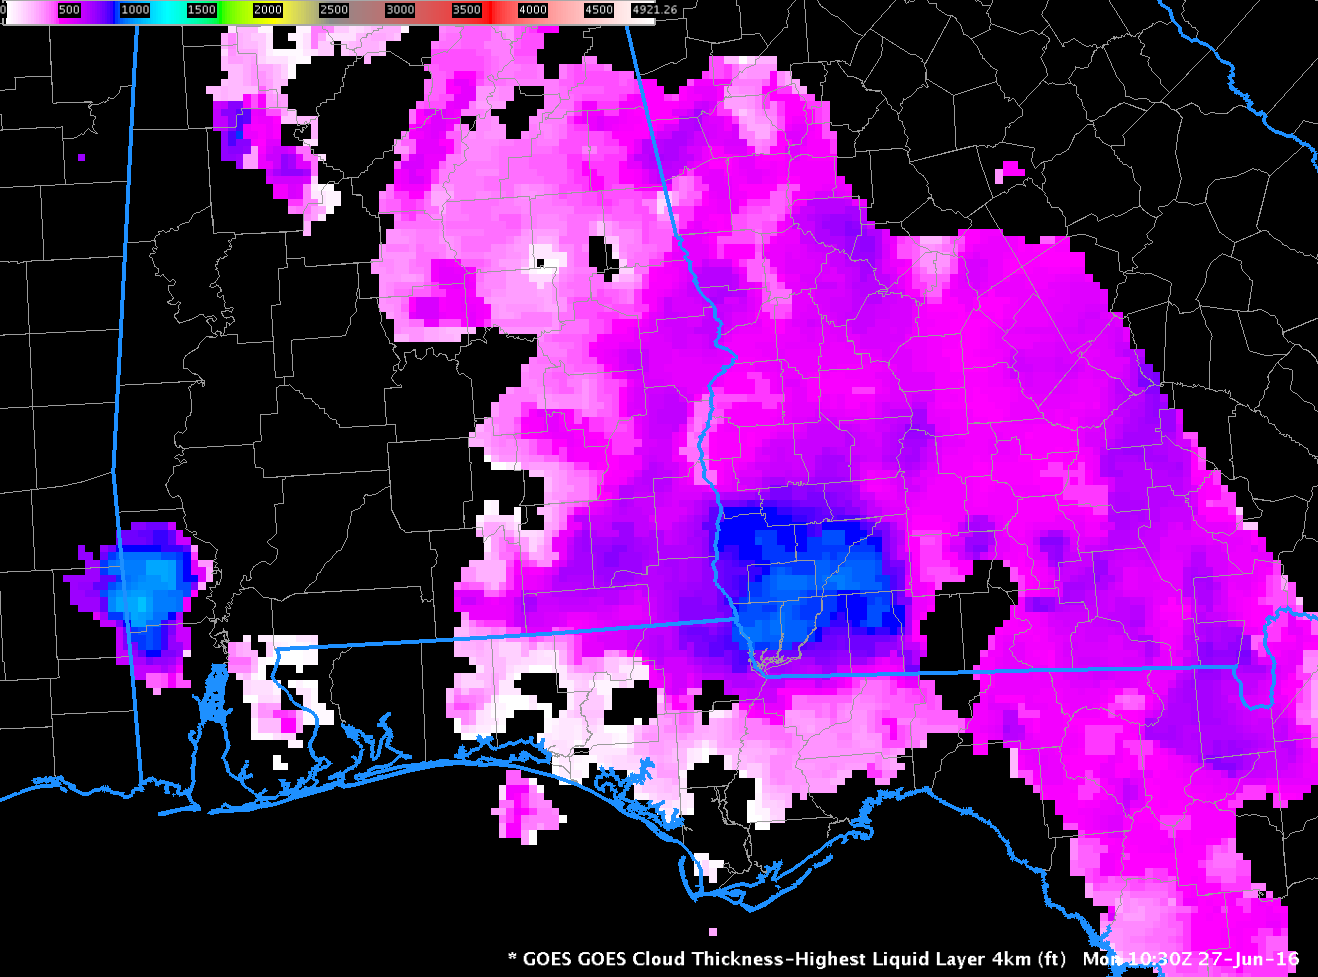
GOES-R Cloud Thickness Fields can give a hint to when radiation fog, as in this event, will dissipate in accordance with this scatterplot. The image below shows the GOES-R Cloud Thickness at 1030 UTC, the last field computed before twilight conditions (indeed, the boundary showing that boundary is readily apparent over eastern Georgia), with values exceeding 900 feet in some places over southwest Georgia.  Based on the scatterplot, that suggests a dissipation time of just over 2 hours (based on the best fit line, but note the scatter in dissipation times associated with cloud thicknesses of 900 feet:  just over an hour to almost 4 hours!) so clear skies would be expected by 1300 UTC.  The animation of visible imagery, here, shows that fog persisted just a bit longer than that, dissipating shortly after 1400 UTC.  GOES-R Cloud Thickness field is an empirical relationship between 3.9 µm emissivity and cloud thickness that is based on SODAR observations off the west coast.  The scatterplot was created based on past observations limited to the southeast part of the US and parts of the Great Plains.

GOESR_CLDT_1030_27June2016

GOES-13 Cloud Thickness, 1030 UTC on 27 June 2016 (Click to enlarge)

Fog along the Gulf Coast in Louisiana

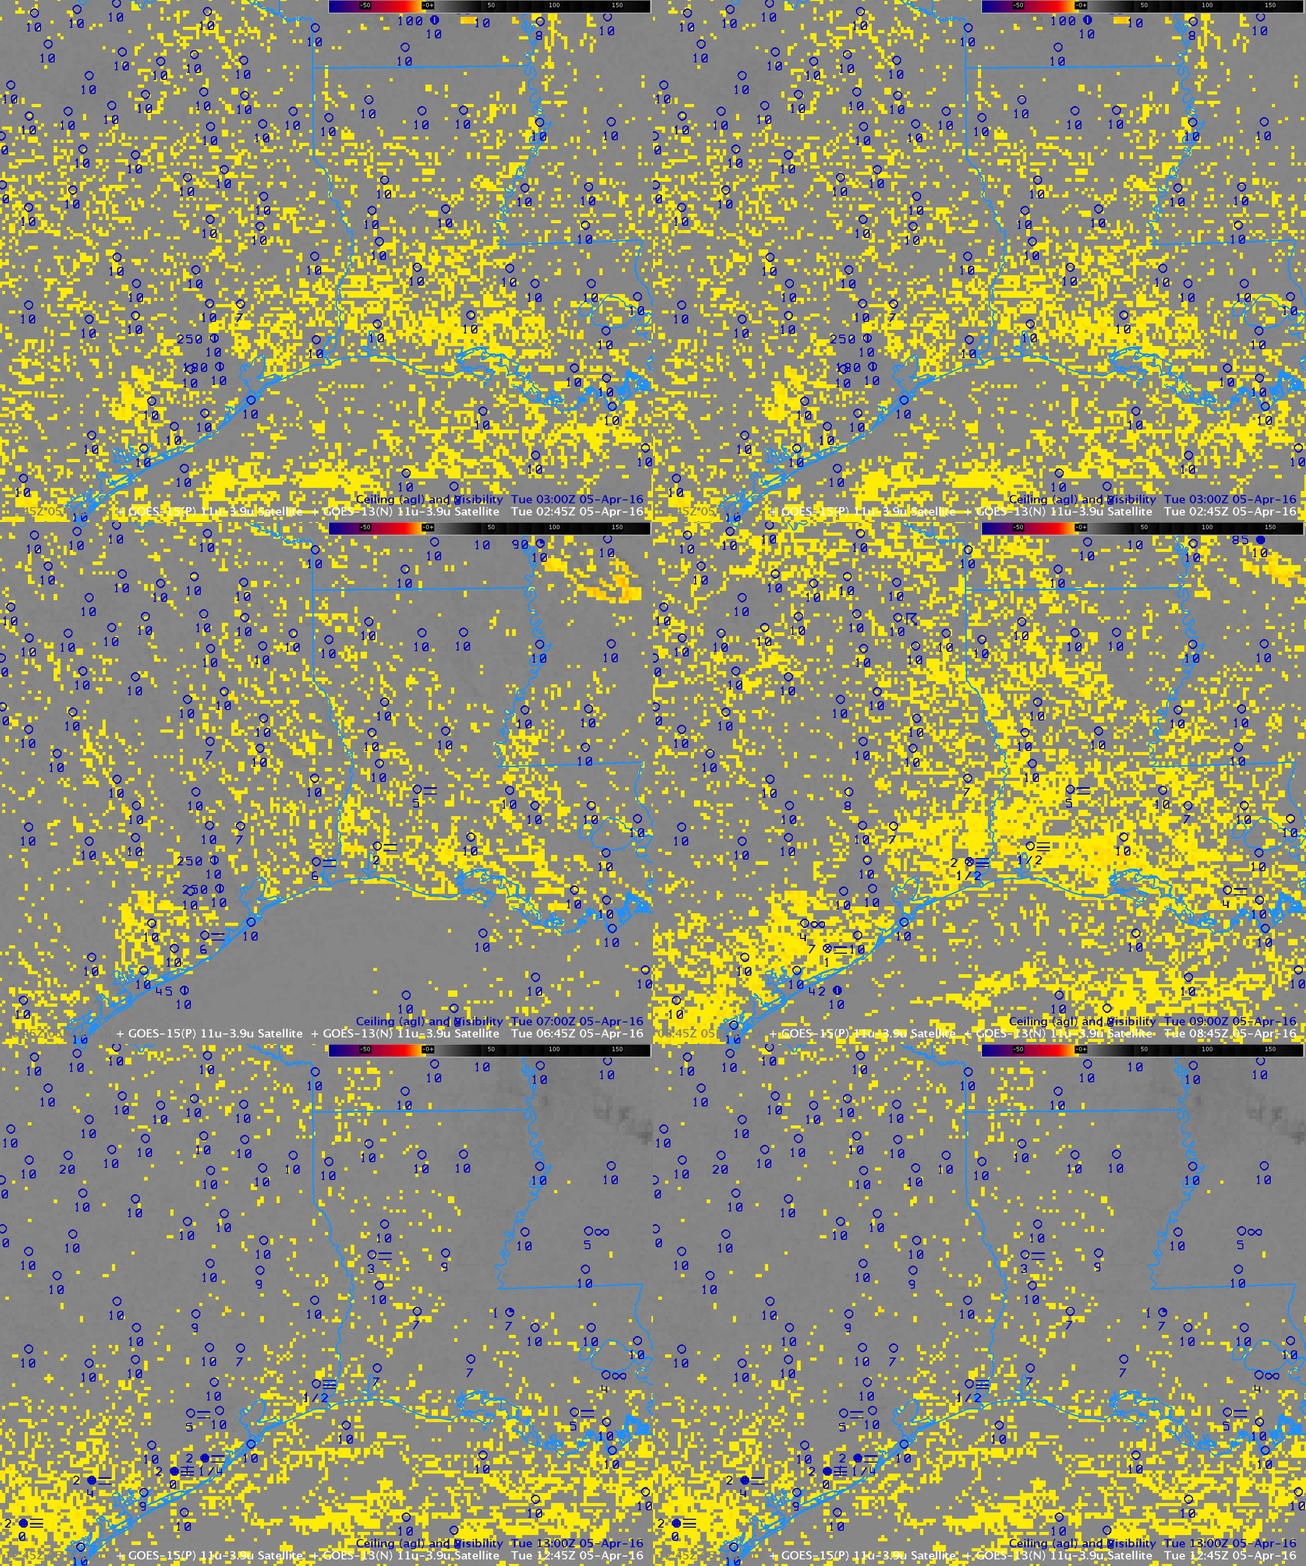
GOESBTD_0245_1245anim_05Apr2016

GOES-13 Brightness Temperature Difference Fields, every two hours from 0245 to 1245 UTC, 5 April 2016 (Click to enlarge)

Fog developed along the Gulf Coast of western Louisiana overnight. Brightness temperature difference fields have been used in the past to diagnose the development of fog. This capability exists because water-based clouds, such as stratus, have different emissivity properties at 3.9 µm and 10.7 µm. A water-based clouds does not emit 3.9 µm radiation as a blackbody (but it does emit 10.7 µm radiation as a blackbody). Consequently, the computed temperature of the cloud based on the detected 3.9 radiation is cooler than the temperature computed based on the detected 10.7 radiation. The animation above shows the evolution of the brightness temperature difference field, and the field is characterized by a lot of scattershot signal. Some river valley can be inferred in the signal, but the region of fog over southwestern Louisiana does not stand out.

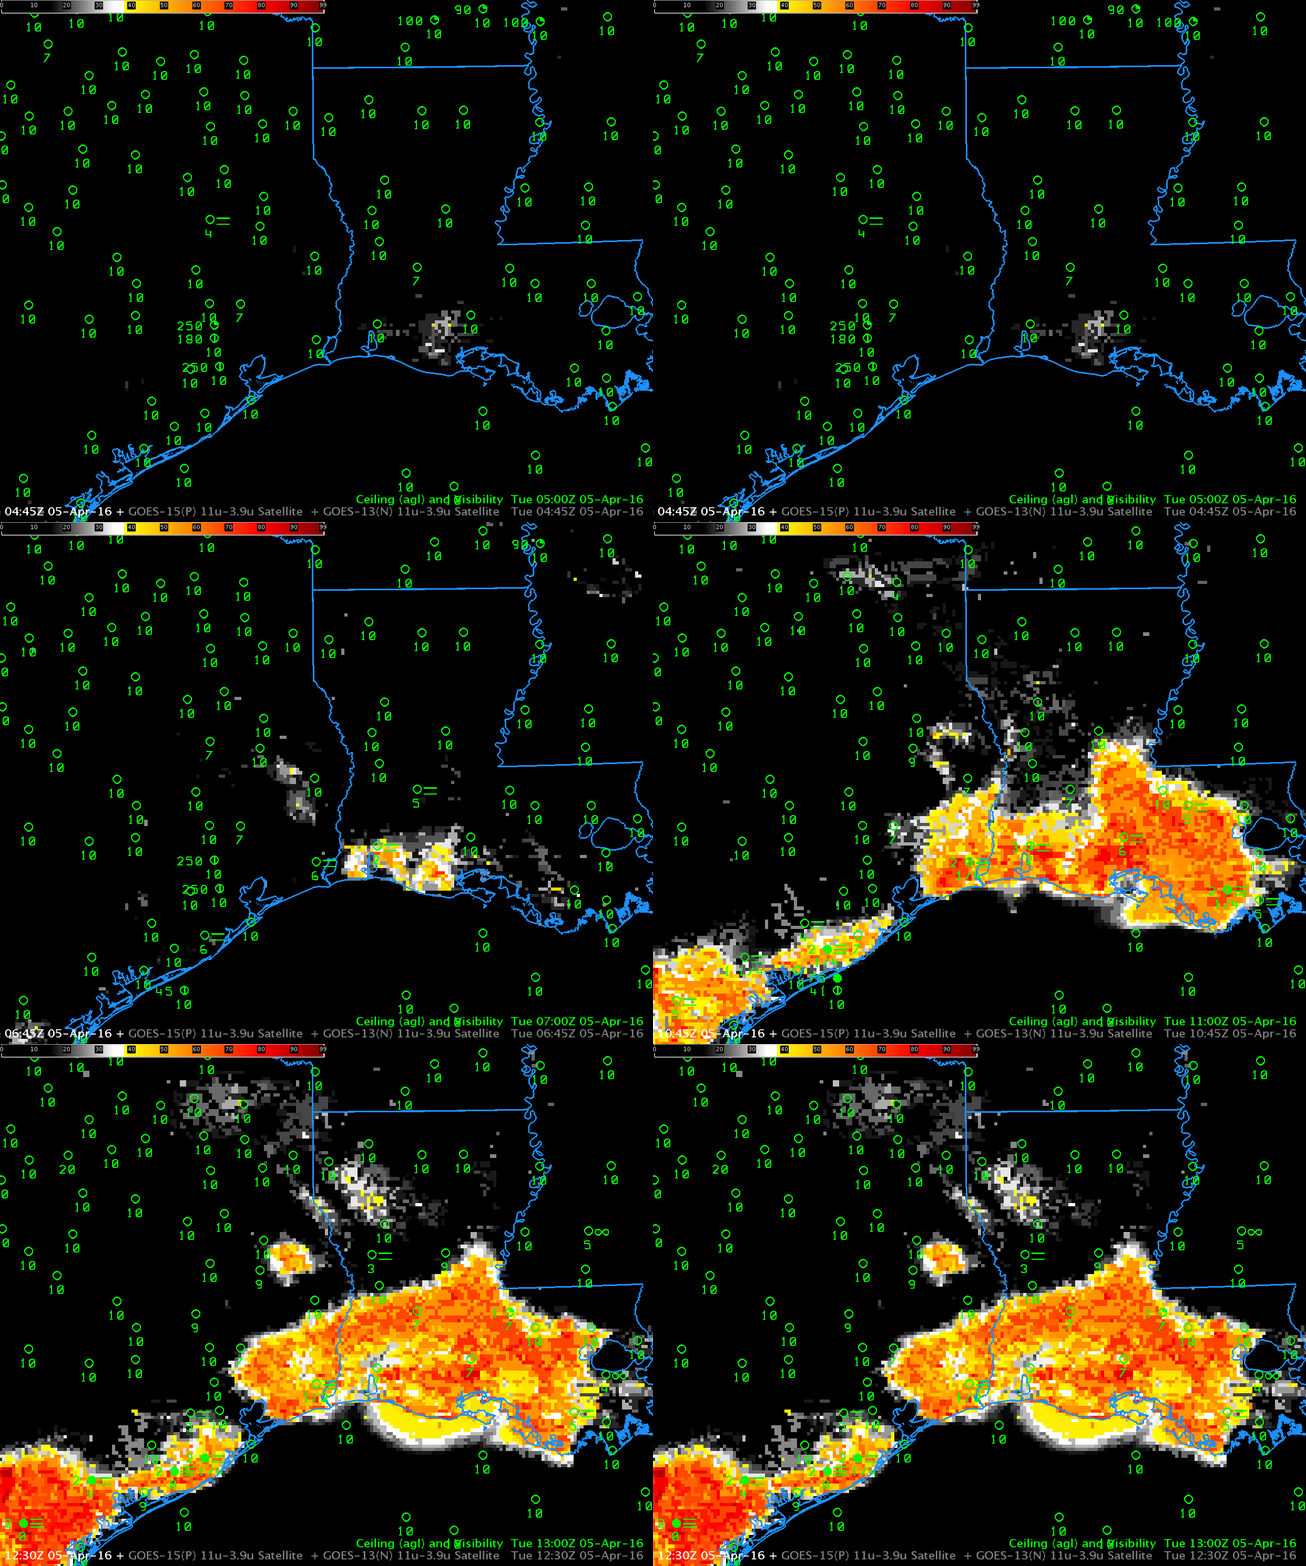
In contrast, the GOES-R IFR Probability field, below, diagnoses an initially isolated region of enhanced IFR probabilities near stations that are reporting reduced ceilings/visibilities.  The enhanced IFR Probabilities develop over southwestern Louisiana and expand outward from there (a second region develops south of Houston TX).  Regions where IFR conditions do not develop have very low IFR Probabilities that persist with time.

GOESIFR_0445_1230anim_05Apr2016

GOES-R IFR Probability Fields, every 2 hours from 0445 to 1230 UTC, 5 April 2016 (Click to enlarge)

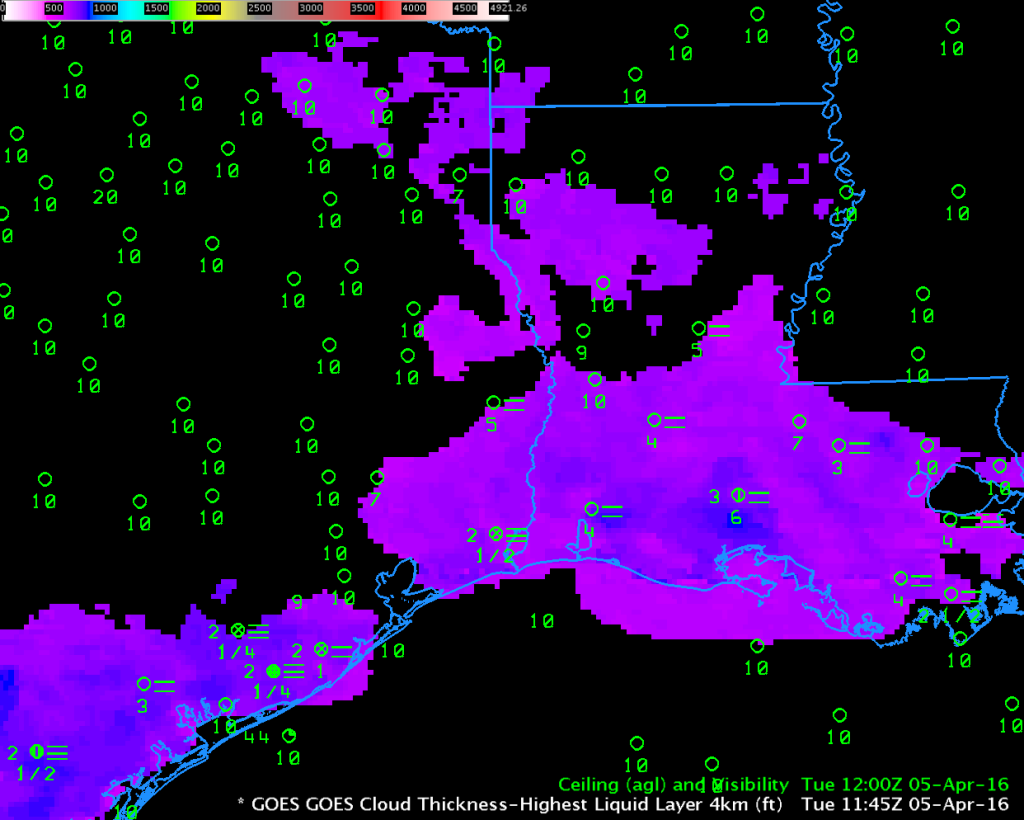
GOES-R Cloud Thickness relates 3.9 µm emissivity to cloud thickness based on historical relationships between that value and sodar observations off the west coast of the USA. The value is not computed during twilight conditions on either side of sunrise and sunset, but  the last observation taken before sunrise, shown below, is related to dissipation time according to this scatterplot. Cloud Thickness on the morning of 5 April 2016 was at most 830 feet, suggesting rapid dissipation after sunrise. This is what occurred.

GOESCLDTH_1145_05Apr2016

GOES-R Cloud Thickness, 1145 UTC on 5 April 2016 (Click to enlarge)

Fog over ArkLaTex

IFRP-02

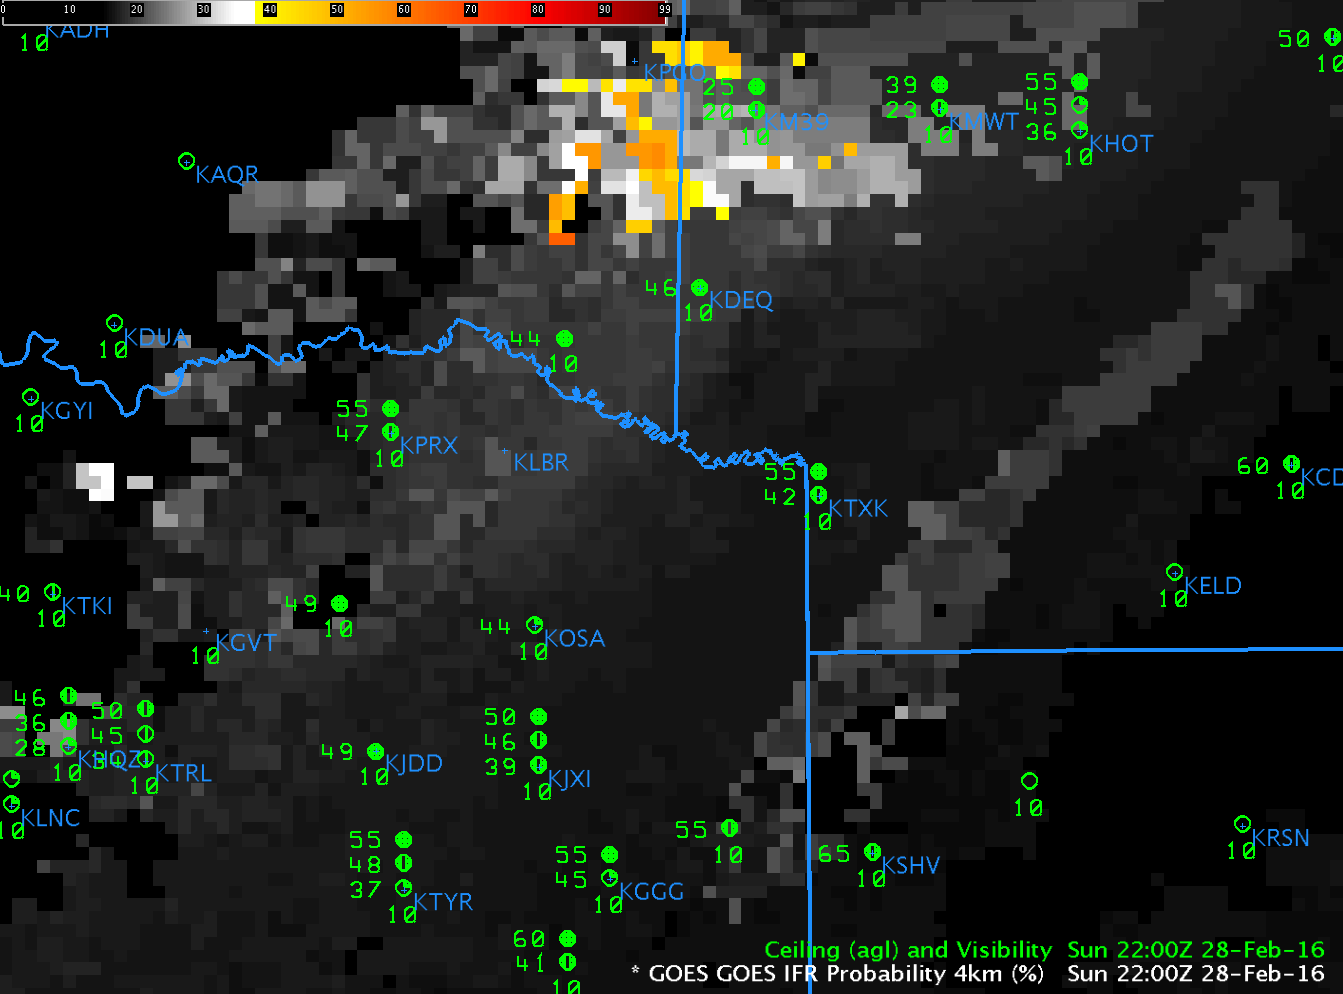
GOES-R IFR Probabilities, 2200 UTC on 28 February 2016 as well as surface observations of ceilings and visibilities (click to enlarge)

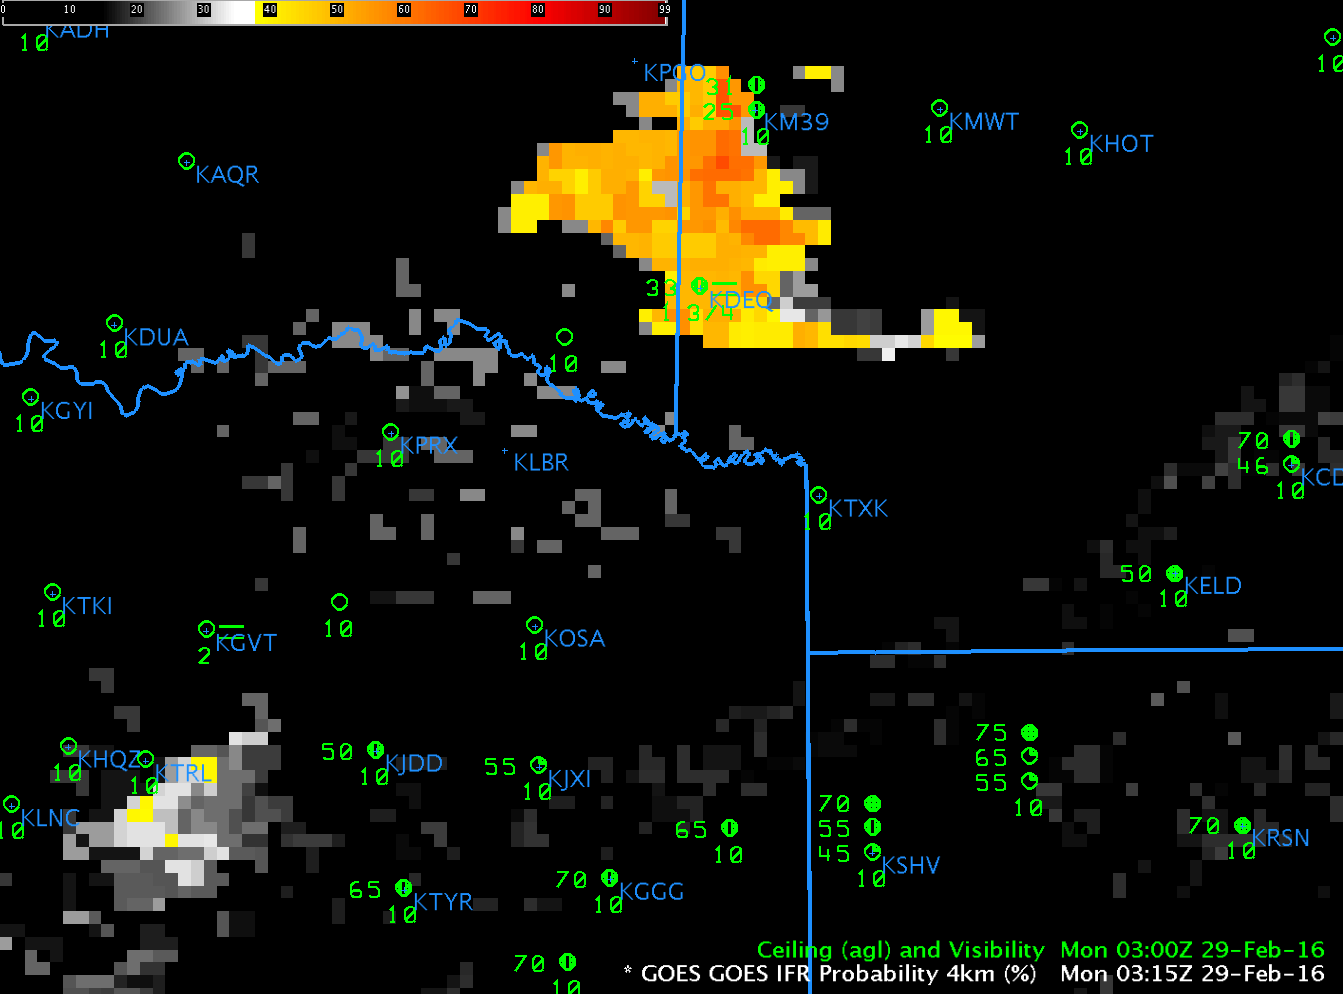
Late in the day on 28 February, as shown above, GOES-R IFR Probability fields included a small region of enhancement over west-central Arkansas and east-central Oklahoma. In this case, that field heralded the development of more widespread IFR conditions over northeast Texas (and surroundings). By 0300 on 29 February, below, IFR probailities in the region over east-central Oklahoma/west-central Arkansas had increased, and there is a suggestion of increasing IFR Probabilities over northeast Texas as well.  This is a case where IFR Probabilities can alert a forecaster to pay attention to a region long before a hazard develops.

IFRP-19

GOES-R IFR Probabilities, 0315 UTC on 29 February 2016 as well as surface observations of ceilings and visibilities (click to enlarge)

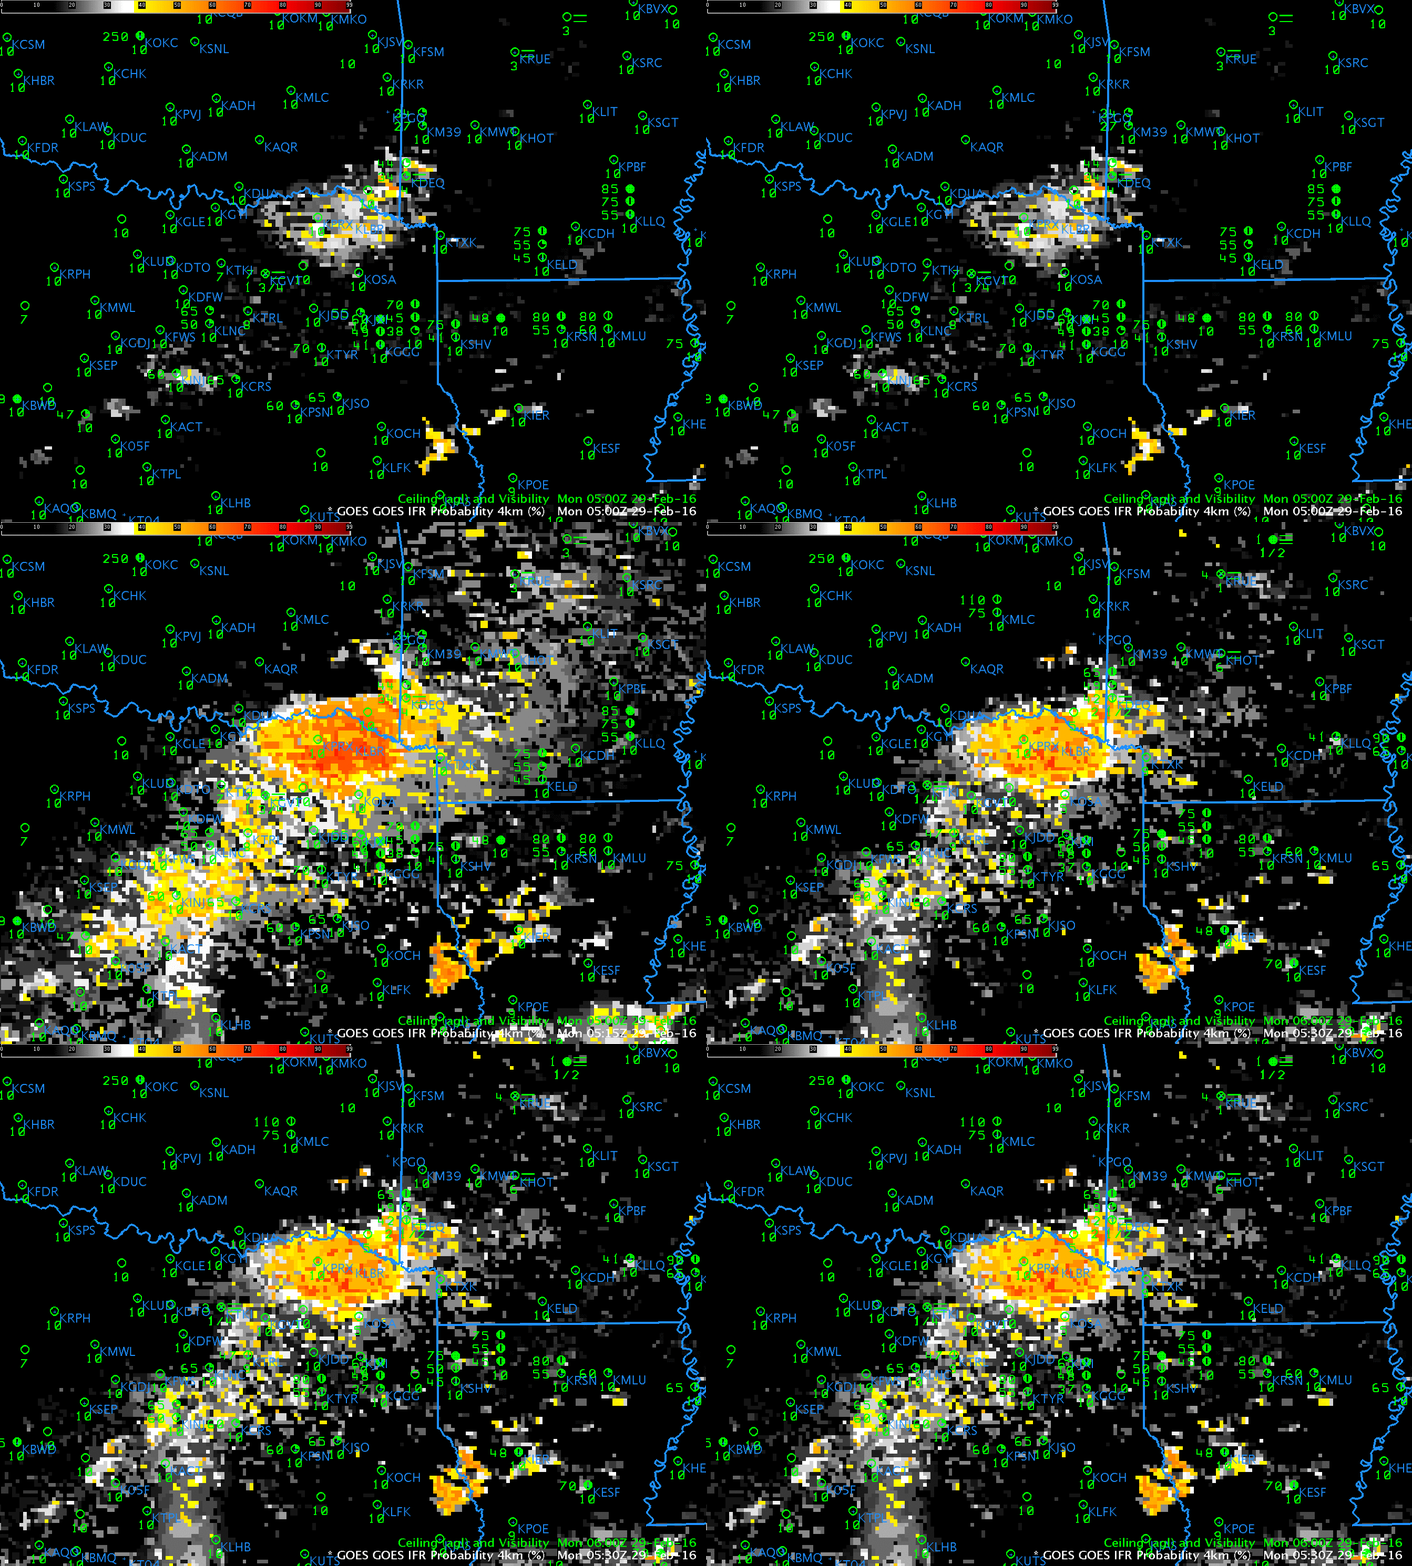
Late February starts the time when GOES-13 is near enough to eclipse season that stray light can creep into imagery. In this case, a large signal increase between 0500 and 0515, below, is in part related to stray light, and in part to low cloud development. By 0530, IFR Probability fields show less affect from stray light. (Click here for an animation of brightness temperature difference fields alone; Stray Light has an obvious impact at 0515 UTC).

IFR_P_0500_0530_29feb2106anim

GOES-R IFR Probability fields, 0500-0530 UTC, 29 February 2016, showing Stray Light Effects (Click to enlarge)

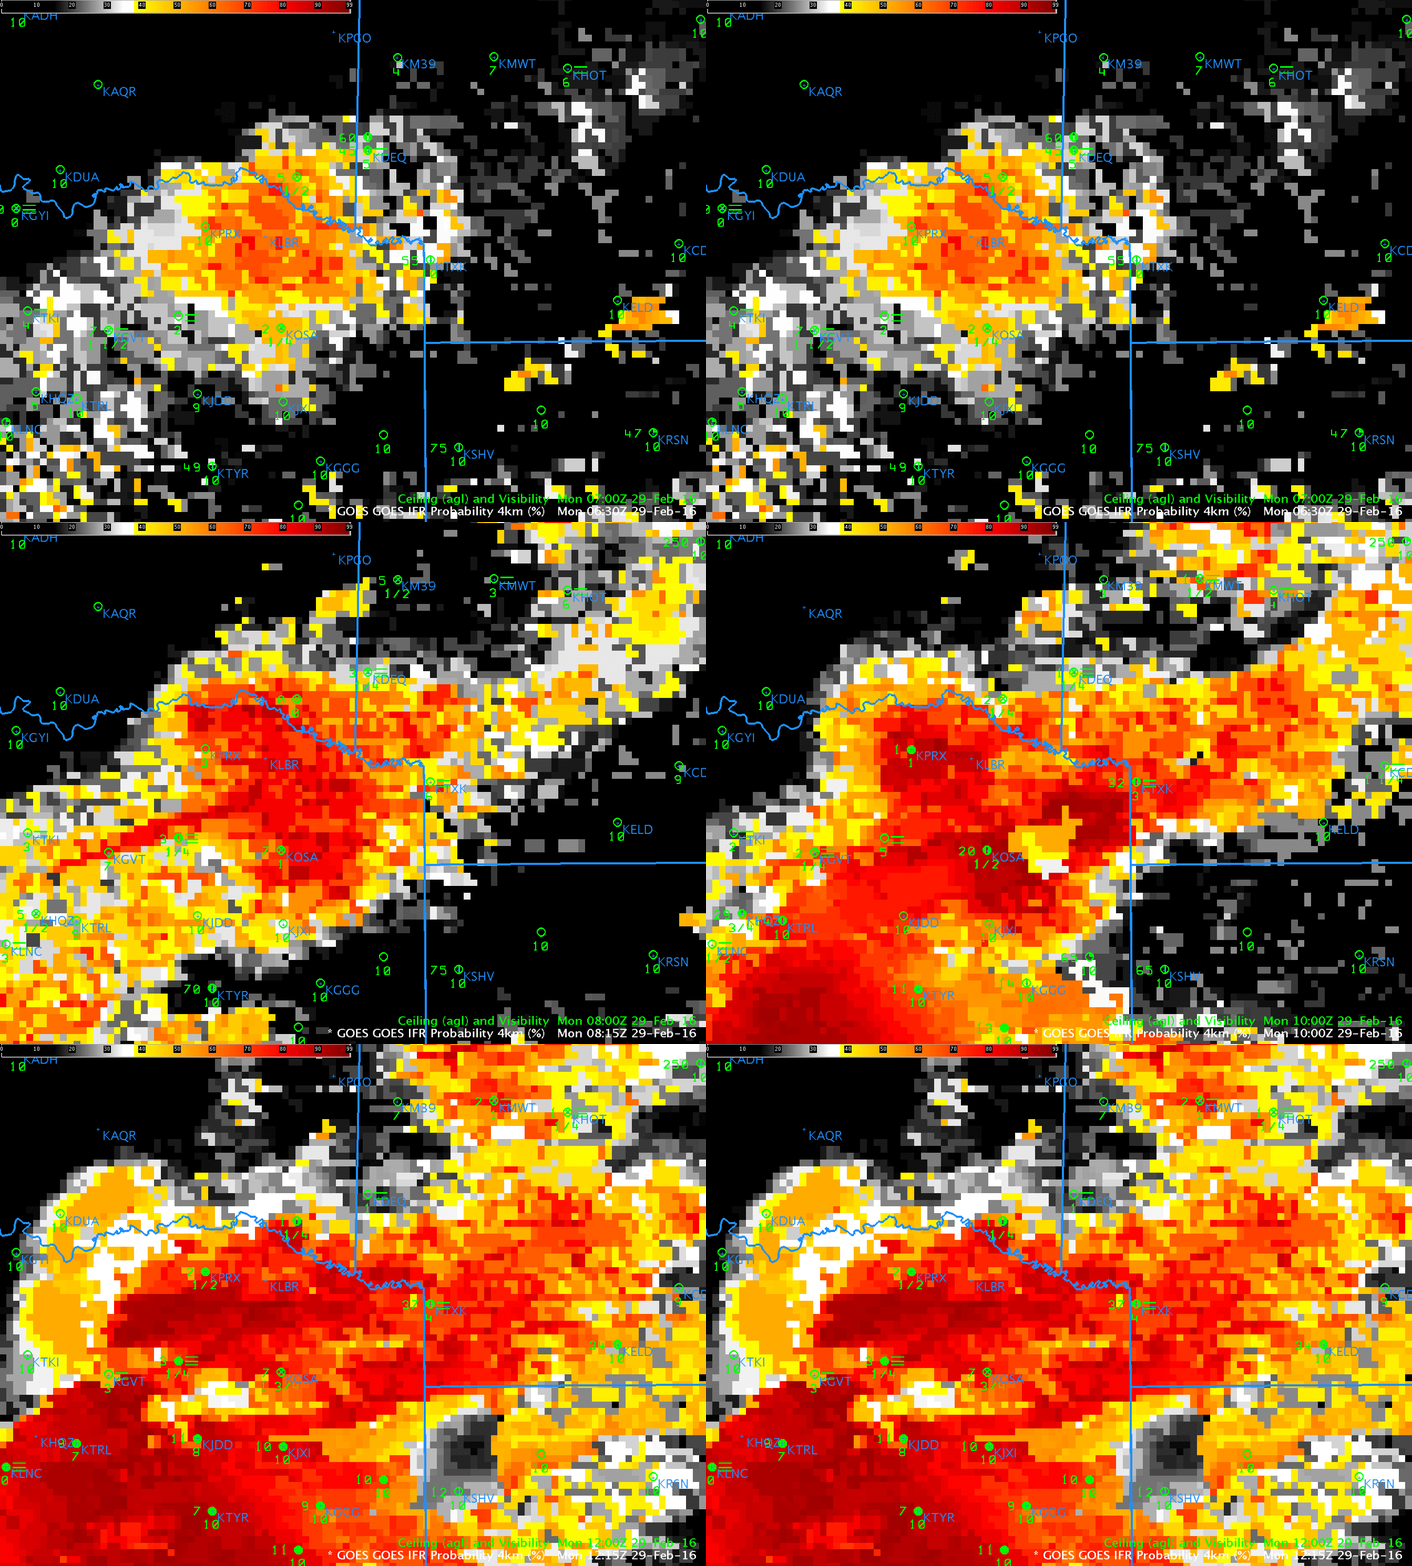
IFR Probability fields from 0615 through 1215 UTC are shown below. Very high IFR Probabilities (and IFR conditions) were widespread in the early morning over northeast Texas and surrounding states.

IFRPanim_0615_1215_29February

GOES-R IFR Probabilities fields, hourly from 0615-1215 UTC, and surface reports of ceilings and observations (Click to enlarge)

Fog over the Tennessee River Valley

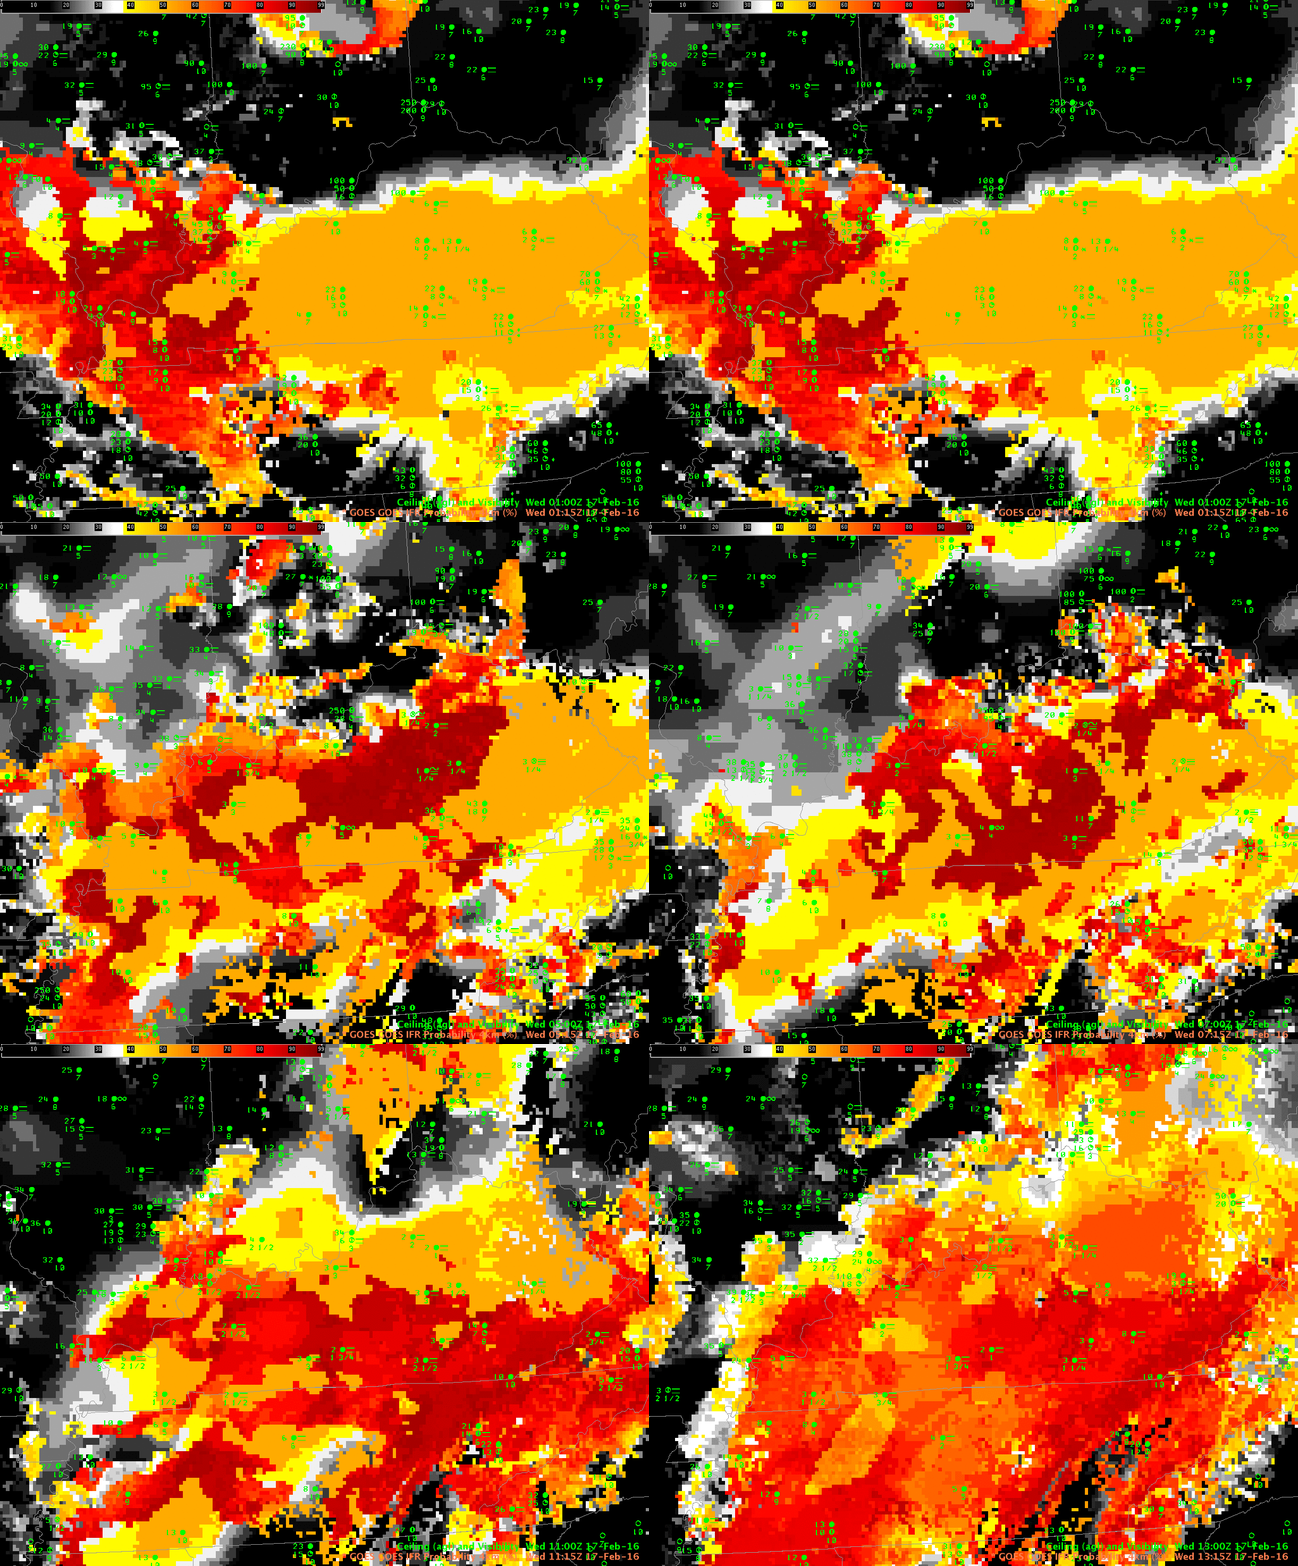
IFRP_0115_1315stepanim_17Feb2016

GOES-R IFR Probability fields, every two hours from 0115 through 1315 UTC on 17 February 2016 (Click to enlarge)

GOES-R IFR Probability fields showed large values over parts of Kentucky and Tennessee during the overnight hours on 16-17 February 2016, as shown in the animation above (every 2 hours from 0115 through 1315 UTC). (IFR or near-IFR Conditions were present over the region of enhanced IFR Probabilities) For much of the overnight hours, mid-level and high clouds prevented an unobstructed satellite view of low clouds, so Rapid Refresh model output was the principle driver in IFR Probabilities. When that happens, the character of the IFR Probability field is less pixelated (it’s a flatter field) and values are smaller. At the end of the animation — 1315 UTC — satellite observations of low clouds have improved and the GOES-R IFR Probability field is (1) more pixelated, as expected when satellite data are used and (2) showing higher values because Satellite Predictors can be used in the computation of IFR Probability.

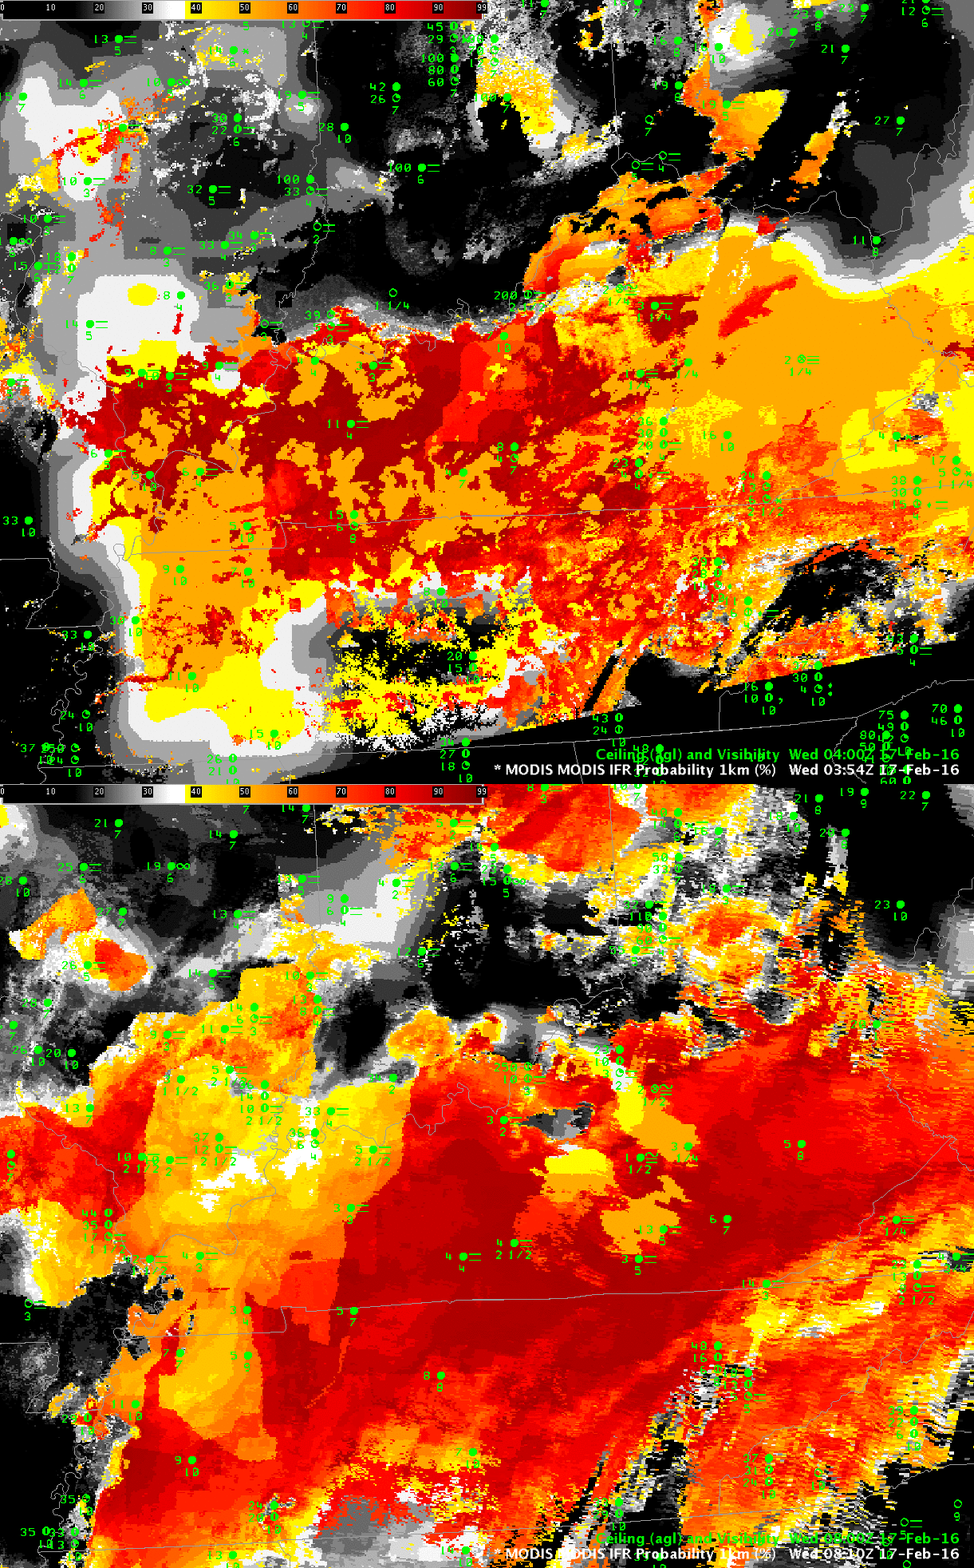
MODIS data from Terra and Aqua satellites can also be used to compute IFR Probability fields, and the high spatial resolution of the MODIS instrument (1-km vs. nominal 4-km on GOES) can yield superior results for valley fogs, for example (The effects of some rivers are apparent in the 0354 UTC image over western Tennessee, for example). For a large-scale event as above, however, GOES-based resolutions can be adequate. The toggle of MODIS-based GOES-R IFR Probabilities at 0354 UTC and 0810 UTC is shown below. Patchy clouds (that prevent MODIS from viewing low clouds) are more apparent in the 0354 UTC image than in the 0810 UTC image.

MODIS_IFRP_0354_0810UTC_17Feb2016toggle

MODIS-based GOES-R IFR Probabilities, 0354 and 0810 UTC on 17 February 2016 (Click to enlarge)

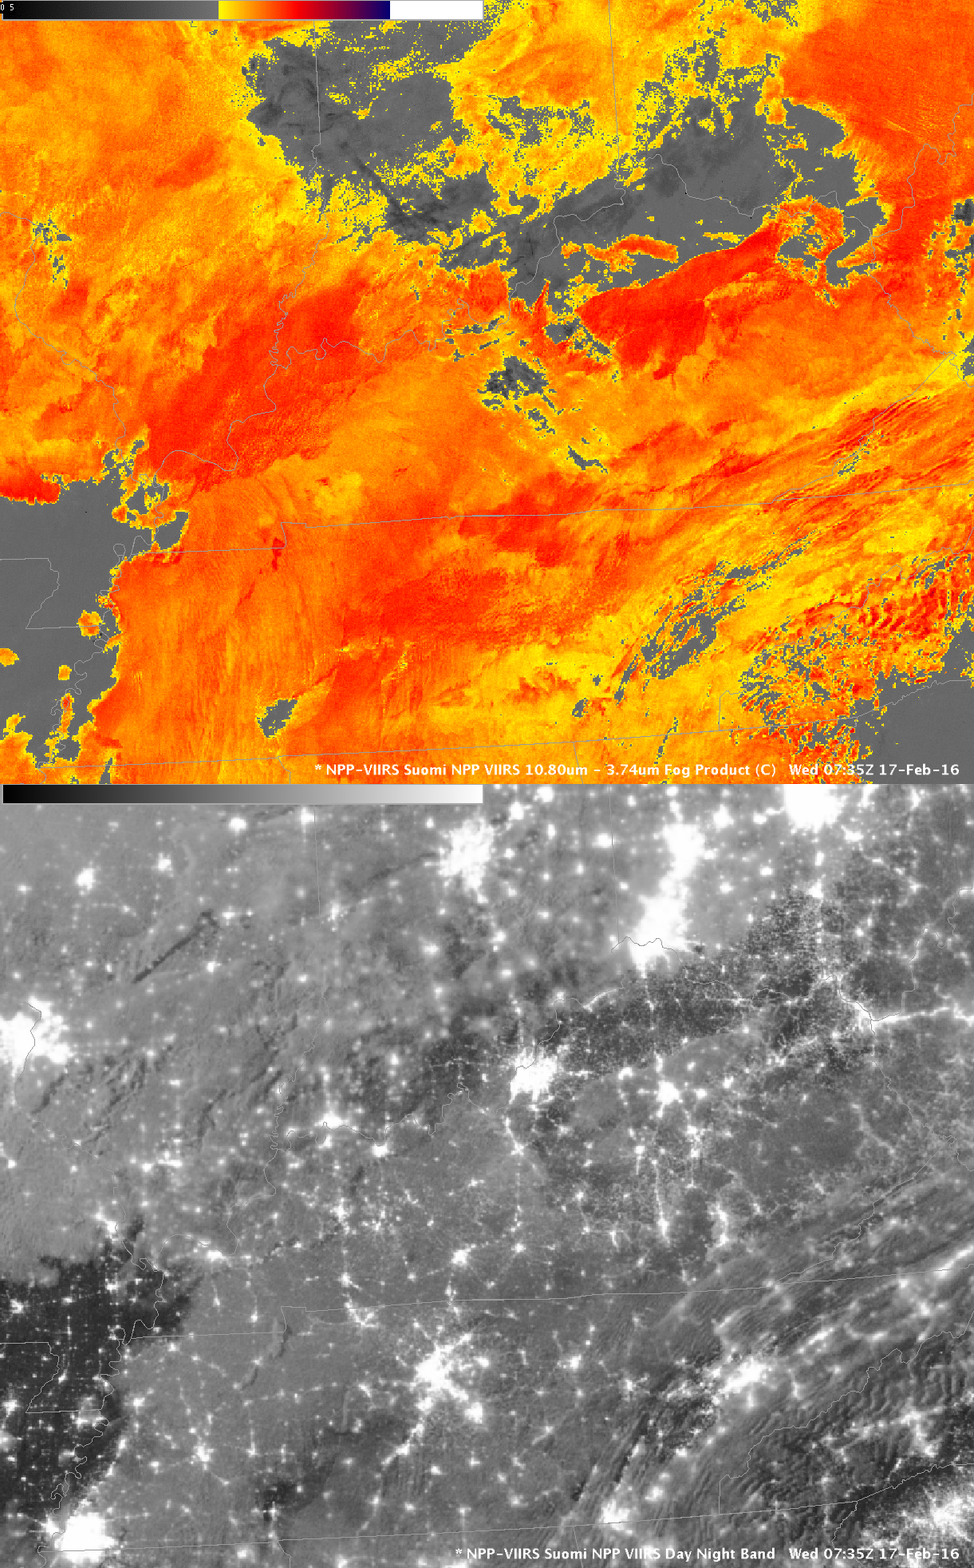
Suomi NPP Overflew the Tennessee River valley just after midnight local time, and the toggle of the Day Night band and the Brightness Temperature Difference field (11.45 – 3.74) is shown below. Extensive cloud cover is apparent. The importance of the IFR Probability fields is that it incorporates surface information (from the Rapid Refresh predictions of saturation in the lowest 1000 feet of the model atmosphere) so that fog and low stratus that impacts transportation by reducing visibilities can be distinguished from mid-level stratus that has a smaller impact.

SNPP_DNB_BTD_0735UTC_17Feb2016toggle

Suomi NPP Brightness Temperature Difference fields (10.8 µm – 3.74 µm) and Day Night band visible imagery (0.70 µm) at 0735 UTC on 17 Feburary 2016 (Click to enlarge)

Widespread Fog over the central United States

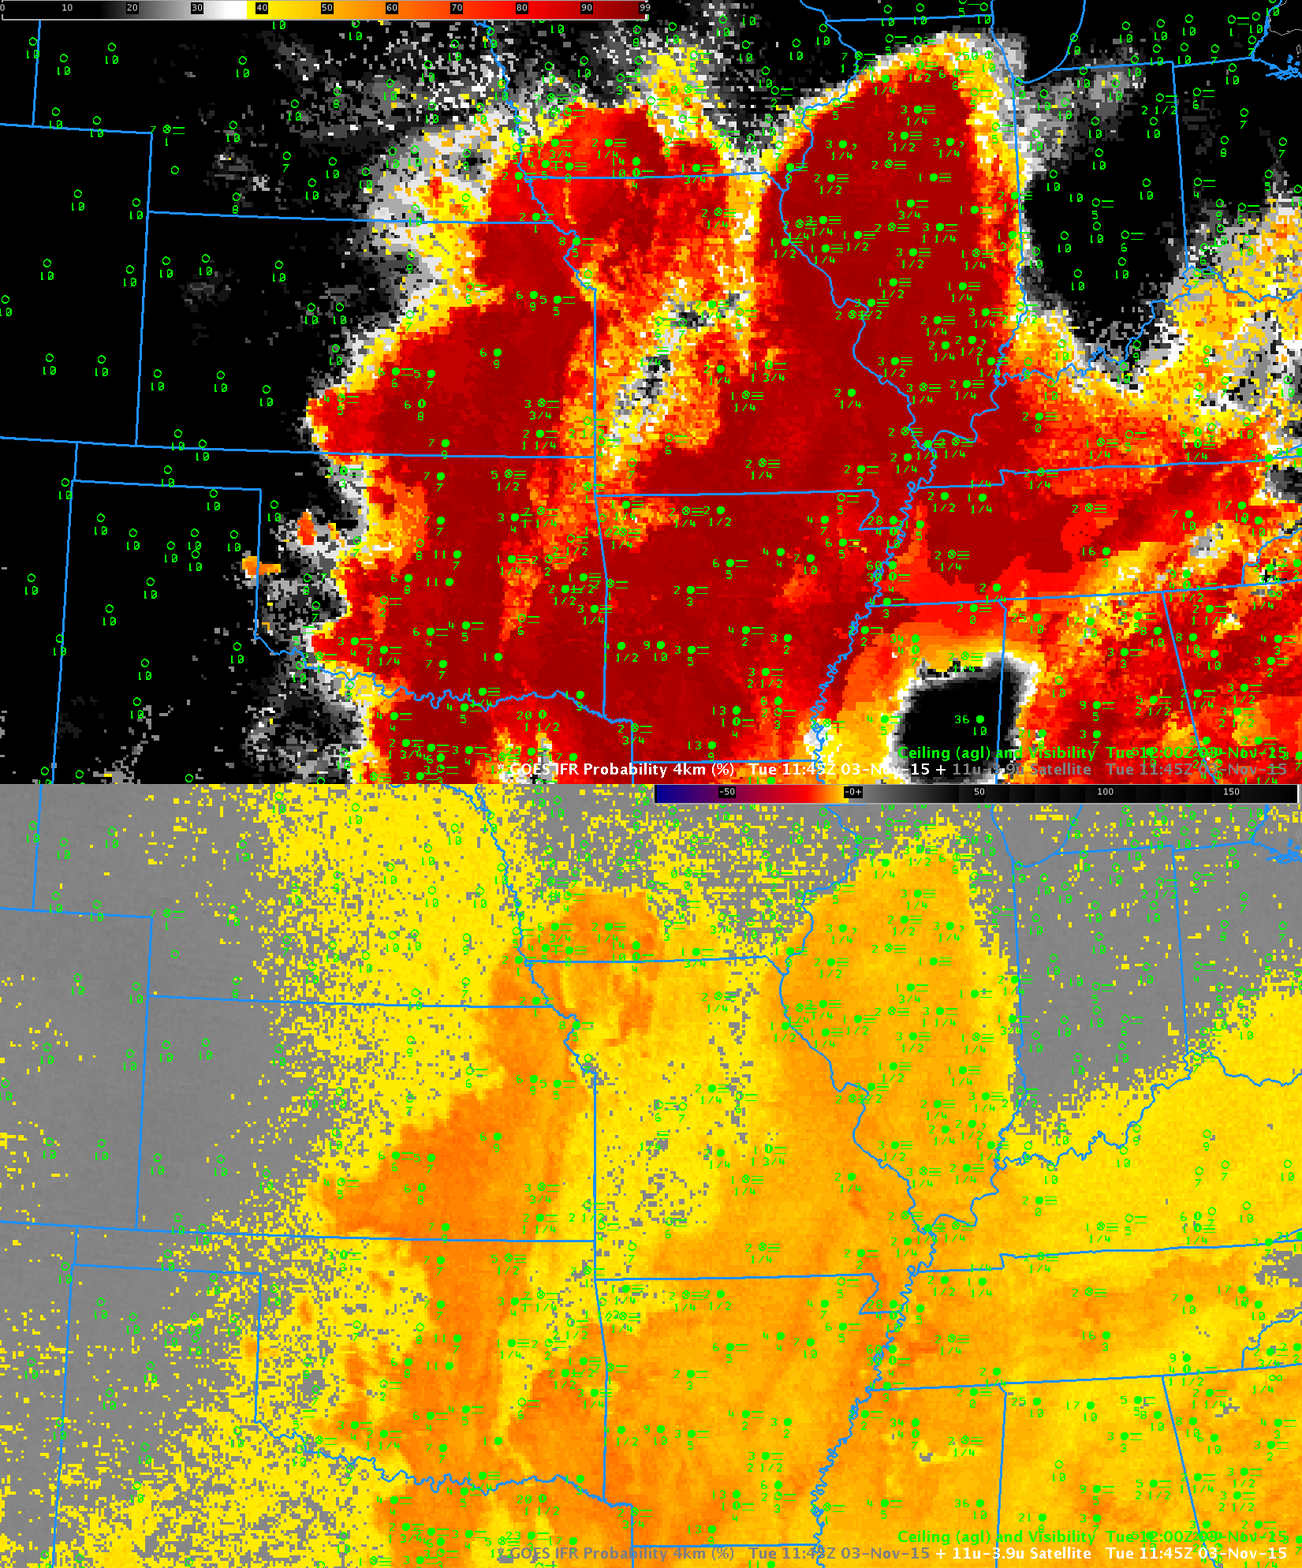
IFR_BTD_1145UTC_3NOV2015toggle

GOES-R IFR Probability Field and GOES-13 Brightness Temperature Difference (10.7µm – 3.9µm) at 1145 UTC on 3 November 2015. Surface-based observations of ceilings and visibilities are plotted (Click to enlarge)

Fog was widespread over the central United States on the morning of 3 November, and Dense Fog Advisories were commonplace. The toggle above compares the Brightness Temperature Difference field (10.7 µm – 3.9 µm) with the GOES-R IFR Probability field at 1145 UTC on 3 November.  (This toggle is much faster)  IFR Probabilities use near-surface information in the Rapid Refresh Model to screen out regions where Brightness Temperature Difference signals are showing elevated stratus rather than fog  (For example, the region around Columbus MS).  IFR Probabilities are also low in regions with a modest brightness temperature difference return (most of eastern Nebraska, west Texas, southern Indiana along the Ohio River);  these regions do not include stations observing IFR Conditions.

Fog over South Georgia

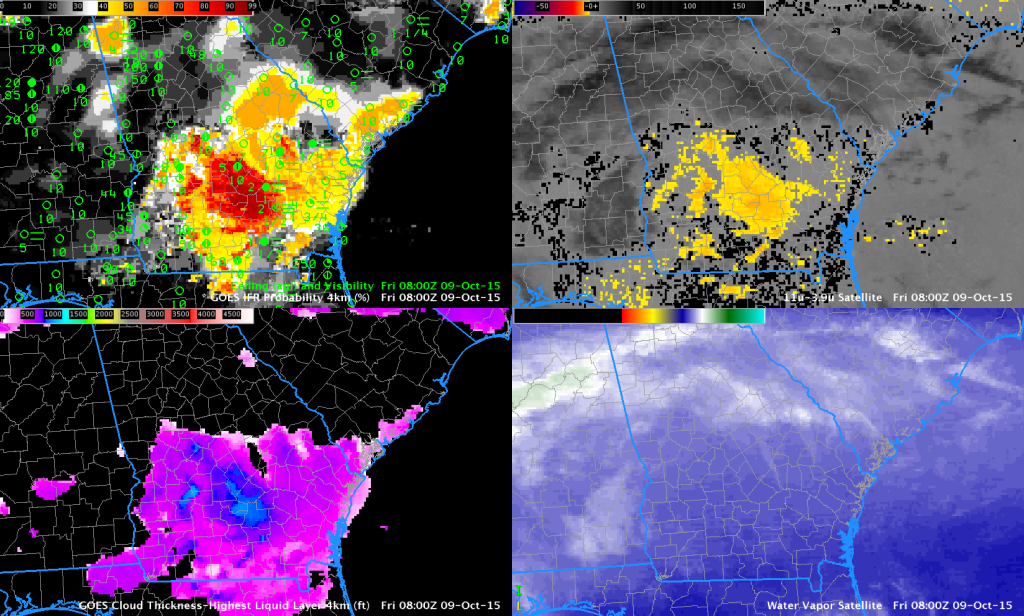
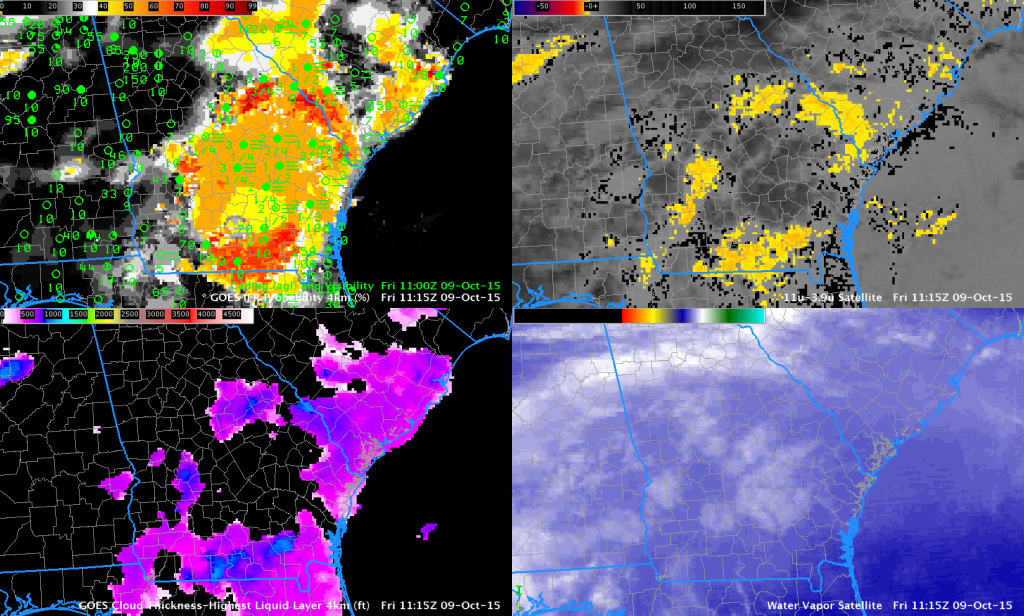
GOES_R_IFR_4Panel_1115_09Oct2015

GOES-R IFR Probability fields (Upper left), GOES-13 Brightness Temperature Difference (10.7 µm – 3.9 µm) Fields (Upper Right), GOES-R Cloud Thickness (Lower Left), GOES-13 Infrared Water Vapor (6.5 µm) Imagery (Lower Right), all at 1115 UTC 9 October 2015

Dense fog formed over south Georgia early in the morning of 9 October 2015 (National Weather Service Homepage in Peachtree City). The imagery above, from 1115 UTC, demonstrates a strength of the GOES-R IFR Probability field: it maintains a signal where dense fog is ongoing even as high clouds overspread the region. At 0800 UTC on 9 October (below), high clouds had not yet overspread south Georgia, and the image below shows that both IFR Probabilities and Brightness Temperatuere Difference fields outline the region of developing fog. When high clouds appear (as in the image above), the Brightness Temperature Difference signal that can be used in clear skies loses its utility in fog detection.

GOES_R_IFR_4Panel_0800_09Oct2015

As above, but at 0800 UTC 9 October 2015

IFR Probabilities when thick clouds are present

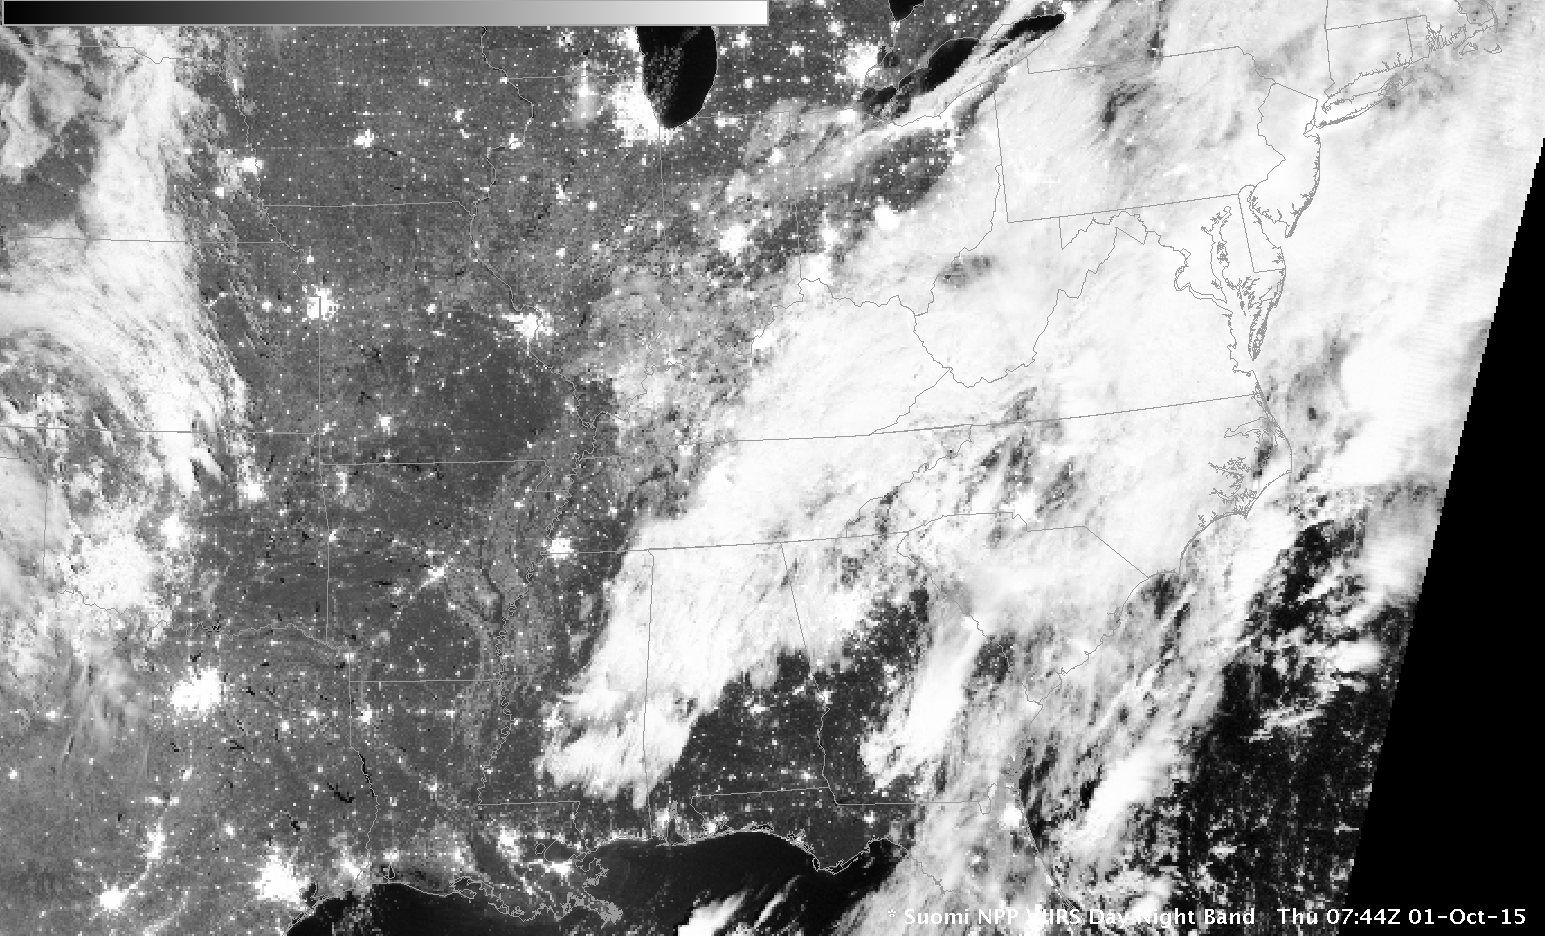
SNPP_DNB_0744UTC_01Oct2015

Suomi NPP Day Night Visible (0.70 µm) Image, 0744 UTC on 1 October 2015 (Click to enlarge)

When thick clouds are present, as along the East Coast of the United States early on 1 October 2015, as depicted by the Suomi NPP Day Night band (0.70 µm) image above, satellite detection of low clouds is problematic. This is why GOES-R IFR Probability fields incorporate information from model data so that useful guidance can be produced on whether IFR Conditions exist.

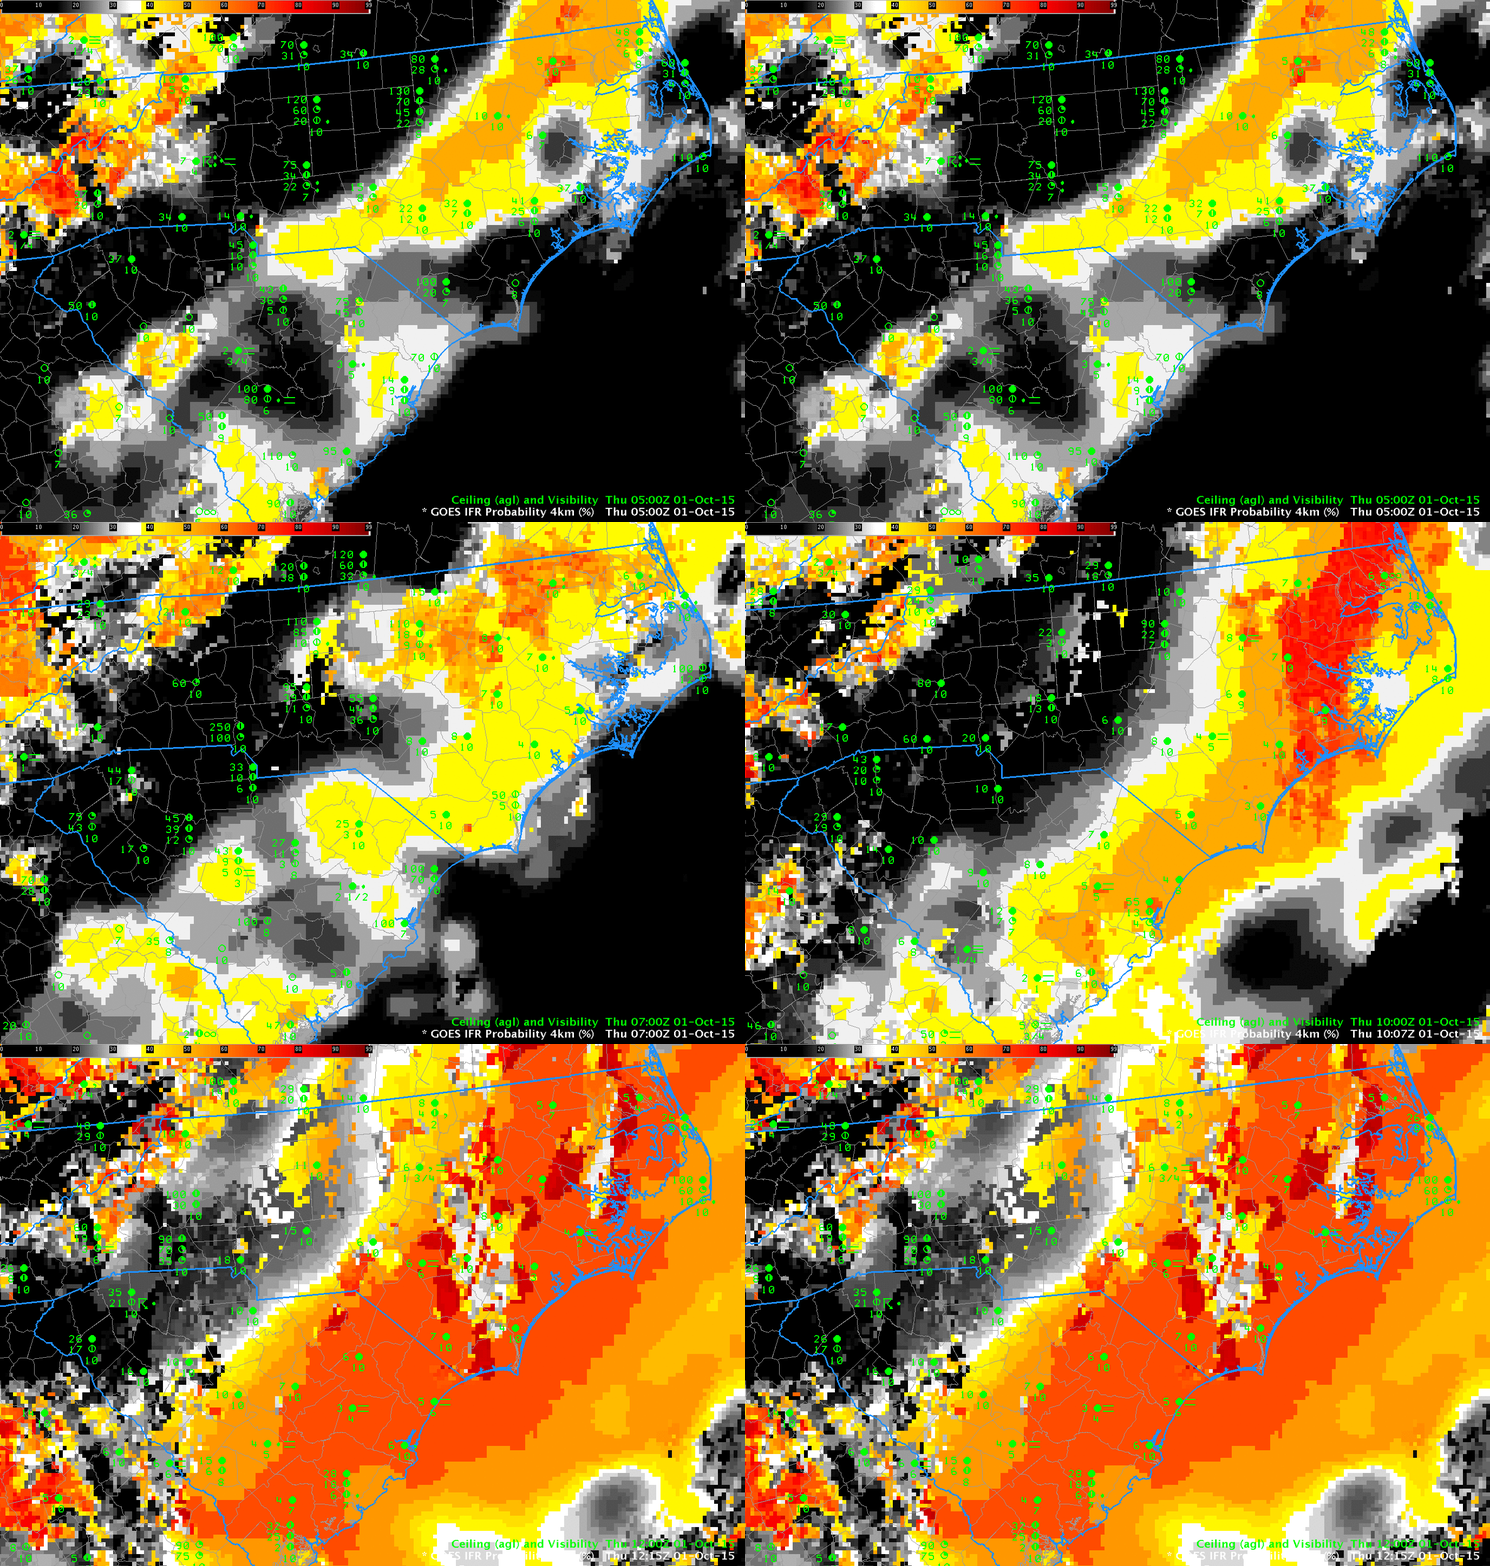
IFR Probabilities increase slowly over coastal South and North Carolina after midnight on 1 October — and the fields do a good job of outlining where IFR Conditions are occurring. In most locations, at most times, the fields are not pixelated. The smooth nature arises when model fields (which are relatively smooth) are used (and satellite data that are more pixelated are not used) to generate the IFR Probability Fields. Some holes in the extensive cloud cover occur over North Carolina during the animation: the IFR Probability field takes on a more pixelated appearance when that happens — and the Probability value increases when satellite data can also be used as a Predictor.

IFRProb_01October2015anim_05-12

GOES-R IFR Probability fields created with GOES-13 Imager and Rapid Refresh model Data, 0500-1215 UTC on 1 October 2015 (Click to enlarge)

The GOES-R IFR Probability field at 1145 UTC includes a north-south oriented artifact. To the east of the obvious line, day-time predictors are used in the GOES-R IFR Probability computation; to the west, night-time predictors are used. One of the daytime predictors is Visible Imagery that is used to cloud-clear more accurately. The IFR Probability where daytime predictors are used is larger because there is more confidence that a cloud does exist.

Dense Fog over the Deep South

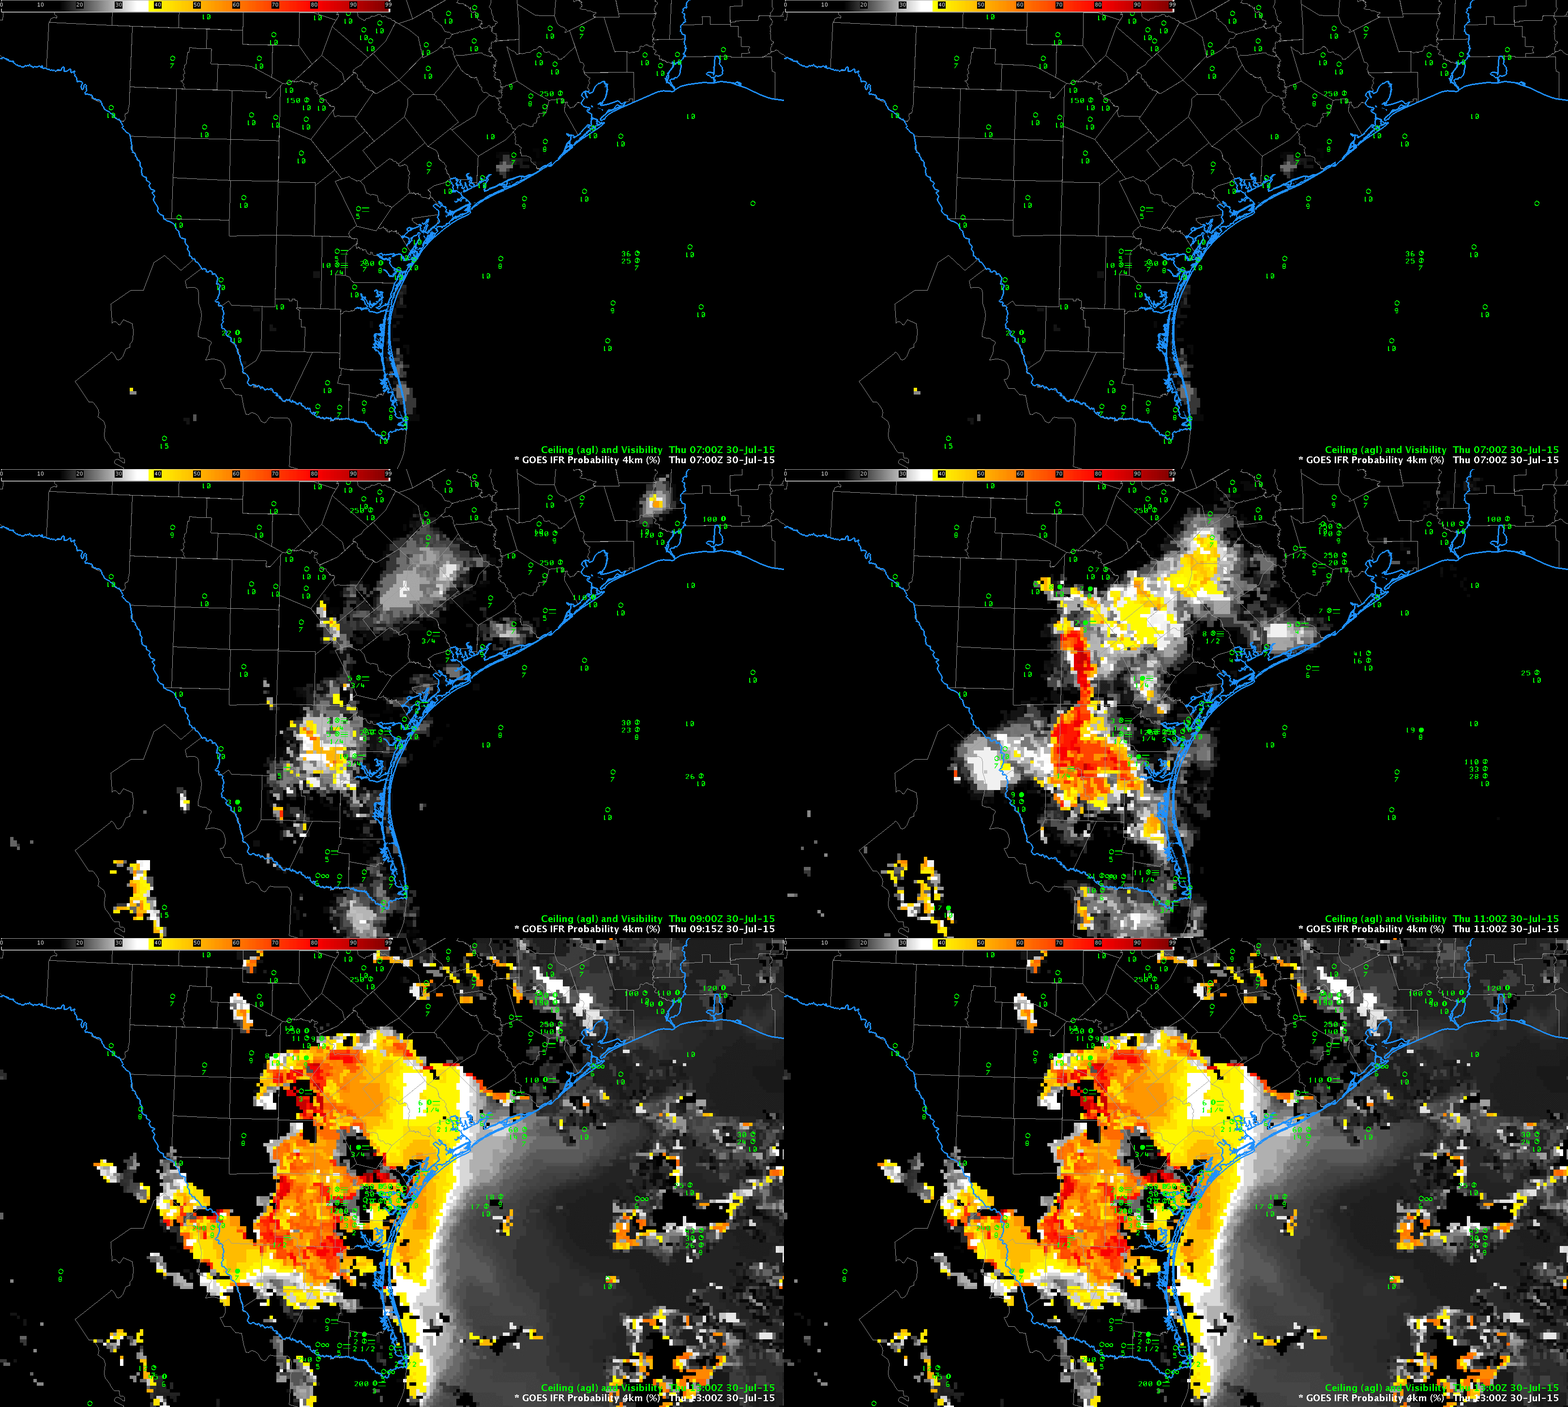
TEXAS_GOESIFR_0700_1300_30July2015anim

GOES-R IFR Probability Fields, hourly from 0700 through 1300 UTC, 30 July 2015 (Click to enlarge)

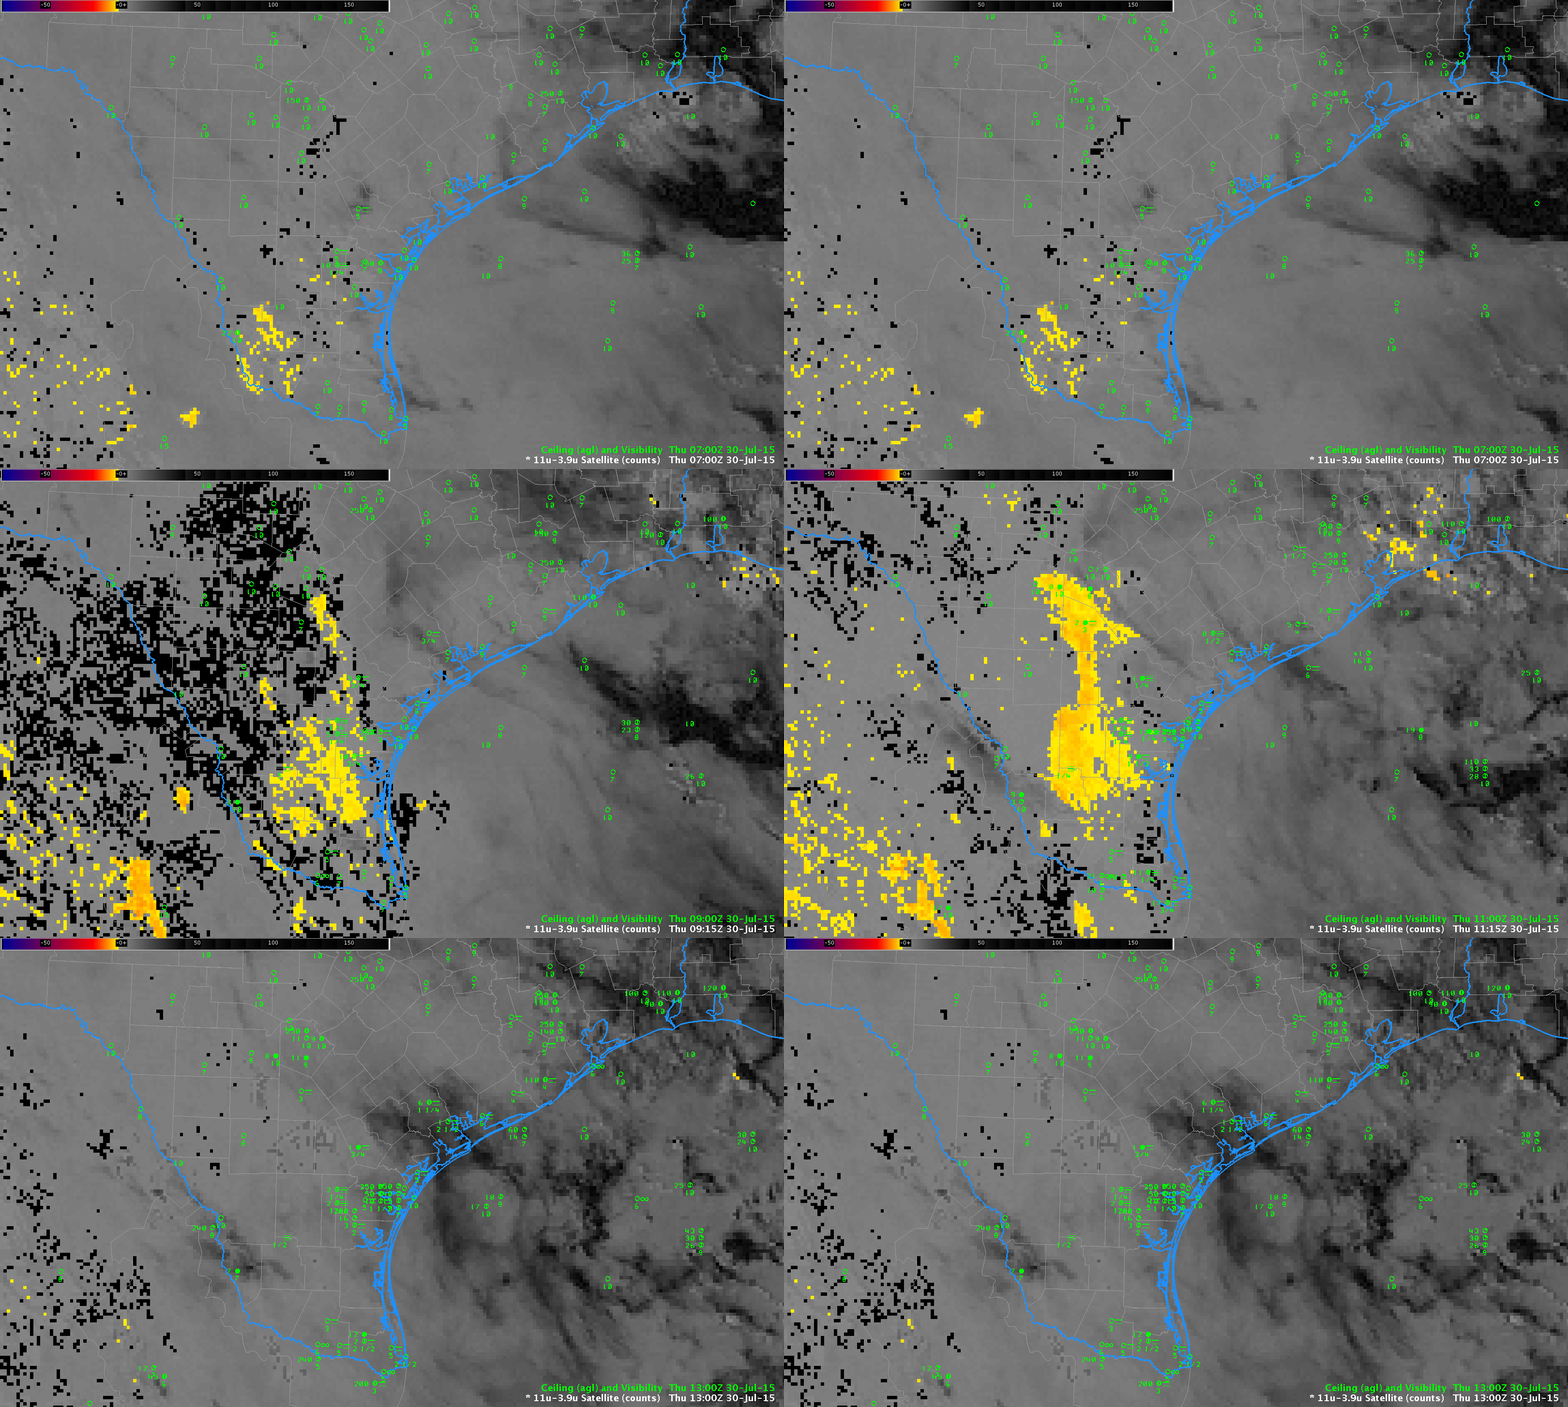
Dense Fog Advisories were issued over inland south Texas on the morning of Thursday 30 July (below). GOES-R IFR Probabilities of this event, above, capture the development of IFR conditions after 0700 UTC (2 AM CDT). Values are quite small until about 0900 UTC, as IFR conditions develop around Alice, TX and Orange Grove Naval Air Station (in Jim Wells County) and then expand. Comparing the GOES-R IFR Probability fields, above, and the GOES-13 Brightness Temperature Difference fields, below, suggest that the model component in the IFR Probability fields showed low-level saturation occurring a bit farther north than the initial strongest pixel returns in the Brightness Temperature Difference fields. For example, compare this toggle of GOES-R IFR Probability and GOES-13 Brightness Temperature Difference fields at 0800 UTC: Larger values of GOES-R IFR Probability (albeit still small — around 20%) are shifted north of the strongest enhancements in the 0800 Brightness Temperature Difference fields, which stronger enhancements are mostly near the Rio Grande). The toggle for 1000 UTC is here.
TEXAS_GOESBTD_0700_1300_30July2015anim

GOES-13 Brightness Temperature Difference (10.7µm – 3.9µm) Fields, hourly from 0700 through 1300 UTC, 30 July 2015 (Click to enlarge)

URGENT – WEATHER MESSAGE
NATIONAL WEATHER SERVICE BROWNSVILLE TX
612 AM CDT THU JUL 30 2015

…AREAS OF DENSE FOG CONTINUE TO DEVELOP ACROSS NORTHERN
RANCHLANDS THIS MORNING…

.CLEAR SKIES AND CALM WINDS CONTINUE TO ALLOW AREAS OF DENSE FOG
TO DEVELOP ACROSS NORTHERN PORTIONS OF DEEP SOUTH TEXAS THIS
MORNING. VISIBILITIES WILL BE REDUCED TO A QUARTER OF A MILE IN
AREAS OF DENSE FOG.

TXZ249-250-301400-
/O.NEW.KBRO.FG.Y.0016.150730T1112Z-150730T1400Z/
JIM HOGG-BROOKS-
INCLUDING THE CITIES OF…HEBBRONVILLE…FALFURRIAS
612 AM CDT THU JUL 30 2015

…DENSE FOG ADVISORY IN EFFECT UNTIL 9 AM CDT THIS MORNING…

THE NATIONAL WEATHER SERVICE IN BROWNSVILLE HAS ISSUED A DENSE
FOG ADVISORY…WHICH IS IN EFFECT UNTIL 9 AM CDT THIS MORNING.

* VISIBILITY…VISIBILITIES WILL BE REDUCED TO A QUARTER OF A
MILE.

* IMPACTS…DRIVING WILL BE DIFFICULT ON STREETS AND ROADS
ESPECIALLY IN RURAL AREAS.

PRECAUTIONARY/PREPAREDNESS ACTIONS…

MOTORISTS SHOULD SLOW DOWN…USE LOW BEAM HEADLIGHTS…AND
MAINTAIN A SAFE DISTANCE BETWEEN VEHICLES.

&&

$$

CASTILLO

URGENT – WEATHER MESSAGE
NATIONAL WEATHER SERVICE CORPUS CHRISTI TX
757 AM CDT THU JUL 30 2015

…DENSE FOG THIS MORNING OVER EASTERN PORTIONS OF THE RIO GRANDE
PLAINS…

.THE COMBINATION OF NEAR SURFACE MOISTURE…DRY AIR ALOFT…AND
LIGHT WIND…HAS RESULTED IN AREAS OF DENSE FOG OVER THE SOUTHERN
COASTAL BEND AND OVER EASTERN PORTIONS OF THE RIO GRANDE PLAINS
EARLY THIS MORNING. HOWEVER…CONDITIONS WILL IMPROVE BY MID
MORNING AS TEMPERATURES INCREASE SUFFICIENT TO RESULT IN
UNSATURATED CONDITIONS NEAR THE SURFACE.

TXZ230>232-240-241-301500-
/O.EXT.KCRP.FG.Y.0018.000000T0000Z-150730T1500Z/
MCMULLEN-LIVE OAK-BEE-DUVAL-JIM WELLS-
INCLUDING THE CITIES OF…CALLIHAM…CROSS…LOMA ALTA…TILDEN…
GEORGE WEST…THREE RIVERS…BEEVILLE…FREER…BENAVIDES…
SAN DIEGO…ALICE…ORANGE GROVE
757 AM CDT THU JUL 30 2015

…DENSE FOG ADVISORY NOW IN EFFECT UNTIL 10 AM CDT THIS
MORNING…

* VISIBILITY…ONE-QUARTER MILE OR LESS

* IMPACTS…DENSE FOG WILL RENDER DRIVING HAZARDOUS.

PRECAUTIONARY/PREPAREDNESS ACTIONS…

A DENSE FOG ADVISORY MEANS VISIBILITIES WILL FREQUENTLY BE
REDUCED TO LESS THAN ONE QUARTER MILE. IF DRIVING…SLOW DOWN…
USE LOW-BEAM HEADLIGHTS…AND LEAVE PLENTY OF DISTANCE AHEAD OF
YOU.

&&

$$

PZ

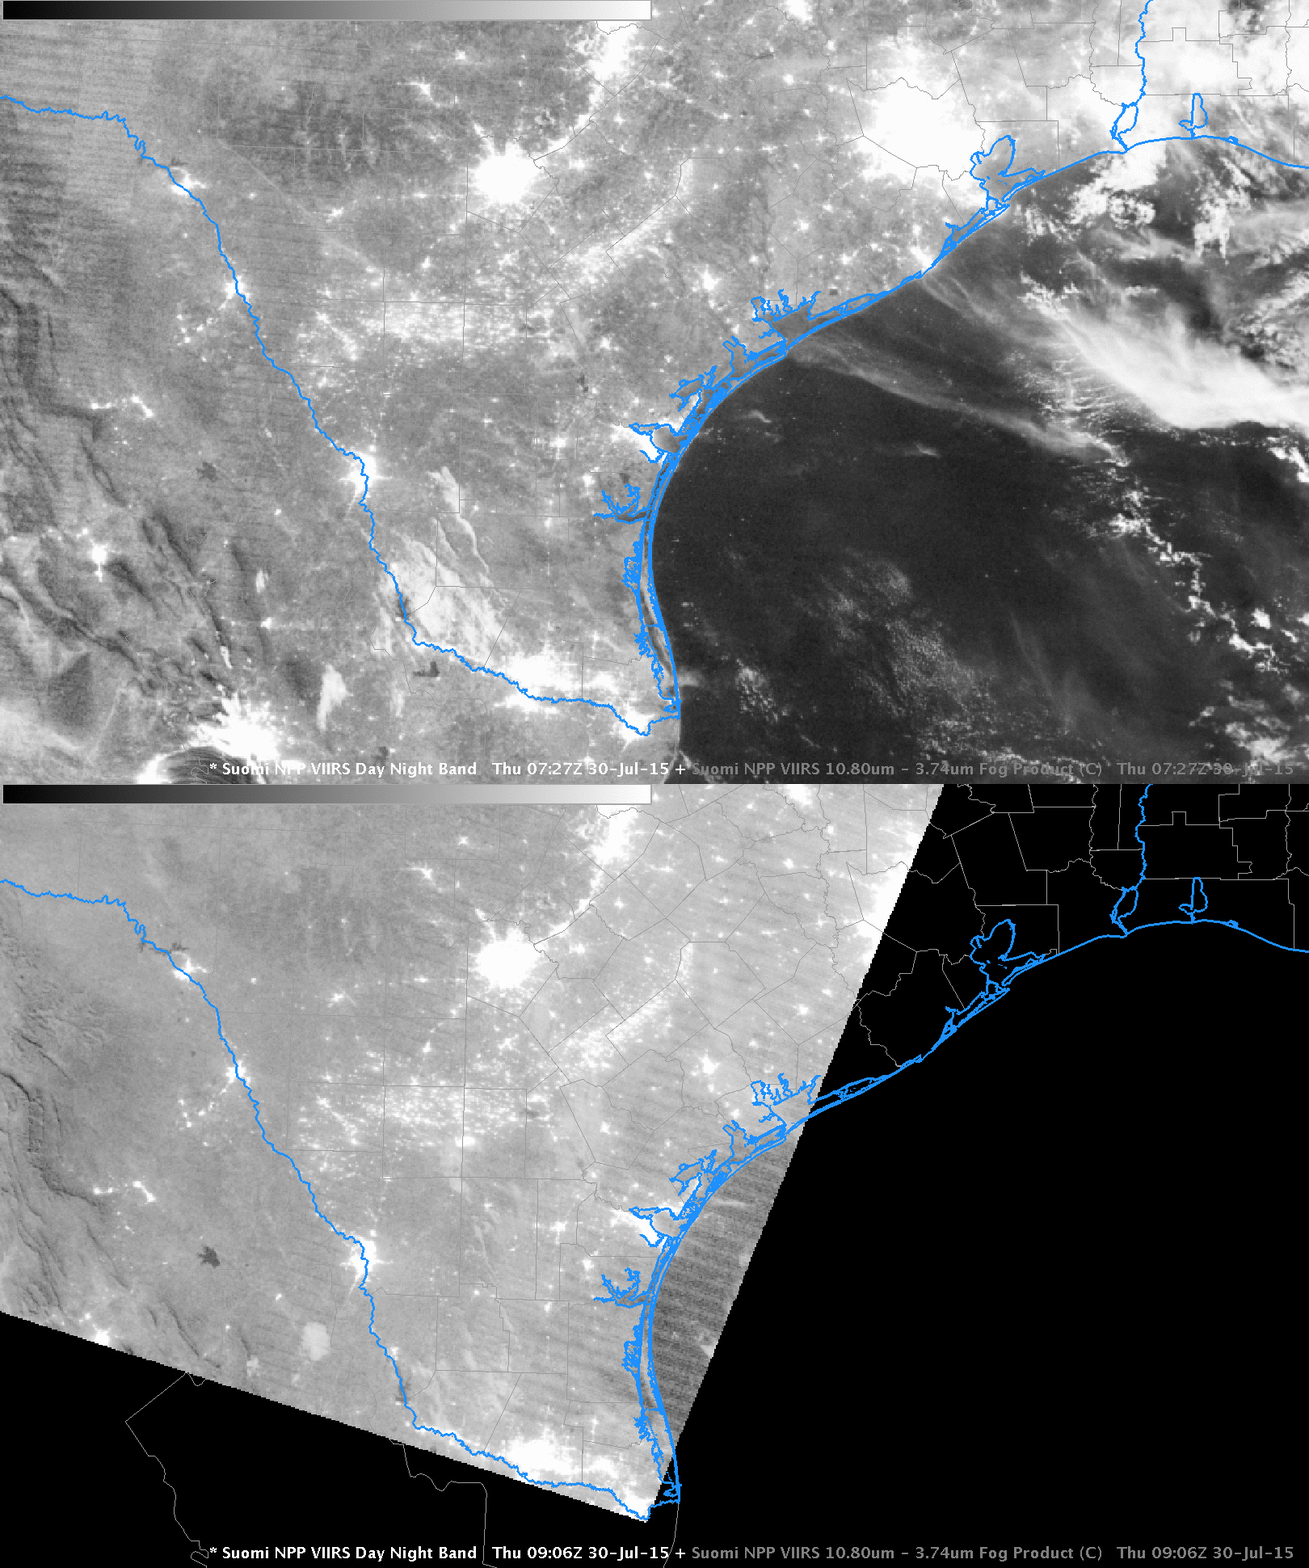
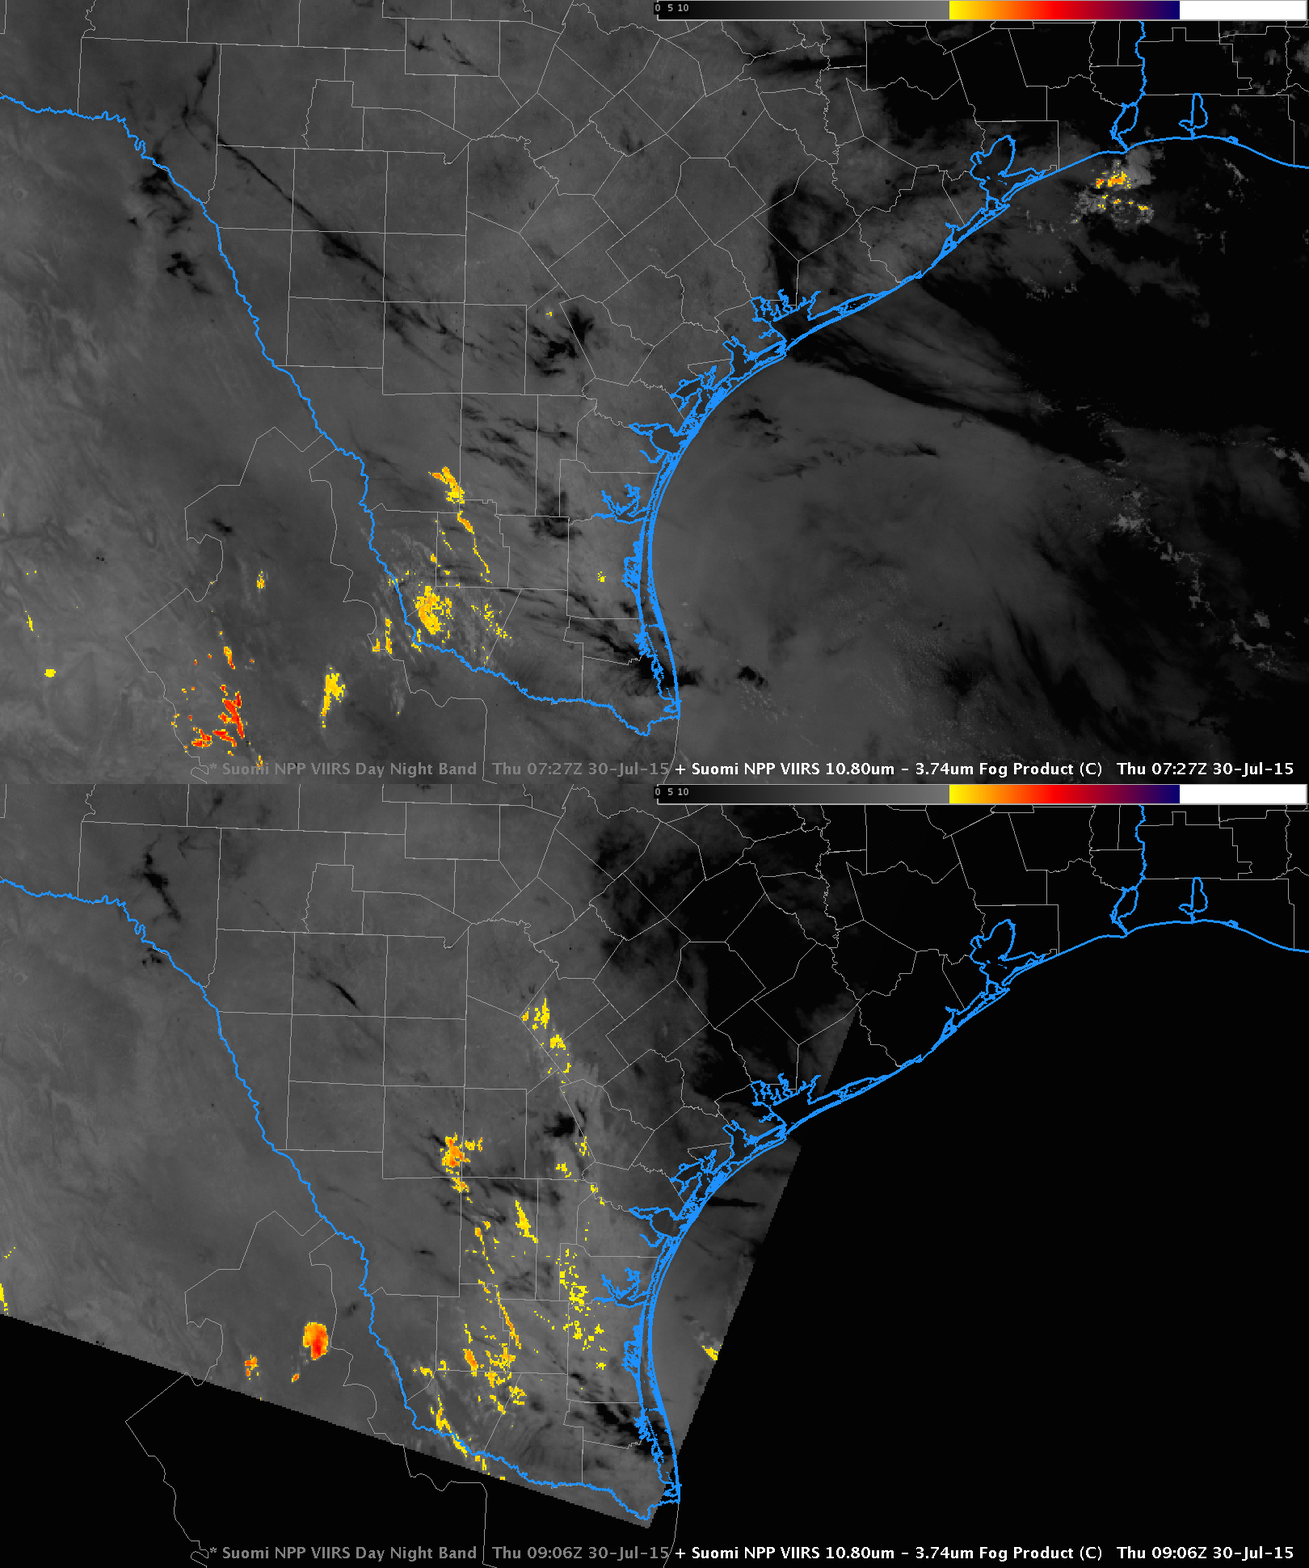
South Texas had favorable geometry today that allowed for successive Suomi NPP overpasses to provide information. The Day Night Band imagery, below, and the Brightness Temperature Difference fields, below the Day Night Band, suggest few clouds are detected at 0727 UTC or at 0906 UTC.
SNPP_DNB_0727_0906_30July2015toggle

Suomi NPP VIIRS Day Night Band Visible Imagery (0.70µm) at 0727 and 0906 UTC 30 July 2015 (Click to enlarge)
SNPP_BTD_0727_0906_30July2015toggle

Suomi NPP VIIRS Brightness Temperature Difference (11.45µm – 3.74µm) fields at 0727 and 0906 UTC 30 July 2015 (Click to enlarge)


=============================================================================
FLA_GOESIFR_0700_1300_30July2015anim

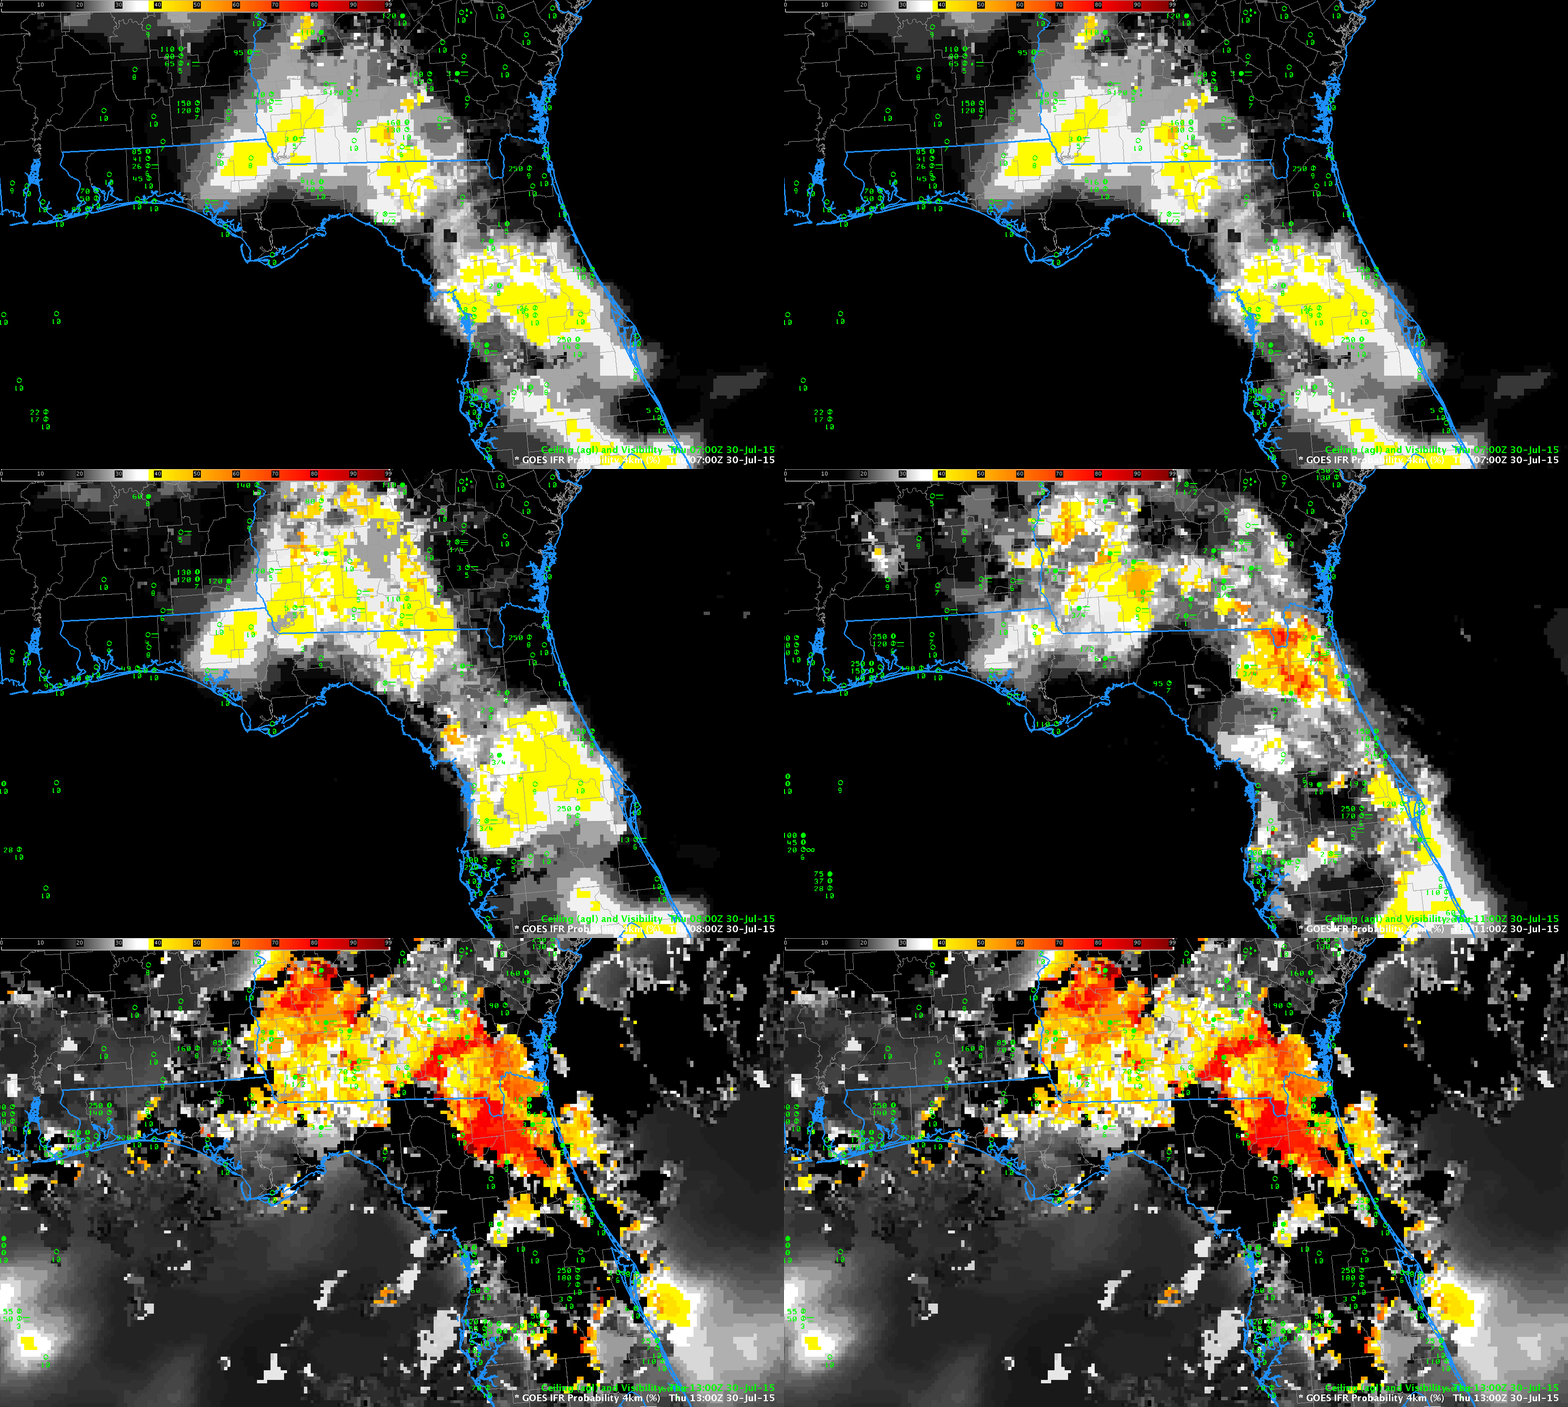
GOES-R IFR Probability Fields, hourly from 0700 through 1300 UTC, 30 July 2015 (Click to enlarge)

Northeast Florida also had reduced ceilings and visibilities on the morning of 30 July 2015. The animation above of GOES-R IFR Probabilities from 0700-1300 UTC (above) shows enhanced values in most of the inland northern Florida panhandle. The flat nature of the field suggests that higher clouds are preventing satellite detection of low clouds: predictors based on model fields only are being used to compute IFR Probabilities (that is, satellite predictors are not being used). The Brightness Temperature Difference animation for this event is below.
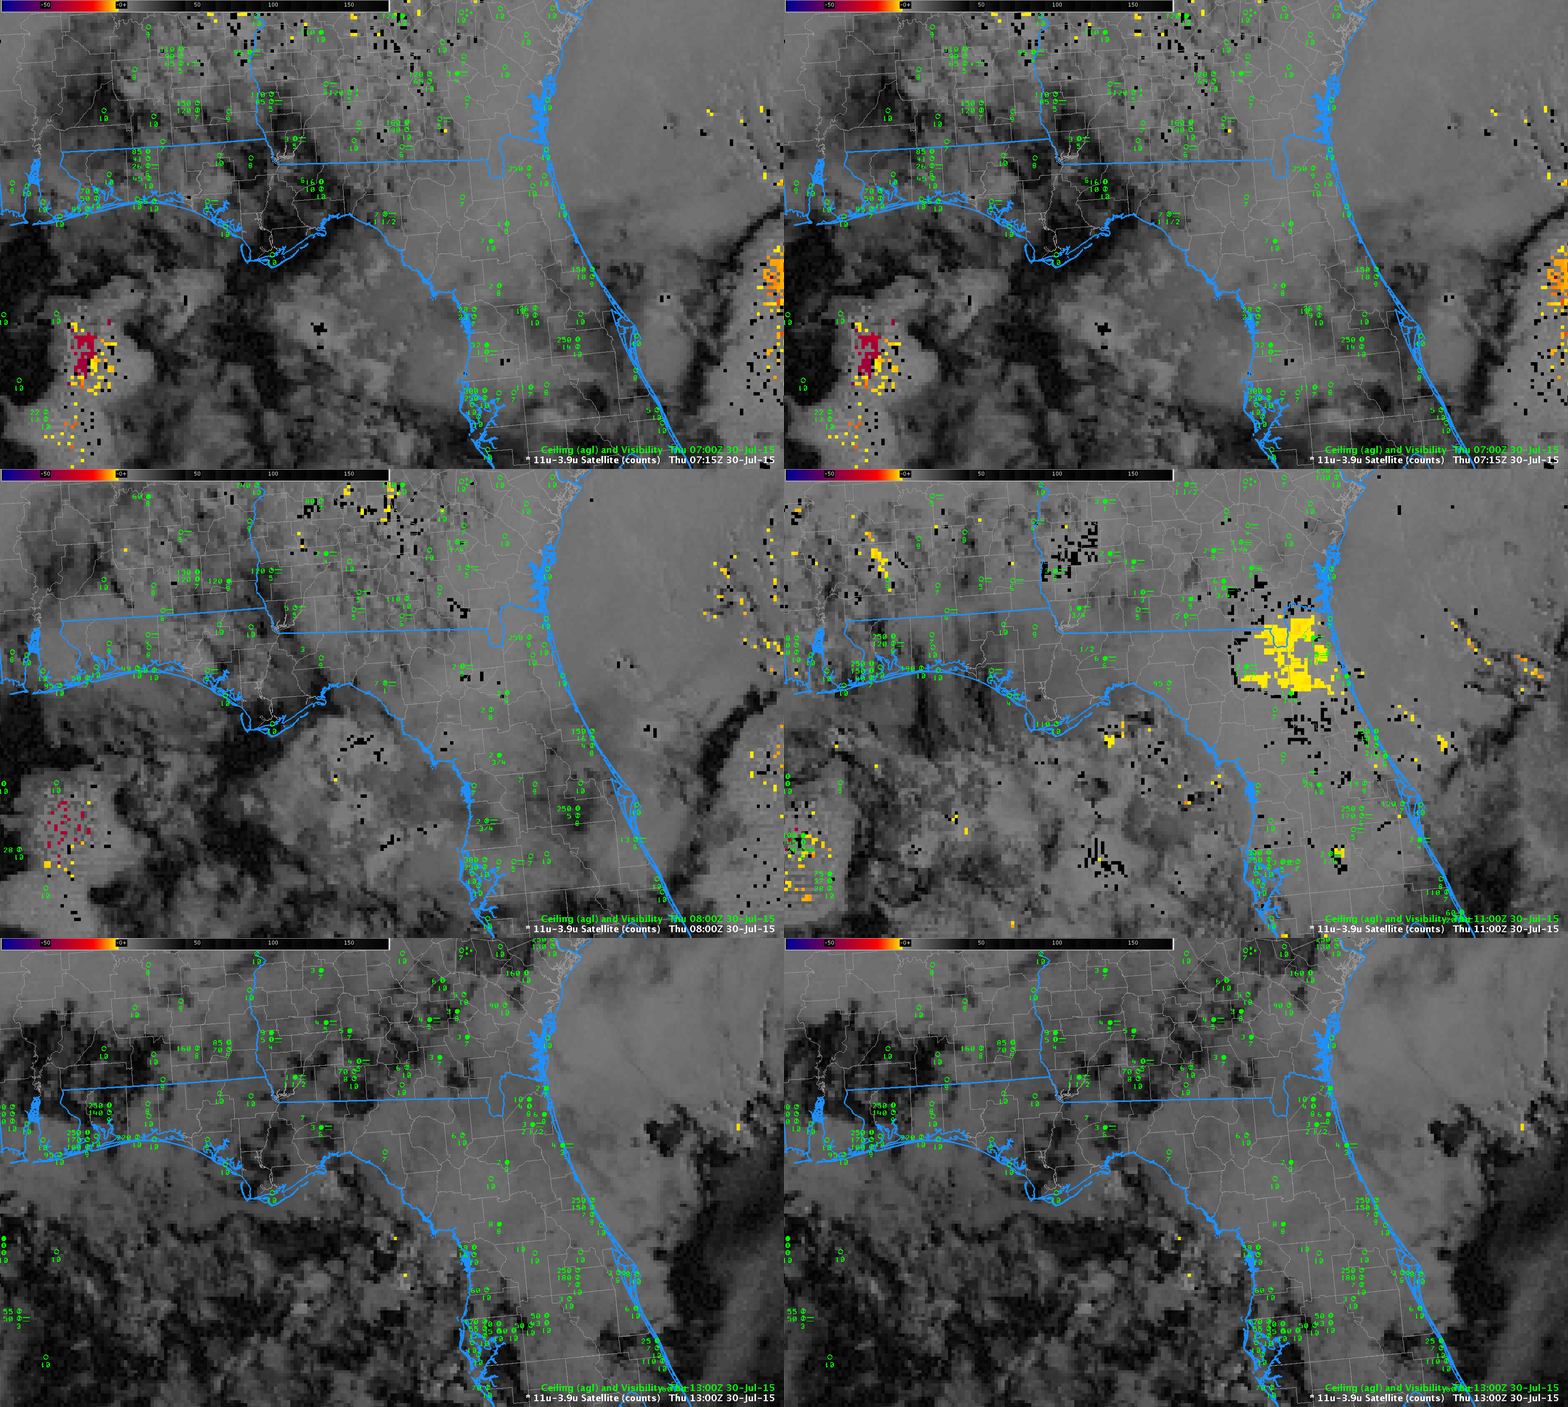
FLA_GOESBTD_0700_1300_30July2015anim

GOES-13 Brightness Temperature Difference (10.7µm – 3.9µm) Fields, hourly from 0700 through 1300 UTC, 30 July 2015 (Click to enlarge)
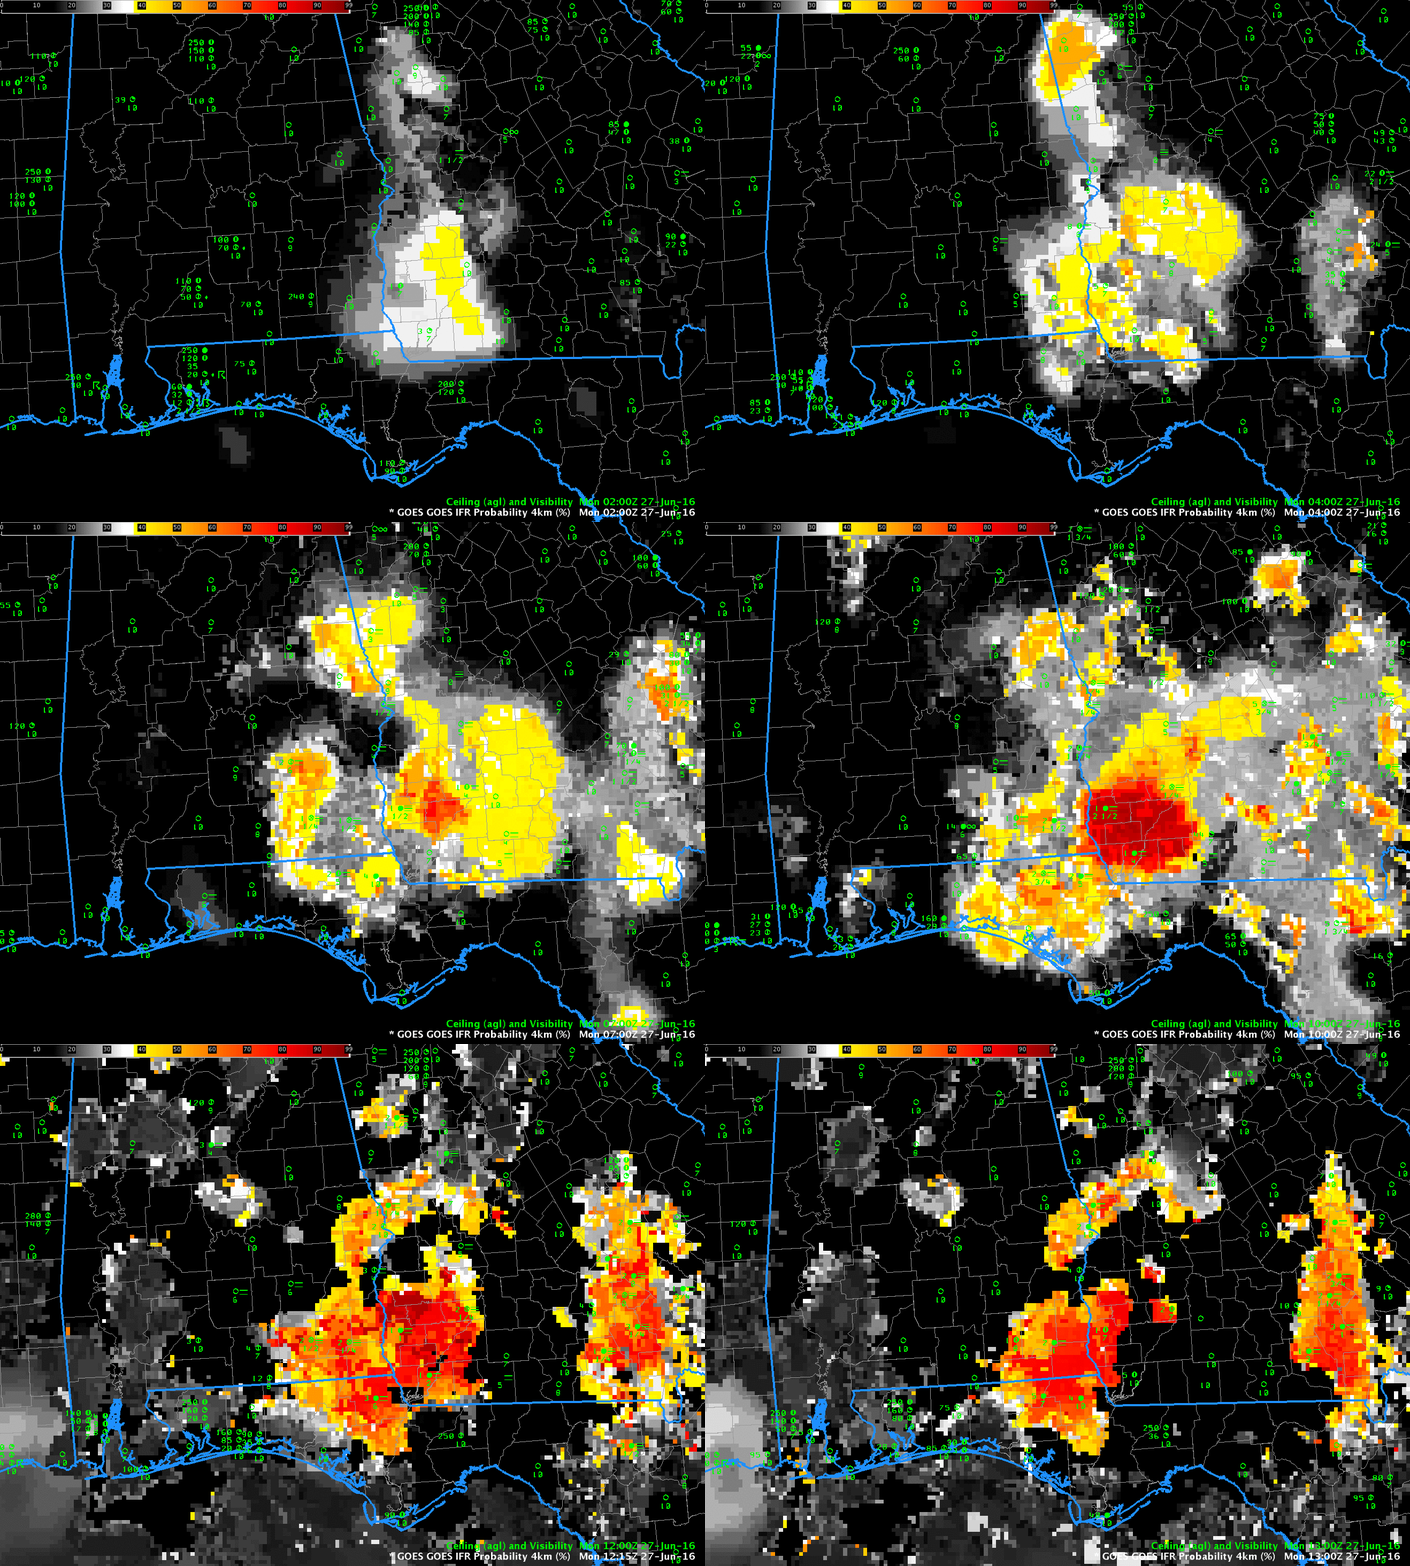
Post-thunderstorm Fog over Mississippi

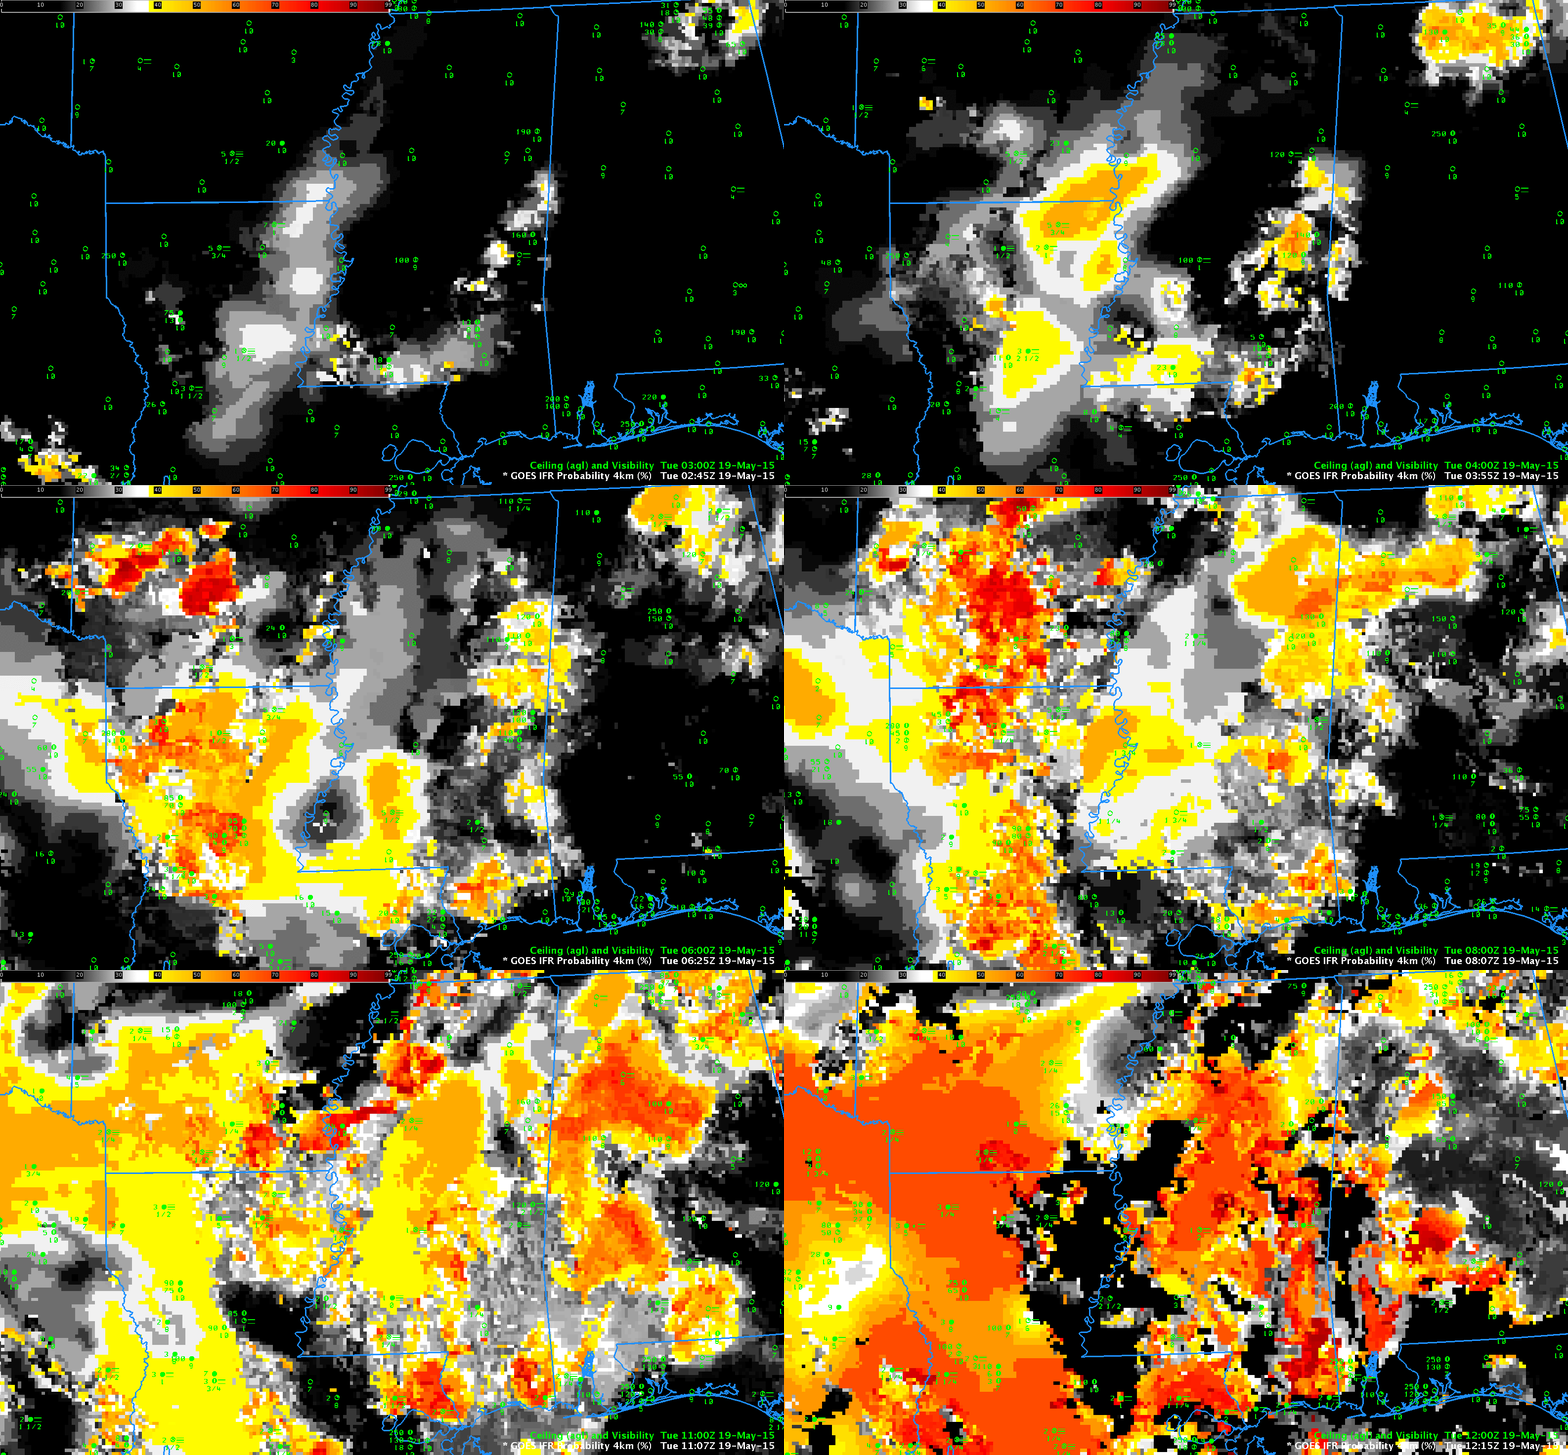
GOESR_IFR_19May2015anim

GOES-R IFR Probability Fields, ~hourly, from 0300 through 1200 UTC on 19 May 2015 (Click to enlarge)
Thunderstorms moved through Mississippi (See this animation — from this Blog Post — of SRSO-R 1-minute imagery from 18 May), and the low-level moisture left behind allowed Dense Fog to form, and Dense Fog advisories were issued.

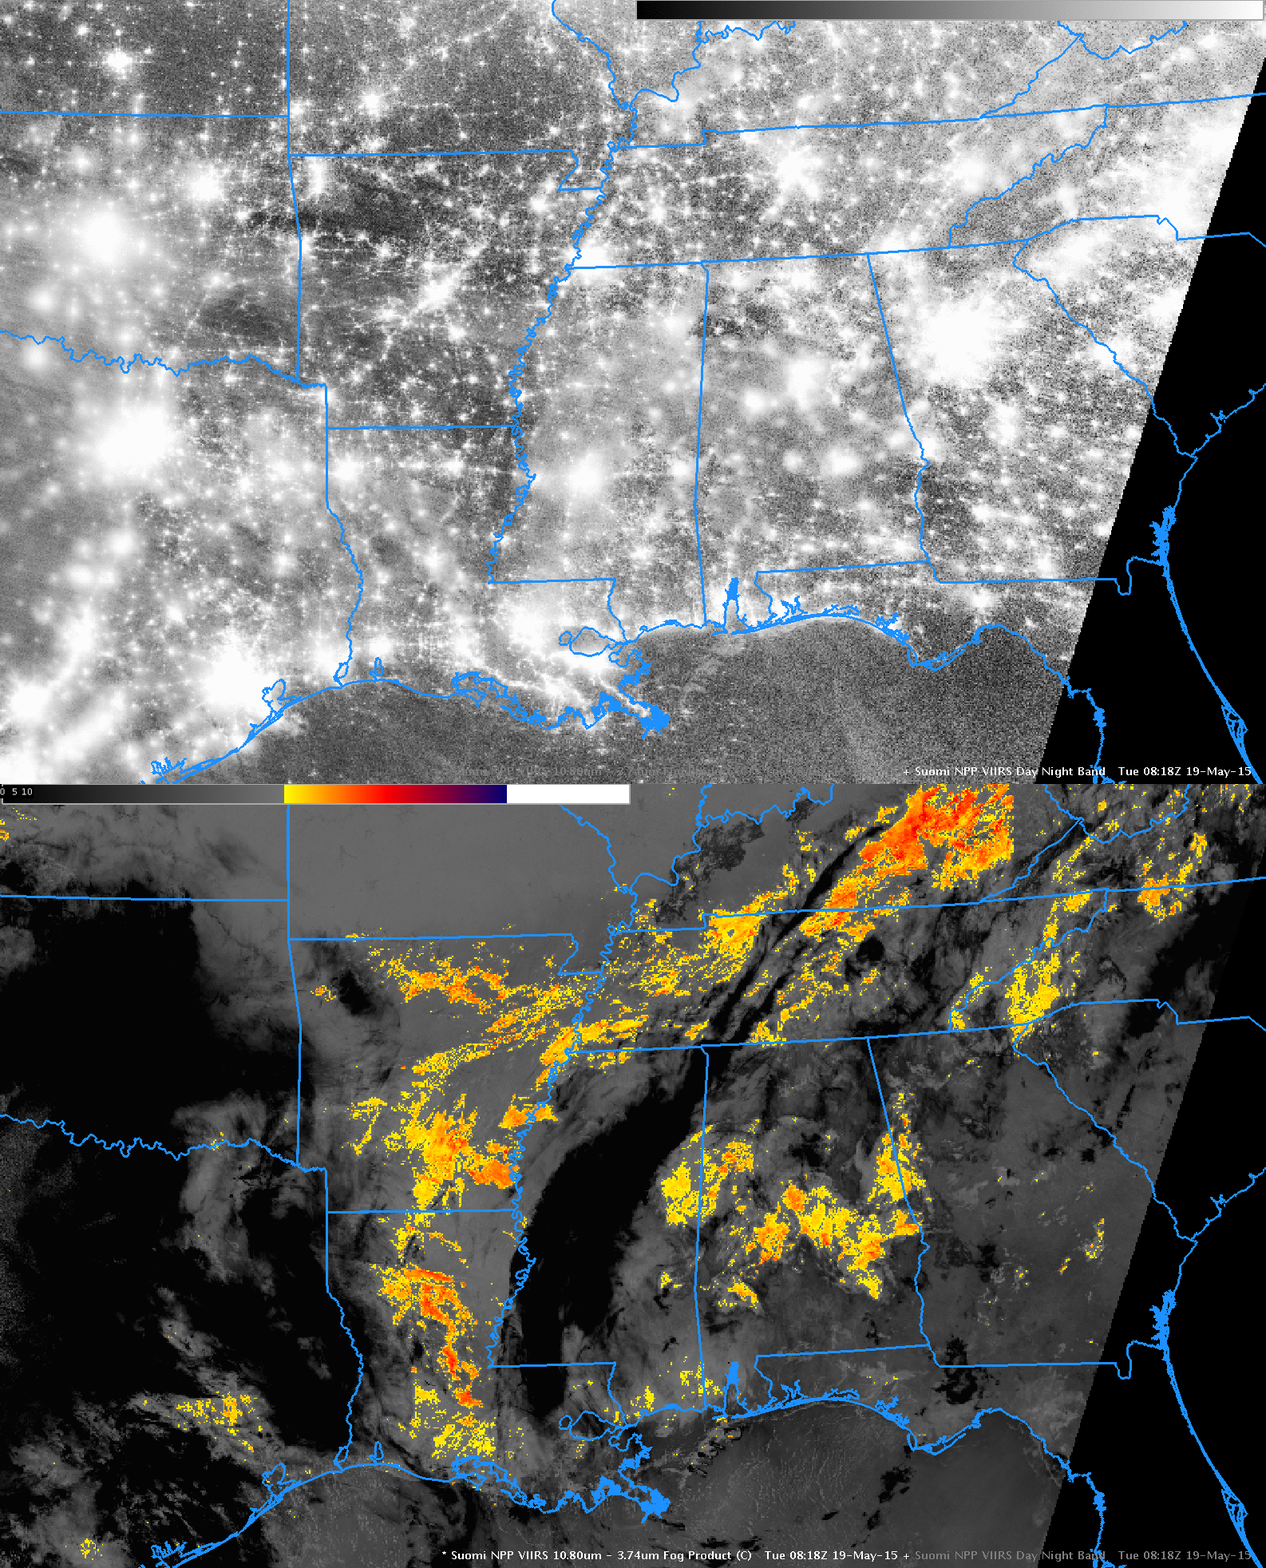
Multiple cloud decks — shown in the toggle, below, of Suomi NPP Day Night Band and Brightness Temperature Difference (11.45 µm – 3.74 µm) — prevented the traditional brightness temperature difference product from providing useful information. GOES-R IFR Probabilities, shown ~hourly in an animation above do highlight the region of developing IFR conditions. Low ceilings and reduced visibilities are commonplace in regions where IFR Probabilities are increasing over night. The predictors that are included to compute the IFR Probabilities are mostly model-based because of the multiple cloud layers that are present, and the IFR Probability field is somewhat flat as a result. Note that GOES-R IFR probabilities increase at the very end of the animation; when daytime predictors are used, probabilities are a bit higher than when nighttime predictors are used.

SNPP_BTD_DNB_0818_19May2015_toggle

Suomi NPP Day Night Band visible imagery and Brightness Temperature Difference (11.45 µm – 3.74 µm) at 0818 UTC, 19 May 2015 (Click to enlarge)
Fog in the Florida Panhandle

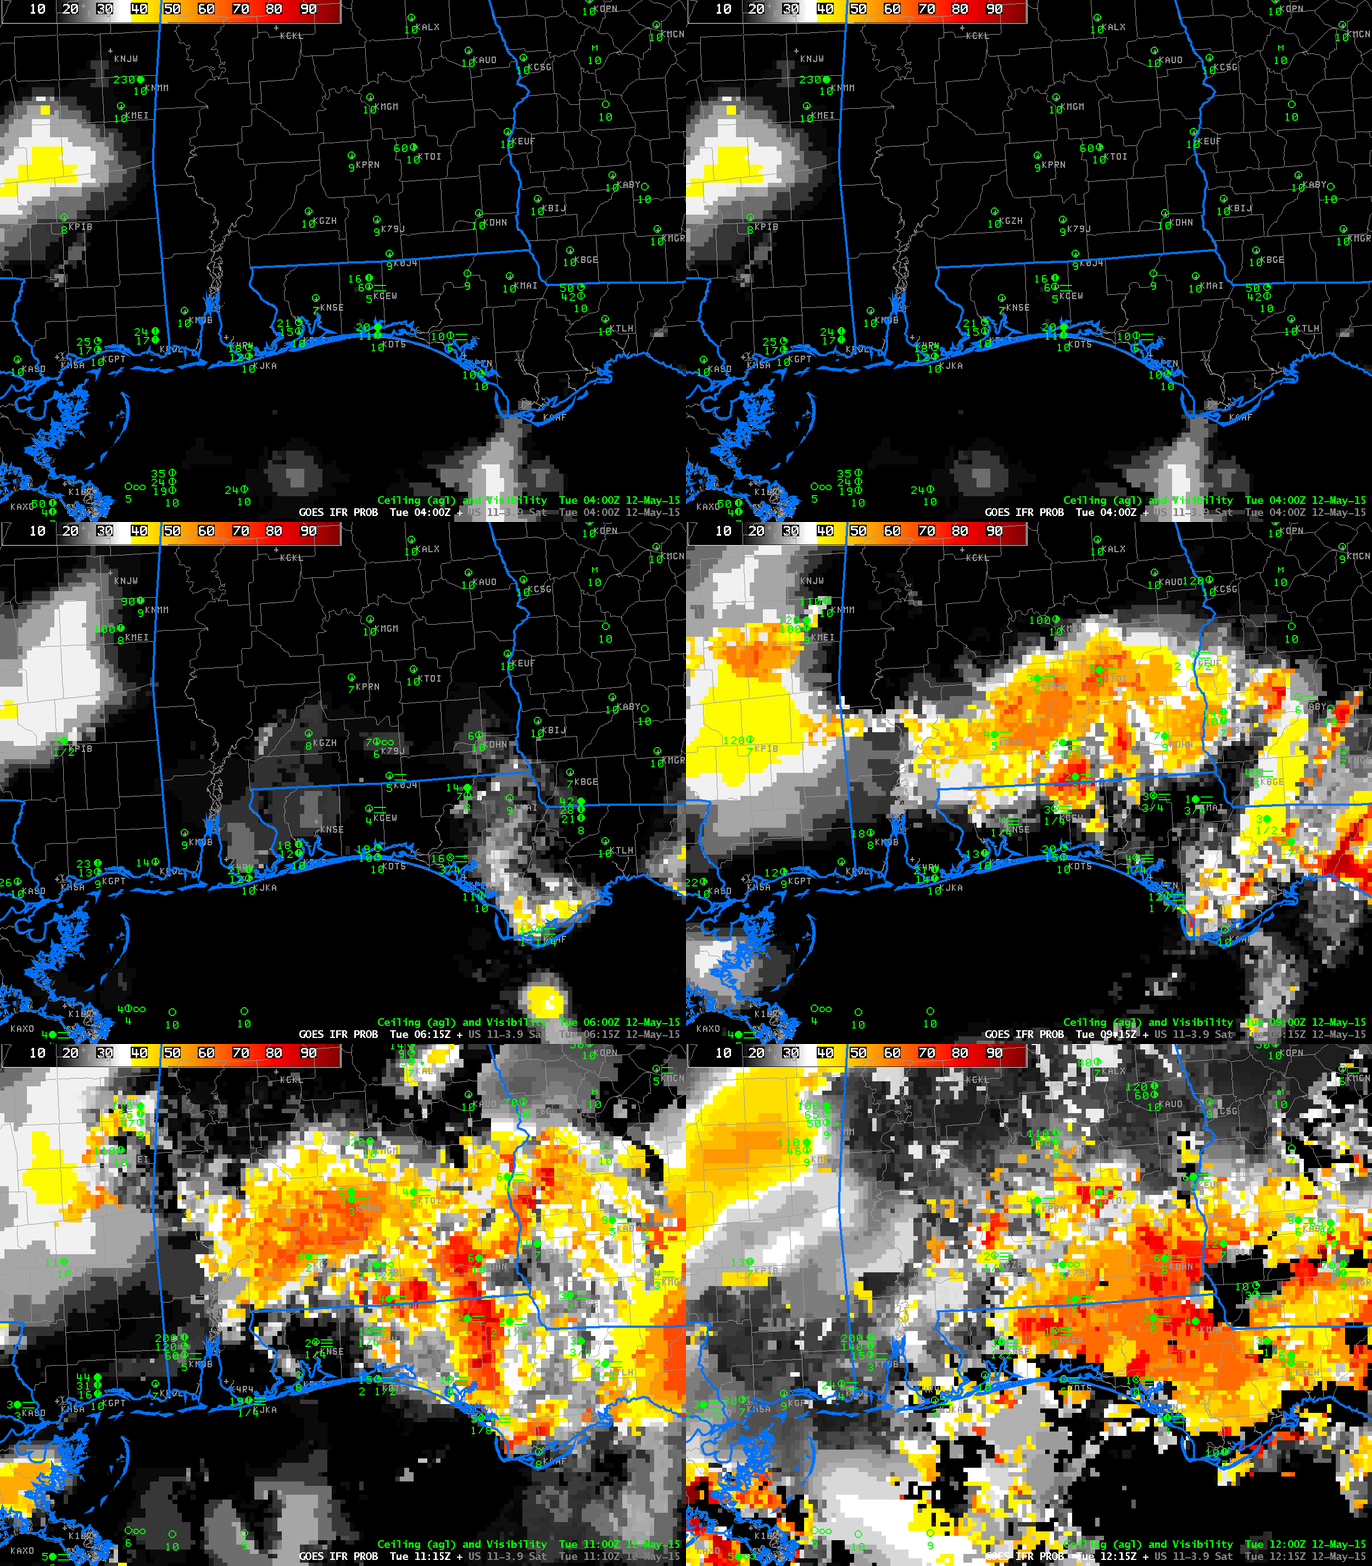
Dense Fog Advisories were issued for the northwestern part of the Florida Panhandle overnight (Link).  How did various fog-alert satellite products perform for this case?

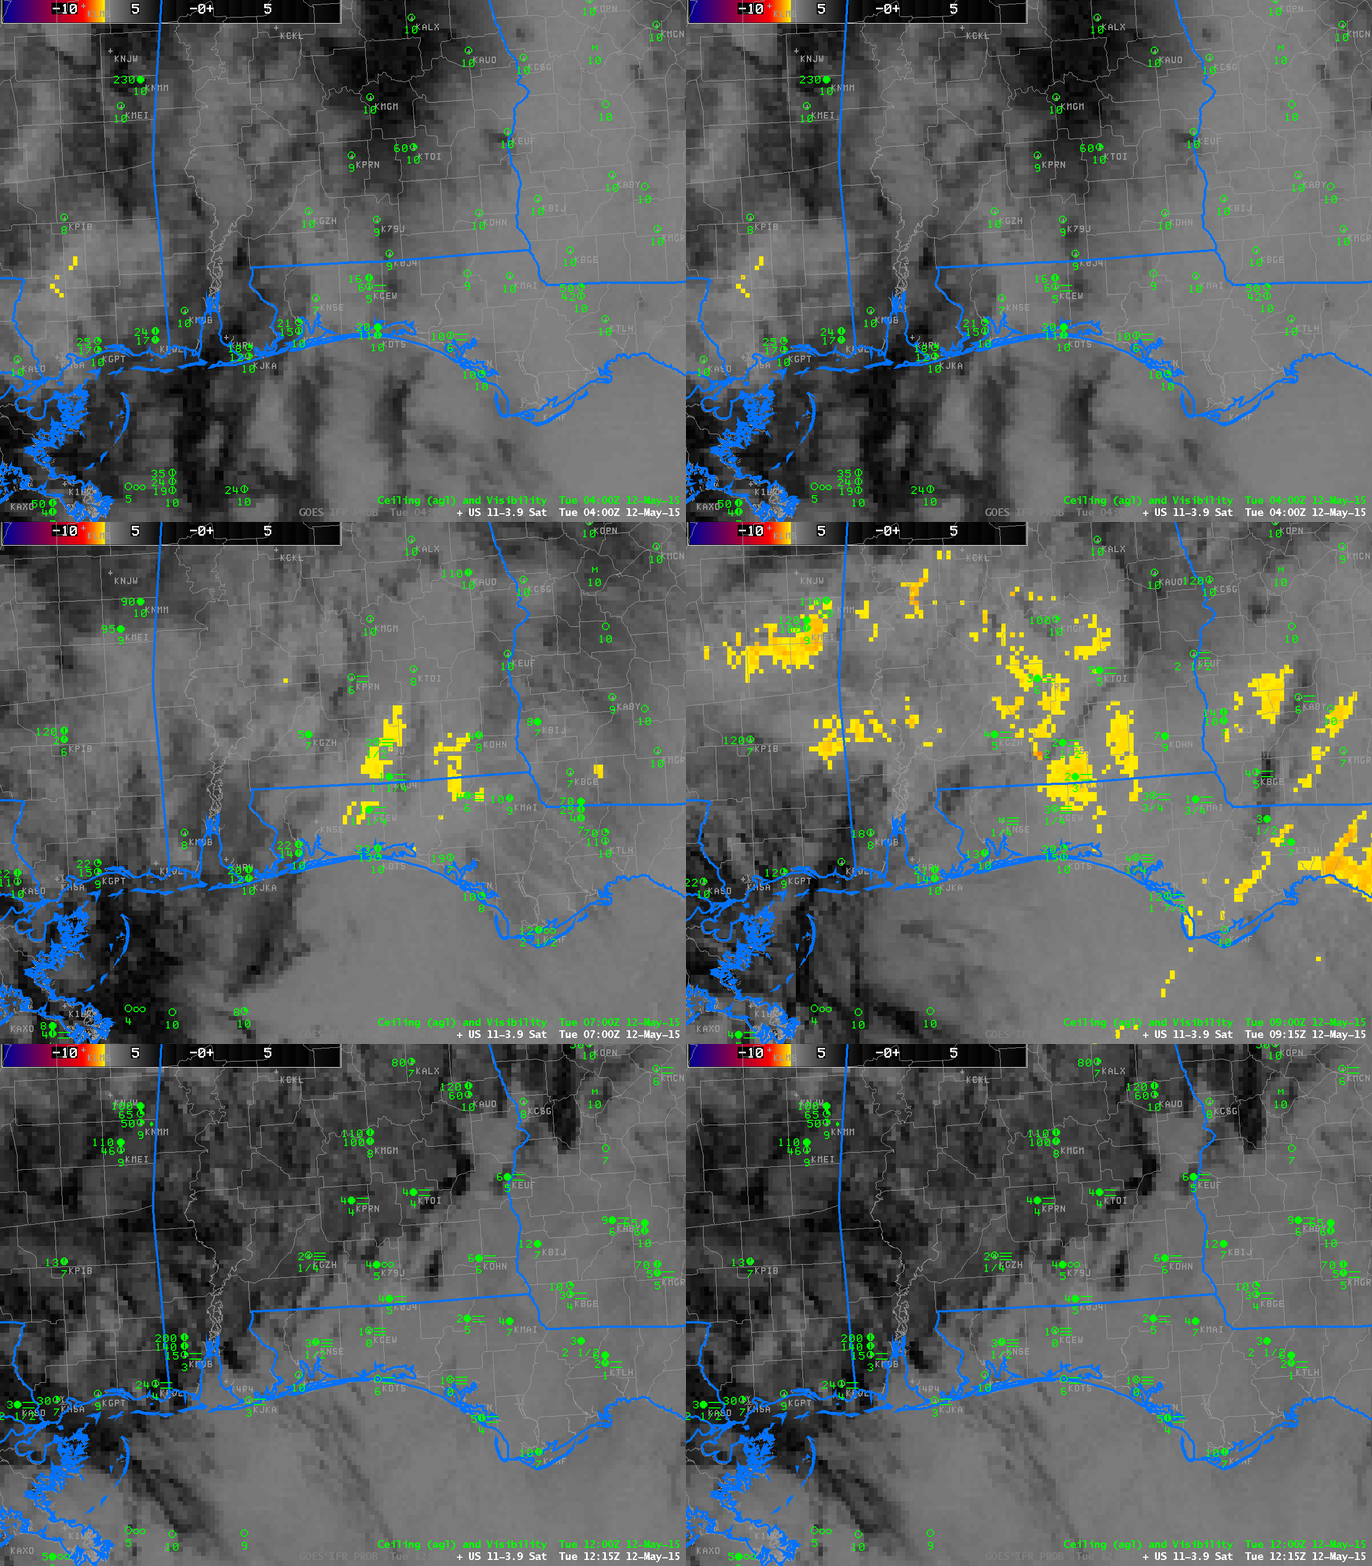
The brightness temperature difference product, below, that works because clouds comprising water droplets have different emissivity properties at 3.9 µm and 10.7 µm, did not provide much guidance for this event. This is because multiple cloud layers prevented the satellite from seeing down to the developing stratus/fog deck near the surface. The cloud deck persisted over Alabama, but eroded over northwest Florida by 0700 UTC. (Click here for an animation of GOES-Sounder Cloud Heights). In addition, fog persists through sunrise, and the rising sun is emitting 3.9 µm radiation; that makes interpretation of the brightness temperature difference field problematic.

US_11-3.9_Sat_20150512_0400_1215anim

Brightness Temperature Difference Fields (10.7 µm  – 3.9 µm) from GOES East, ~hourly from 0400 through 1215 UTC on 12 May 2015 and surface observations of ceilings and visibilities (Click to enlarge)

The GOES-R IFR Probability field, below, provided better information about the developing cloud field. Probabilities increase as the fog develops, and the spatial coverage of the enhanced IFR Probabilities better matches the regions where Dense Fog Advisories were issued. In addition, the strong signal persists through sunrise.

GOES_IFR_PROB_20150512_0400_1215anim

GOES-R IFR Probability Fields computed from Rapid Refresh and GOES-13 Data, ~hourly from 0400 through 1215 UTC, and surface observations of ceilings and visibilities (Click to enlarge)