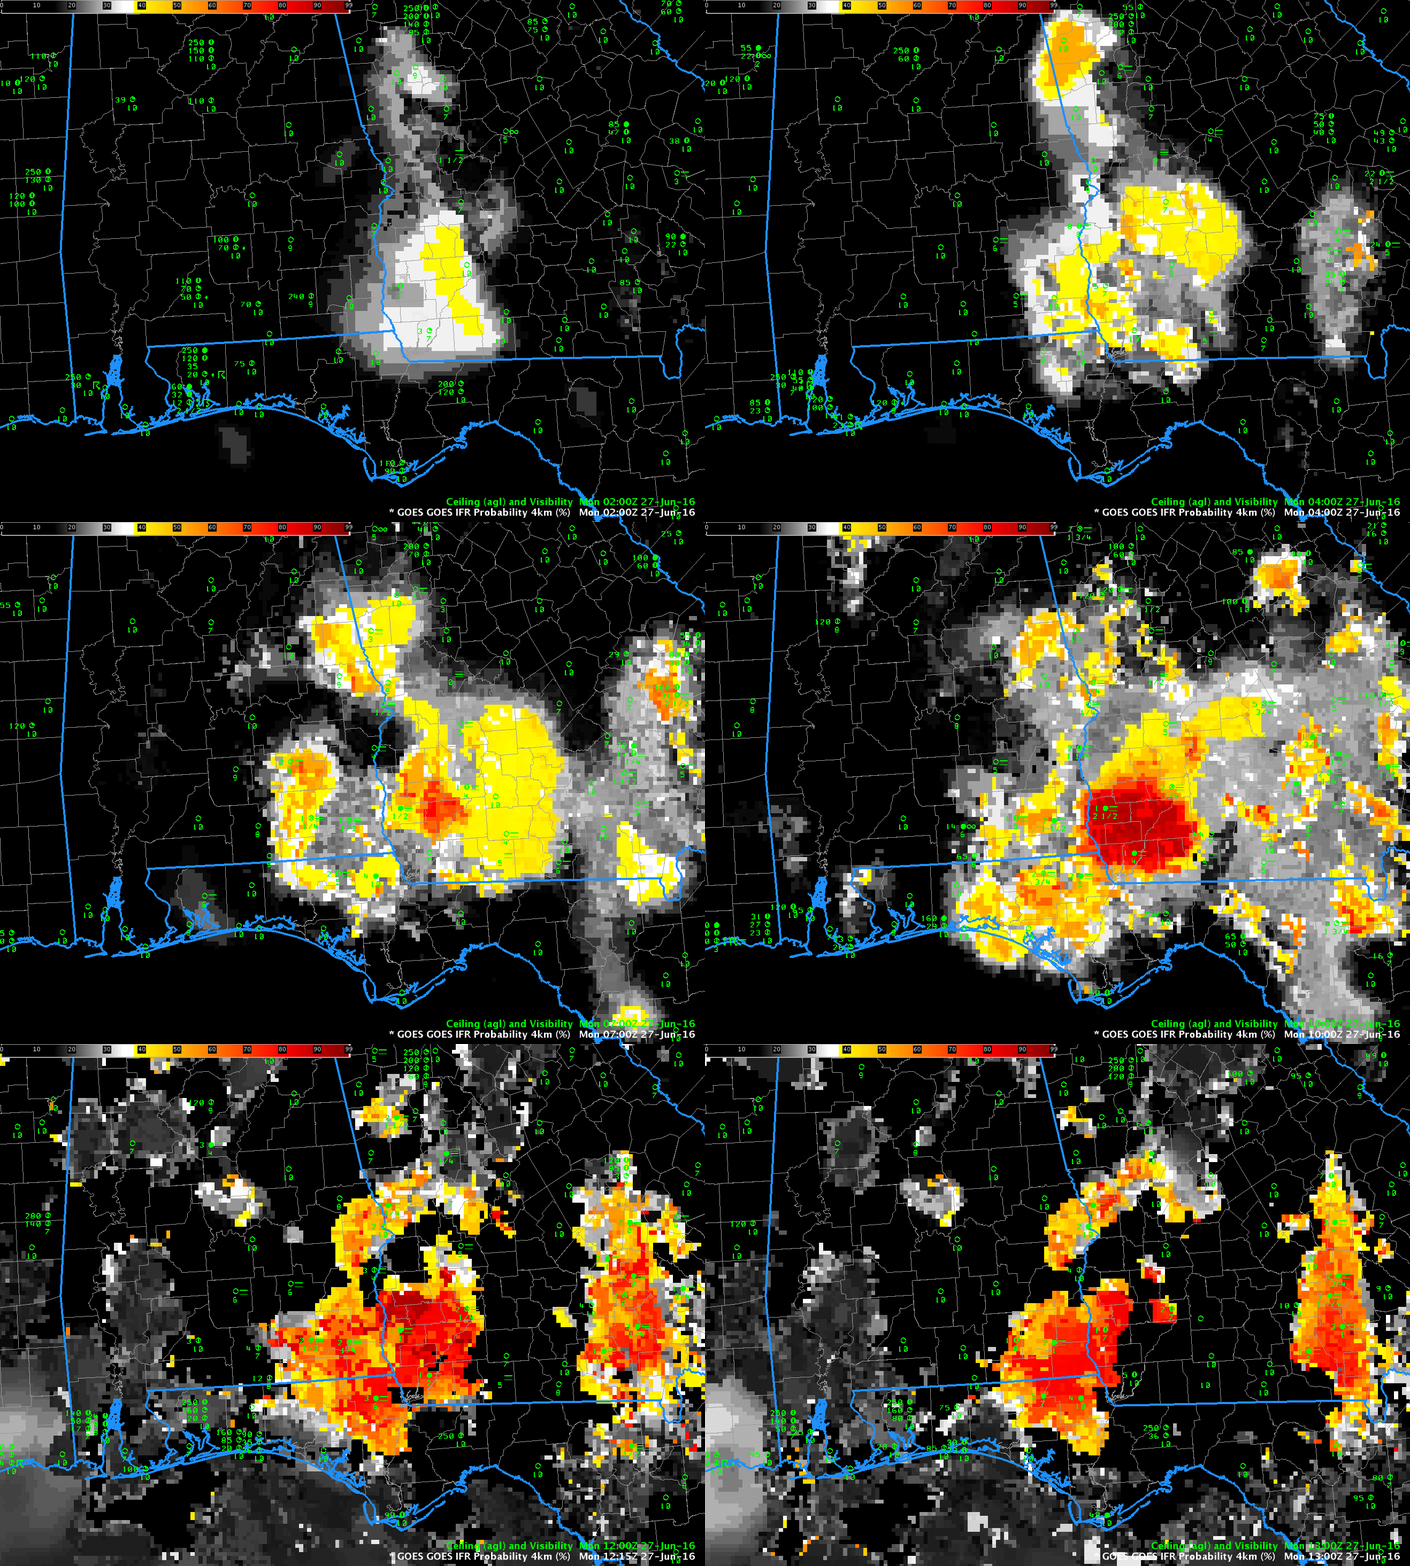
GOES-R IFR Probability fields on 27 June 2016 at 0200, 0400, and then hourly from 0700 through 1300 UTC (Click to enlarge)
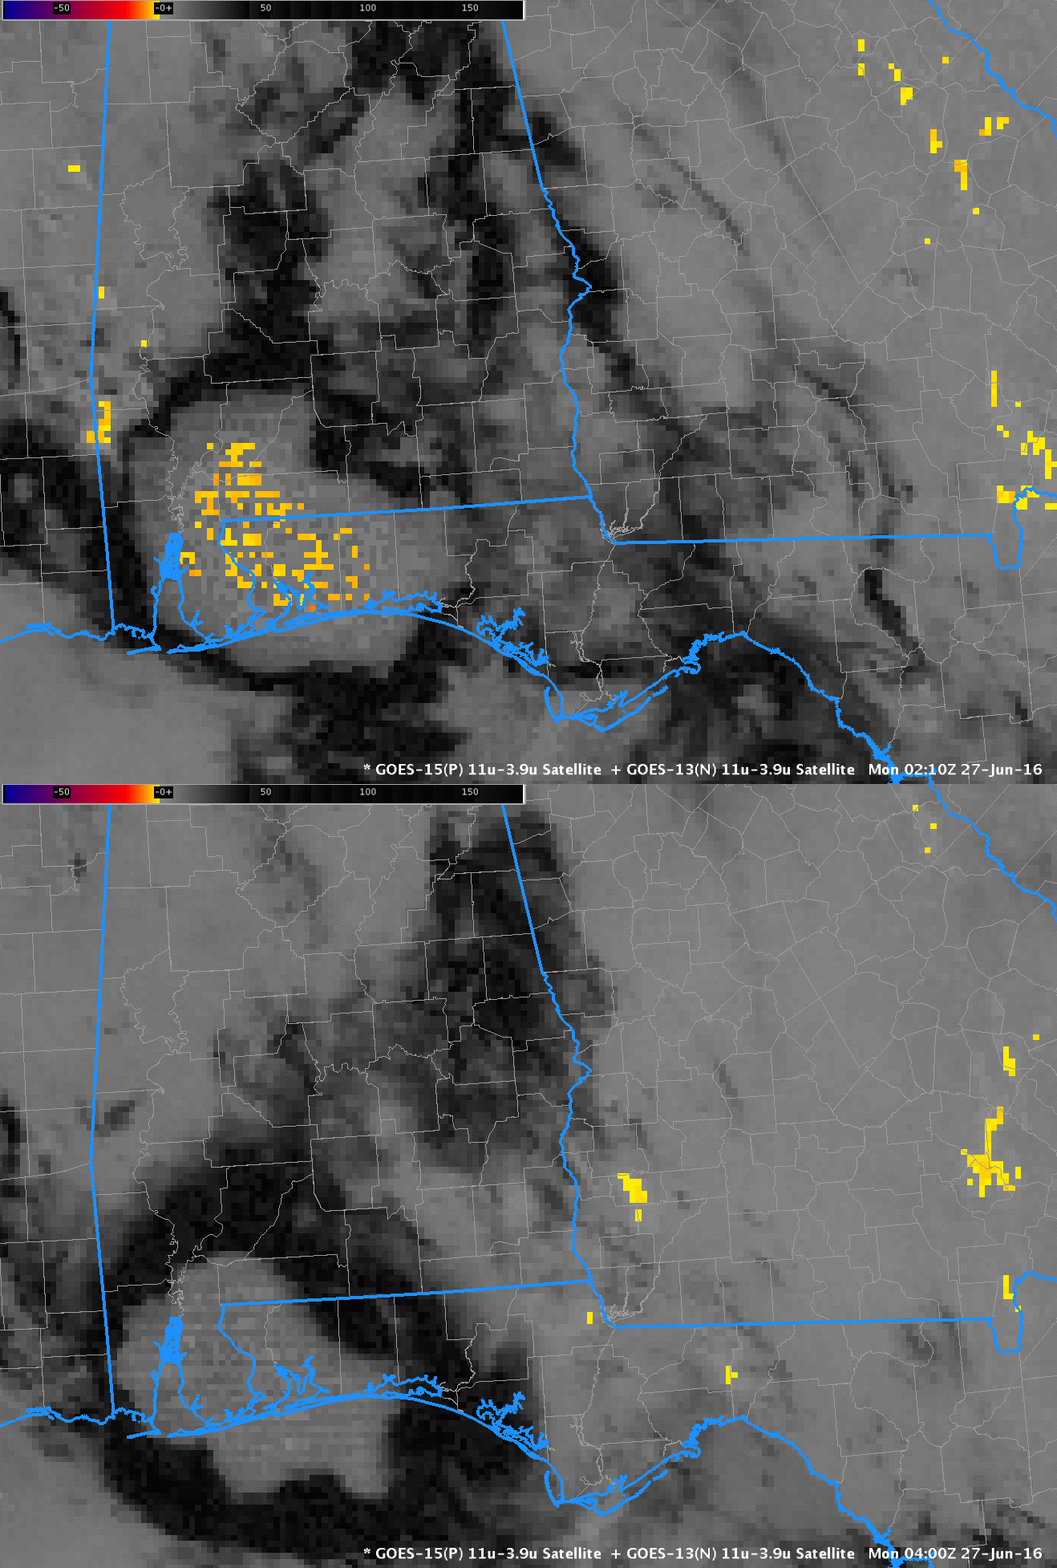
Late-day thunderstorms on 26 June 2016 set the scene for the development of fog overnight over southwestern Georgia. The animation above shows the GOES-R IFR Probability fields. An enhancement in the fields that is initially driven by Rapid Refresh Model data showing near-saturation at low levels is apparent at 0200 UTC. As clouds associated with the departing convection dissipate, satellite data could also be used as input into the IFR Probability fields. The toggle below of GOES-13 Brightness Temperature Difference fields (3.9 µm – 10.7 µm), at 0200 and 0400 UTC, shows the appearance of low-level clouds as mid-level and higher clouds (dark in the enhancement used) dissipate. By 0400 UTC, when satellite pixels finally start to suggest low clouds, fog had already started to develop. IFR Probability fields gave an early alert to the possibility of fog development on this day that was not possible from satellite data alone.
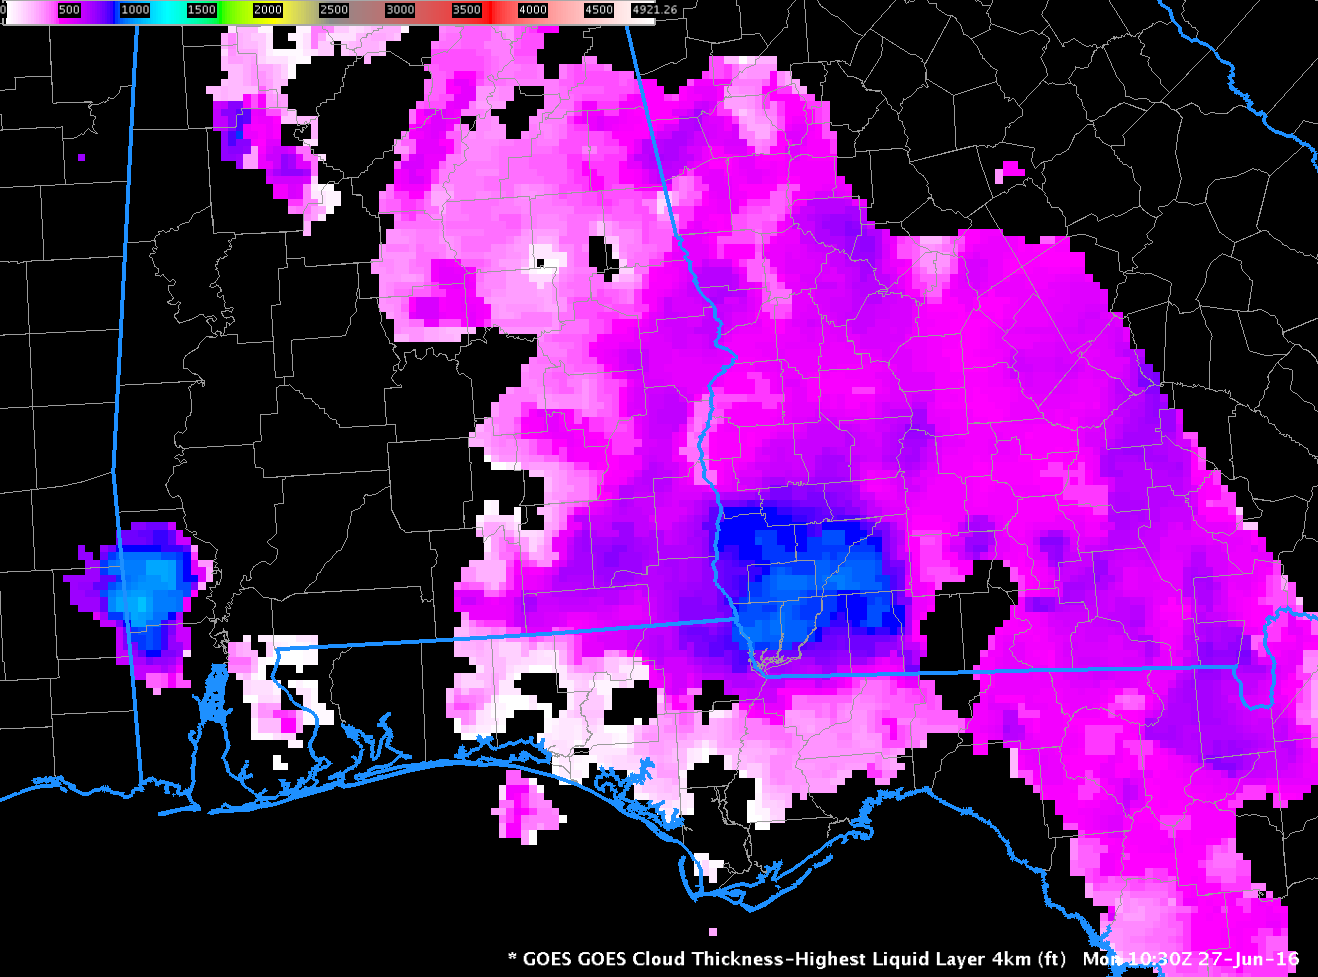
GOES-R Cloud Thickness Fields can give a hint to when radiation fog, as in this event, will dissipate in accordance with this scatterplot. The image below shows the GOES-R Cloud Thickness at 1030 UTC, the last field computed before twilight conditions (indeed, the boundary showing that boundary is readily apparent over eastern Georgia), with values exceeding 900 feet in some places over southwest Georgia. Based on the scatterplot, that suggests a dissipation time of just over 2 hours (based on the best fit line, but note the scatter in dissipation times associated with cloud thicknesses of 900 feet: just over an hour to almost 4 hours!) so clear skies would be expected by 1300 UTC. The animation of visible imagery, here, shows that fog persisted just a bit longer than that, dissipating shortly after 1400 UTC. GOES-R Cloud Thickness field is an empirical relationship between 3.9 µm emissivity and cloud thickness that is based on SODAR observations off the west coast. The scatterplot was created based on past observations limited to the southeast part of the US and parts of the Great Plains.


