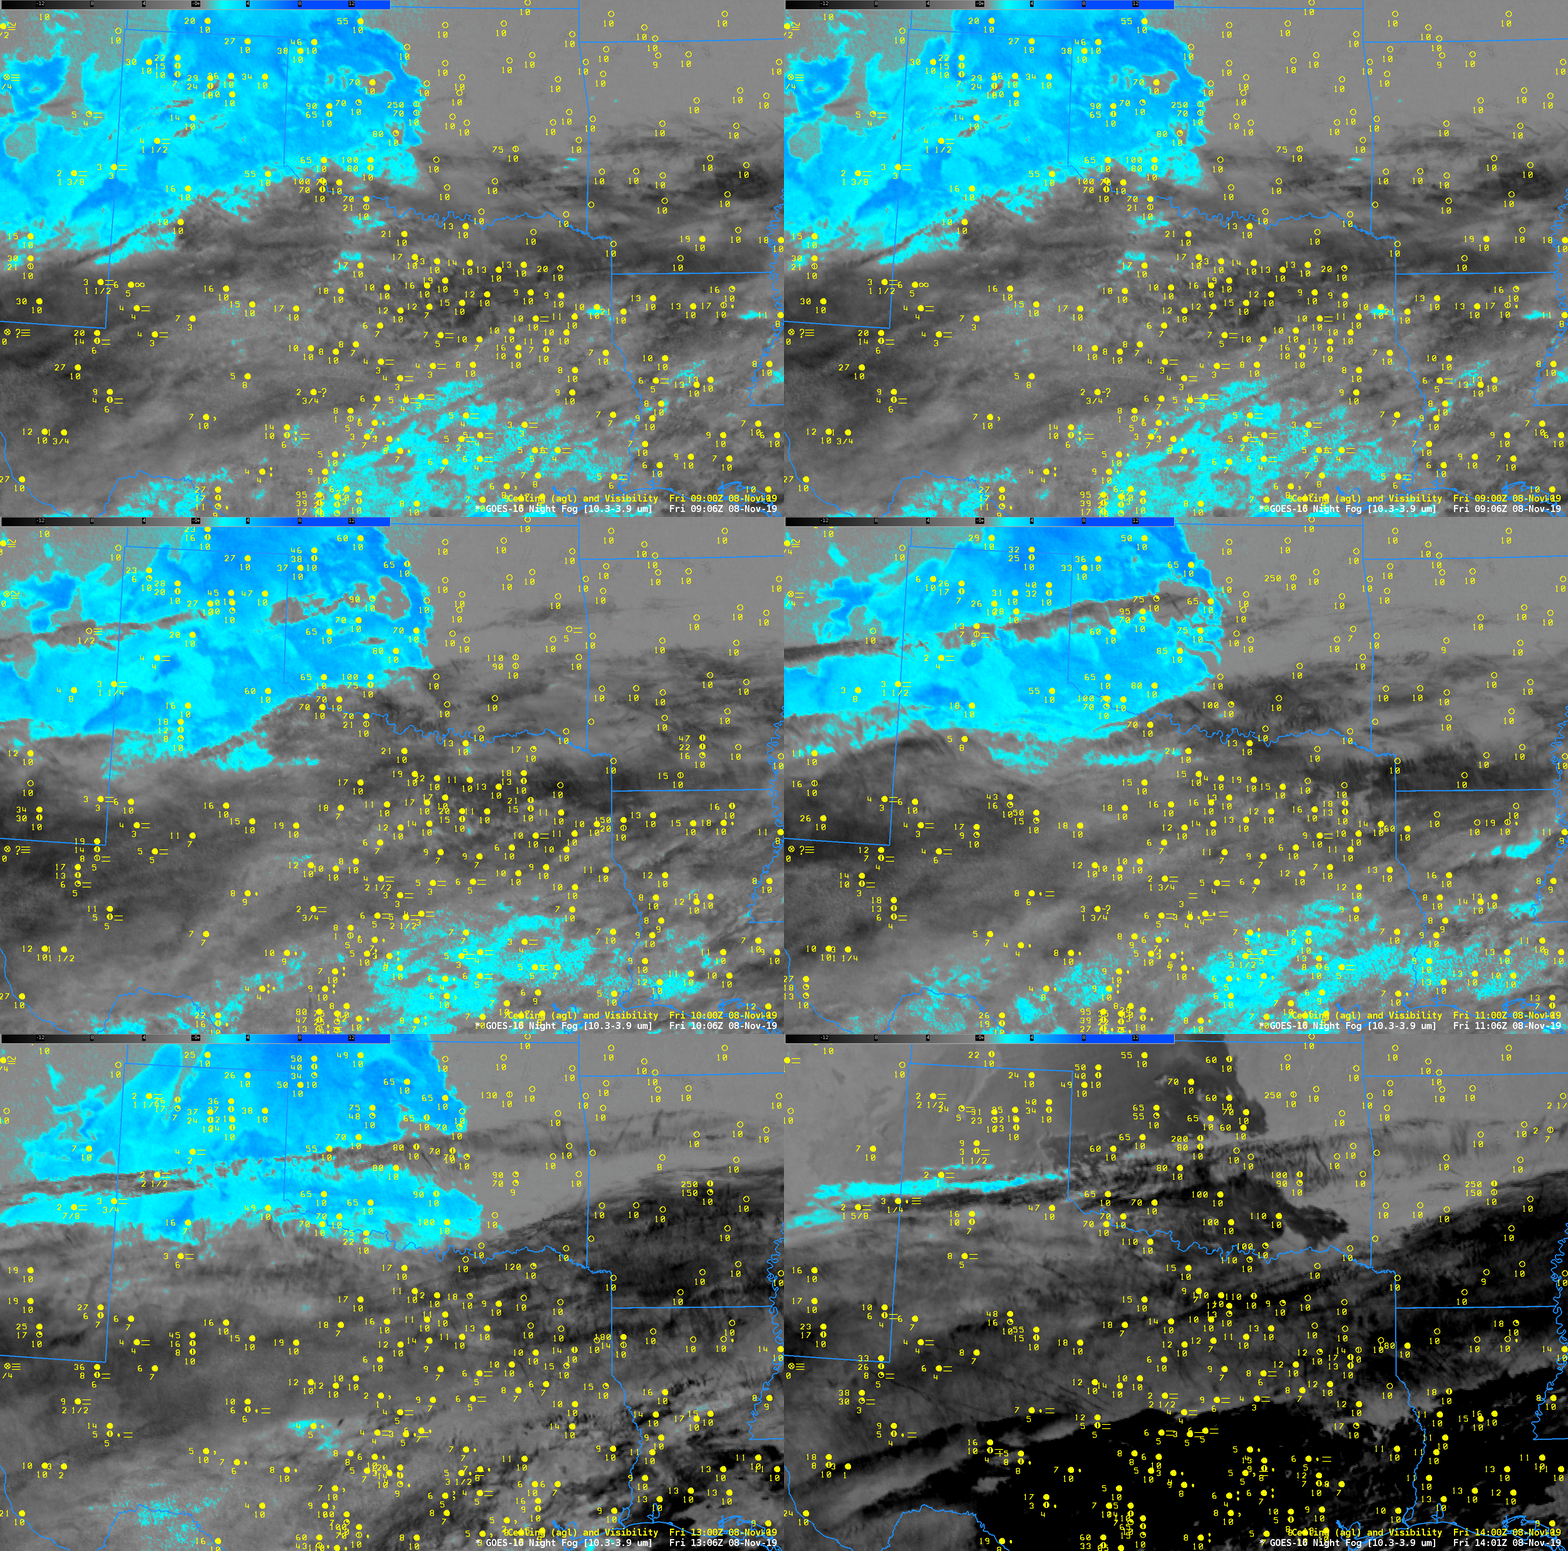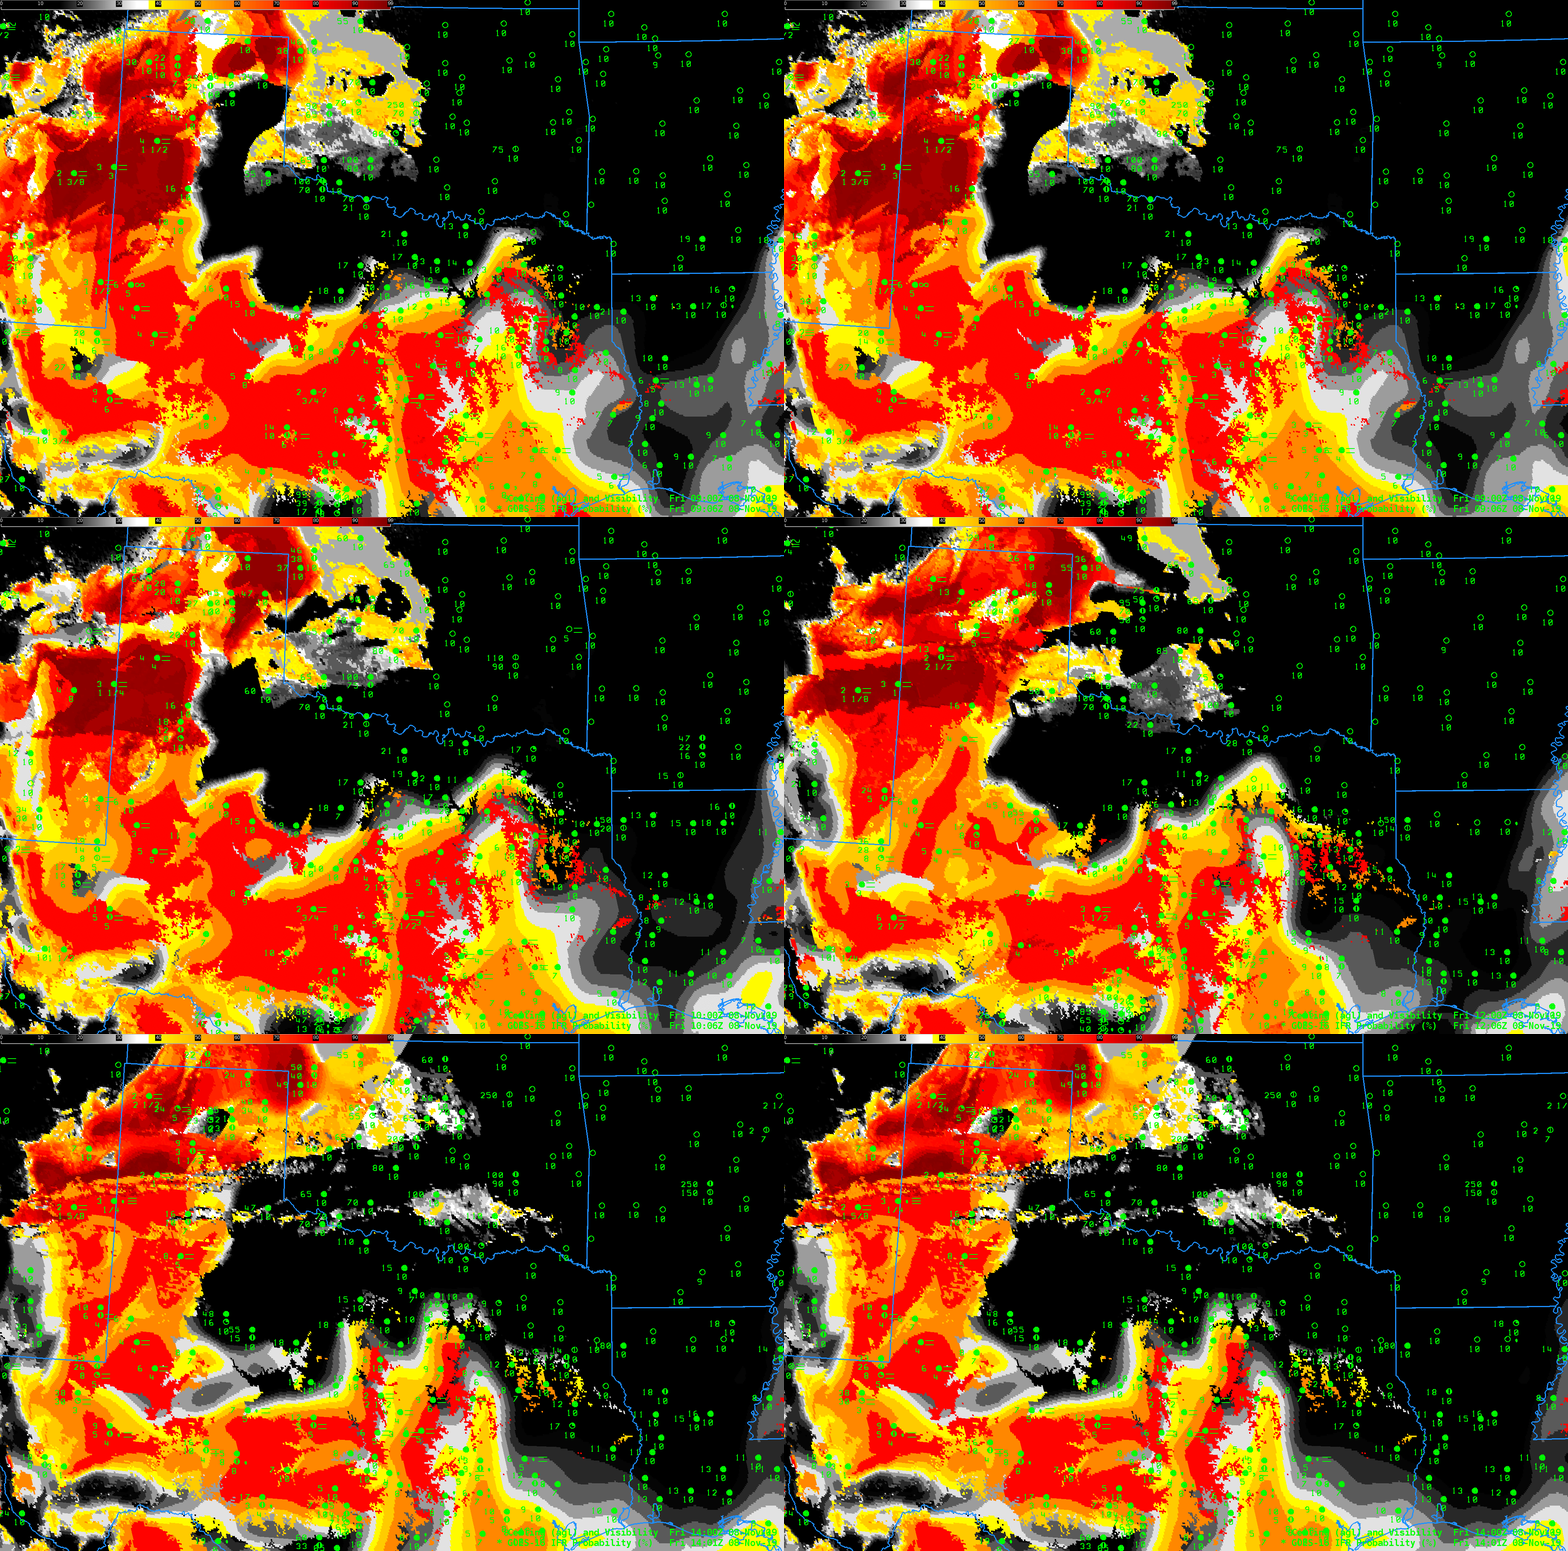
GOES-16 NightTime Microphysics, Night Fog Brightness Temperature Difference (10.3 µm – 3.9 µm) and IFR Probability at 1206 UTC on 4 November 2019, along with 1200 UTC observations of ceilings and visibilities (Click to enlarge)
Fog can be a challenge to detect from satellite for two reasons: High clouds can block the satellite’s view of low clouds, or low clouds (stratus) can be detected but the satellite cannot accurately determine the cloud base. The toggle above cycles between the Night Fog Brightness Temperature difference (10.3 µm – 3.9 µm), the Nighttime Microphysics RGB (the Night Fog Brightness Temperature Difference is the green component of that RGB), and GOES-R IFR Probability.
The Night Fog Brightness Temperature Difference can be used to detect low stratus clouds because the small water droplets that make up those clouds have different emissivities at 10.3 µm and 3.9 µm: water droplets do not emit 3.9 µm radiation as a blackbody would, but they do emit 10.3 µm radiation more nearly like a blackbody. Thus the amount of energy at 3.9 µm collected by the satellite is smaller than it would be above a blackbody emitter. The computation of the blackbody temperature associated with the collected energy assumes a blackbody emission. Because that’s not the case at all wavelengths above clouds made of water droplets, 3.9 µm brightness temperatures are colder than those computed from observed 10.3 µm energy.
The Night Fog brightness temperature difference field allows an observer to infer the presence of low clouds over the Pacific Ocean, in and around Portland OR on the Columbia River to the ocean, and also northward towards Puget Sound, and in the Willamette Valley between Portland and Eugene OR. There is also a signal over north-central Oregon that is likely unrelated to clouds — variable surface soil emissivity in that region is affecting this brightness temperature difference (The GOES-R Cloud Phase product and Cloud Mask both show no cloud signal in that region).
Note that a cirrus shield is apparent over the northeast half of the image. The cirrus covers most of Puget Sound in Washington, and the Brightness Temperature Difference field can therefore not give information about low clouds (except where breaks in the cirrus occur — such as in the Strait of Juan de Fuca).
The Nighttime Microphysics RGB is a way to identify low clouds — but its information is coming from the Night Fog brightness temperature difference and it has limitations that are similar to those with the brightness temperature difference, namely: what is going on under cirrus clouds, and how close to the ground are the low clouds that are detected? In the RGB, low clouds will have a yellowish hue (red — the split window difference and green — the night fog brightness temperature difference — make yellow). The RGB shows different values over Portland than over the Willamette Valley because the clouds are warmer over Portland (as detected by the clean window 10.3 as the blue part of the RGB) and the split window difference field (the red part of the RGB) shows larger values over the Willamette Valley.
IFR Probability shows a a strong and consistent signal from Portland south to Eugene, and also over the Pacific, and north of Portland into the southern Puget Sound. In these regions, Rapid Refresh Model data are showing the presence of low-level saturation, a good indicator that IFR conditions may be present. IFR Probability shows small values under the region of low clouds detected by satellite over the Strait of Juan de Fuca; the Rapid Refresh model there is not showing low-level saturation. There is also a small signal in the clear skies over north-central Oregon where a brightness temperature difference is occurring because of soil-driven emissivity differences.
Use IFR Probability to ascertain the likelihood of fog underneath cirrus decks, or to determined the likelihood of stratus decks reaching the surface (that is, if stratus is actually fog).


