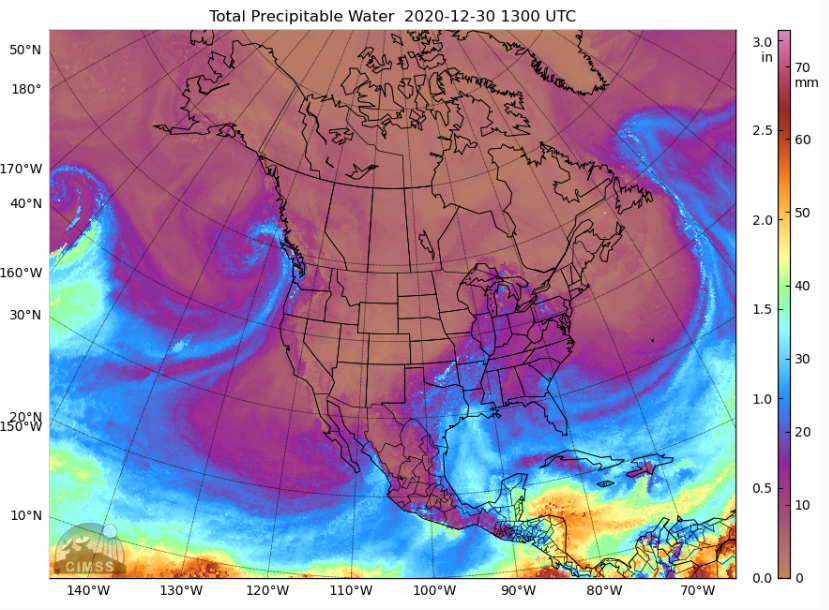
MIMIC Total Precipitable Water, 1300 UTC on 30 December 2020 (Click to enlarge)
A large storm moving ashore in British Columbia (0900 UTC Map), shown above in MIMIC Total Precipitable Water (from this site), was accompanied by widespread high clouds over much of the Pacific Coast of the United States. The 1511 UTC image, below, shows GOES-16 “clean window” (10.3 µm) infrared imagery, with high clouds apparent.
GOES-16 “Clean Window” infrared imagery (10.3 µm) at 1511 UTC on 30 December 2020
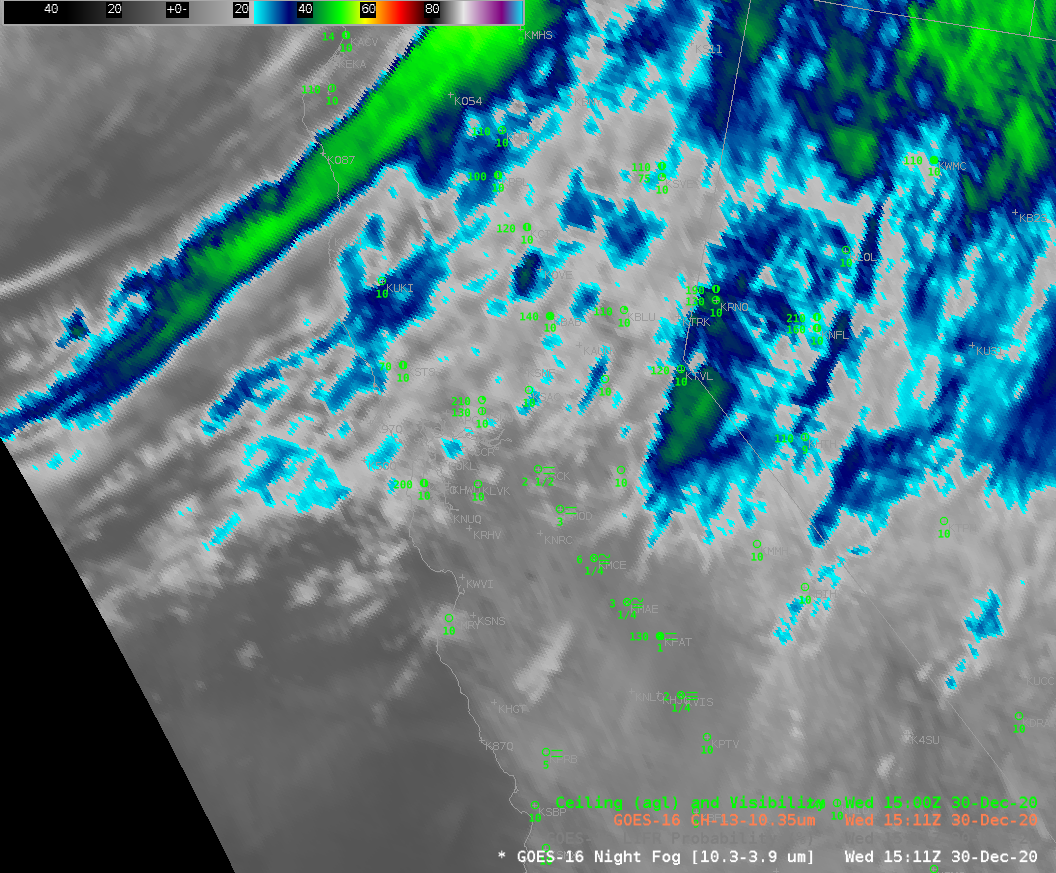
Satellite-only detection of fog/low clouds will be challenged on this day by the abundance of high clouds that block the satellite’s view of low stratus decks. Indeed, the ‘Night Fog’ brightness temperature difference field, below, allows for only periodic glimpses of what is happening near the surface. There are indications of fog — but it is challenging even in the animation to determine the horizontal extent of the fog regions.
GOES-16 ‘Night Fog’ Brightness Temperature Difference (BTD, 10.3 µm – 3.9 µm), 1111 – 1516 UTC on 30 December 2020, along with surface observations of ceilings and visibilities
GOES-16 Low IFR Probability fields, below (note: GOES-17 IFR Probability fields are still undergoing testing in preparation for their being deemed operational) highlight two regions of visibility restrictions: One is off the coast of central California, and a another is a narrow ribbon of reduced visibilities in the Central Valley. This case highlights a strength of IFR Probability fields: You get a useful and consistent signal even if high clouds are blocking the satellite view of low clouds. This is because Rapid Refresh Model estimates of low-level saturation are incorporated into the Probability fields.
GOES-16 Low IFR Probability fields, 1116 – 1511 UTC, 30 December 2020, along with surface observations of ceilings and visibilities (Click to enlarge)
GOES-16 IFR Probability Fields, 1056 UTC – 1546 UTC, on 22 December 2020 (Click to enlarge)
IFR Probability fields from early on 22 December 2020, above, show a region of High Probabilities over northwest Wisconsin, northeastern Minnesota and northwestern Ontario. In general, the observations of IFR conditions (ceilings between 1000 and 3000 feet, visibilities between 1 and 3 miles) match well with the highest IFR Probability. The western edge of the field has characteristics that suggest it becomes more model-defined (in this case, the Rapid Refresh model that supplies the low-level saturation information) with time: the field from western Wisconsin up through Minnesota becomes less and less pixelated with time, as satellite information is lost due to the incursion of higher clouds.
Note also: Lake Superior, warmer than the overlaying atmosphere, is diagnosed as having low probabilities of IFR conditions.
Brightness temperature Difference fields, shown below for the same times, have historically been used to detect low clouds. However, there is little correlation between the fields and the observations of IFR conditions for two principle reasons: Brightness Temperature Difference fields alone do not give information on the cloud base, and IFR conditions require low cloud bases; Higher clouds impede the detection of low-level clouds associated with IFR conditions, and high clouds are overspreading this scene.
The animation below also shows how the Brightness Temperature Difference signal is lost as increasing amounts of solar reflectance become present as the sun rises.
GOES-16 Night Fog Brightness Temperature Difference (10.3 µm – 3.9 µm), 1056 UTC – 1546 UTC, on 22 December 2020 (Click to enlarge)
The toggle below shows GOES-16 IFR Probability and the Night Fog Brightness Temperature Difference (10.3 – 3.9) at 1301 UTC, before sunrise. There are significant regions of low clouds/fog over northeastern Minnesota that have little signal in the brightness temperature difference field — but there is a strong signal there in the IFR Probability field.
GOES-16 IFR Probability and GOES-16 Night Fog Brightness Temperature Difference (10.3 µm – 3.9 µm), 1301 UTC on 22 December 2020 (Click to enlarge)
By 1501 UTC, below, when the sun is above the horizon, reflected solar radiation means that the Night Fog Brightness Temperature Difference default enhancement is no longer appropriate to detect low clouds. However, IFR Probability continues to outline regions of low clouds and fog.
GOES-16 IFR Probability and GOES-16 Night Fog Brightness Temperature Difference (10.3 µm – 3.9 µm), 1501 UTC on 22 December 2020 (Click to enlarge)
GOES-R IFR Probability fields blend the strengths of satellite detection of clouds with the strengths of model detection of low-level saturation. In regions of high clouds, where the satellite cannot view low clouds (over northwest Wisconsin, for example), model data nevertheless gives a useful signal. Note also the lower IFR Probabilities over Ontario where low clouds are prevalent. Here, model data allows IFR probabilities to screen out regions of elevated stratus, which clouds are not so important as far as surface visibility restrictions go.
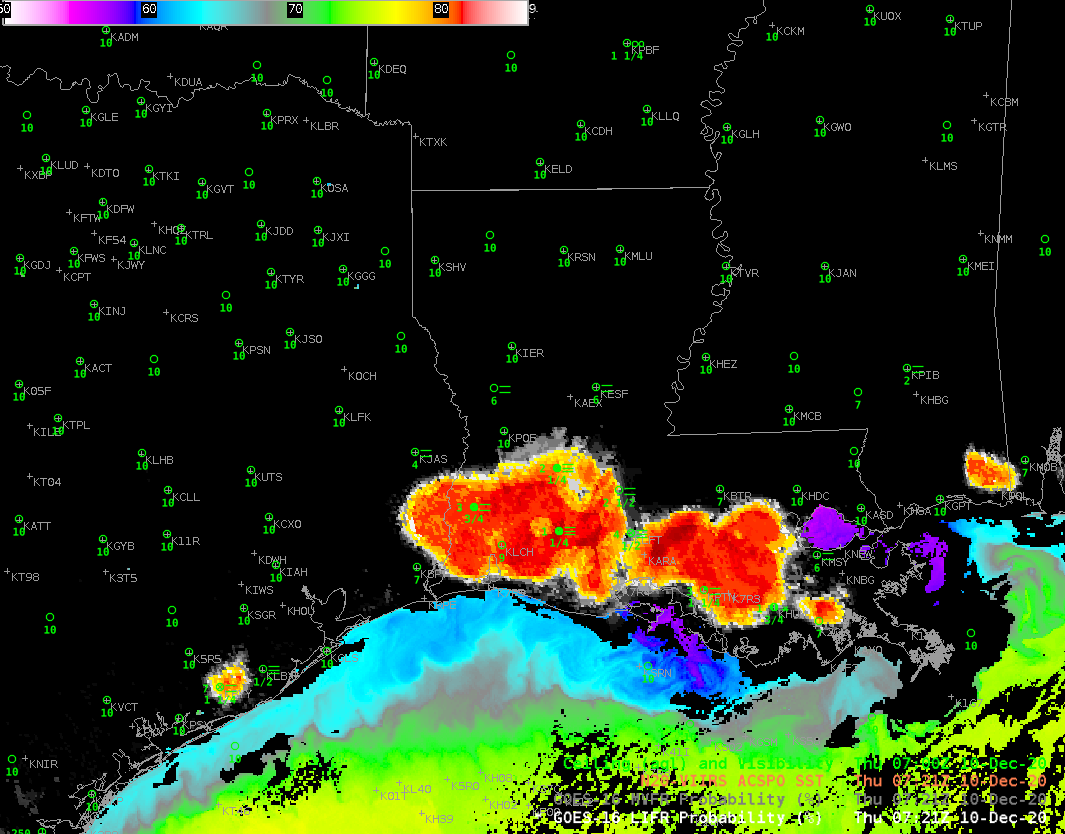
GOES-16 Low IFR Probability fields, 0406 – 1651 UTC, 10 December 2020 , along with surface observations of ceilings and visibility (Click to enlarge)
High Pressure (link), cold air, and proximity to warm Sea Surface Temperatures (image here, ACSPO SSTs from the Direct Broadcast Antenna at CIMSS) meant dense fog over southwestern Louisiana. The animation above shows Probabilty of Low IFR Conditions from 0400 UTC through sunrise. Low IFR Probability fields originate near Lake Charles and Franklin before consolidating into one large field over southern Louisiana. Surface observations of ceilings and visibilities also indicate dense fog.
An after-effect of the landfall of Hurricanes is the destruction of webcams that can be used to monitor fog, as noted in the Area Forecast Discussion from WFO Lake Charles, below, from 441 AM CST on 10 December. IFR Probability products in AWIPS combine model predictions of low-level saturation and satellite observations of low cloud to mitigate this loss of information. Regions where low IFR Probability values are high are likely regions that would have dense fog on webcams.
Night Fog Brightness Temperature difference (10.3 µm – 3.9 µm) fields, below, also show the region of stratus clouds. But this satellite-only product does not contain information on how dense the fog is underneath the cloud top (or even if the stratus cloud is also fog). The combination of model data and satellite data by IFR Probability products gives more information than satellite data alone.
GOES-16 Night Fog Brightness Temperature Difference (10.3 µm – 3.9 µm), 0406 – 1651 UTC on 10 December 2020 (Click to enlarge)
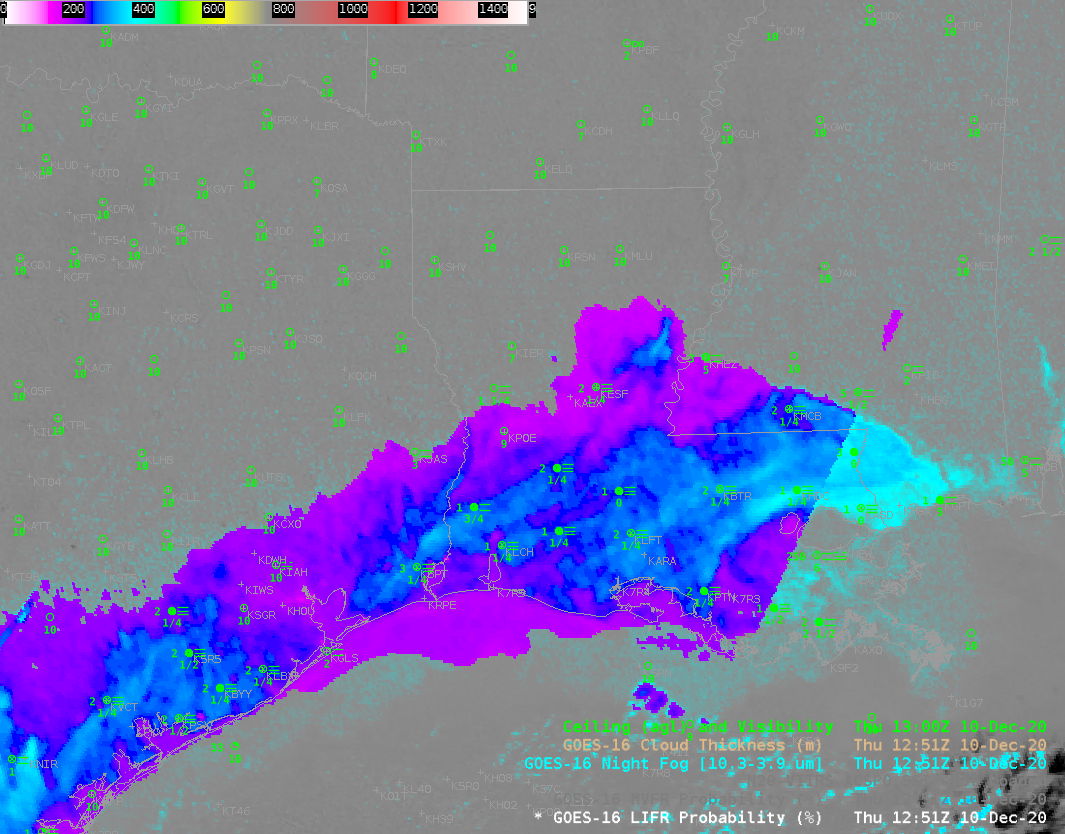
The suite of IFR Probability products includes a GOES-R Cloud Thickness field, shown below overlain on top of a Night Fog Brightness Temperature Difference field. Cloud Thickness is not computed in the 90-120 minutes surrounding sunrise, and the terminator is apparent in the image below, where the Night Fog Brightness Temperature Difference becomes apparent. The thickest cloud (nearly 400 m) is northwest of Lake Ponchartrain. That is where the fog should dissipate last, perhaps.
GOES-R Cloud Thickness field, 1251 UTC, displayed on top of the Night Fog Brightness Temperature Difference field (10.3 µm – 3.9 µm) from the same time (Click to enlarge)
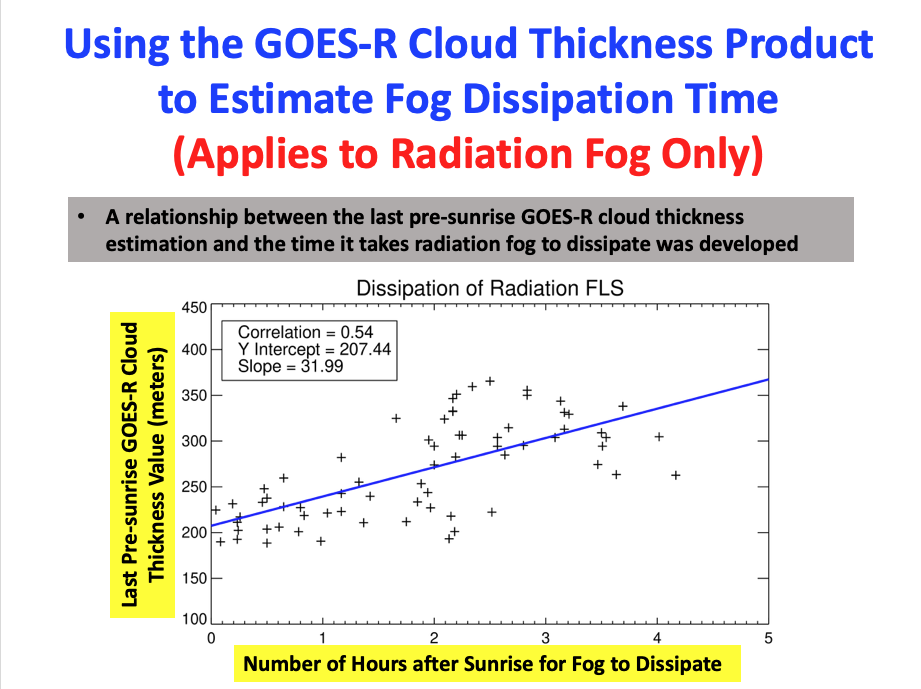
The scatterplot below can be used to estimate when radiation fog might dissipate. It relates the last pre-sunrise observation of GOES-R Cloud Thickness, as shown above, to the number of hours until burn-off. A value of almost 400 m suggests a burnoff nearly four hours after the image above: 1651 UTC. The Thickness field also suggests fog dissipation will be more rapid over southwestern Louisiana than over regions near Lake Ponchartrain. Animations of the Night Fog Brightness Temperature, above, and the visible imagery, below, show that the estimate was a good one on this day.
GOES-16 Band 2 (0.64 µm) visible imagery, 1336 – 1651 UTC on 10 December 2020 (Click to enlarge)
The IFR Probability products include Low IFR Probability, shown above, IFR Probability, and Marginal VFR (MVFR) Probability, in addition to Cloud Thickness. The toggle below, from 0906 UTC, shows that MVFR Probability and Low IFR Probability fields were co-located. As expected, probability of MVFR conditions are greater than probabilities of Low IFR conditions.
GOES-R Low IFR and MVFR Probability, 0906 UTC on 10 December 2020 (Click to enlarge)
Added: Lake Charles WFO also tweeted out this excellent image of a Fog Bow as the fog dissipated!