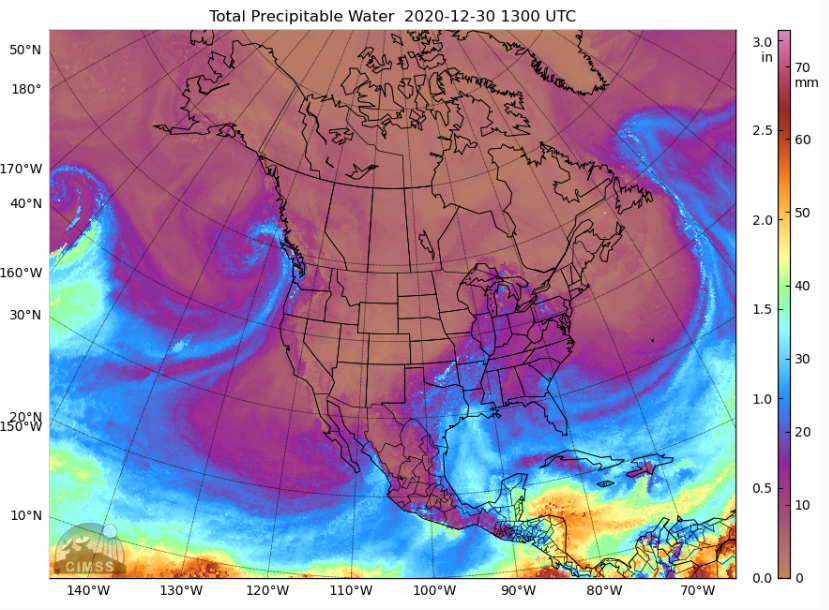
A large storm moving ashore in British Columbia (0900 UTC Map), shown above in MIMIC Total Precipitable Water (from this site), was accompanied by widespread high clouds over much of the Pacific Coast of the United States. The 1511 UTC image, below, shows GOES-16 “clean window” (10.3 µm) infrared imagery, with high clouds apparent.
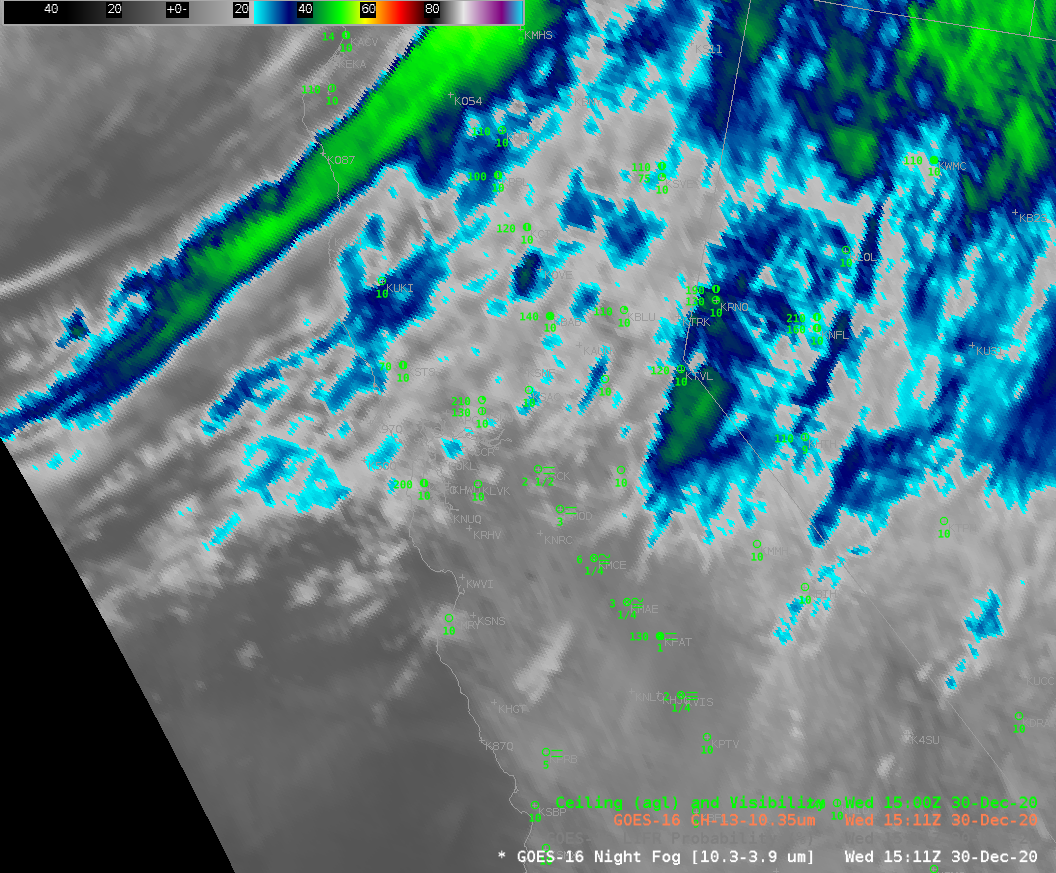
Satellite-only detection of fog/low clouds will be challenged on this day by the abundance of high clouds that block the satellite’s view of low stratus decks. Indeed, the ‘Night Fog’ brightness temperature difference field, below, allows for only periodic glimpses of what is happening near the surface. There are indications of fog — but it is challenging even in the animation to determine the horizontal extent of the fog regions.
GOES-16 Low IFR Probability fields, below (note: GOES-17 IFR Probability fields are still undergoing testing in preparation for their being deemed operational) highlight two regions of visibility restrictions: One is off the coast of central California, and a another is a narrow ribbon of reduced visibilities in the Central Valley. This case highlights a strength of IFR Probability fields: You get a useful and consistent signal even if high clouds are blocking the satellite view of low clouds. This is because Rapid Refresh Model estimates of low-level saturation are incorporated into the Probability fields.