Monthly Archives: December 2017

Dense Fog over the Deep South

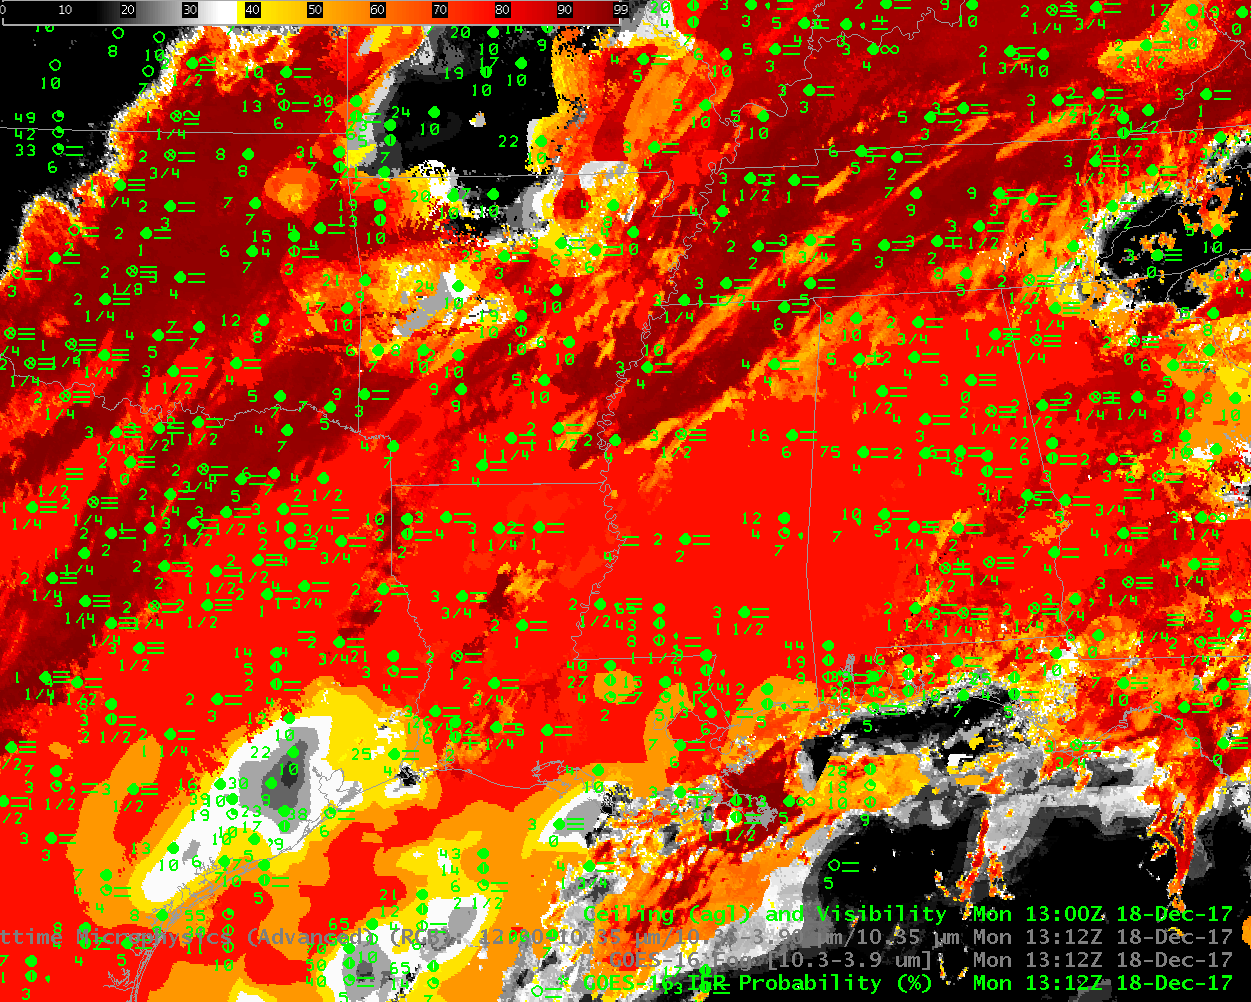
GOES-16 IFR Probability fields, 1312 UTC on 18 December 2017 (Click to enlarge). Ceilings and visibilities are also plotted.

Dense Fog was widespread across the south on Monday morning, 18 December 2017 (See the screen capture below from this site at 1319 UTC).  The GOES-16 IFR Probability field, above, highlights the regions of IFR and near-IFR conditions very well. It has a flat character over much of central Mississippi and Alabama.  These are regions where multiple cloud decks are preventing the satellite from viewing the near-surface clouds, and where Rapid Refresh data are being used as the sole predictor for the probability of IFR conditions.  In contrast, the IFR Probability field over much of Tennessee and Arkansas (for example) has a pixelated look to it — there are small variations over very small distances:  over these two states, higher clouds are not preventing the satellite from viewing near-surface clouds, and satellite data can also be used as a predictor in the IFR Probability fields (See the 10.3 µm – 3.9 µm Brightness Temperature difference field below).

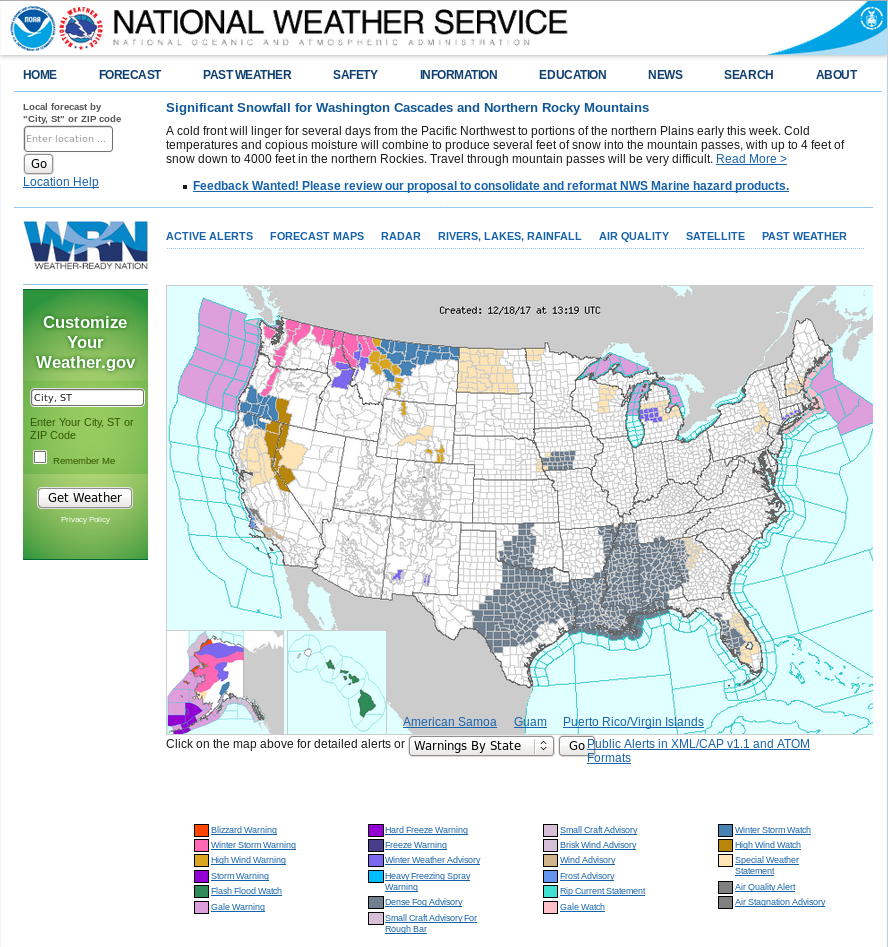
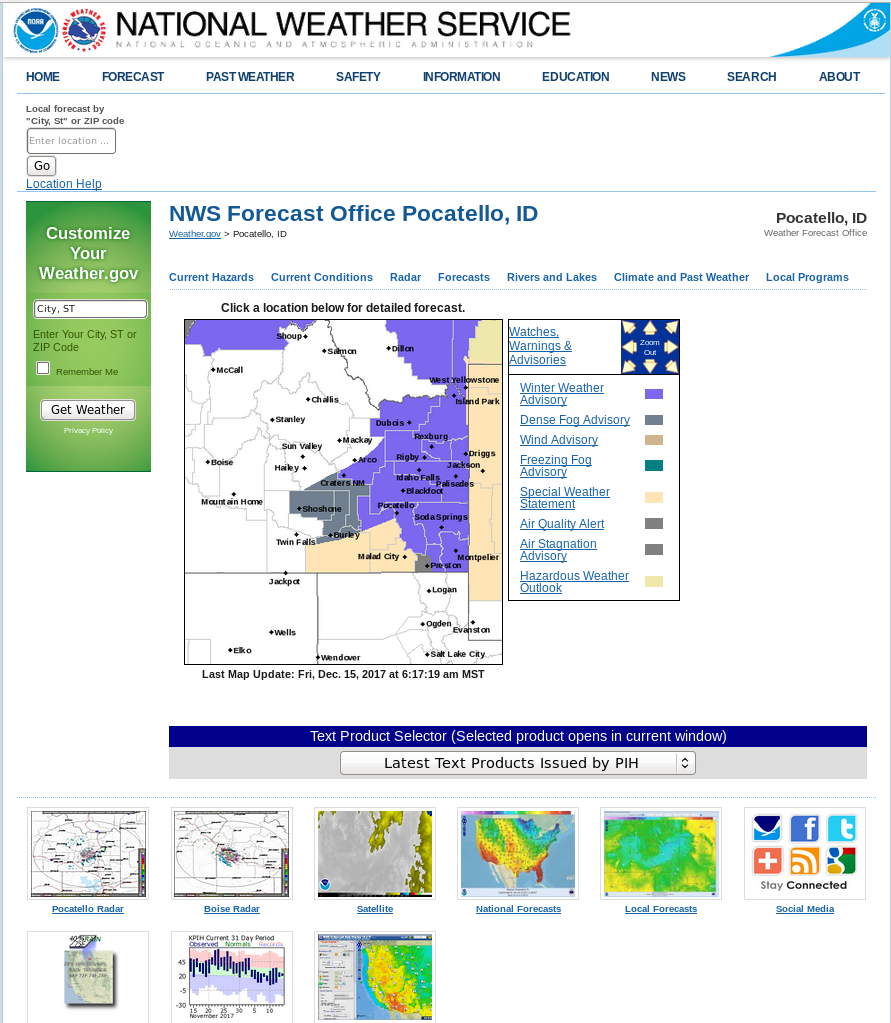
Screen Capture from http://www.weather.gov at 1319 UTC on 18 December 2017 (Click to enlarge). Grey regions are under Dense Fog Advisories.

When high clouds are present, fog detection techniques that rely solely on satellite data struggle to detect low clouds.  Compare the above field, for example, to the 10.3 µm – 3.9 µm Brightness Temperature Difference field (sometimes called the ‘Fog Product’).  In the enhancement used (the default enhancement in AWIPS), fog is depicted as blue (a positive value in the brightness temperature difference) and cirrus/high clouds in black.  There is little signal of Fog over a region where Dense Fog advisories have been issued. Similarly, the Advanced Nighttime Microphysics RGB, below, that relies on the 10.3 µm – 3.9 µm to highlight low clouds that might be fog, also is not indicating fog (a light cream/cyan color, typically) over much of the Deep South.  When cirrus clouds are present, its use, like that of the Fog Brightness Temperature Difference, is of dubious value.

The last figure, at the bottom, toggles between all three fields at 1312 UTC.

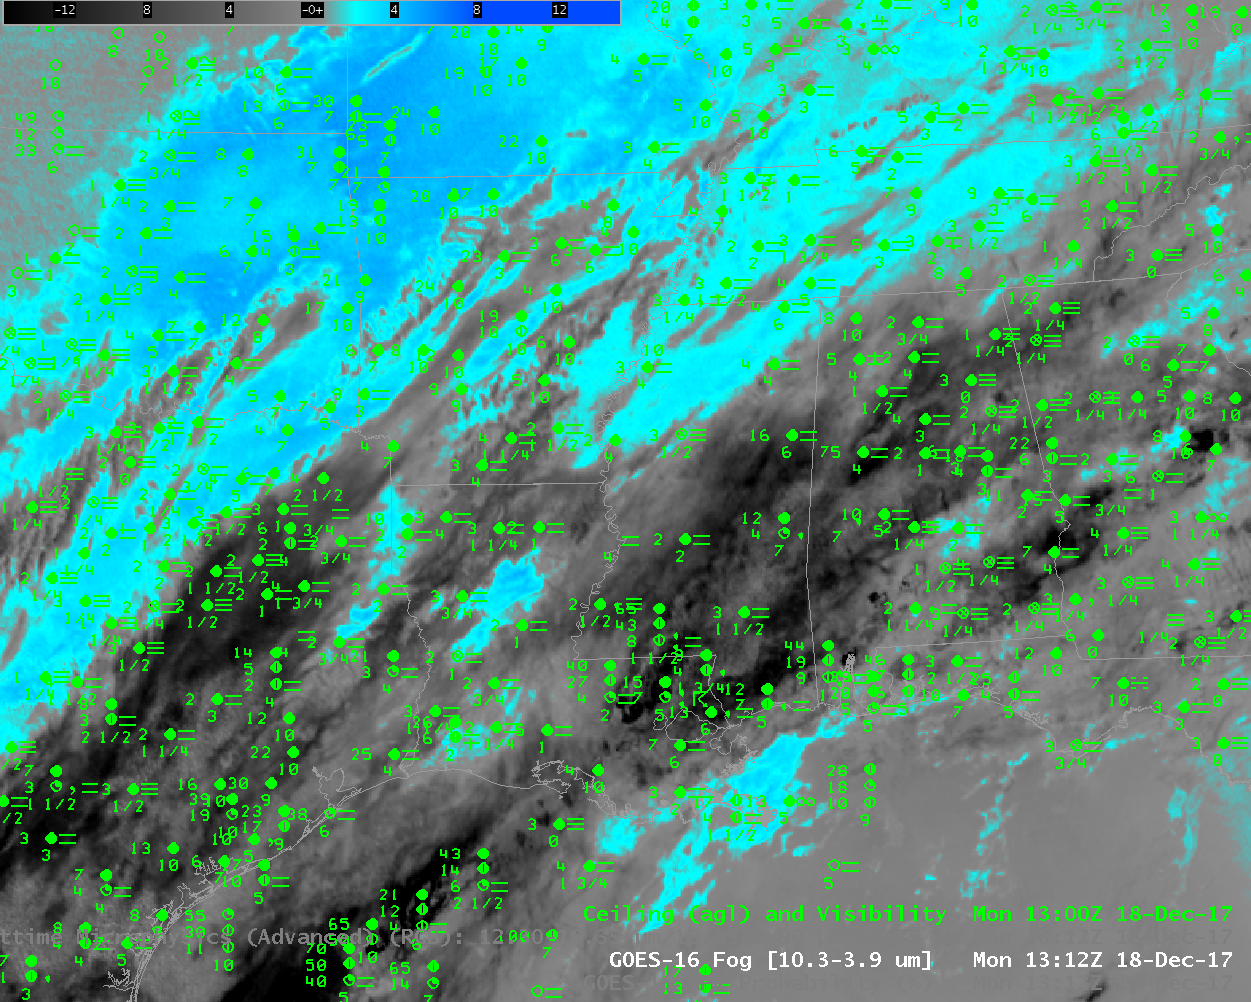
GOES-16 Fog Brightness Temperature Difference (10.3 µm – 3.9 µm) field, 1312 UTC on 18 December 2017  (Click to enlarge)

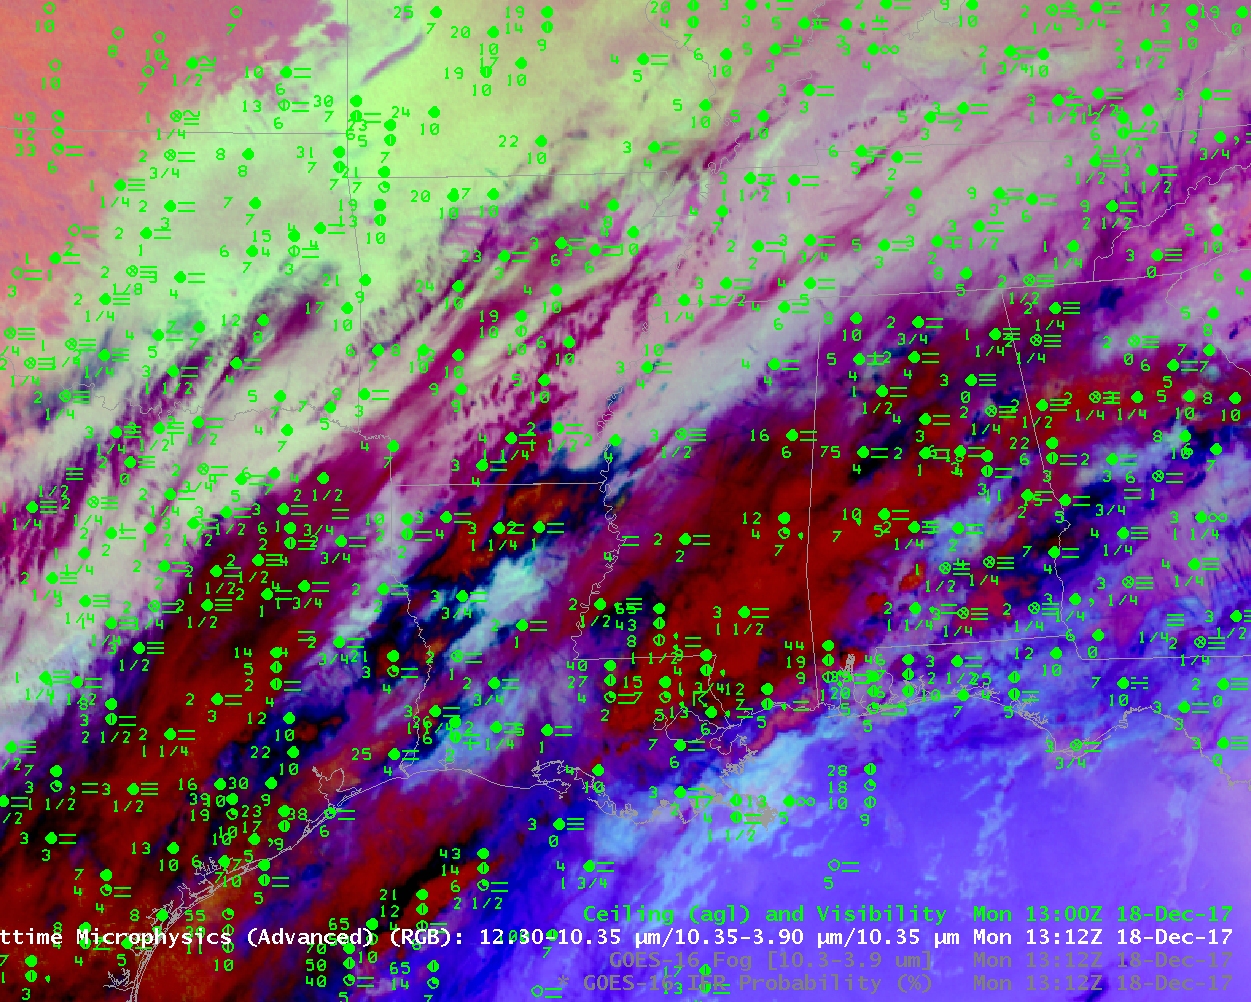
Advanced Nighttime Microphysics RGB, 1312 UTC on 18 December 2017  (Click to enlarge)

GOES-16 IFR Probability, GOES-16 ‘Fog’ Brightness Temperature Difference (10.3 µm – 3.9 µm), and Advanced Nighttime Microphysics RGB, all at 1312 UTC on 18 December 2017 (Click to enlarge)

Dense Fog over Idaho

GOES-16 IFR Probability fields, 0502-1302 UTC on 15 December 2017 (Click to enlarge)

GOES-16 data posted on this page are preliminary, non-operational and are undergoing testing

GOES-16 is now in the operational GOES-East position (but not, yet, technically operational) and GOES-16 data started flowing shortly after 1500 UTC on Thursday 14 December. GOES-16 produces excellent imagery over the western United States despite the satellite’s station at 75.2 West Longitude. The animation above shows GOES-16 IFR Probability fields over Idaho, with large values over the Snake River; High Pressure over the region has capped moisture (and pollutants) in the valley, and reduced visibilities are a result. (Click here for the Boise Sounding from 0000 UTC on 15 December from this site) The Pocatello Idaho Forecast Office of the NWS issued (at bottom) Dense Fog Advisories that were valid in the morning of 15 December 2017.

The excellent temporal resolution allows for close monitoring of the eastern edge of the region of fog, expanding eastward from the Snake River Valley into Wyoming and Montana.

The animation above shows consistent GOES-16 IFR Probabilities over the Snake River, and observations of low ceilings and reduced visibilities.  Note that over the eastern part of the Valley, from Pocatello to Idaho Falls and Rexburg, the character of the IFR Probability field at times loses all pixelation.  During this time (around 1000 UTC), model data (in the form of low-level saturation in the Rapid Refresh Model) are contributing to the IFR Probability Field, but satellite data are not because of high-level cirrus.  The animation, below, of the Nighttime Fog Brightness Temperature Difference (10.3 µm – 3.9 µm), confirms the presence of cirrus (they appear grey/black in the color enhancement).  It also suggests why that field alone rather than a fused field such as GOES-R IFR Probability can struggle to detect fog in regions of cirrus.

GOES-16 Brightness Temperature Difference Field (10.3 µm – 3.9 µm), 0502-1302 UTC on 15 December 2017 (Click to animate)

Products that use only satellite data, such as the Brightness Temperature Difference field, above, or the Advanced Nighttime Microphysics RGB Product, below, that uses the (10.3 µm – 3.9 µm) Brightness Temperature Difference field as the ‘Green’ component, will always struggle to detect fog in regions of cirrus. Of course, the superb temporal resolution of GOES-16 mitigates that effect, as in this case; it’s obvious in this animation what is going on: a band of cirrus is moving over the fog, but it not likely affecting it.  A single snapshot of the scene, however, might not impart the true character of surface conditions.

Advanced NIghttime Microphysics RGB Composite, 0502-1302 UTC on 15 December 2017 (Click to enlarge)

Screencapture of WFO PIH (Pocatello Idaho) Website from 1320 UTC on 15 December 2017 (Click to enlarge)