Monthly Archives: April 2016

Low Ceilings and Reduced Visibilities over the Upper Midwest

IFRP_0515_1315anim

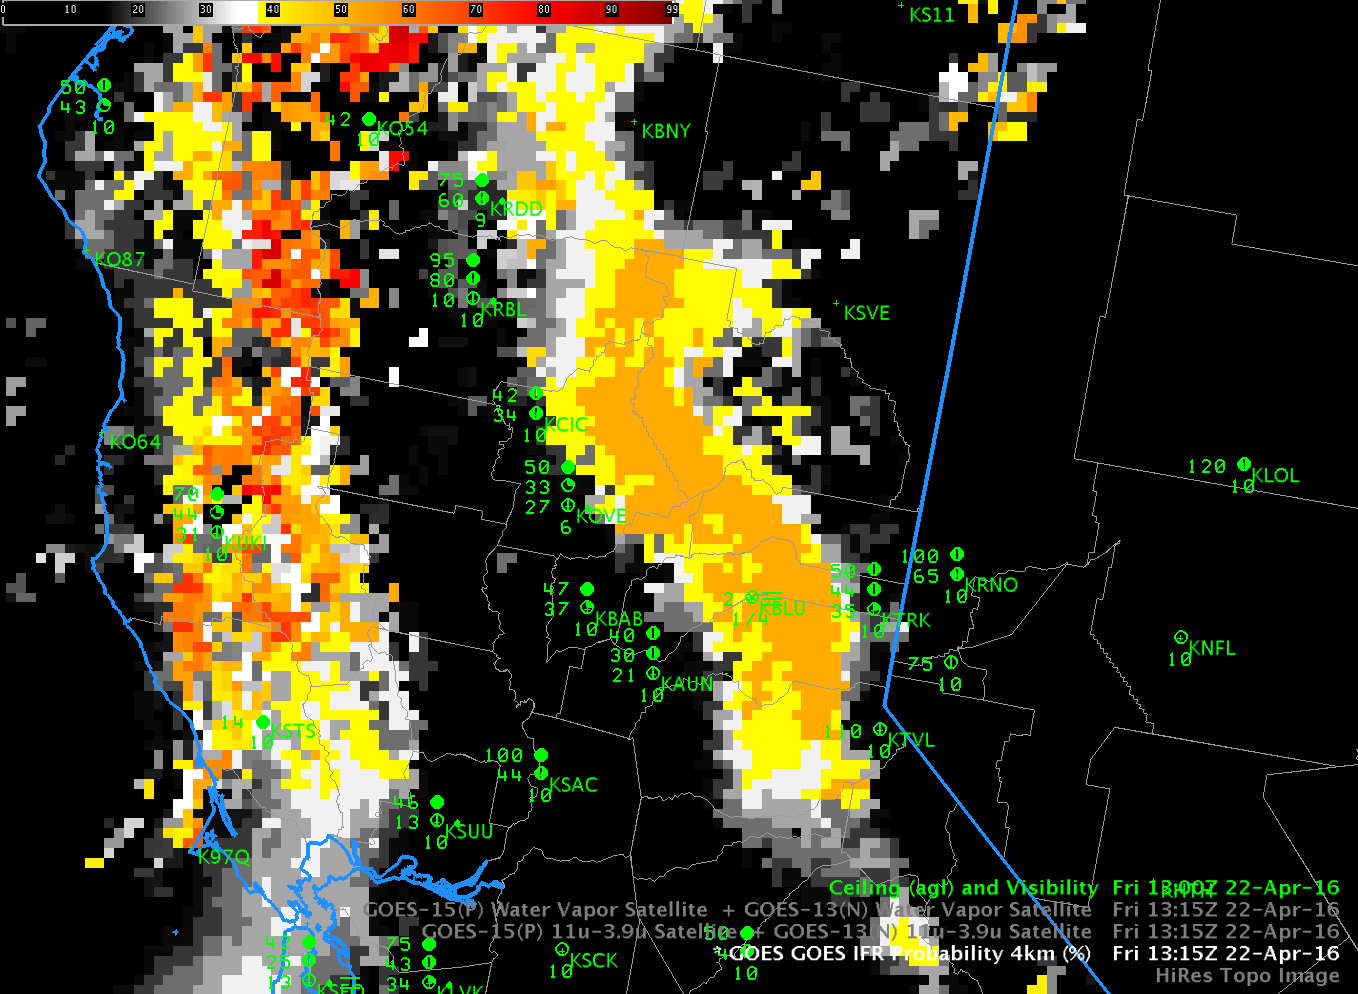
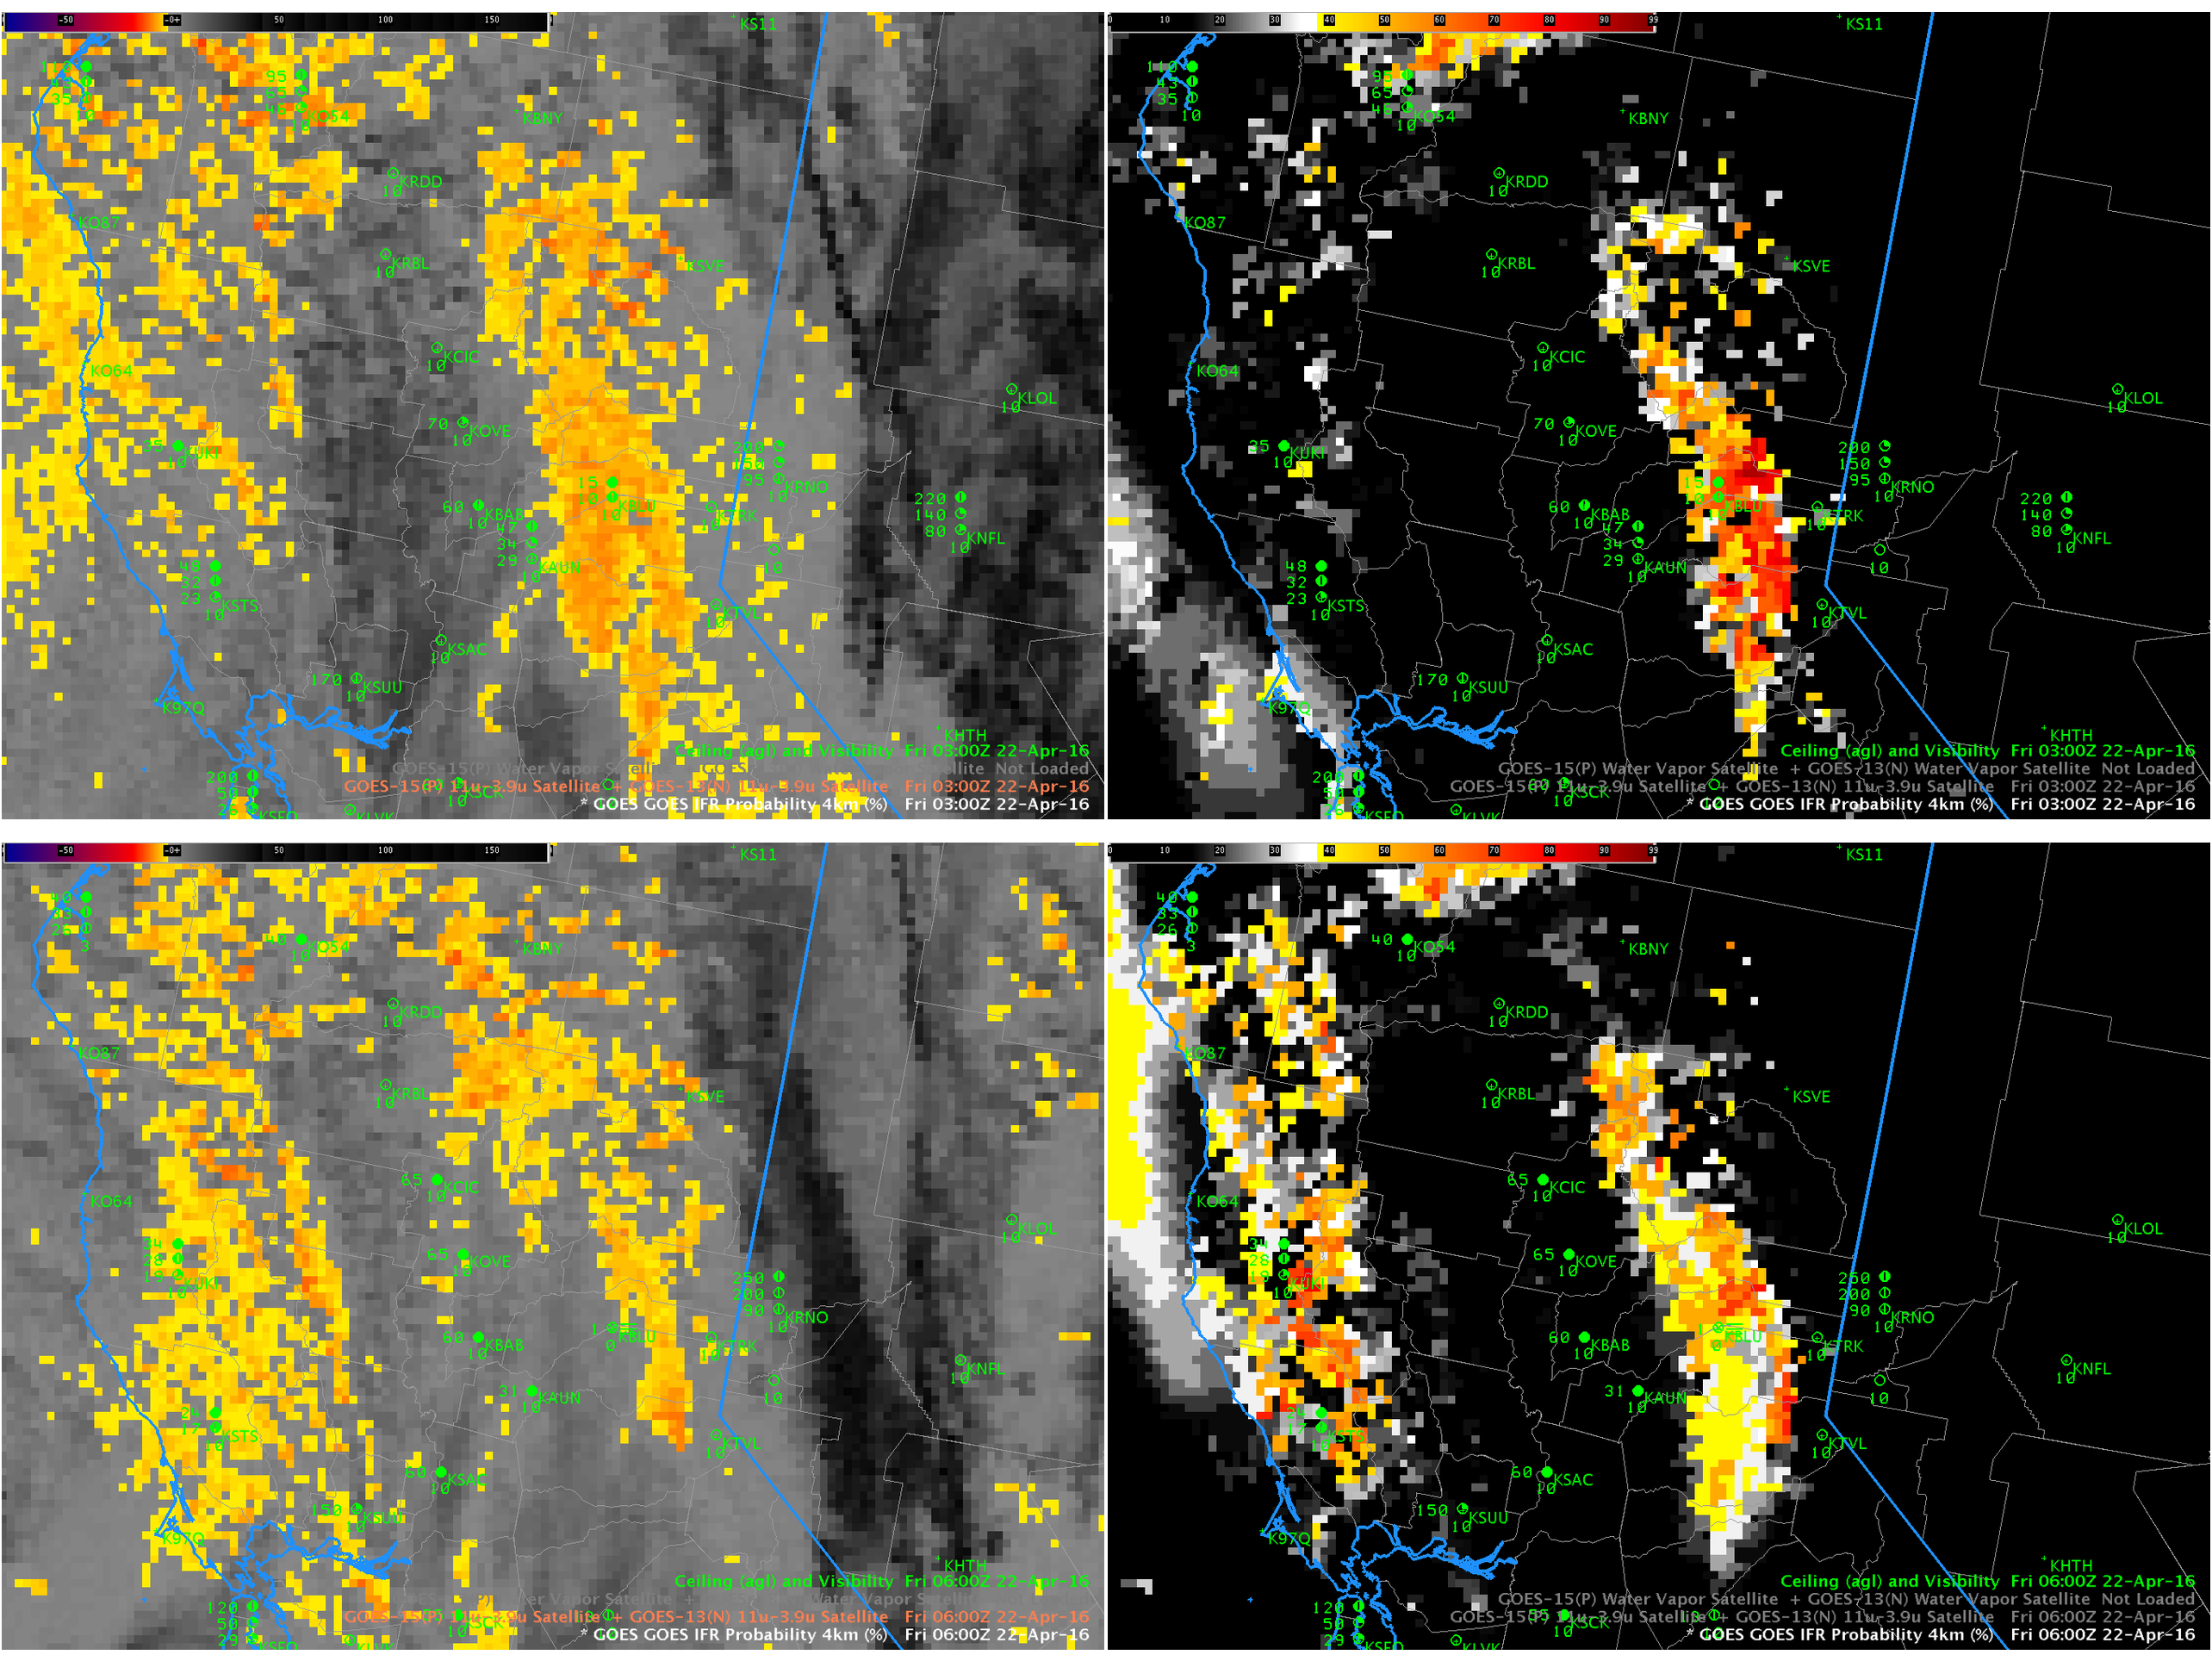
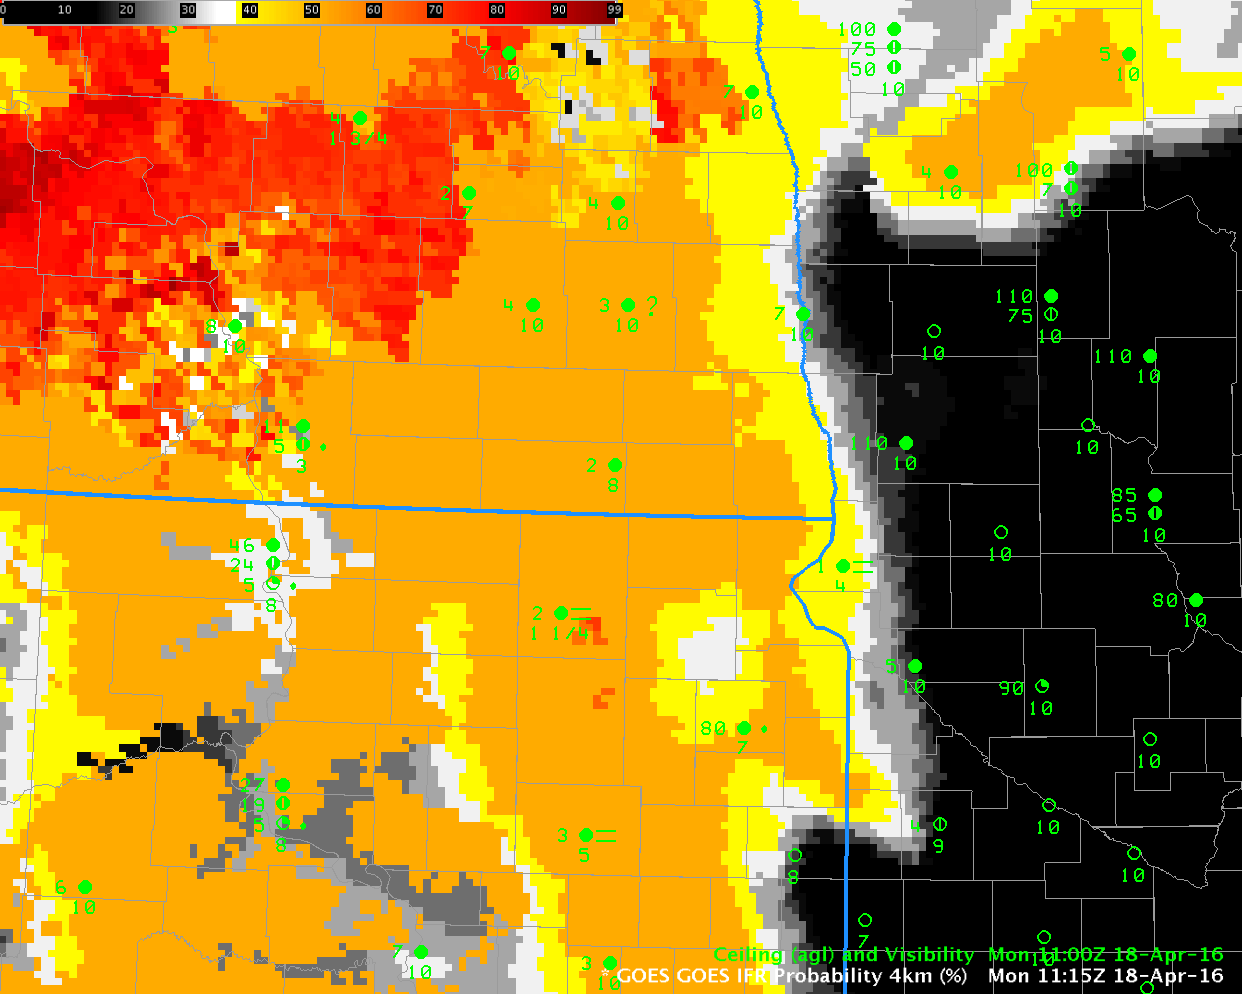
GOES-R IFR Probability, 0515-1315 UTC on 26 April, with surface observations of ceilings and visibility (Click to enlarge)

GOES-R IFR Probability fields, above, expand southwestward across the upper midwest as ceilings lower and visibilities reduce.  The fields offered quick guidance on where the lowest ceilings were occurring and how the field of low clouds was evolving.  After sunrise (1215 and 1315 UTC imagery), IFR Probability values increased but continued to show a coherent signal over the region of lowest ceilings and smallest visibility.

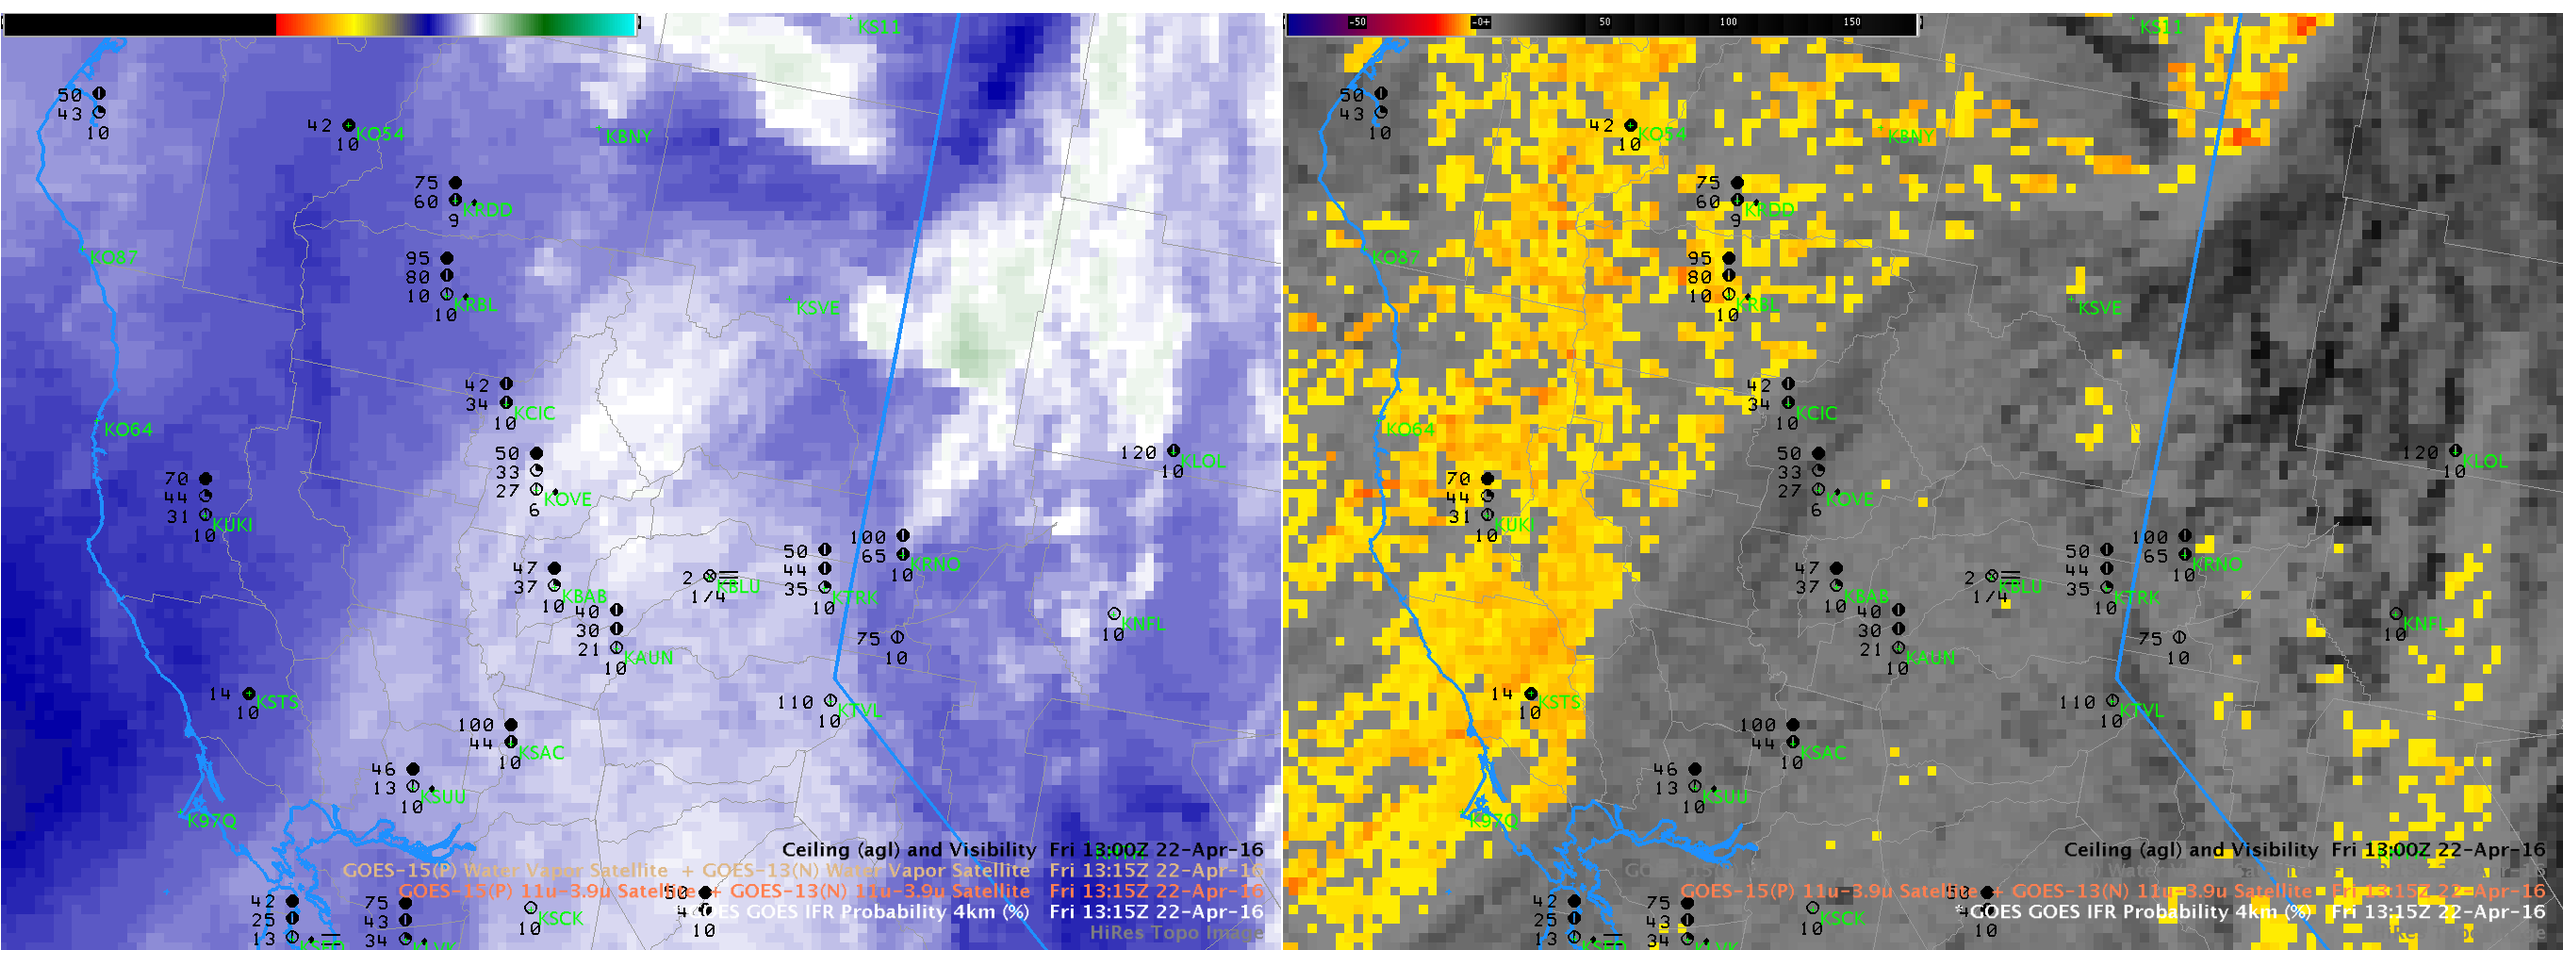
The Brightness Temperature Difference fields for the same times, below, have structures that have echoes in the IFR Probability fields. The depiction of low ceilings and visibilities associated with the largest brightness temperature difference values (the deepest orange-red in the enhancement) is lost, however, as reflected 3.9 µm radiation alters the brightness temperature difference field. By 1315 UTC, the end of the animation, only the IFR Probability field is giving useful information about the low ceilings and reduced visibilities.

BTD_0515_1315anim

GOES-13 Brightness Temperature Difference (10.7 µm – 3.9 µm) Fields, hourly from 0515 through 1315 UTC, 26 April 2016 (Click the enlarge)

Multiple Cloud Layers and Topography

IFR_1315_22Apr2016

GOES-R IFR Probability Fields, 1315 UTC on 22 April 2016, along with surface observations of ceilings and visibilities (Click to enlarge)

The 1315 UTC image of GOES-R IFR Probabilities, above, shows an axis of higher probabilities aligned with the topography of the Sierra Nevada. Note that Blue Canyon (KBLU) is the sole station reporting IFR Conditions. Did conventional satellite data capture this event? The Water Vapor (6.5µm) and Brightness Temperature Difference fields (10.7µm – 3.9µm), below, do not show evidence of low clouds;  indeed, the cirrus signature in the water vapor must mask any satellite observation of low clouds banked along the Sierra Nevada. Thus a fused product that combines model data and satellite data (such as IFR Probability fields) must be used, and the relatively flat nature of the IFR Probability field above confirms that Rapid Refresh information on low-level saturation is the reason why IFR Probability values are elevated along the mountains.

WV_BTD_1315_22Apr2016

GOES-15 Water Vapor (6.5 µm), left, and GOES-15 Brightness Temperature Difference Field (10.7 µm – 3.9 µm), right, at 1315 UTC 22 April 2016 (Click to enlarge)

IFR Probability Fields earlier in the night did have a satellite component to them. The values at 0300 and 0600, below, show the gradual encroachment of cirrus from the south and west over the low clouds along the Sierra Nevada. After 0600 UTC, only model data were used over the Sierra as high-level cirrus blocked the satellite view.

IFR_BTD_03_06_22Apr2016

Brightness Temperature Difference (10.7µm – 3.9µm) Fields (Left) and GOES-R IFR Probaility Fields (Right) from 0300 (Top) and 0600 (Bottom) on 22 April 2016 (Click to enlarge)

Reduced Visibilities under multiple cloud layers in the Northern Plains

GIFR_P_1115_18Apr2016

GOES-R IFR Probabilities at 1115 UTC and 1100 UTC surface observations of ceiling and visibility (Click to enlarge)

The image above shows GOES-R IFR Probabilities over North/South Dakota and Minnesota shortly before sunrise on Monday April 18 2016.  There is a distinct difference in the field between western Minnesota and eastern North and South Dakota that occurs because Rapid Refresh model fields (low-level saturation) are used as a predictor of IFR Probability.  Reduced visibilities and ceilings are reported where IFR Probabilities exceed 50% (the orange shading).  In contrast, the window channel and water vapor imagery for the same time, below, gives little indication that fog and low ceilings are present over eastern North and South Dakota:  satellite views of the lowest levels are blocked by mid- and upper-level clouds.   Fusing model data and satellite data into one predictor yields a superior product for detection of low ceilings and reduced visibilities.

3PanelToggle_1115anim.IR4IR3IFRP

GOES Infrared imagery (10.7 µm and 6.5 µm) and GOES-R IFR Probability fields, 1115 UTC on 18 April (Click to enlarge)

Fog along the Gulf Coast in Louisiana

GOESBTD_0245_1245anim_05Apr2016

GOES-13 Brightness Temperature Difference Fields, every two hours from 0245 to 1245 UTC, 5 April 2016 (Click to enlarge)

Fog developed along the Gulf Coast of western Louisiana overnight. Brightness temperature difference fields have been used in the past to diagnose the development of fog. This capability exists because water-based clouds, such as stratus, have different emissivity properties at 3.9 µm and 10.7 µm. A water-based clouds does not emit 3.9 µm radiation as a blackbody (but it does emit 10.7 µm radiation as a blackbody). Consequently, the computed temperature of the cloud based on the detected 3.9 radiation is cooler than the temperature computed based on the detected 10.7 radiation. The animation above shows the evolution of the brightness temperature difference field, and the field is characterized by a lot of scattershot signal. Some river valley can be inferred in the signal, but the region of fog over southwestern Louisiana does not stand out.

In contrast, the GOES-R IFR Probability field, below, diagnoses an initially isolated region of enhanced IFR probabilities near stations that are reporting reduced ceilings/visibilities.  The enhanced IFR Probabilities develop over southwestern Louisiana and expand outward from there (a second region develops south of Houston TX).  Regions where IFR conditions do not develop have very low IFR Probabilities that persist with time.

GOESIFR_0445_1230anim_05Apr2016

GOES-R IFR Probability Fields, every 2 hours from 0445 to 1230 UTC, 5 April 2016 (Click to enlarge)

GOES-R Cloud Thickness relates 3.9 µm emissivity to cloud thickness based on historical relationships between that value and sodar observations off the west coast of the USA. The value is not computed during twilight conditions on either side of sunrise and sunset, but  the last observation taken before sunrise, shown below, is related to dissipation time according to this scatterplot. Cloud Thickness on the morning of 5 April 2016 was at most 830 feet, suggesting rapid dissipation after sunrise. This is what occurred.

GOESCLDTH_1145_05Apr2016

GOES-R Cloud Thickness, 1145 UTC on 5 April 2016 (Click to enlarge)