Monthly Archives: February 2020

GOES-17 IFR Probability over San Francisco

GOES-17 IFR Probability over San Francisco, 1106 UTC, 14 February 2020, along with surface observations of ceilings and visibility (Click to enlarge)

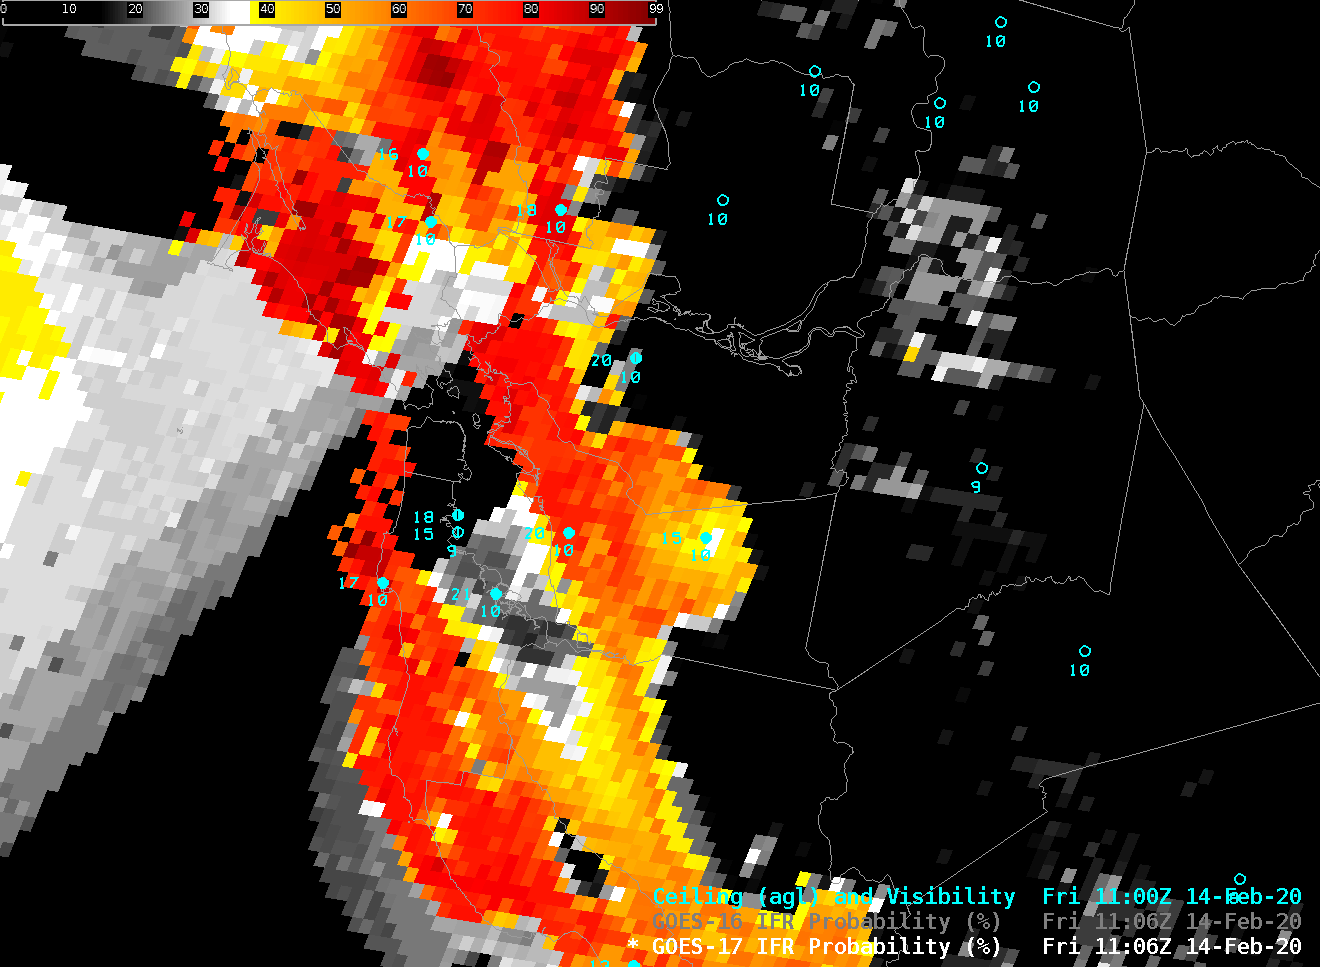
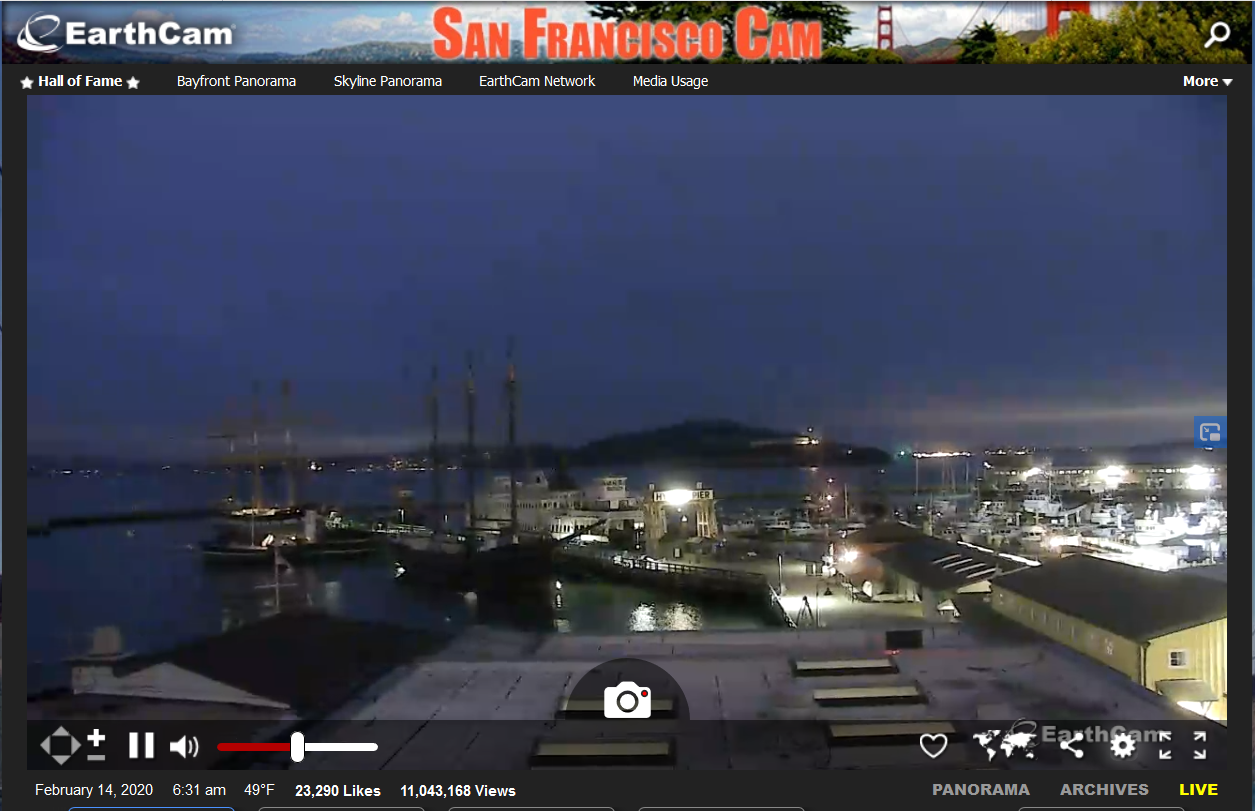
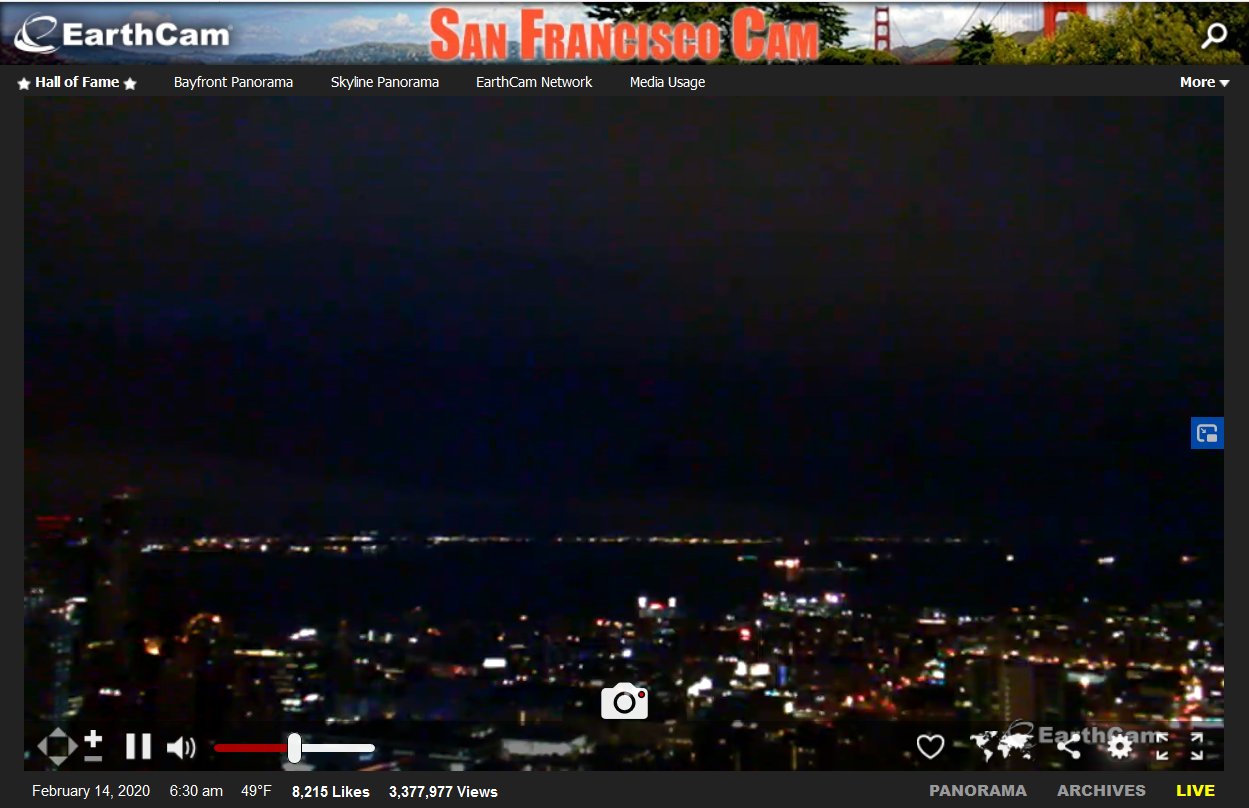
The Cooperative Institute for Meteorological Satellite Studies (CIMSS) is (as noted in this blog post) testing GOES-17 IFR Probability fields in the AWIPS environment in preparation for their deployment to interested offices (via an LDM feed). The GOES-17 field, above, at 1106 UTC, suggests stratus offshore of San Francisco but higher ceilings over the city and the bay. Webcam views of the city (source), and of Alcatraz Island (source), below, from around 630 AM PST, also suggest relatively high ceilings over the city and the bay.

Webcam view of Alcatraz Island in San Francisco Bay, ca. 6:30 AM PST 14 February 2020

GOES-16 is also providing IFR Probability over the west coast of the United States. The toggle below between GOES-17 and GOES-16 shows how the oblique view from GOES-16 and the effects of parallax can perhaps place the probability in the wrong place. Parallax errors shift the clouds towards the sub-satellite point. Parallax effects can be explored at this website.

GOES-17 and GOES-16 IFR Probability fields, 1106 UTC on 14 February 2020 (Click to enlarge)

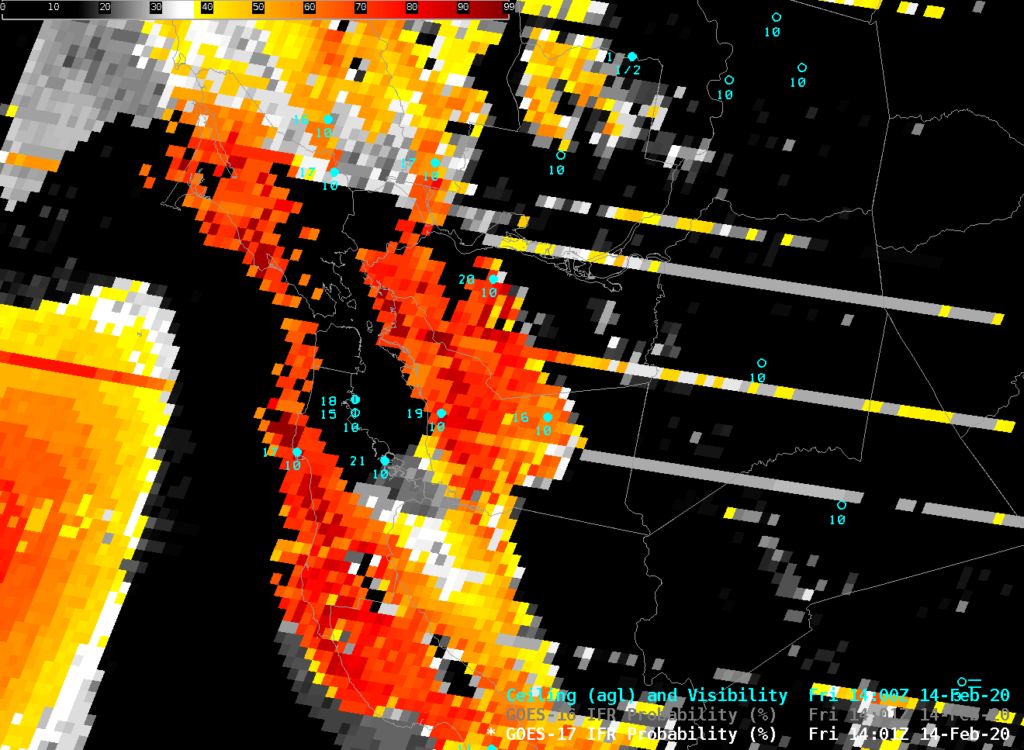
The GOES-17 Advanced Baseline Imager (ABI) is currently showing the effects of inadequate imager cooling by the faulty Loop Heat Pipe on board the spacecraft. At times between 1100 and 1500 UTC, as shown below for 1401 UTC, stripes will appear in the IFR Probability field. Manifestations of the Loop Heat Pipe issue will continue with increasing impact into early March, at which time Eclipse Season will mitigate the issue until April.

GOES-17 IFR Probability over San Francisco, 1401 UTC, 14 February 2020, along with surface observations of ceilings and visibility (Click to enlarge)

GOES-17 IFR Probability fields are available over the CONUS domain at this website.

How to tell at a glance that IFR Probability is model-driven: Pacific Northwest version

GOES-16 IFR Probability at 10-minute timesteps, 1051 to 1721 UTC on 6 February 2020 (Right click to enlarge)

The animation above, of GOES-16 IFR Probability, shows high IFR values in regions over western Washington and Oregon, and those high values correlate spatially very well with surface observations of low ceilings and reduced visibilities.b You will note a couple things in the animation: The field is mostly stationary, with slight adjustments on every hour. Those small changes reflect the change in the model fields (hourly Rapid Refresh) that are used to complement satellite estimates of low clouds in the computation of IFR Probabilities.

On this day, the satellite did not view many low clouds (some are apparent in southwestern Oregon). The flat field (vs. the more pixelated view over southwest OR, and also occasionally in the west-northwest flow coming in off the Pacific) suggests only model data are being used. The stepwise changes on the hour also suggest that.

The animation of the Night Fog Brightness Temperature Difference (10.3 µm – 3.9 µm) field, below, has a signal that is consistent with the lack of observed stratus over the coastal Pacific Northwest. Note also how the Night Fog Brightness temperature difference field flips sign as the Sun comes up and the 3.9 µm signal becomes larger due to reflected solar radiance with a wavelength of 3.9 µm.

GOES-16 Night Fog Brightness Temperature Difference (10.3 µm – 3.9 µm) at 10-minute timesteps, 1051 to 1721 UTC on 6 February 2020 (Right click to enlarge)

GOES-16 views of the Pacific Northwest show fairly large pixel sizes. NOAA/CIMSS scientists have been creating GOES-17 IFR Probability for the past couple weeks, and this product will become available via an LDM field in the near future.

Note that GOES-17 IFR Probability products are available online at https://cimss.ssec.wisc.edu/geocat.