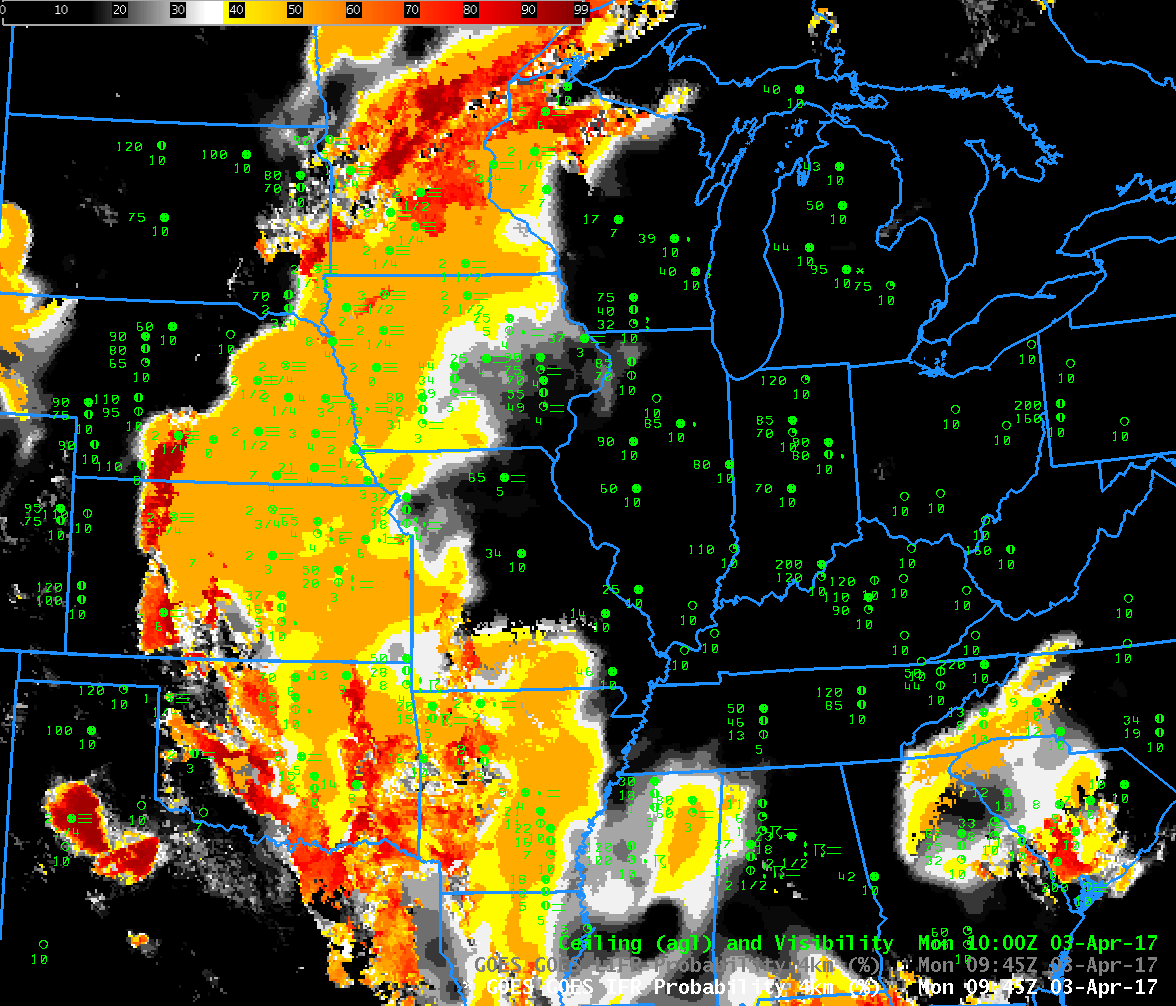
GOES-16 IFR Probability (upper left), GOES-16 ‘Night Fog’ Brightness Temperature Difference (10.3 µm – 3.9 µm, upper right), GOES-16 Nighttime microphysics RGB (lower right), GOES-16 Cloud Thickness (lower left), including surface observations of ceilings and visibility. Click to show animation from 0841 to 1246 UTC on 6 August 2021
Examine the four-panel animation above. Fog with IFR conditions developed over night over North Dakota. IFR Probability fields, upper left in the four-panel, do a credible job of outlining where the restrictions to visibility are (including the low ceilings). Indeed, a strong signal develops in the IFR Probability field before one develops in the Night Fog brightness temperature difference. In addition, there is a strong signal in the brightness temperature difference field (10.3 µm – 3.9 µm) and also in the night time microphysics RGB over northern Minnesota, but observations suggest that the stratiform clouds highlighted there by those two products are not hugging the ground, that is, they are elevated stratus vs. fog. Also note how the signal diminishes as the sun rises, as expected. The bottom left panel shows GOES-R Cloud Thickness, and it suggests that the fog over North Dakota is fairly thin. Rapid burnoff-should occur.
Some of the stations in the Dakotas are reporting visibility restrictions due to smoke. IFR Probability fields do not provide information for that kind of IFR conditions: Smoke detection with infrared imagery is very challenging, and the Rapid Refresh model being used (to identify regions of fog by assessing low-level saturation) does not predict smoke. The image below, taken from the CSPP Geosphere site (link), shows the widespread smoke, and also the patches of stratus and mid-level clouds as depicted in the scene above.
CSPP Geosphere True Color imagery, 1330 UTC on 6 August 2021 (Click to enlarge)
GOES-16 IFR Probability Fields, 1056 UTC – 1546 UTC, on 22 December 2020 (Click to enlarge)
IFR Probability fields from early on 22 December 2020, above, show a region of High Probabilities over northwest Wisconsin, northeastern Minnesota and northwestern Ontario. In general, the observations of IFR conditions (ceilings between 1000 and 3000 feet, visibilities between 1 and 3 miles) match well with the highest IFR Probability. The western edge of the field has characteristics that suggest it becomes more model-defined (in this case, the Rapid Refresh model that supplies the low-level saturation information) with time: the field from western Wisconsin up through Minnesota becomes less and less pixelated with time, as satellite information is lost due to the incursion of higher clouds.
Note also: Lake Superior, warmer than the overlaying atmosphere, is diagnosed as having low probabilities of IFR conditions.
Brightness temperature Difference fields, shown below for the same times, have historically been used to detect low clouds. However, there is little correlation between the fields and the observations of IFR conditions for two principle reasons: Brightness Temperature Difference fields alone do not give information on the cloud base, and IFR conditions require low cloud bases; Higher clouds impede the detection of low-level clouds associated with IFR conditions, and high clouds are overspreading this scene.
The animation below also shows how the Brightness Temperature Difference signal is lost as increasing amounts of solar reflectance become present as the sun rises.
GOES-16 Night Fog Brightness Temperature Difference (10.3 µm – 3.9 µm), 1056 UTC – 1546 UTC, on 22 December 2020 (Click to enlarge)
The toggle below shows GOES-16 IFR Probability and the Night Fog Brightness Temperature Difference (10.3 – 3.9) at 1301 UTC, before sunrise. There are significant regions of low clouds/fog over northeastern Minnesota that have little signal in the brightness temperature difference field — but there is a strong signal there in the IFR Probability field.
GOES-16 IFR Probability and GOES-16 Night Fog Brightness Temperature Difference (10.3 µm – 3.9 µm), 1301 UTC on 22 December 2020 (Click to enlarge)
By 1501 UTC, below, when the sun is above the horizon, reflected solar radiation means that the Night Fog Brightness Temperature Difference default enhancement is no longer appropriate to detect low clouds. However, IFR Probability continues to outline regions of low clouds and fog.
GOES-16 IFR Probability and GOES-16 Night Fog Brightness Temperature Difference (10.3 µm – 3.9 µm), 1501 UTC on 22 December 2020 (Click to enlarge)
GOES-R IFR Probability fields blend the strengths of satellite detection of clouds with the strengths of model detection of low-level saturation. In regions of high clouds, where the satellite cannot view low clouds (over northwest Wisconsin, for example), model data nevertheless gives a useful signal. Note also the lower IFR Probabilities over Ontario where low clouds are prevalent. Here, model data allows IFR probabilities to screen out regions of elevated stratus, which clouds are not so important as far as surface visibility restrictions go.
GOES-16 “Red Visible” Band 2 0.64 µm imagery at 1502 UTC on 21 November 2018 (Click to enlarge)
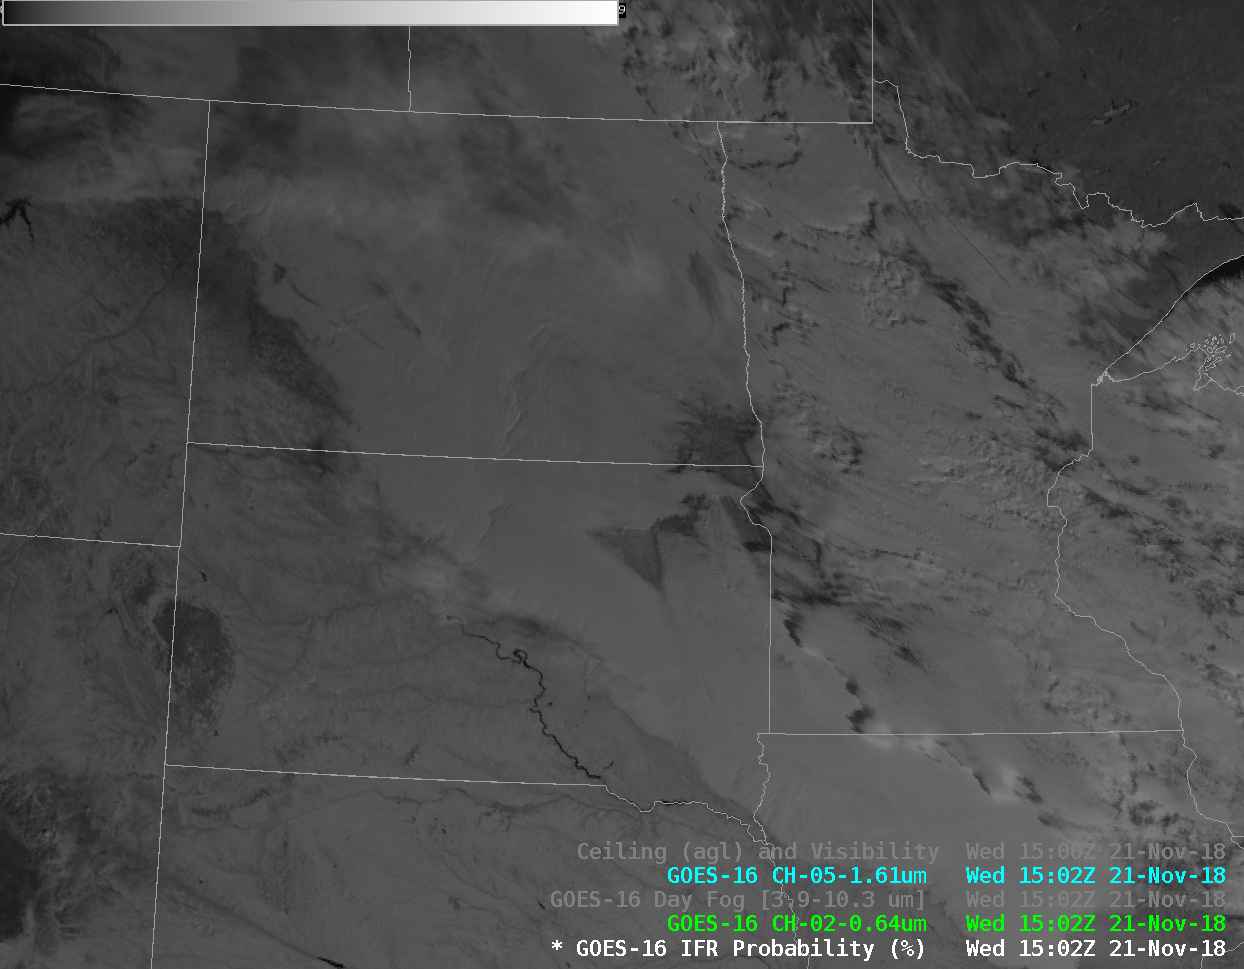
Consider the GOES-16 Visible (Band 2, 0.64 µm) Image above. Where is the fog in this image? Certainly you can tell where clouds exist, and if animated, you could identify snow on the ground (because it wouldn’t move like clouds do). Alternatively, you could toggle between the visible and the Snow/Ice band (Band 5, 1.61 µm), below; regions of snow/ice — such as in western North Dakota, or northeastern South Dakota, or Ontario appear bright in the 0.64 µm but dark in the 1.61 µm.
GOES-16 “Red Visible” Band 2 0.64 µm imagery and “Snow/Ice” Band 5 1.61 µm imagery at 1502 UTC on 21 November 2018 (Click to enlarge)
The Day Fog Brightness Temperature Difference product (3.9 µm – 10.3 µm) highlights low clouds. Stratus clouds with water droplets are scatterers of incoming solar radiation. The clouds over Minnesota and Iowa appear to be composed of much smaller water droplets, however, because they are so much warmer — the brightness temperature difference is much larger. Smaller droplets are better scatterers of incoming solar radiation. The image below shows the field, also at 1502 UTC on 21 November. Are there any differences in this field that suggests fog might be present in one location, but not in the other?
GOES-16 Day Fog Brightness Temperature Difference (3.9 µm – 10.3 µm) imagery at 1502 UTC on 21 November 2018 (Click to enlarge)
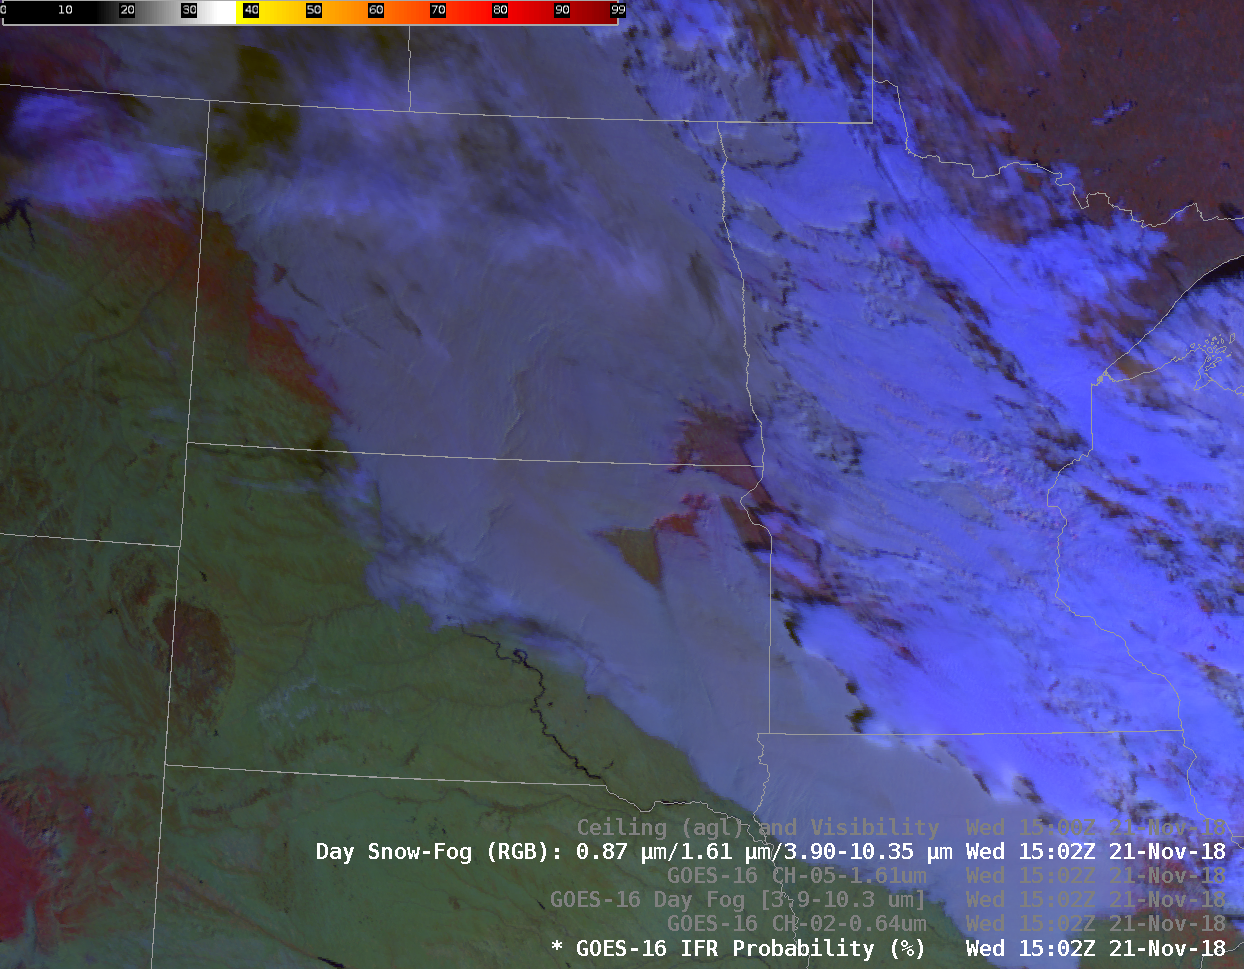
The Day Snow Fog RGB composite, below, highlights regions of low clouds, snow/ice, and higher clouds. Snow (and clouds made of ice) are shaded red, low clouds are shades of grey/blue. Where is the fog?
GOES-16 Day Snow Fog RGB imagery at 1502 UTC on 21 November 2018 (Click to enlarge)
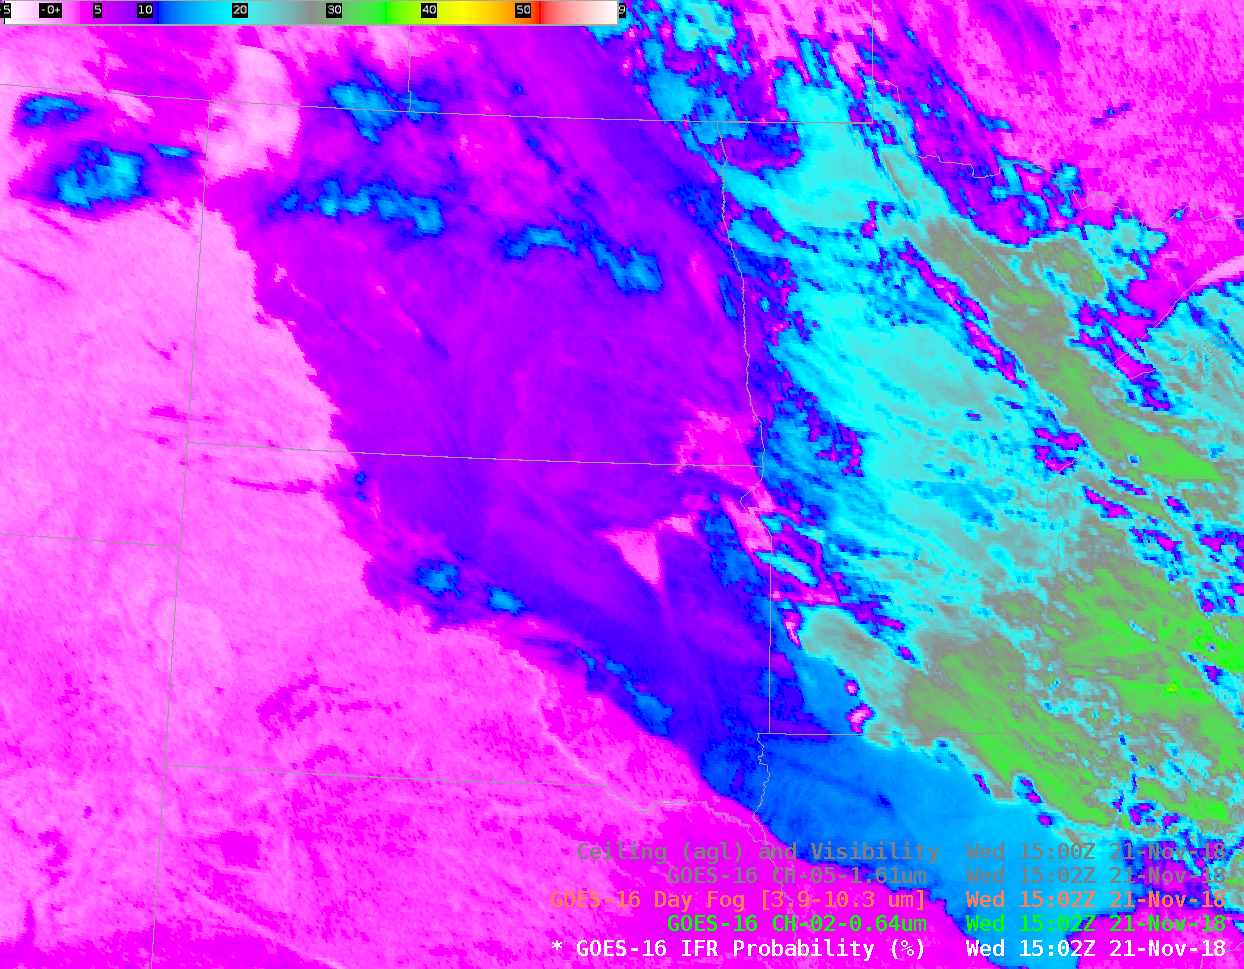
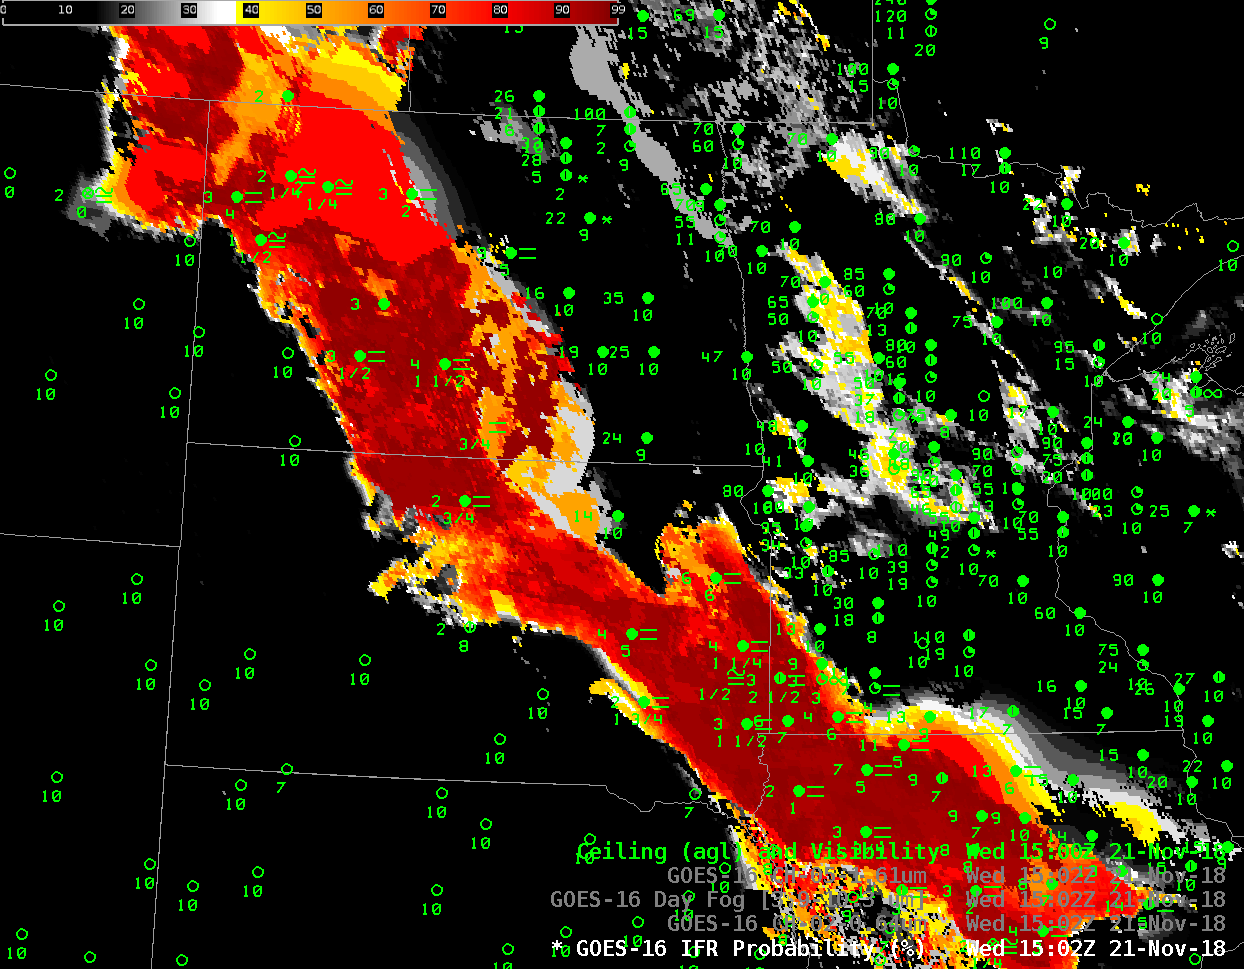
GOES-R IFR Probability Fields are a better predictor of where IFR conditions (that is, reduced visibility and lowered ceilings as might occur with fog) are occurring. It combines satellite information and low-level informatio0n about saturation (from the Rapid Refresh model). This fusing of data accentuates a satellite strength (detection of low clouds made up of water droplets — that is, stratus) and the model strength (namely, where are the low-level saturated?) In the image below, fog and high probabilities of IFR conditions neatly overlap. This toggle is between the visible, Day Snow-Fog RGB and IFR Probability field.
GOES-16 IFR Probability at 1502 UTC on 21 November 2018 along with surface observations of ceilings and visibility (Click to enlarge)
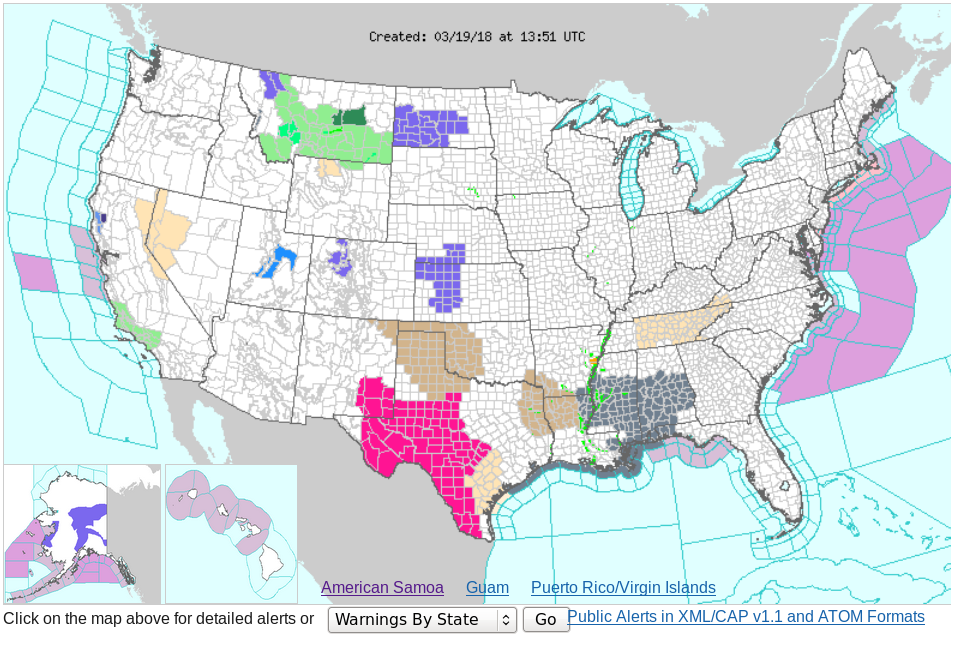
GOES-16 IFR Probability fields, every 10 minutes, from 0202 through 1412 UTC on 19 March 2018 (Click to animate)
Dense Fog Advisories (click here for graphical image from this site) and widespread IFR Conditions (click here for graphical image from this site) occurred as a nearly-occluded system spun slowly eastward across the central part of the United States on 19 March 2018. (Surface; 500-hPa). GOES-16 IFR Probability, shown above, (Click the image to see the animation) outlines two large areas where consistent IFR conditions develop/persist: the upper Plains, in states around Nebraska, and the Deep South.
The GOES-16 Night Fog Brightness Temperature Difference field (10.3 µm – 3.9 µm), animation shown below, historically has been used to identify low stratus that is assumed to be fog at night. That detection suffers when high clouds are present (consistently on the morning of 19 March over Nebraska and surrounding states; occasionally over the Deep South as convection expels high-level cirrus into the atmosphere). Because IFR Probability fuses satellite data with Numerical Model estimates of low-level saturation (from the Rapid Refresh Model), it retains a strong signal of fog in regions where multiple clouds layers prevent the satellite from observing observed low stratus causing IFR conditions, such as over Nebraska, or over Mississippi at 0607 UTC.
GOES-16 Night Fog Brightness Temperature Difference (10.3 µm – 3.9 µm), 0202-1412 UTC on 19 March 2018 (Click to animate)
Note that there exists a Brightness Temperature Difference signal over the High Plains of Texas and New Mexico at, for example, 0800-0900 UTC. (See below). Persistent drought exists in that region (linked image from this site) and the dryness can alter the relative emissivities of the soils so that a signal develops (Click here for an earlier example). There are no clouds in this region; the Rapid Refresh model shows very dry air and the IFR Probability algorithm correctly diagnoses very small probabilities of IFR conditions.
GOES-16 Night Fog Brightness Temperature Difference (10.3 µm – 3.9 µm), 0802-0902 on 19 March 2018 (Click to enlarge)
GOES-16 ‘Fog Detection’ Channel Difference (10.3 µm – 3.9 µm), 0912 – 1132 UTC, 29 June 2017 (Click to enlarge)
GOES-16 data posted on this page are (still!) preliminary, non-operational data and are undergoing testing
The 16 channels on the GOES-R Series Advanced Baseline Imager (ABI) allow for many different channel combinations that can be used to detect atmospheric phenomena. The animation above shows the traditional method for detecting low stratus: the brightness temperature difference between the shortwave infrared (3.9 µm) and the cleanest longwave infrared (10.3 µm) windows. Cloudtops composed of water droplets are highlighted in the animation because they do not emit 3.9 µm radiation as a blackbody, but do emit 10.3 µm radiation as a blackbody; thus, the brightness temperature difference at night (when no reflected solar radiation at 3.9 µm is present) is positive. The range of the colorbar in the above animation is from -50 to +50 C; stratus appears as green over much of northern Wisconsin, Minnesota and North Dakota. Higher cirrus clouds are cyan, and they interfere with the satellite detection of low clouds, especially over eastern North Dakota where IFR conditions were widespread (source), and where a Dense Fog Advisory existed. Note the apparent disappearance of the fog signal — in green — as the sun rises. Increasing amounts of reflected solar radiation are causing the brightness temperature difference value to switch sign from (10.3 µm – 3.9 µm) > 0 at night (because of emissivity differences) to (10.3 µm – 3.9 µm) < 0 during the day (because of solar reflectance).
The ‘Nighttime Microphysics Advanced RGB’ is also used as a fog detection device. In the animation below, low stratus (and by inference, fog) is highlighted in cyan, a signal that comes mostly from the ‘green’ part of the RGB, namely the Brightness Temperature Difference as shown above. Because the two products are linked by the 10.3 – 3.9 brightness temperature difference, shortcomings in that product as far as fog detection affect the RGB. Note how the fog signal erodes over Minnesota/Wisconsin as the sun rises, and how it is obscured by high clouds (dark purple/magenta) over North Dakota.
Note: GOES-R IFR Probabilities are computed using Legacy GOES (GOES-13 and GOES-15) and Rapid Refresh model information; GOES-16 data will be incorporated into the IFR Probability algorithm in late 2017
GOES-R IFR Probability fields, shown for this event below, were designed to mitigate detection issues noted above. Where high clouds are present, meaning the satellite cannot detect low clouds, information about low-level saturation from the Rapid Refresh is used to assess whether or not fog is likely. That low-level information from the model also can be used to distinguish between fog and elevated stratus that can look very similar from the top, as a satellite views it. The fusing of model and satellite data makes for a product that has better statistics in detecting low ceilings and reduced visibilities.
At the end of the two animations above, for example, how confident will a satellite analyst or forecaster be that there is dense fog over eastern North Dakota? How about the analyst/forecaster using IFR Probability fields? IFR Probabilities maintain a signal for fog over the entire region from North Dakota to Wisconsin, even through sunrise and under high clouds.
GOES-R IFR Probabilities, 0915 to 1115 UTC on 29 June 2017 (Click to enlarge)
GOES-13 Brightness Temperature Difference and GOES-R IFR Probability at 0615 UTC on 24 April 2017, along with surface observations (Click to enlarge)
Note: GOES-R IFR Probabilities are computed using Legacy GOES (GOES-13 and GOES-15) and Rapid Refresh model information; GOES-16 data will be incorporated into the IFR Probability algorithm in late 2017.
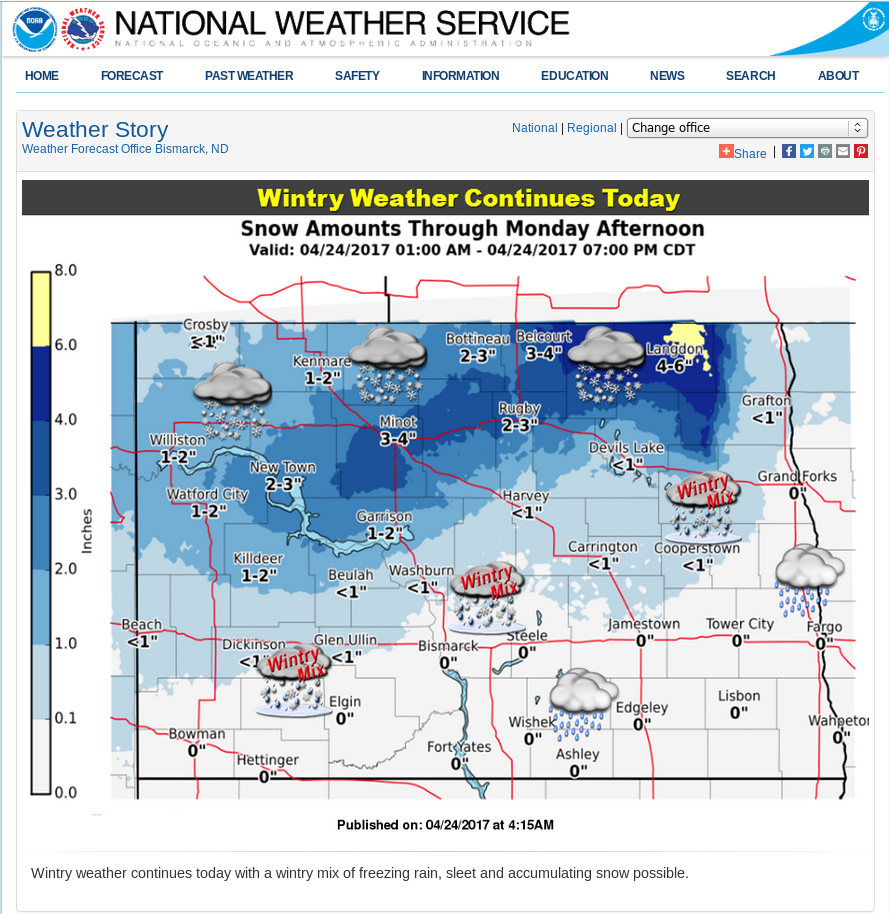
A late-season snow storm was affecting North Dakota on Monday 24 April. Snow amounts were modest and IFR Conditions were widespread. The multiple clouds layers associated with the storm meant that satellite detection of low clouds/fog was difficult. The toggle above shows Brightness Temperature Difference (3.9 µm – 10.7 µm) and GOES-R IFR Probabilities. The IFR Probability field distinctly outlines the region where visibilities and ceilings are restricted by the storm. It is very difficult to discern from the Brightness Temperature Difference product where low clouds/fog exist. Because the IFR Probability field incorporates surface information (that is, low-level saturation as predicted by the Rapid Refresh Model), it is better able to alert a forecaster to the presence of IFR or near-IFR conditions.
Note: GOES-R IFR Probabities continue to be computed with GOES-13 and GOES-15 data only. Incorporation of GOES-16 data will occur near the end of 2017.
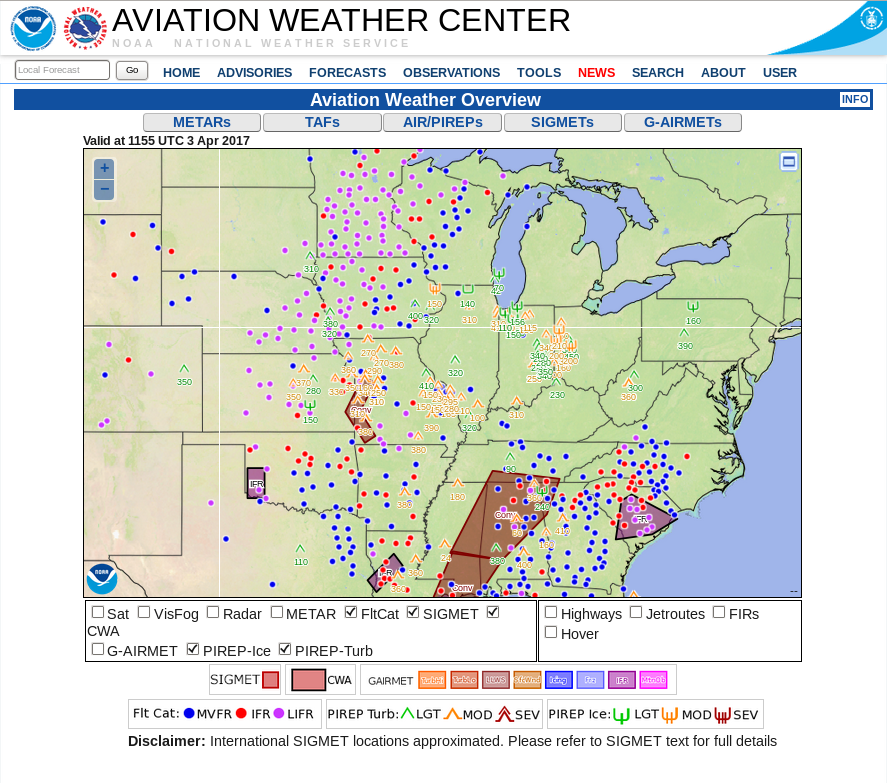
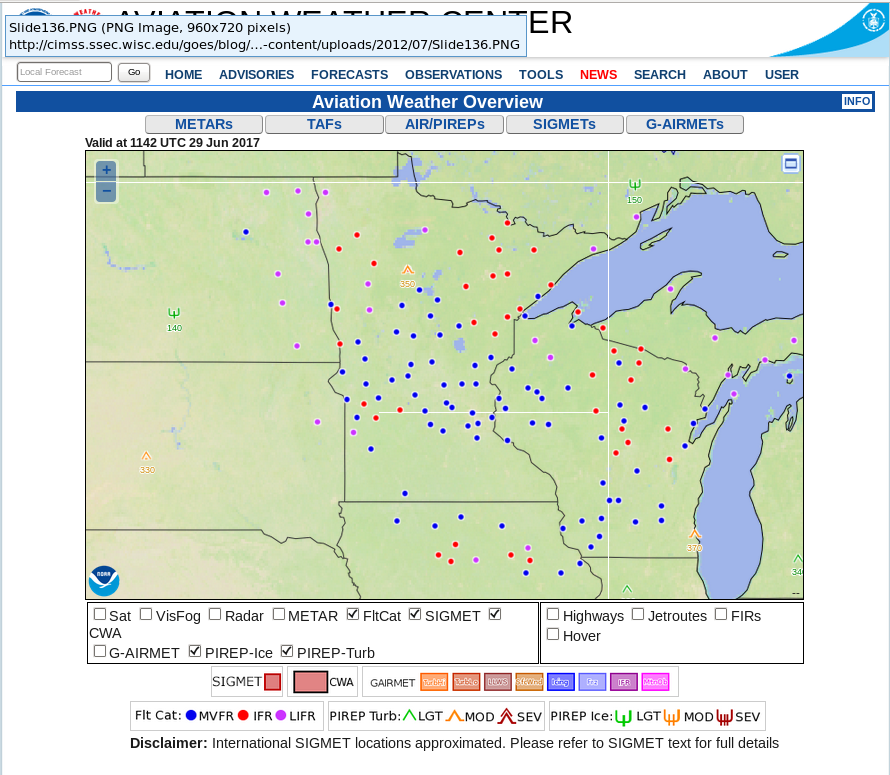
Front Page from the Aviation Weather Center webpage (http://www.aviationweather.gov) at 1155 UTC 3 April 2017. Stations with IFR / LIFR conditions are indicated by red / magenta. (Click to enlarge)
A wide swath of Dense Fog Advisories were hoisted over the central part of the United States on Monday 3 April 2017 in association with southerly flow and a variety of fronts. The Aviation Weather Center front page (screen-captured, as shown above), showed Low IFR and IFR conditions throughout the central Plains.
The development of the Low IFR Conditions coincided with an increase in Low IFR Probabilities during the night, as shown by the stepped animation below showing data from 0200, 0500 and 0915 UTC. Low IFR Probabilities over Iowa, Nebraska and Kansas, part of a smooth yellow field, are driven solely by Rapid Refresh Data in a region where high and mid-level clouds are preventing the satellite from observing low clouds.
GOES-R Low IFR Probabilities at 0200, 0500, 0915 UTC on 3 April 2017 (Click to enlarge)
GOES-R IFR Probabilities, below, generally cover the same region as Low IFR Probabilities shown above, but have larger values. As with the Low IFR Probabilities, model data only are determining the probabilities over much of Iowa, Nebraska and Kansas, a region where the probability field is uniform and flat, especially at the end of the animation.
GOES-R IFR Probabilities at 0200, 0500, 0915 UTC on 3 April 2017 (Click to enlarge)
GOES-R Low IFR Probability is shown below with surface observations superimposed. There is a good relationship between high probabilities and observed IFR and Low IFR conditions.
GOES-R IFR Probability fields, 0945 UTC on 3 April 2017 along with surface observations of ceilings and visibilities at 1000 UTC (Click to enlarge)
Note: GOES-R IFR Probabities continue to be computed with GOES-13 and GOES-15 data only. Incorporation of GOES-16 data will occur near the end of 2017.
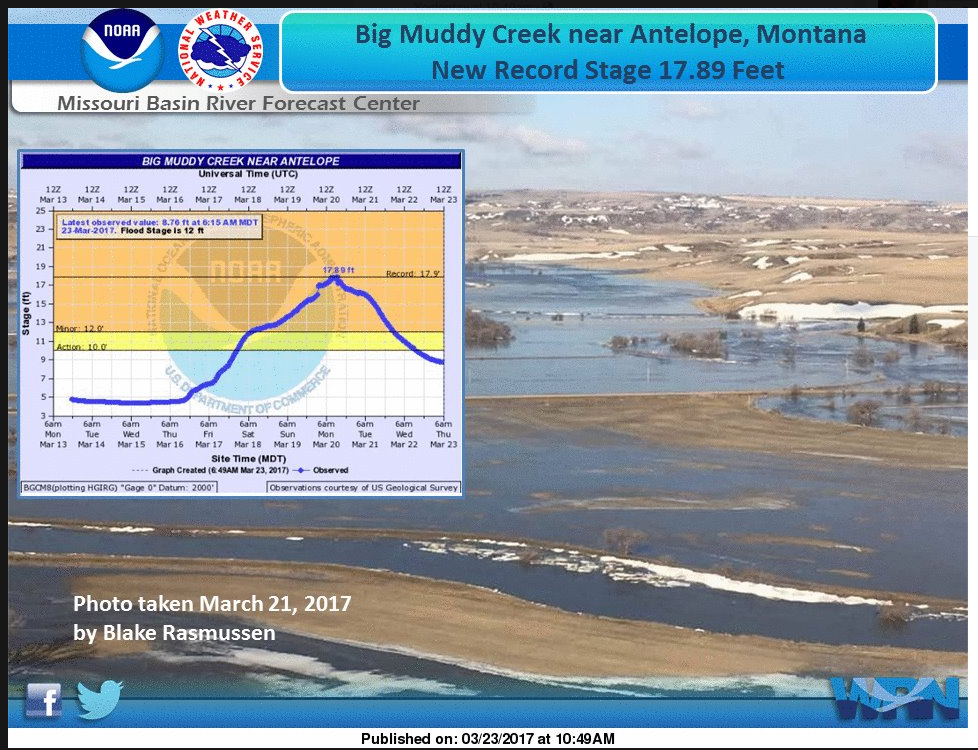
GOES-16 Visible Imagery showed the fog speedily moving down Big Muddy Creek. An animation using GOES-13 Visible imagery (0.64 µm) is shown below. The GOES-16 CONUS cadence is every five minutes; it is every 15 minutes with GOES-13, except when Full Disks are being scanned (14:45 UTC) or when housekeeping is occurring (15:30 UTC).
GOES-13 and GOES-16 visible data both show quick movement of the fog. For this case, it was harder to judge motion from the IFR Probability fields. This could be related to Infrared and model resolution; the creek valley might be too narrow for the satellite infrared data and for the model.
GOES-13 VIsible (0.64 µm) imagery, 1415-1615 UTC. Sheridan County Montana is outlined in the first image. Fog advancing down Big Muddy Creek is apparent
GOES-R IFR Probability Fields, computed from GOES-13 and Rapid Refresh output, 0215-1115 UTC on 1 June 2016 (Click to enlarge)
Dense Fog Advisories were issued over parts of Iowa and Minnesota early on 1 June 2016 (see map below). The fog developed over wet ground left in the wake of convection that moved through the region late in the day on 30 May/early on 1 June (Precipitation totals available here). GOES-R IFR Probability fields, above, show the two areas of dense fog developing. The region over Minnesota was characterized a lack of high clouds — the satellite could view the developing fog, and satellite parameters were included in the computation of IFR Probability. Consequently, the IFR Probability values were larger.
Fog over Iowa initially developed under mid-level clouds behind departing convection. IFR Probability fields in that case show a flatter distribution because horizontal variability is controlled mostly by model fields that are smooth; additionally, IFR Probability values are somewhat reduced because satellite predictors cannot be used. By 0815 UTC, however, mid- and high-level clouds have dissipated, and the satellite has a unobstructed view of the fog/stratus. Satellite predictors could then be used and IFR Probabilities increased, and the field itself shows more horizontal variability as might be expected from the use of nominal 4-km resolution satellite pixels.
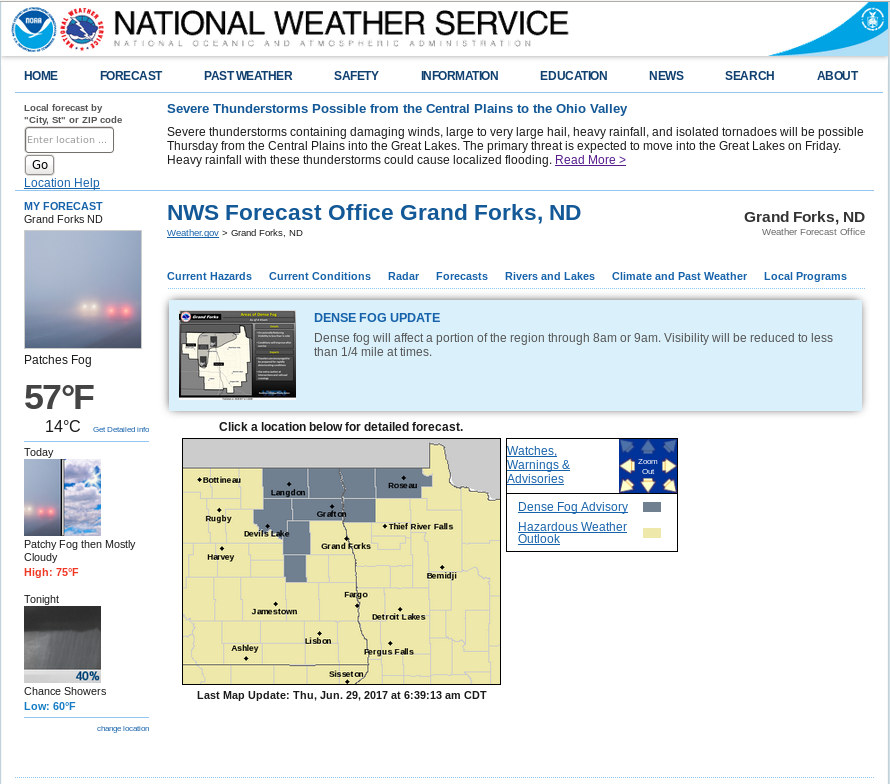
Screen Capture of weather.gov website at 1129 UTC on 1 June. Dense Fog Advisories are indicated over eastern Iowa and northeast Minnesota (click to enlarge)
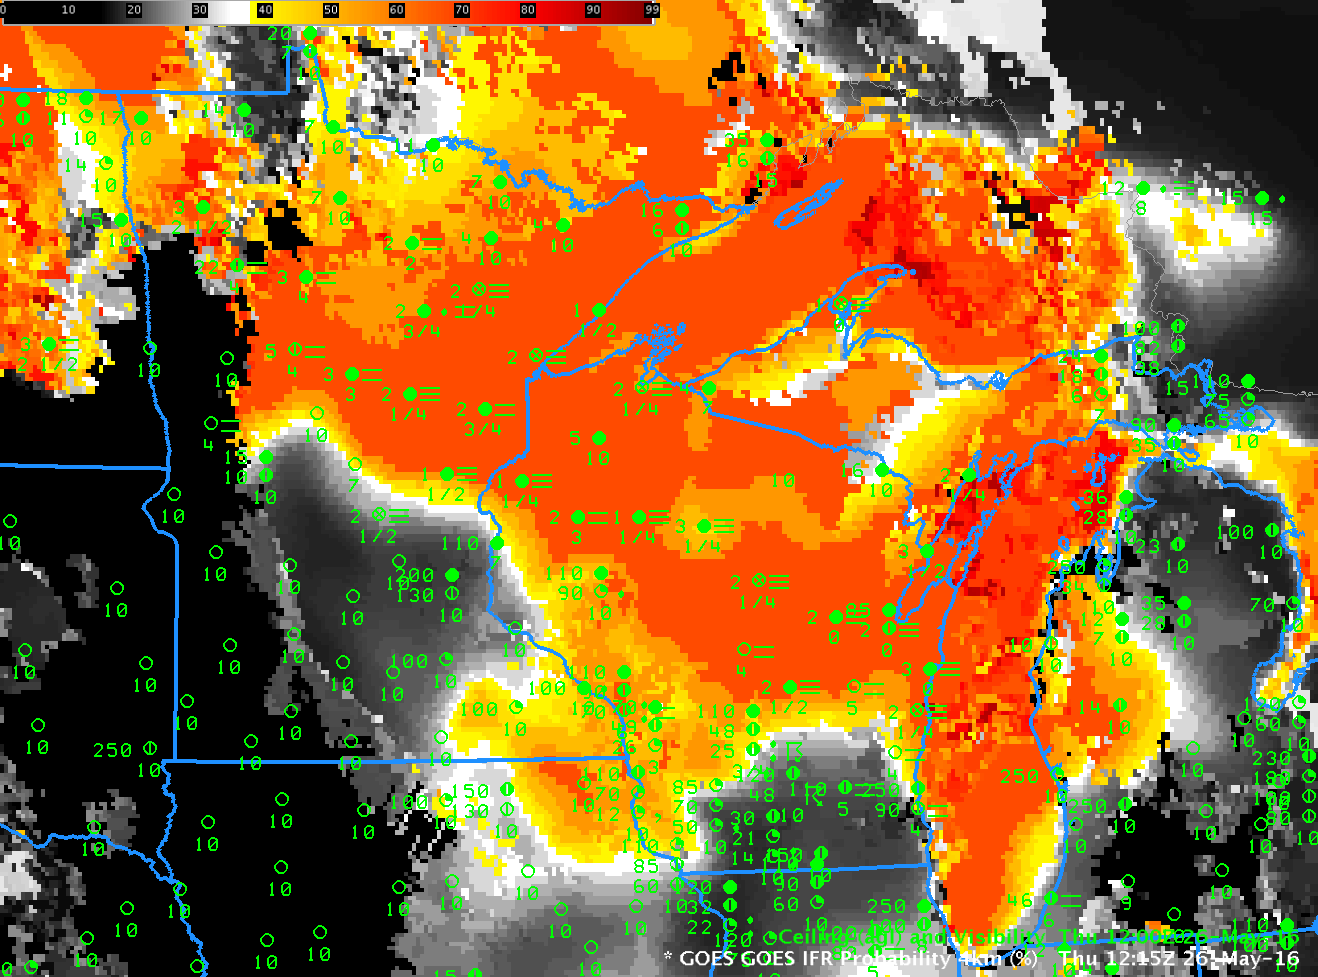
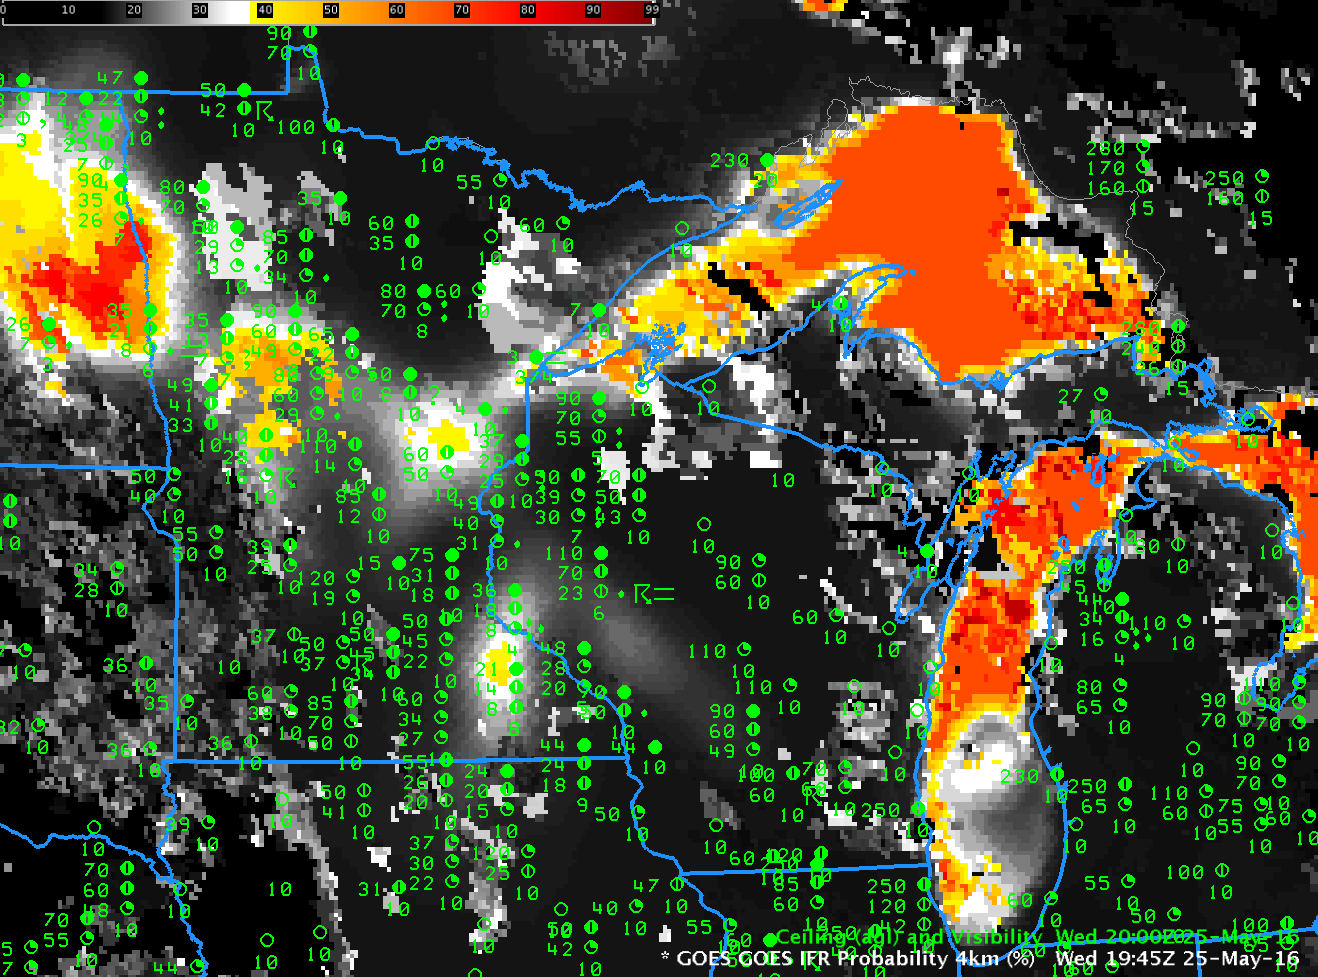
GOES-R IFR Probability fields computed with GOES-13 and Rapid Refresh Data, 1215 UTC on 26 May 2016 along with surface reports of Ceilings and visibilities (Click to enlarge)
High Dewpoint air (upper 50s and low- to mid-60s) has overrun the western Great Lakes, where water temperatures are closer to the mid 40s. (Water Temperature from Buoy 45007 in southern Lake Michigan). Advection fog is a result, and that fog can penetrate inland at night, or join up with fog that develops over night. The image above shows the extent of low visibilities over the upper Midwest and the IFR Probability field early morning on the 26th of May. Lakes Michigan and Superior are diagnosed as socked in with fog. A similar field from 1945 UTC on 25 May similarly shows very high Probabilities over the cold Lakes. Expect high IFR Probabilities to persist over the western Great Lakes until the current weather pattern shifts.
Brightness Temperature Difference Fields can also show stratus over the Great Lakes, of course, but only if multiple cloud layers between the top of the stratus and the satellite do not exist. Convection over the upper Midwest overnight on 25-26 May frequently blocked the satellite’s view of the advection fog. The toggle below, from 0515 UTC on 26 May, shows how model data from the Rapid Refresh is able to supply guidance on IFR probability even in the absence of satellite information about low stratus over the Lakes.
GOES-13 Brightness Temperature Difference Fields and GOES-R IFR Probability fields, 0515 UTC on 26 May 2016 (Click to enlarge)


