Category Archives: Northern Plains

Dense Fog and Freezing Fog in Montana and North Dakota

IFRP_0315_1300anim_20Jan2016

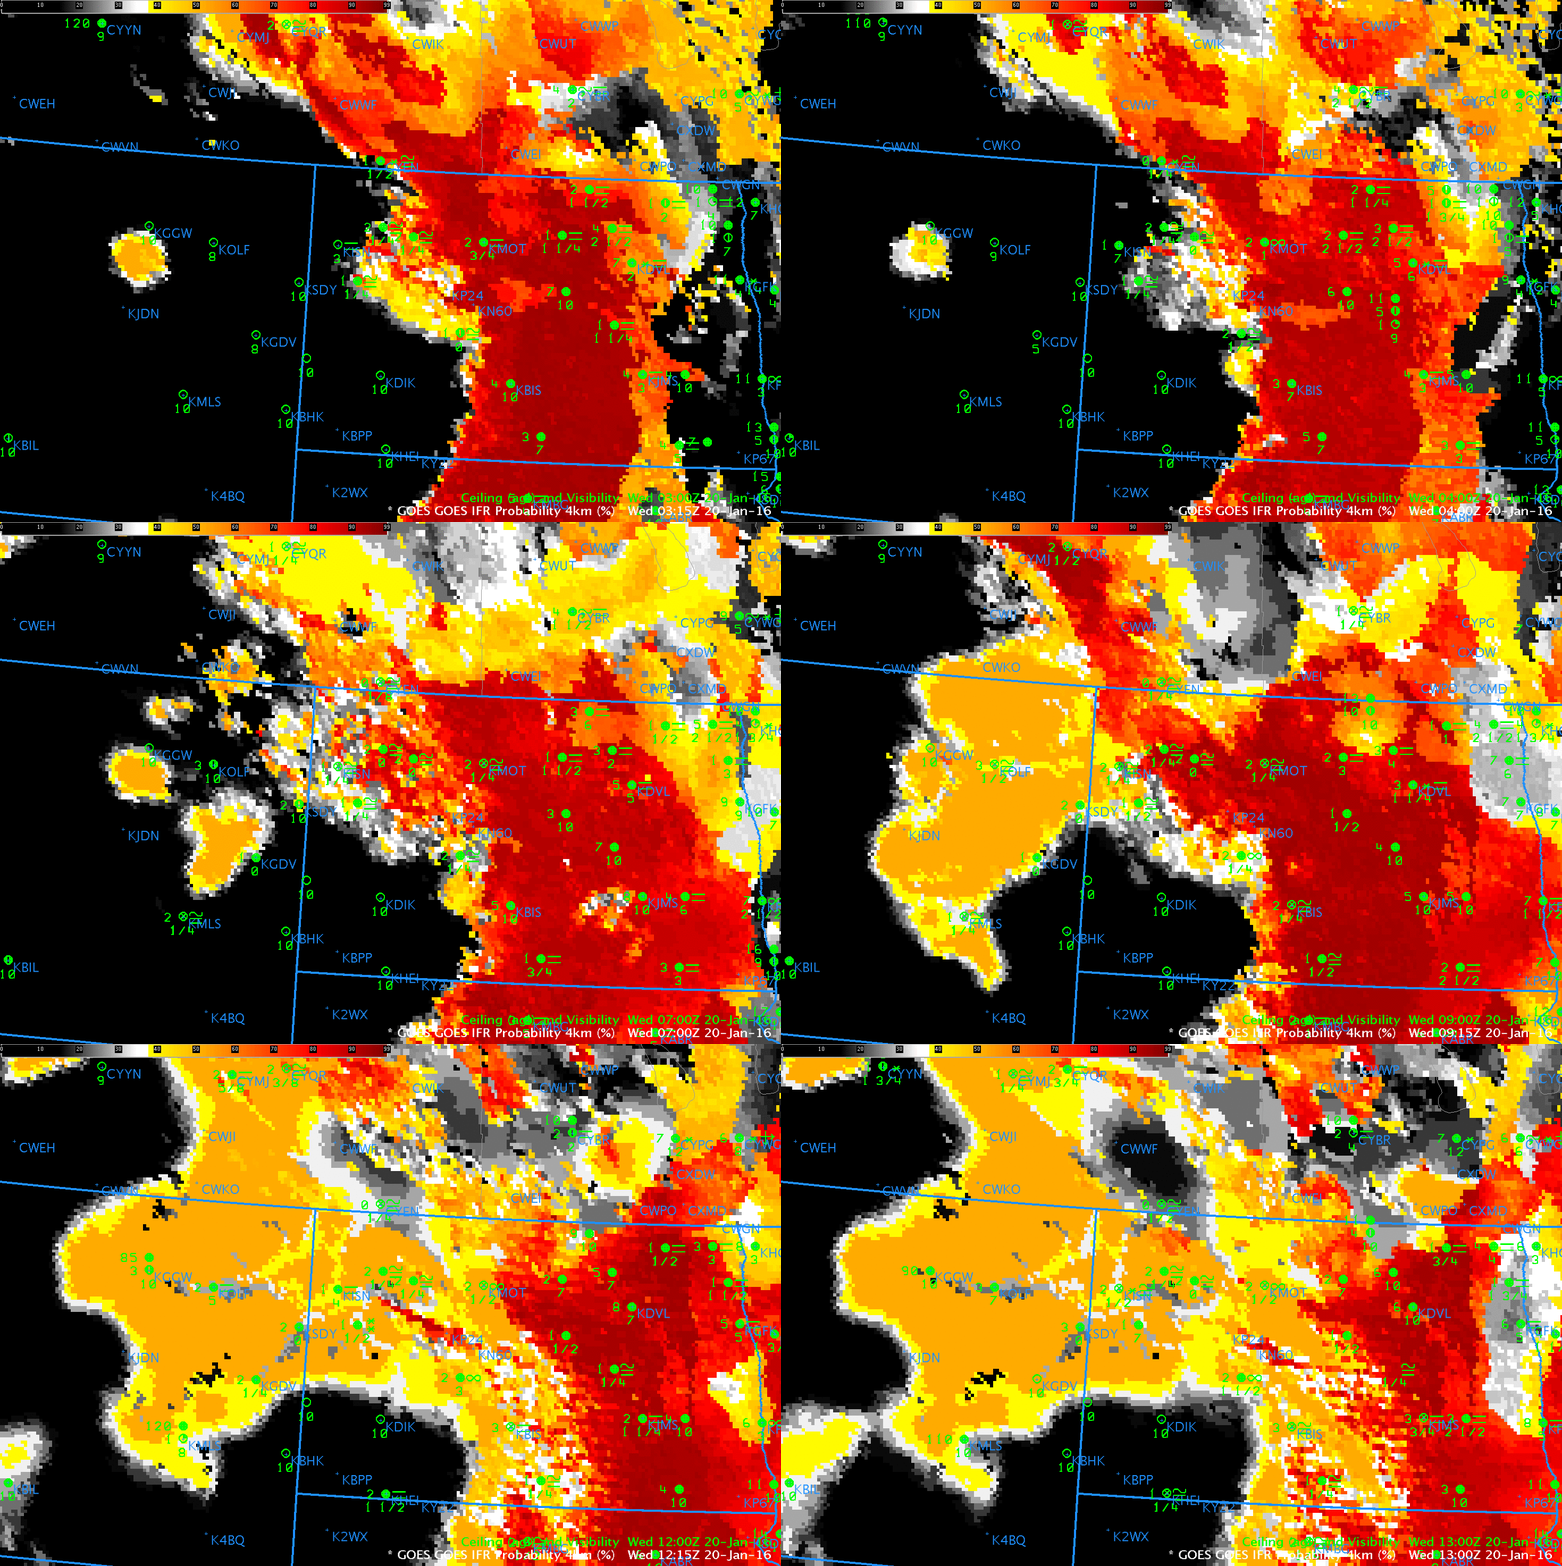
GOES-R IFR Probability Fields, 0300-1300 UTC on 20 January 2015 (Click to enlarge)

Dense Fog over North Dakota and Freezing Fog over eastern Montana prompted the issuance of Dense and Freezing Fog advisories early Wednesday Morning.    GOES-R IFR Probabilities, above, computed from data from the GOES-13 Imager and from Rapid Refresh Model output, capture the growth/evolution of the fog field. In general, the IFR Probability field captures the area of reduced visibilities (with some exceptions, such as KHEI (Hettinger, ND, near the border with South Dakota is southwest North Dakota).

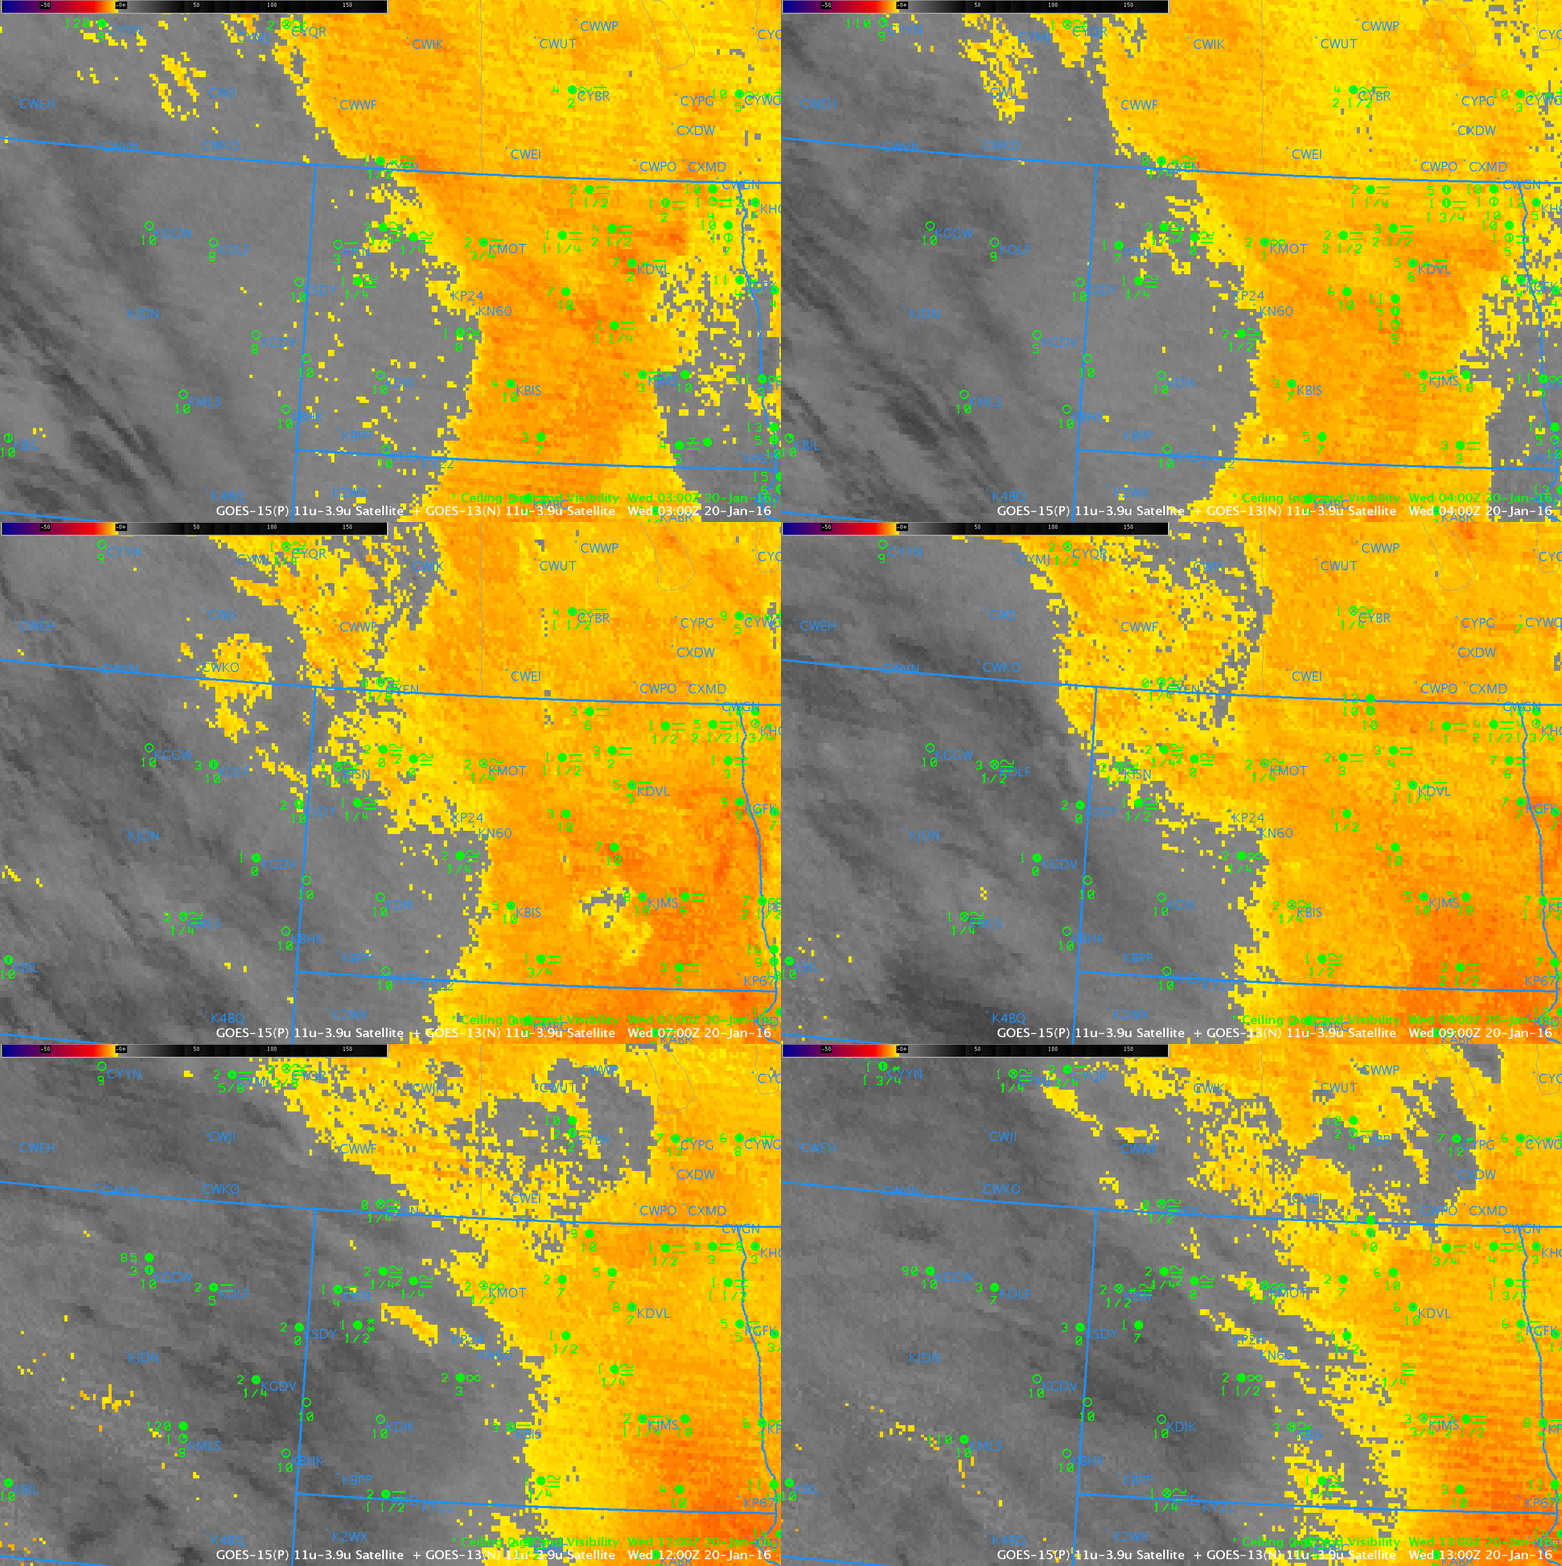
Compare the areal extent of the IFR Probability field with that from the Brightness Temperature Difference from GOES, below. The presence of multiple cloud layers prevents any satellite from viewing low clouds, and satellite-only products therefore give little information about near-surface events in much of western North Dakota and Montana.  When Rapid Refresh Model output is controlling the GOES-R IFR Probability field, as happened in this case over Montana and western North Dakota, the IFR Probability will have lower values and a less pixelated look that reflects the coarser model resolution and model smoothing.

BTDanim_0300_1300anim_20Jan2016

GOES Brightness Temperature Difference fields, 0300-1300 UTC, 20 January 2016 (Click to enlarge)

Fog and Stratus over the Northern Plains

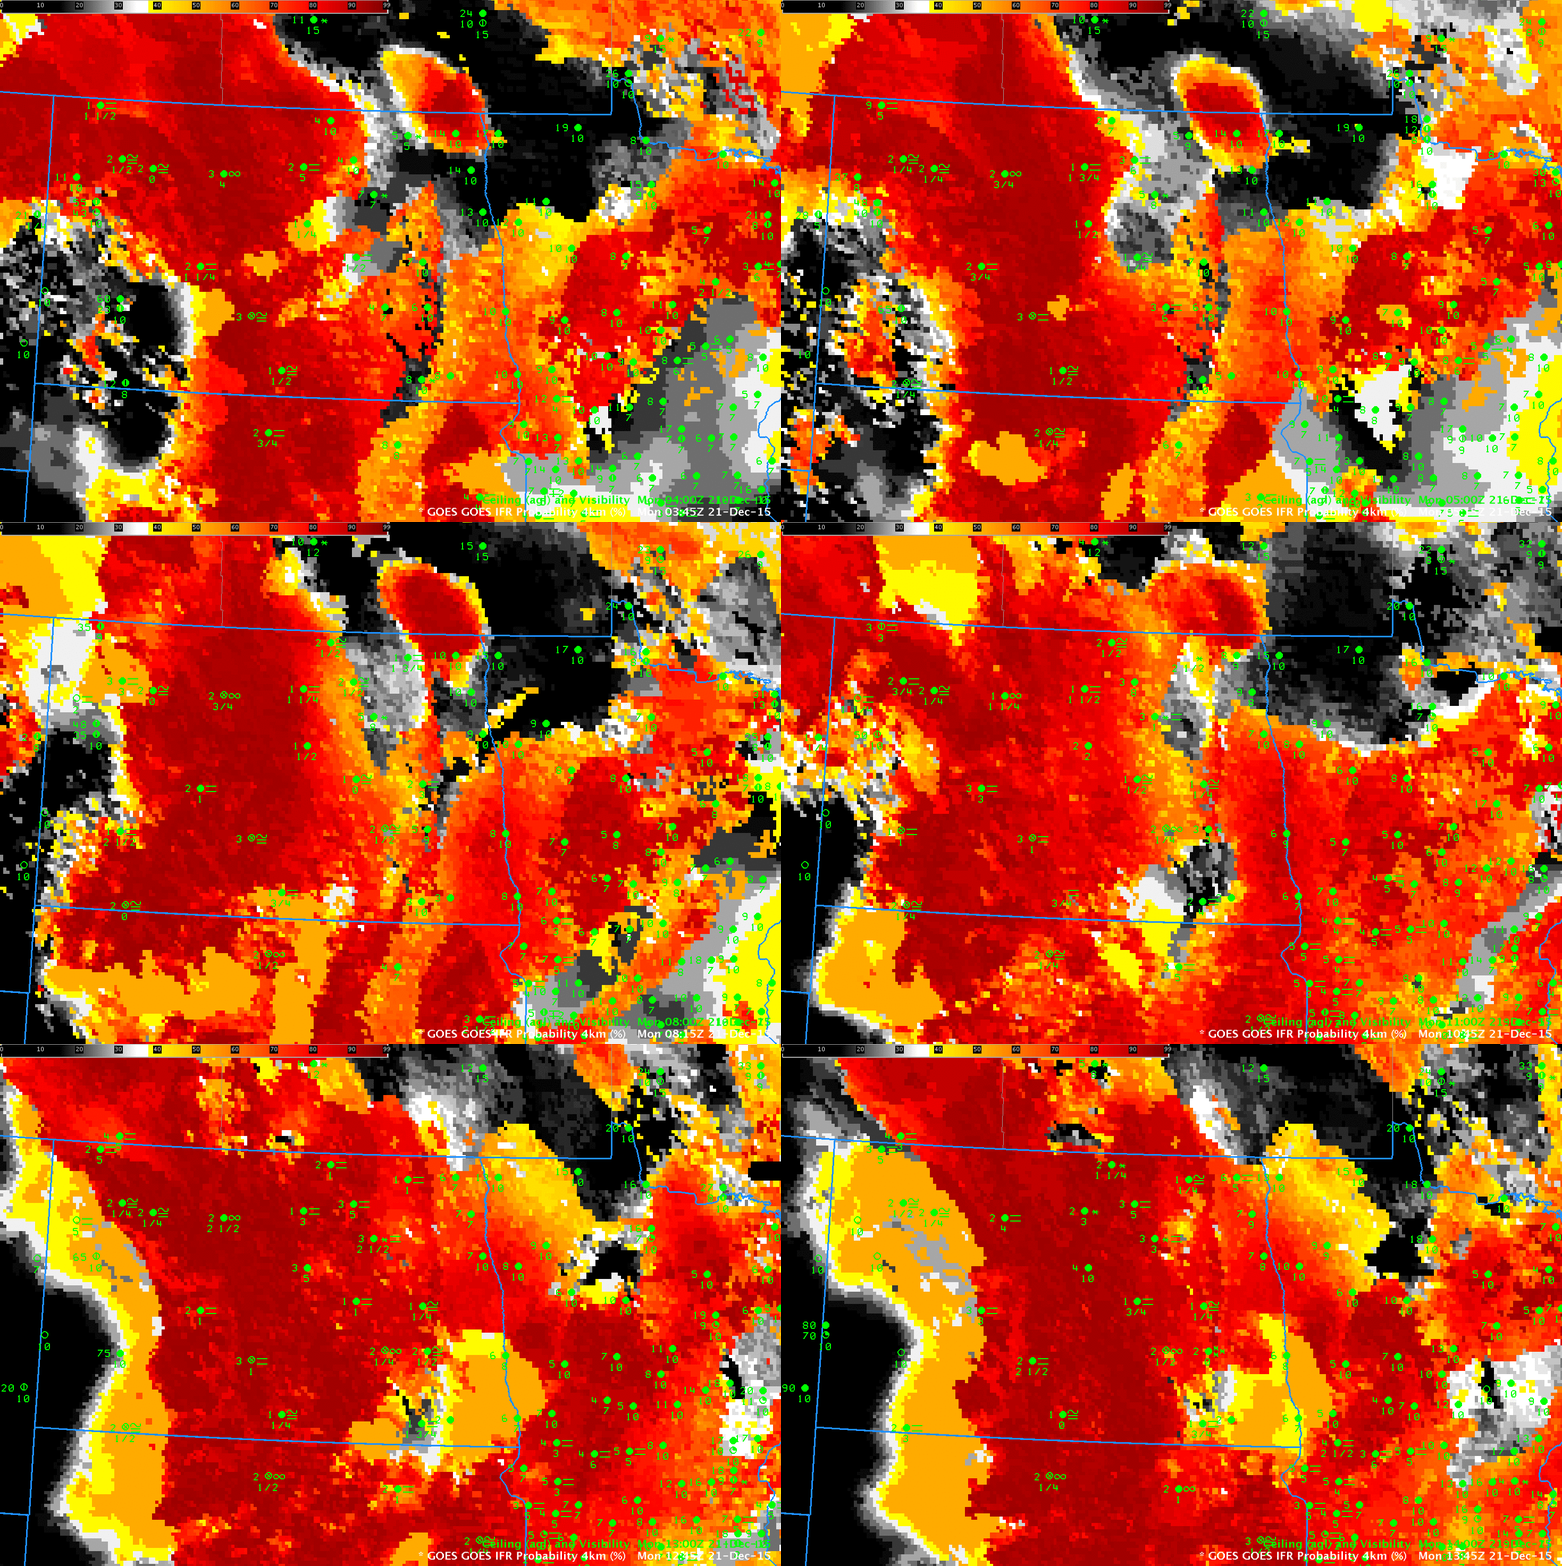
IFRProb_21dece2015anim

GOES-R IFR Probability Fields, 0345-1345 UTC on 21 December 2015 (Click to enlarge)

The National Weather Service in Bismarck issued Dense Fog Advisories for a fog and freezing fog early in the morning on December 21 (Happy Solstice!!) 2015. (Link). The half-hourly animation above shows the GOES-R IFR Probability during the overnight hours of 20-21 December 2015. (Here is a faster animation). Several aspects of this animation warrant comment. First, the western edge of the IFR Conditions matches well with the western edge of highest IFR Probabilities over North Dakota. This is true even as high clouds (obvious in the animation of Brightness Temperature Difference, below) move over North Dakota from the west: When this happens, IFR Probabilities decrease (and the field itself becomes more horizontally uniform) because Rapid Refresh Model Data output is the main predictor being used to diagnose the IFR Probability. The edge of the IFR Probability field moves through Dickinson ND (in the southwest part of the state) as the ceilings and visibilities there improve.

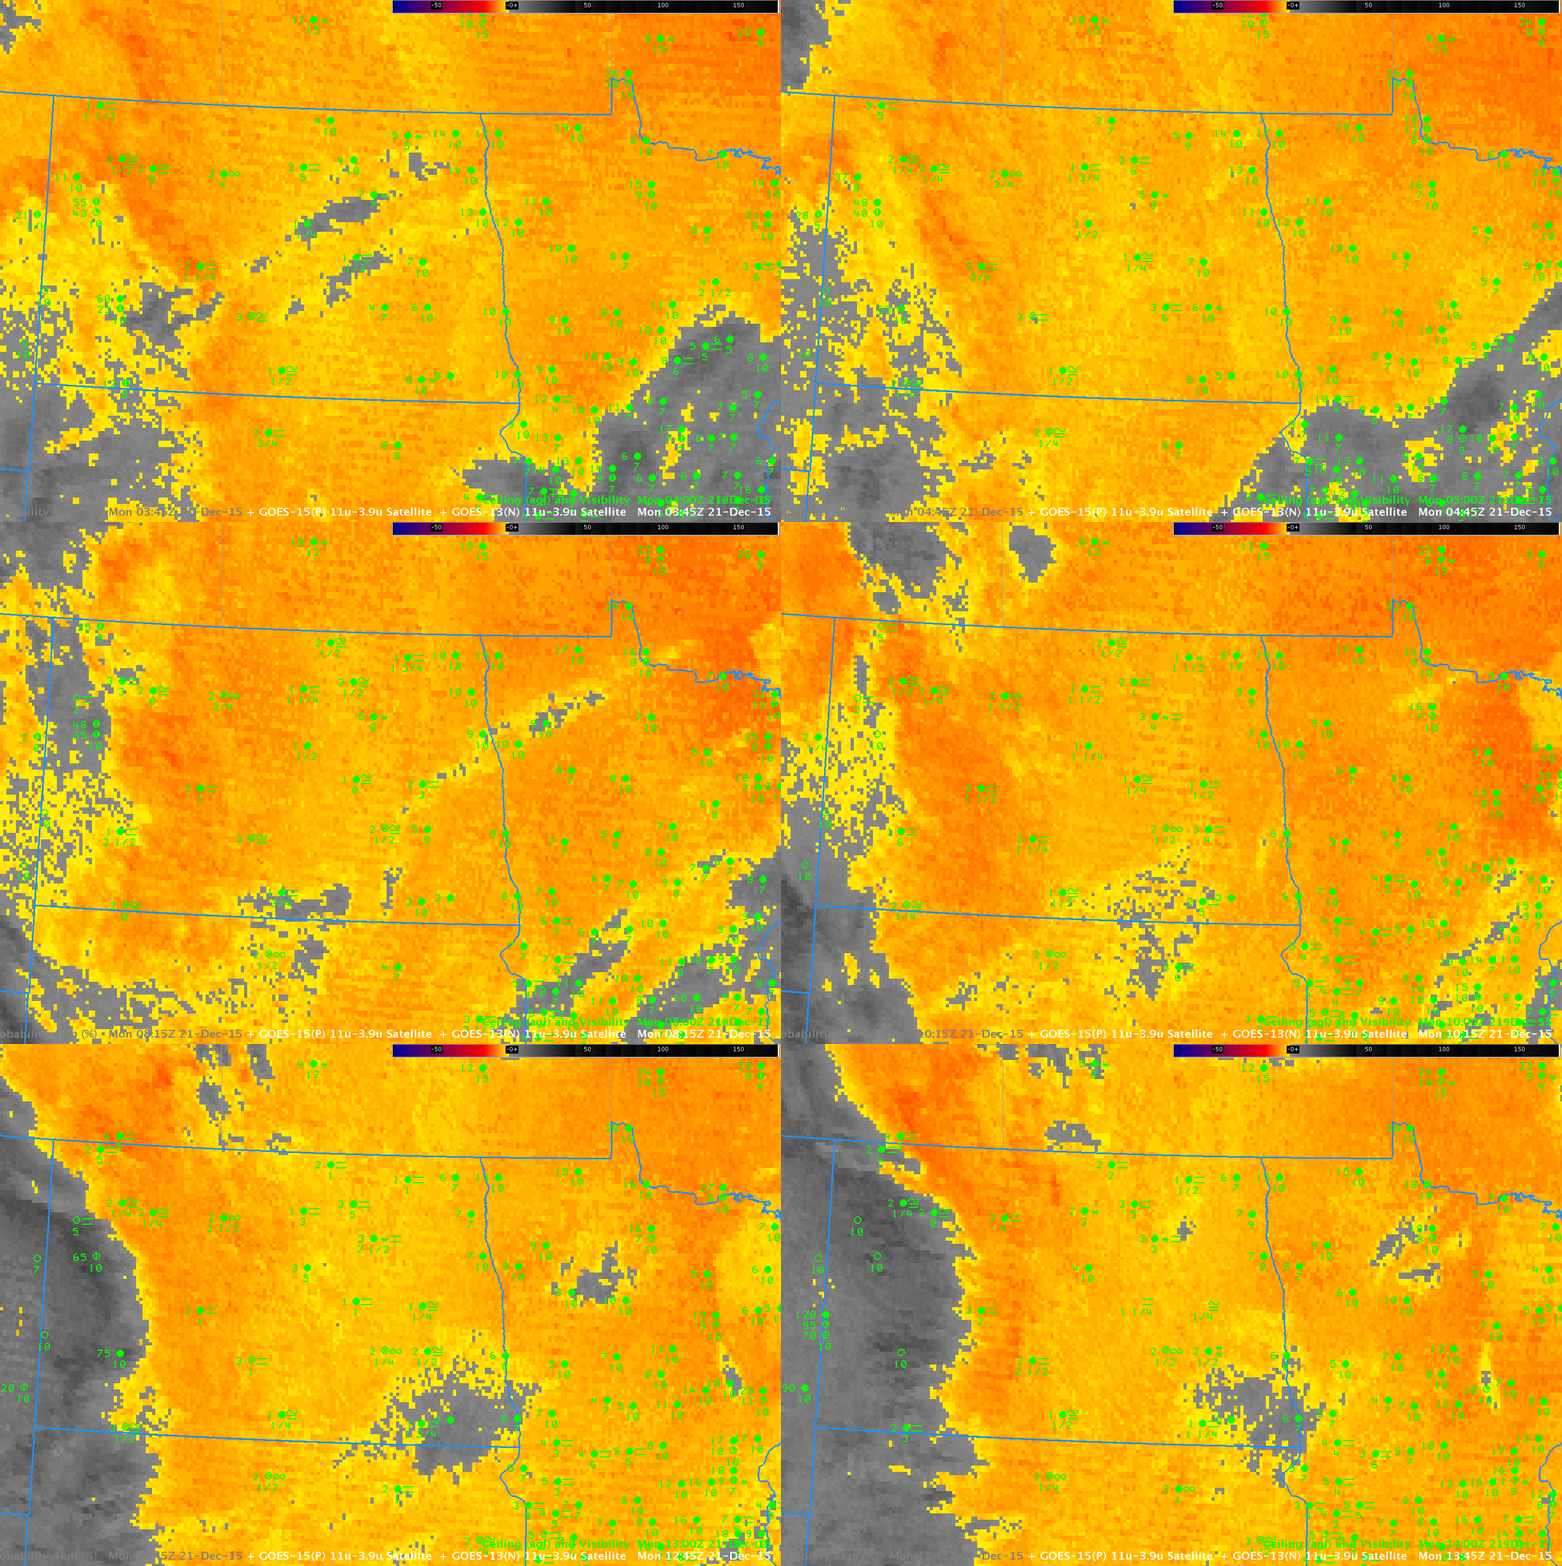
In addition, a persistent region of small IFR Probabilities exists over northern Minnesota in a region where IFR conditions are not reported. The Brightness Temperature Difference field there (below) shows a strong signal. (Click here for a faster animation of Brightness Temperature Difference) Thus, GOES-R IFR Probability is better able to differentiate between mid-level stratus and low stratus/fog. Over northern Minnesota, the Satellite data says water-based clouds are present, but the Rapid Refresh data notes little saturation in the lowest 1000 feet of the model. Thus, IFR Probabilities are small there.

GOESBTD_21Dece2015anim

GOES-13 Brightness Temperature Difference Fields (10.7 µm – 3.9 µm), 0345-1345 UTC on 21 December 2015 (Click to enlarge)

Freezing Fog over Minnesota

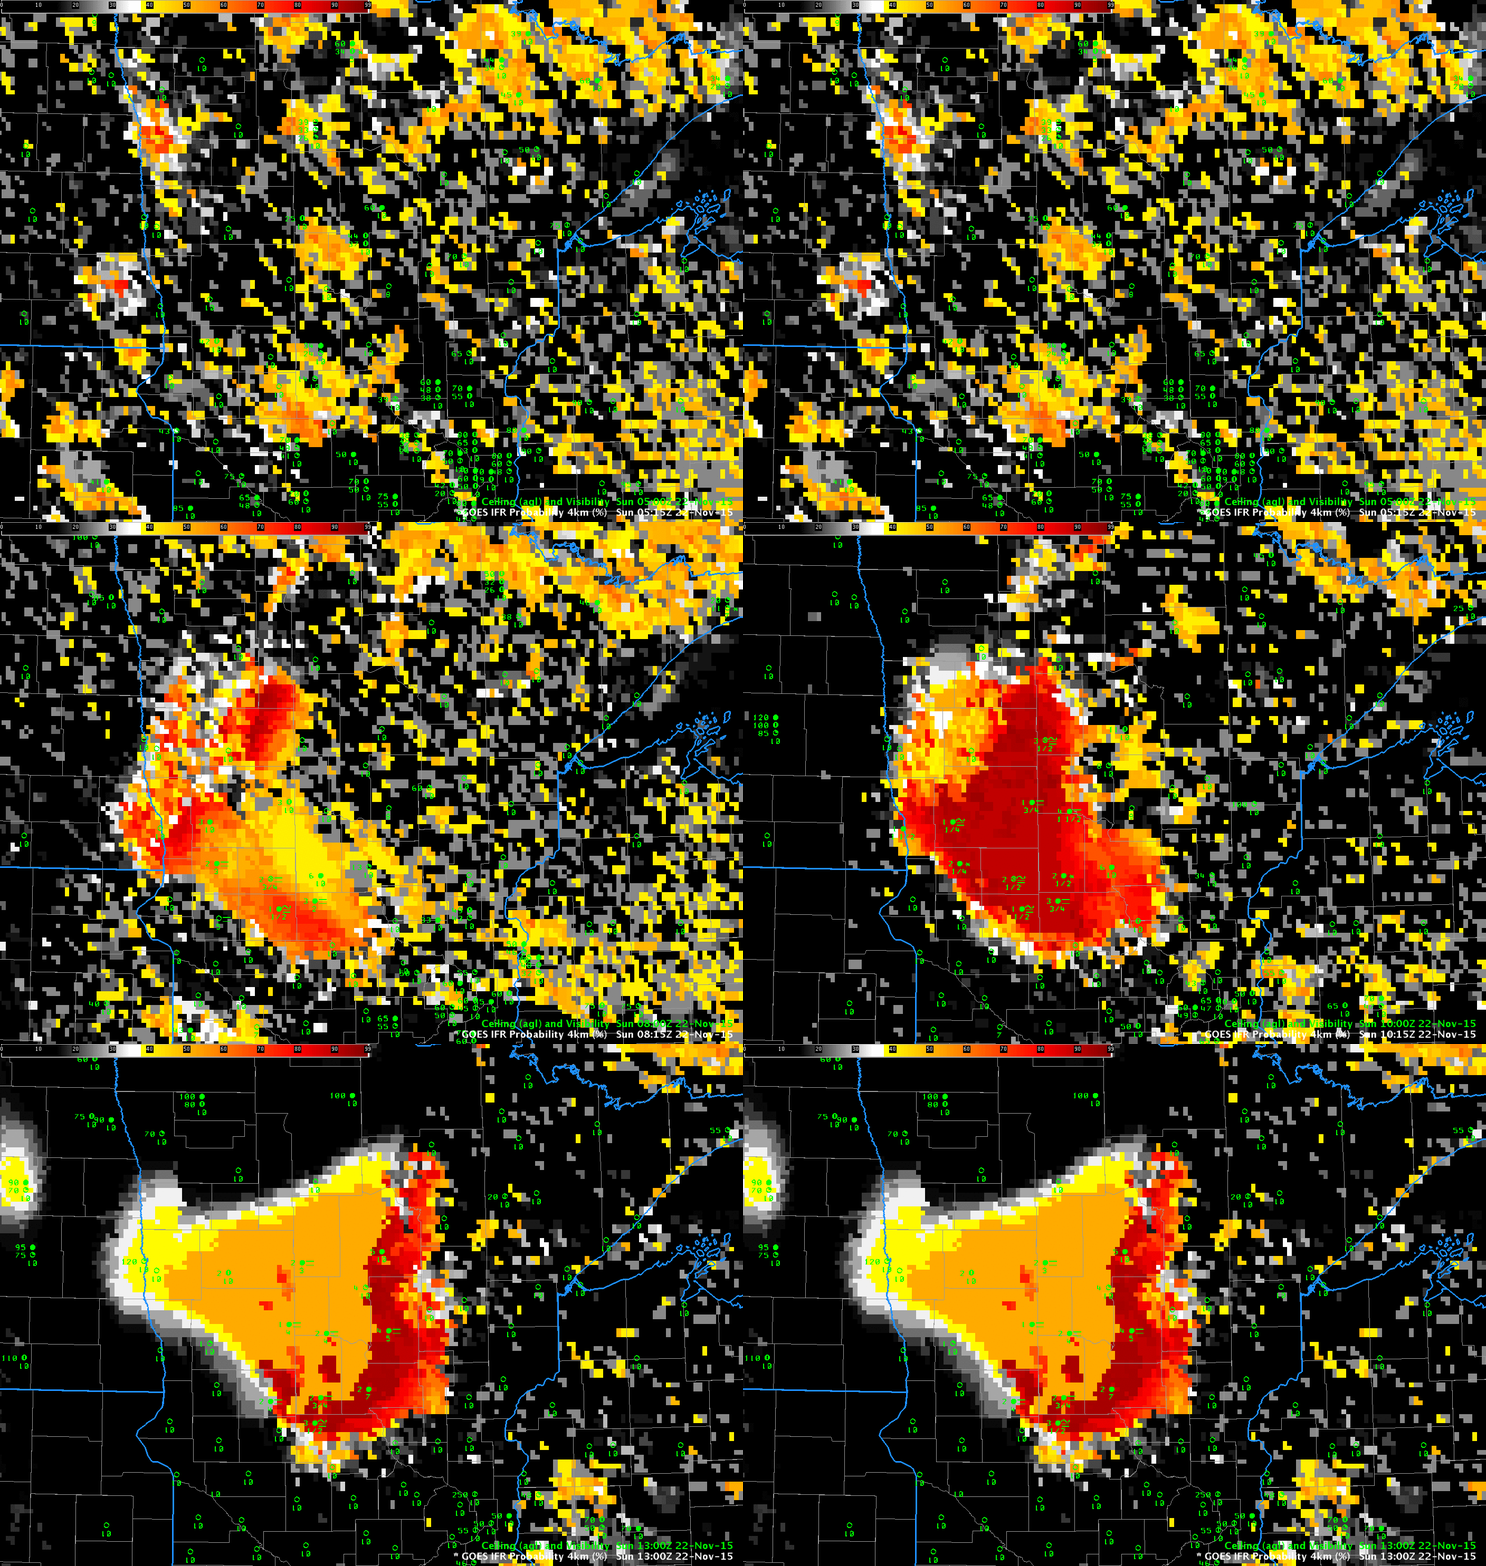
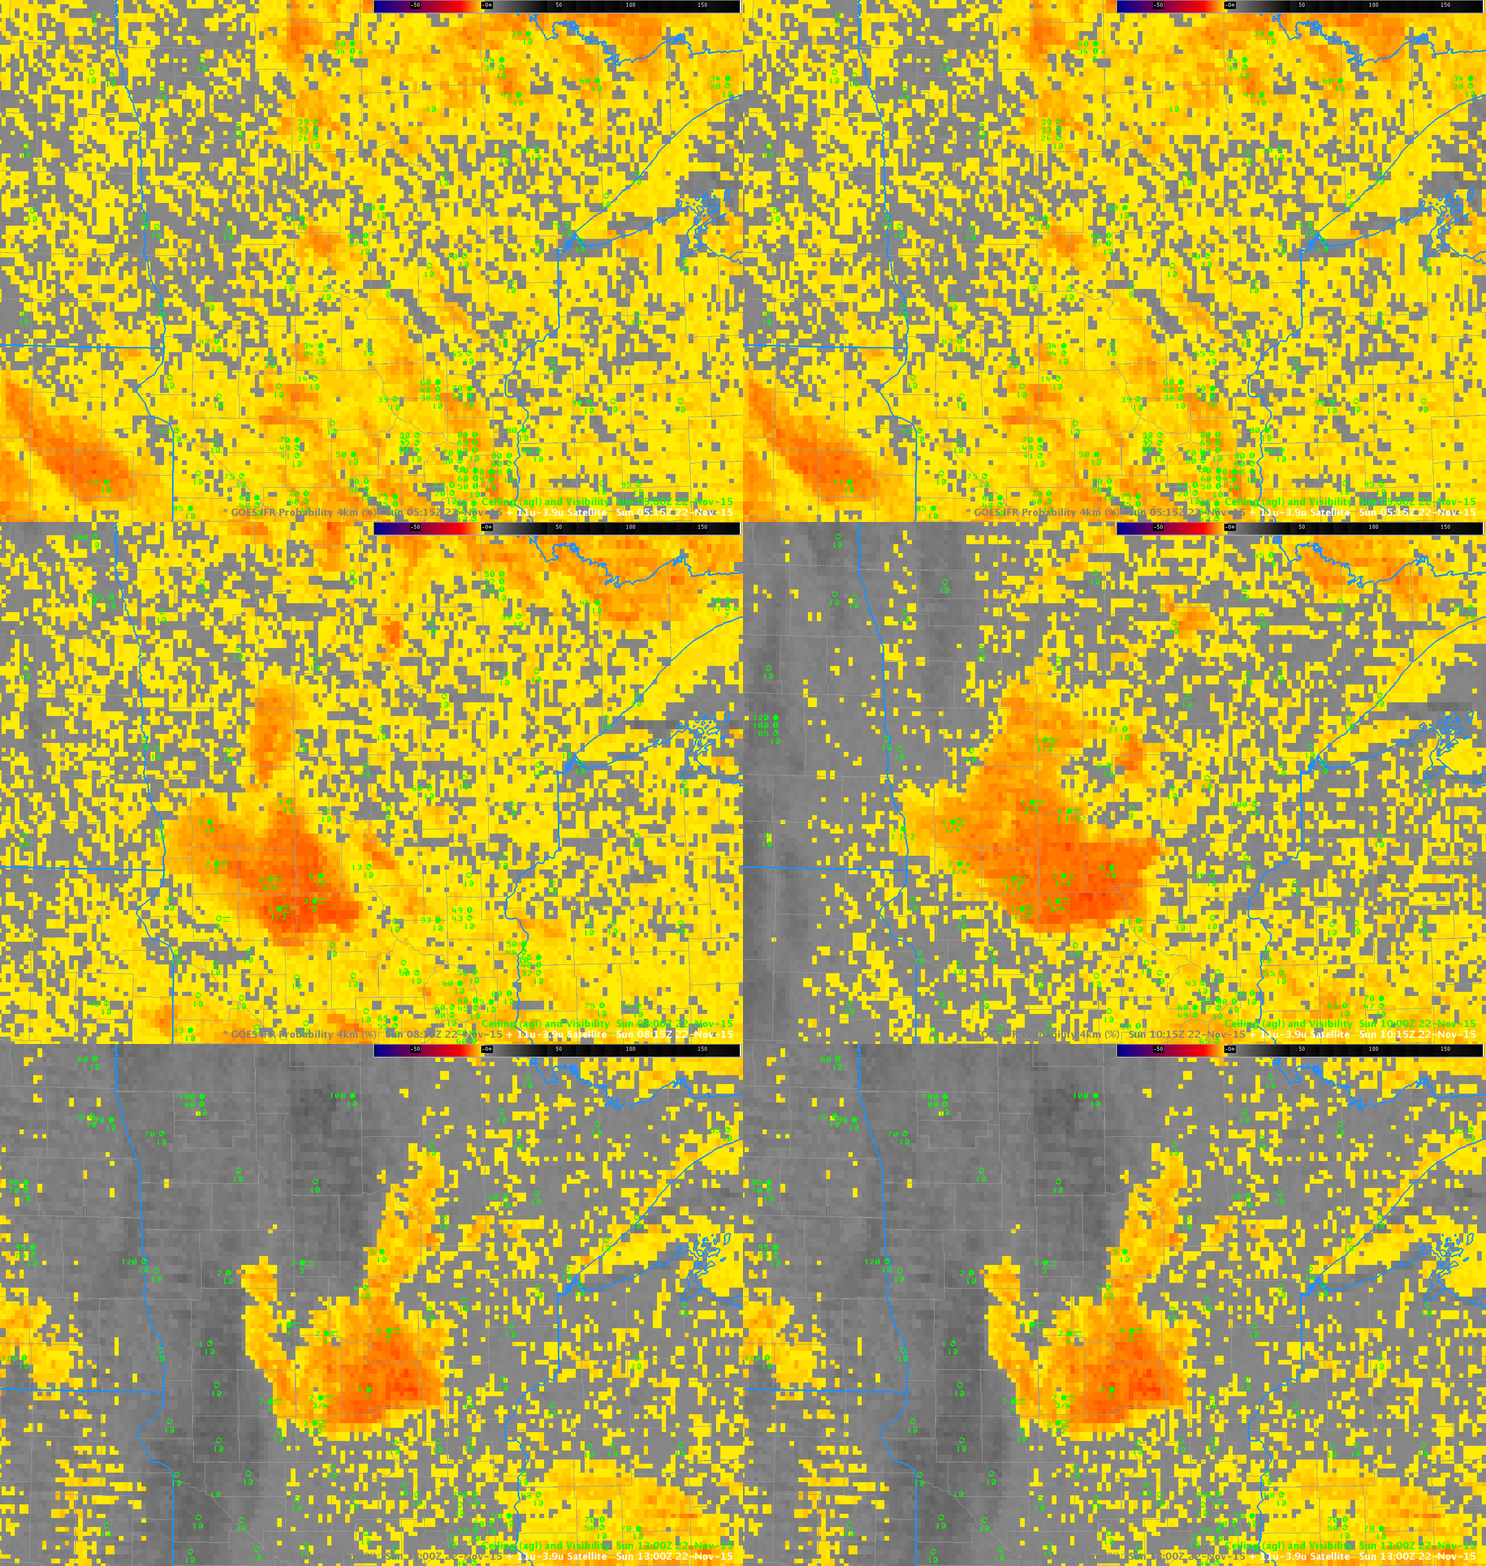
GOESR_IFR_0515_1300_22Nov2015anim

GOES-R IFR Probability fields, hourly from 0515 through 1300 UTC on Sunday 22 November 2015 (Click to enlarge)

On Sunday 22 November, fog developed over west-central Minnesota with sub-freezing temperatures on the ground. The animation of the GOES-R IFR Probability fields, above, shows the slow enlarging of highest probabilities in the region around Glenwood and Alexandria where IFR Conditions were observed.

The Brightness Temperature Difference fields, below, show a signal over much of the region. One of the benefits of GOES-R IFR probability fields is that the use of Rapid Refresh model output screens out regions where mid-level stratus is more likely. Only regions in the model that have low-level saturation show the highest IFR Probabilities. GOES-R IFR Probabilities also give a consistent signal for IFR conditions when high clouds move over a surface fog. At the end of the animation above, probabilities decrease somewhat in regions over western Minnesota where high clouds are encroaching. Those high clouds prevent the brightness temperature difference field, below, from detecting surface fog.

GOES13_BTD_0515_1300_22Nov2015anim

GOES-13 Brightness Temperature Difference Fields (10.7µm – 3.9µm), hourly from 0515 through 1300 UTC on Sunday 22 November 2015 (Click to enlarge)

Dense Fog Detection over western North Dakota under Cirrus

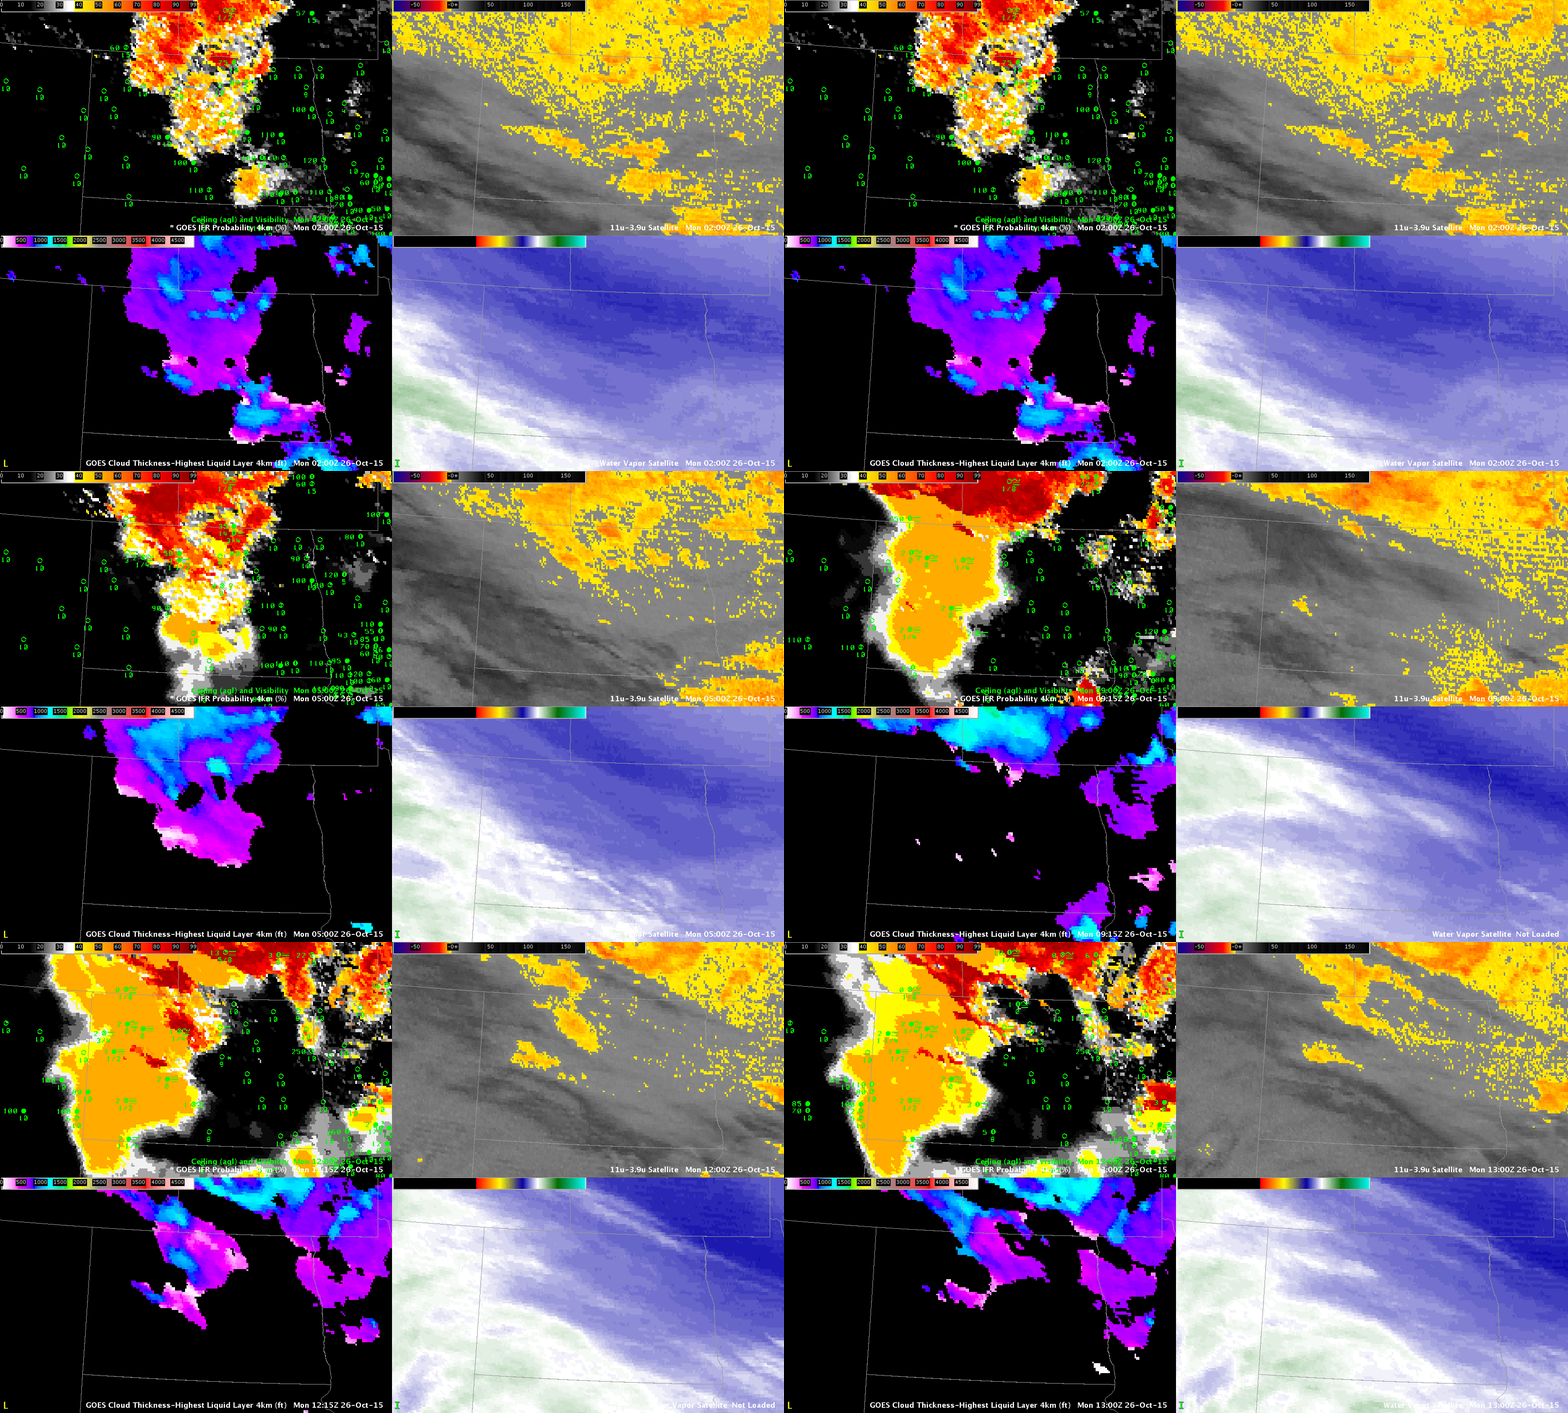
4Panel_0200_1300_26Oct2015anim

GOES-R IFR Probabilities (Upper Left), GOES-R Cloud Thickness (Lower Left), GOES-13 Brightness Temperature Difference (10.7 µm – 3.9 µm) (Upper Right), GOES-13 Water Vapor Infrared Imagery (6.5 µm) (Lower Right) (Click to enlarge)

Dense fog formed over western North Dakota early in the morning of Monday 26 October (and advisories were issued). At the same time, cirrus clouds overspread the region, making satellite detection of the low clouds problematic. This is an excellent example of the benefits of a fused product that blends surface and near-surface information from numerical models with satellite detection. When one of the products gives no information, the other can be relied upon to fill in gaps.

In the example above, dense fog develops over western North Dakota, complete with freezing drizzle. Satellite detection of the low clouds on this date was difficult because of widespread cirrus that overspread the state; these cirrus are apparent in both the water vapor (lower right) and the brightness temperature difference (upper right). When model data principally are used to compute the IFR Probability fields — in regions where high clouds prevent a satellite view of low clouds — the character of the field is flatter and less pixelated. In addition, where high clouds cannot view low clouds, the Cloud Thickness cannot be computed (as it relates 3.9µm emissivity to cloud thickness). Note that there are regions where the cirrus thins enough that low clouds can be viewed — in these regions the Cloud Thickness is computed an the IFR Probability increases (where both Cloud Predictors and Model Predictors can be used, IFR Probabilities are larger).

IFR Probability discriminates between Low Stratus and Mid-Level Stratus

Dense Fog Advisories were issued over parts of eastern North Dakota (Screenshot of Grand Forks National Weather Service Page) early on 9 October:

URGENT – WEATHER MESSAGE
NATIONAL WEATHER SERVICE GRAND FORKS ND
303 AM CDT FRI OCT 9 2015

NDZ006-007-014-015-024-028-038-091500-
/O.NEW.KFGF.FG.Y.0006.151009T0803Z-151009T1500Z/
/O.CON.KFGF.FR.Y.0011.000000T0000Z-151009T1400Z/
TOWNER-CAVALIER-BENSON-RAMSEY-EDDY-GRIGGS-BARNES-
INCLUDING THE CITIES OF…CANDO…LANGDON…FORT TOTTEN…
MADDOCK…LEEDS…MINNEWAUKAN…DEVILS LAKE…NEW ROCKFORD…
COOPERSTOWN…VALLEY CITY
303 AM CDT FRI OCT 9 2015

…DENSE FOG ADVISORY IN EFFECT UNTIL 10 AM CDT THIS MORNING…
…FROST ADVISORY REMAINS IN EFFECT UNTIL 9 AM CDT THIS MORNING…

THE NATIONAL WEATHER SERVICE IN GRAND FORKS HAS ISSUED A DENSE
FOG ADVISORY…WHICH IS IN EFFECT UNTIL 10 AM CDT THIS MORNING.

* TEMPERATURES…IN THE LOWER 30S.

* VISIBILITIES…AREAS OF VISIBILITY UNDER ONE QUARTER MILE.
VISIBILITIES WILL BE HIGHLY VARIABLE HOWEVER.

* TIMING…FOG WILL BURN OFF MID MORNING.

PRECAUTIONARY/PREPAREDNESS ACTIONS…

A FROST ADVISORY MEANS THAT WIDESPREAD FROST IS EXPECTED.
SENSITIVE OUTDOOR PLANTS MAY BE KILLED IF LEFT UNCOVERED.

A DENSE FOG ADVISORY MEANS VISIBILITIES WILL FREQUENTLY BE
REDUCED TO LESS THAN ONE QUARTER MILE. IF DRIVING…SLOW DOWN…
USE YOUR HEADLIGHTS…AND LEAVE PLENTY OF DISTANCE AHEAD OF YOU.

&&

$$

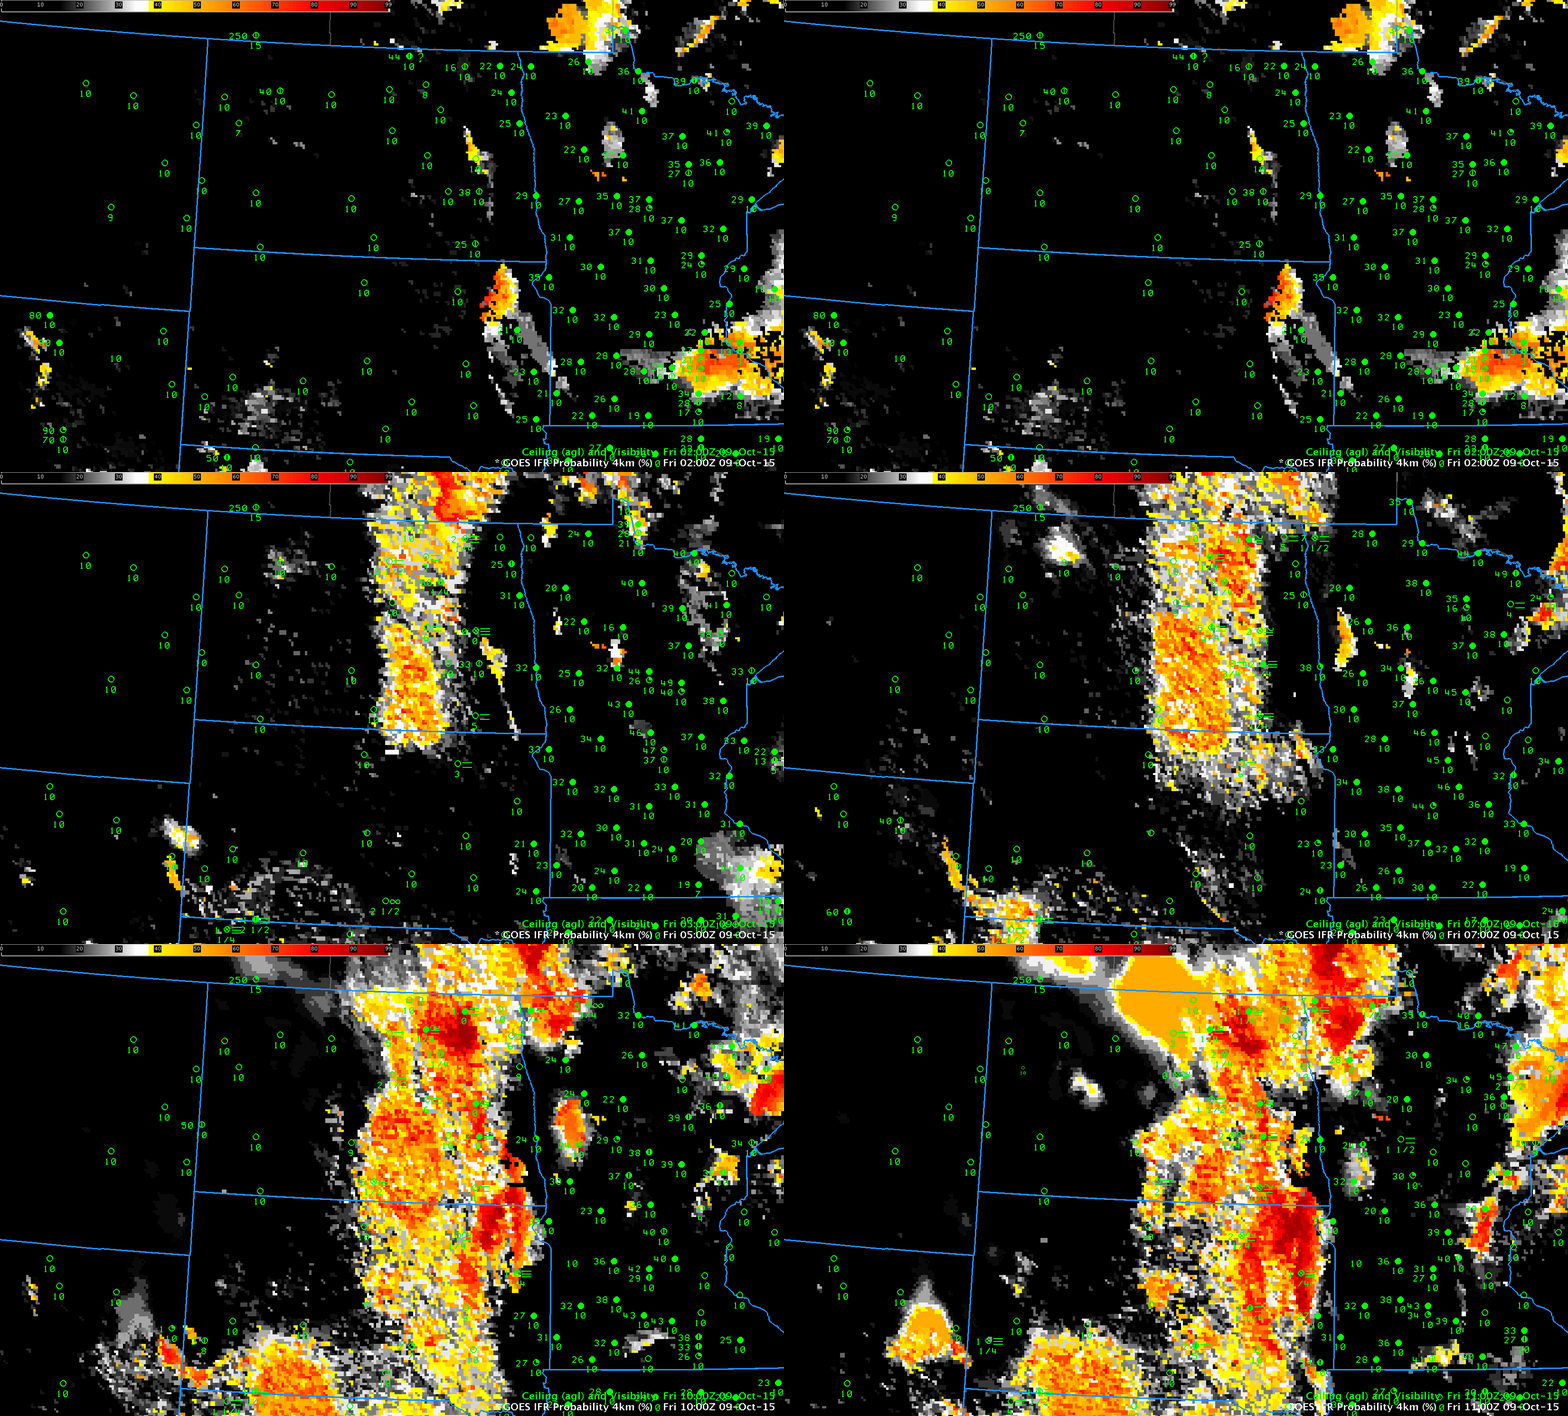
GOESR_IFRPROB_0200_1100_09October2015anim

GOES-R IFR Probability Fields and surface reports of ceilings and visibilities, 0200-1100 UTC (Click to enlarge)

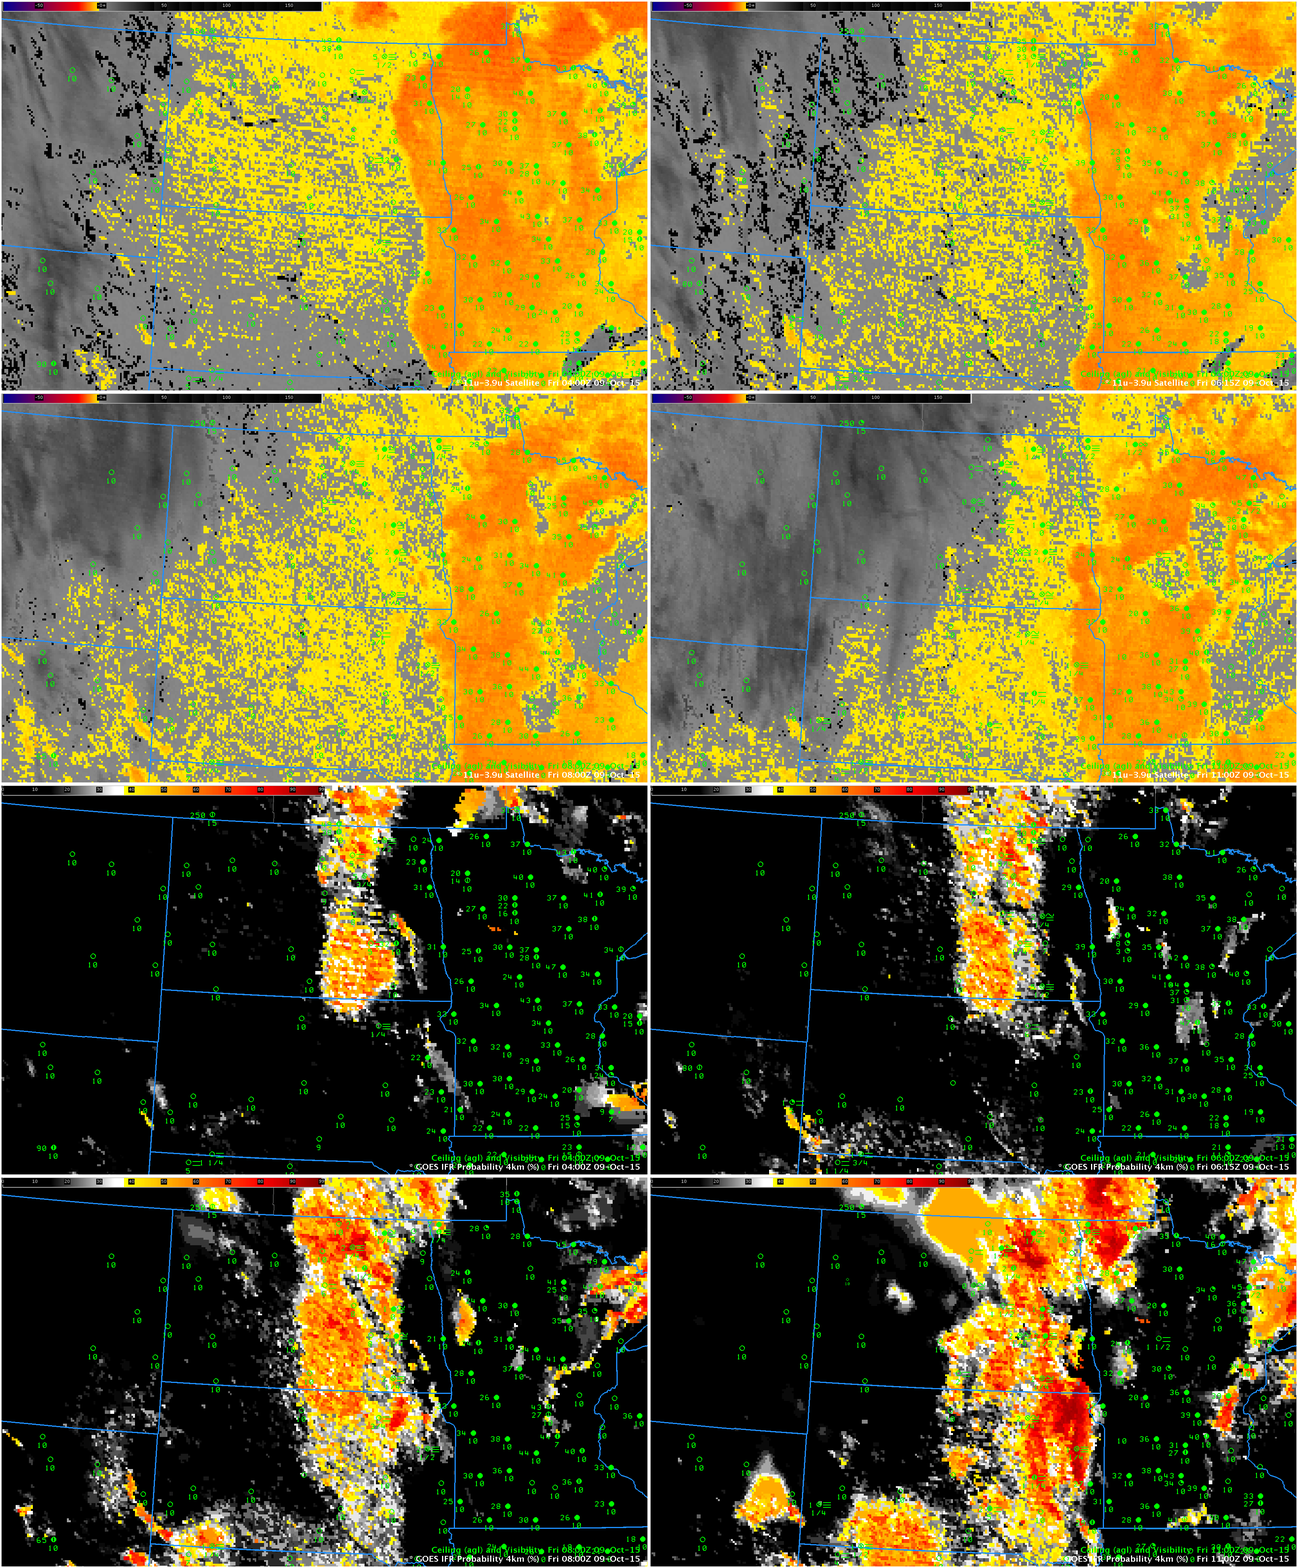
The GOES-R IFR Probability fields increased in this region as the fog developed (above). Notably in this case, IFR probabilities were lower over Minnesota and the Red River Valley where mid-level stratus was occurring. The toggle below compares IFR Probabilities and Brightness Temperature Differences at four times during the night. The Brightness Temperature Difference fields (animation from 0400-1100 UTC is here) greatly overpredict the region of dense fog. Because the IFR Probabilities incorporate information about the surface, however, regions of mid-level stratus can be screened out. These are regions where the Rapid Refresh model does not show saturation in the lowest layers.

Note that Cirrus is overspreading the region from the west at the end of the animations. High Clouds change the signal in the brightness temperature difference field. Harvey ND at 1100 UTC reports Zero visibility and an obscured ceiling (with freezing drizzle). The station is under cirrus, however, so a brightness temperature difference signal associated with fog is not present. There is a modest IFR Probability value there because data from the Rapid Refresh suggests low-level saturation is occurring.

GOESR_BTD_IFRPROB_4_6_8_1100_09October2015toggle_4PANEL

GOES-13 Brightness Temperature Difference fields and GOES-R IFR Probability Fields at 0400 (Upper Left), 0615 (Upper Right), 0800 (Lower Left) and 1100 (Lower Right) [Click to enlarge]

Dense Fog over the Red River of the North

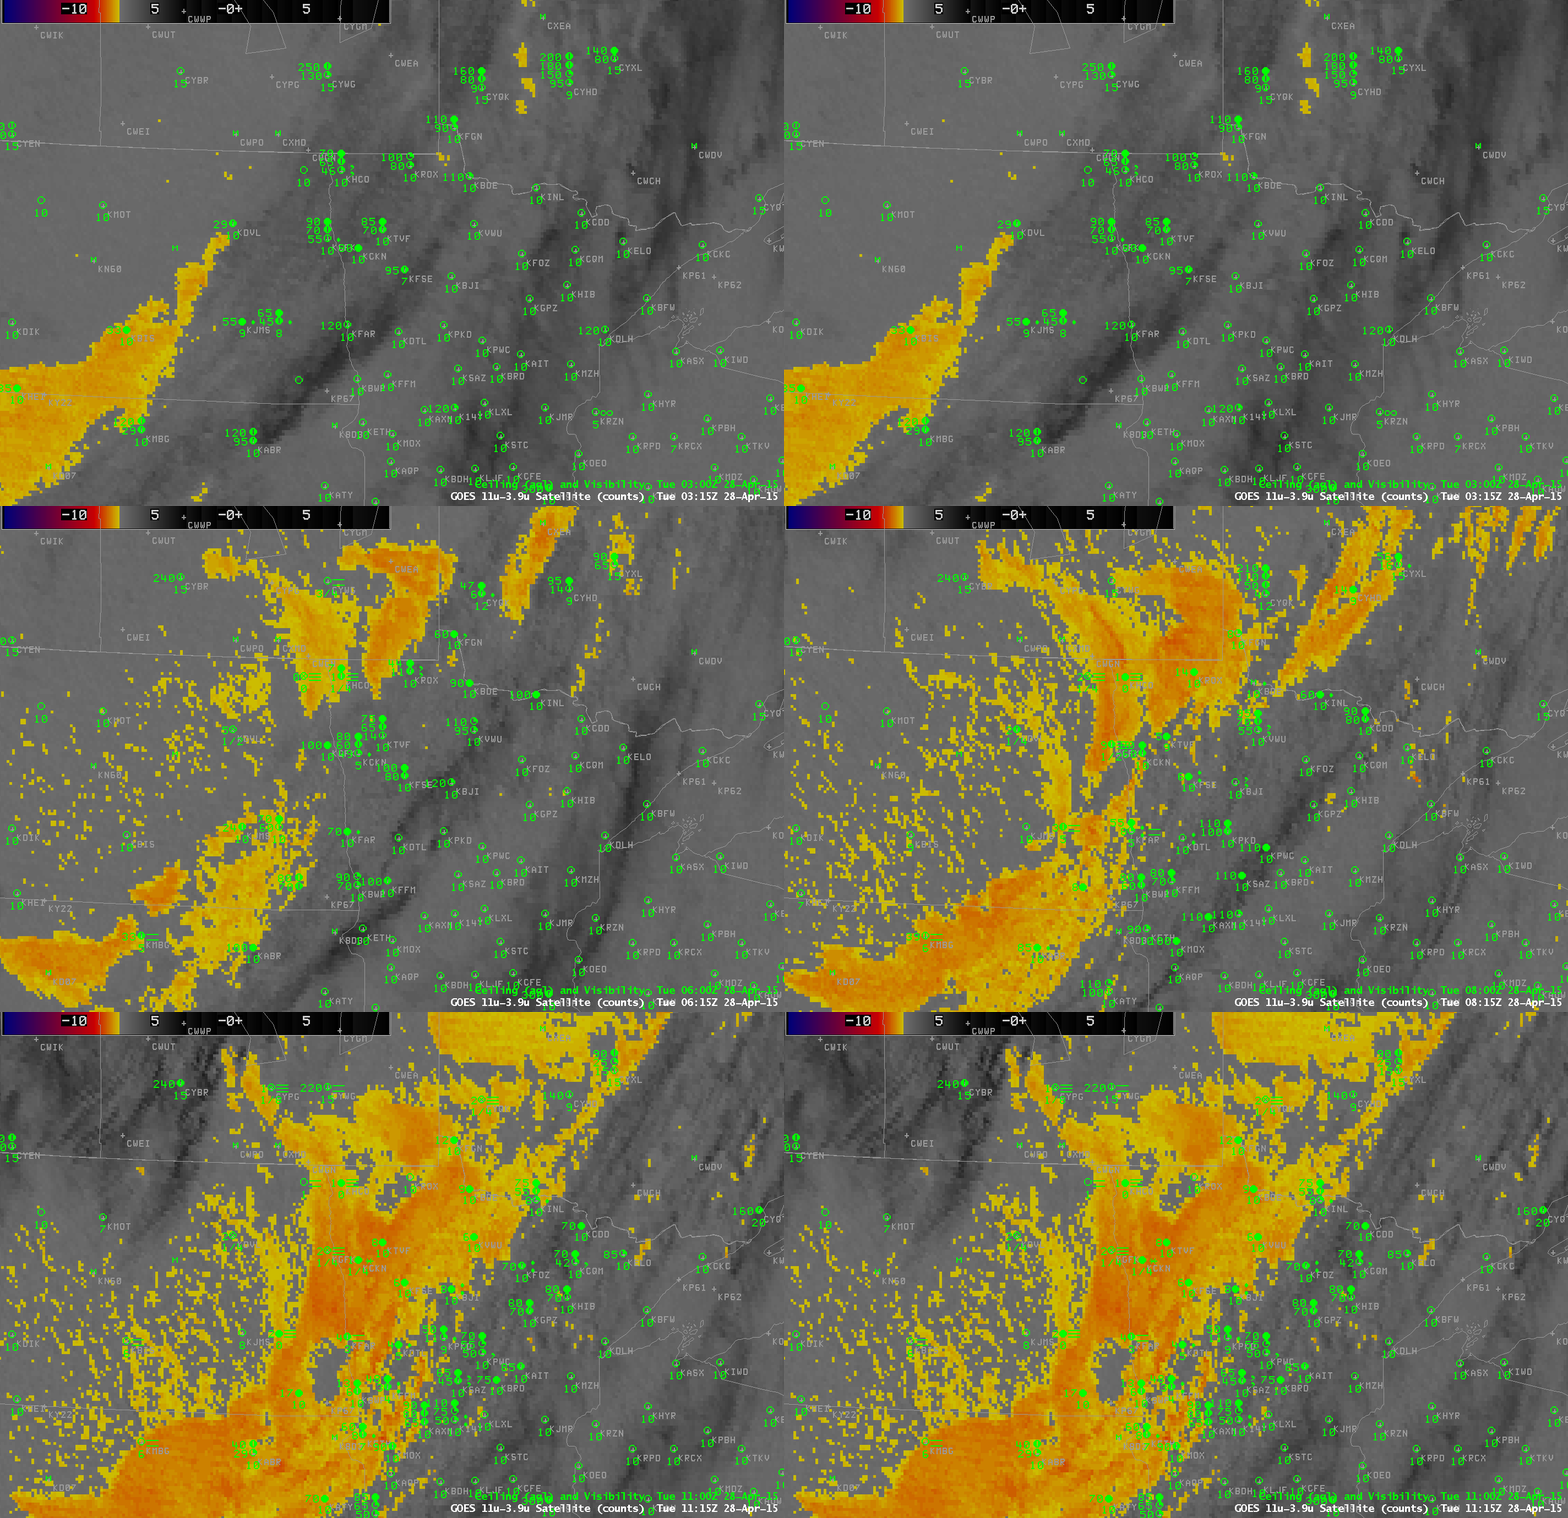
Dense Fog advisories were issued by the National Weather Service in Grand Forks as visibilities in the WFO dropped to near zero. How did the IFR Probability Fields and traditional Brightness Temperature Difference Fields capture this event? The animation below shows the brightness temperature difference field (10.7 µm – 3.9 µm) from GOES-13. Initially, a swath of mid-level and upper-level clouds covered the Red River Valley (this system had produced very light rains on Monday the 27th), but the clouds moved east and dense fog quickly developed (Cavalier, ND, for example, showed reduced visibility already at 0400 UTC).

Reg_11-3.9_Sat_20150428_03_11

GOES-13 Brightness Temperature Difference (10.7 µm – 3.9 µm) hourly from 0315 to 1115 UTC on 28 April 2015, along with surface plots of ceilings and visibility (Click to enlarge)

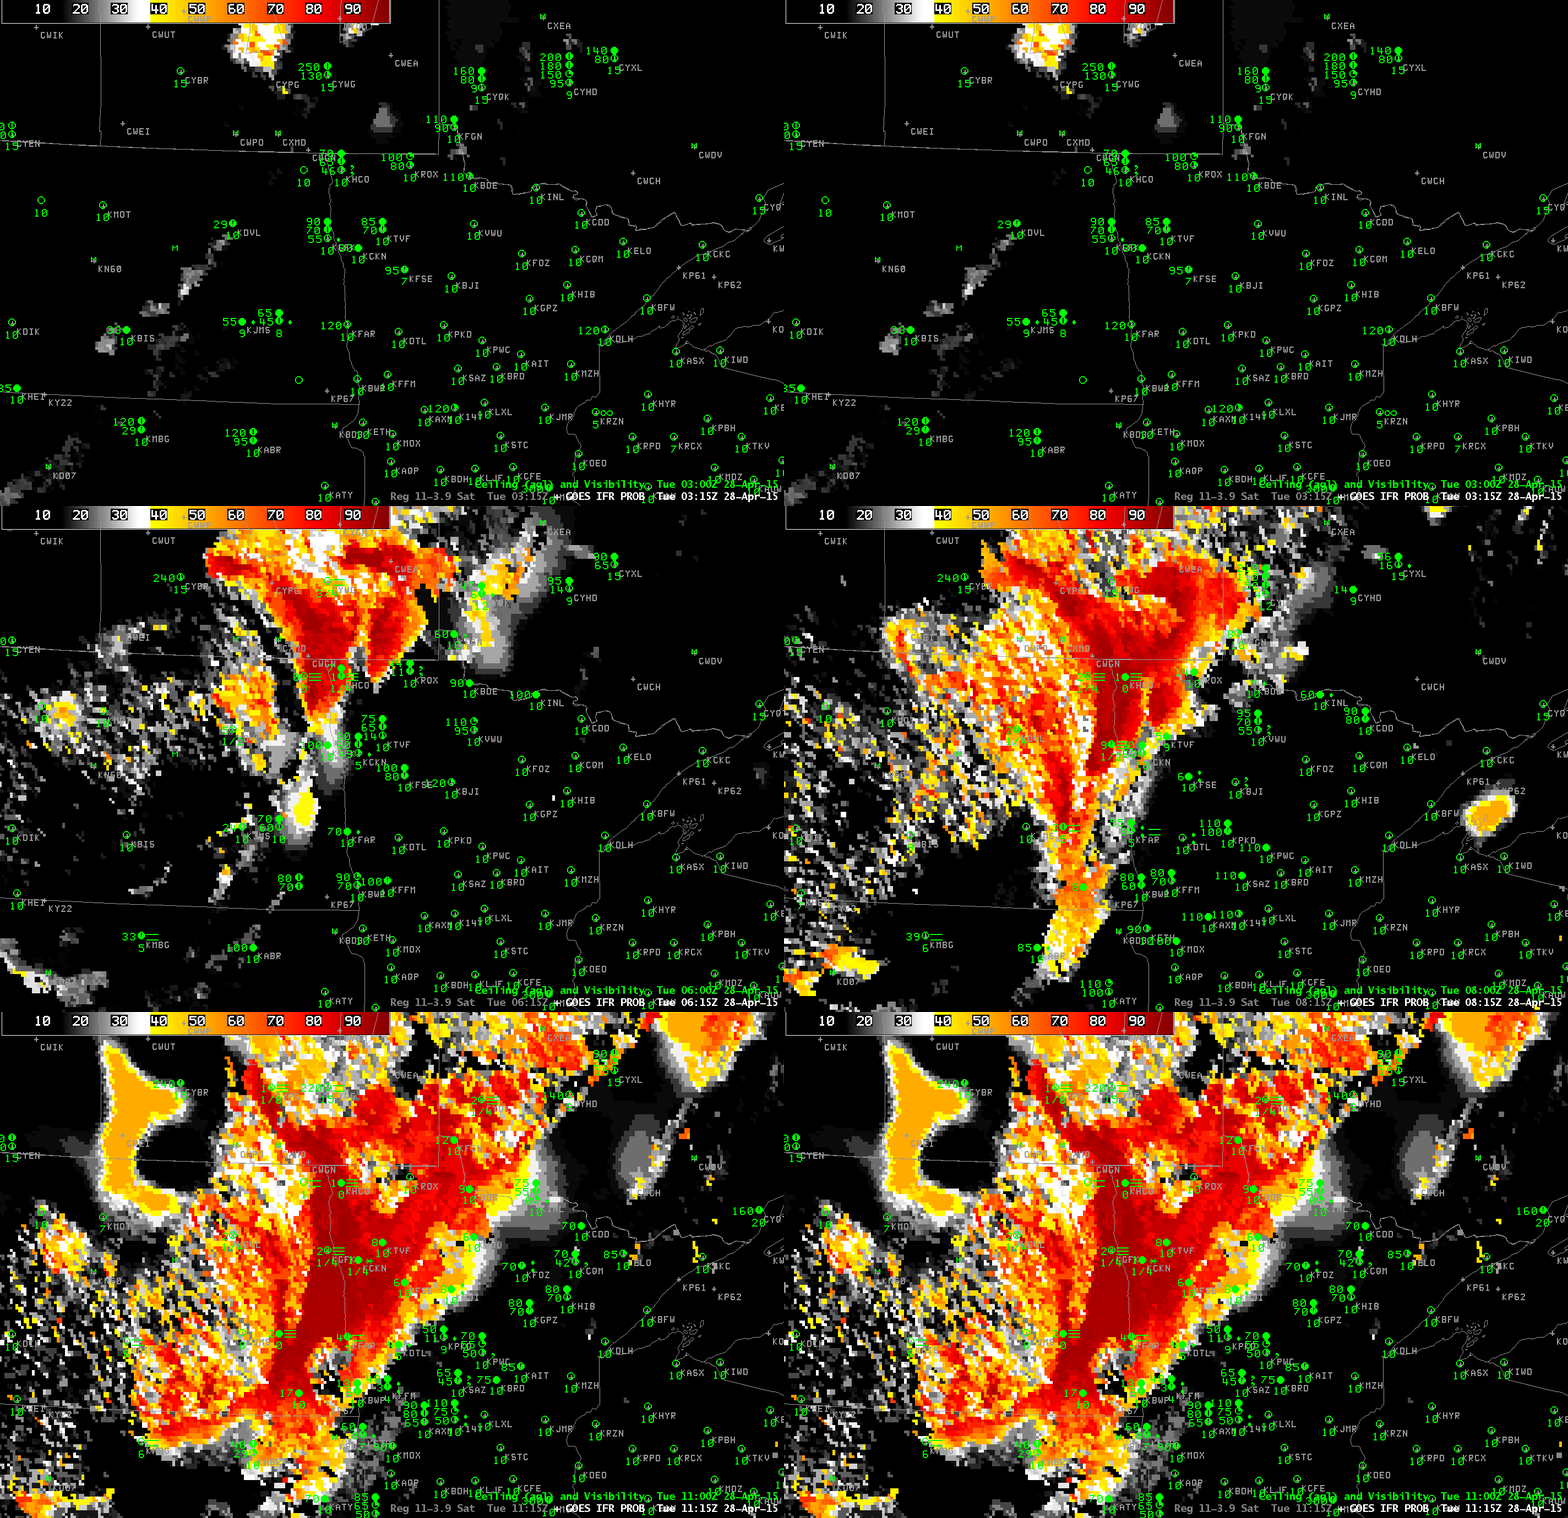
The IFR Probability fields for the same time, below, better capture the horizontal extent of the fog.  For example, the strong signal in the Brightness Temperature Difference field over South Dakota at the end of the animation, above, is not present in the IFR Probability fields.  IFR Conditions are not occurring over South Dakota.  The good match between the developing IFR Probability fields and the developing fog testifies to the satellite view of the fog and the accurate simulation of this event by the Rapid Refresh model.

GOES_IFR_PROB_20150428_03_11

GOES-R IFR Probability Fields hourly from 0315 to 1115 UTC on 28 April 2015, along with surface plots of ceilings and visibility (Click to enlarge)

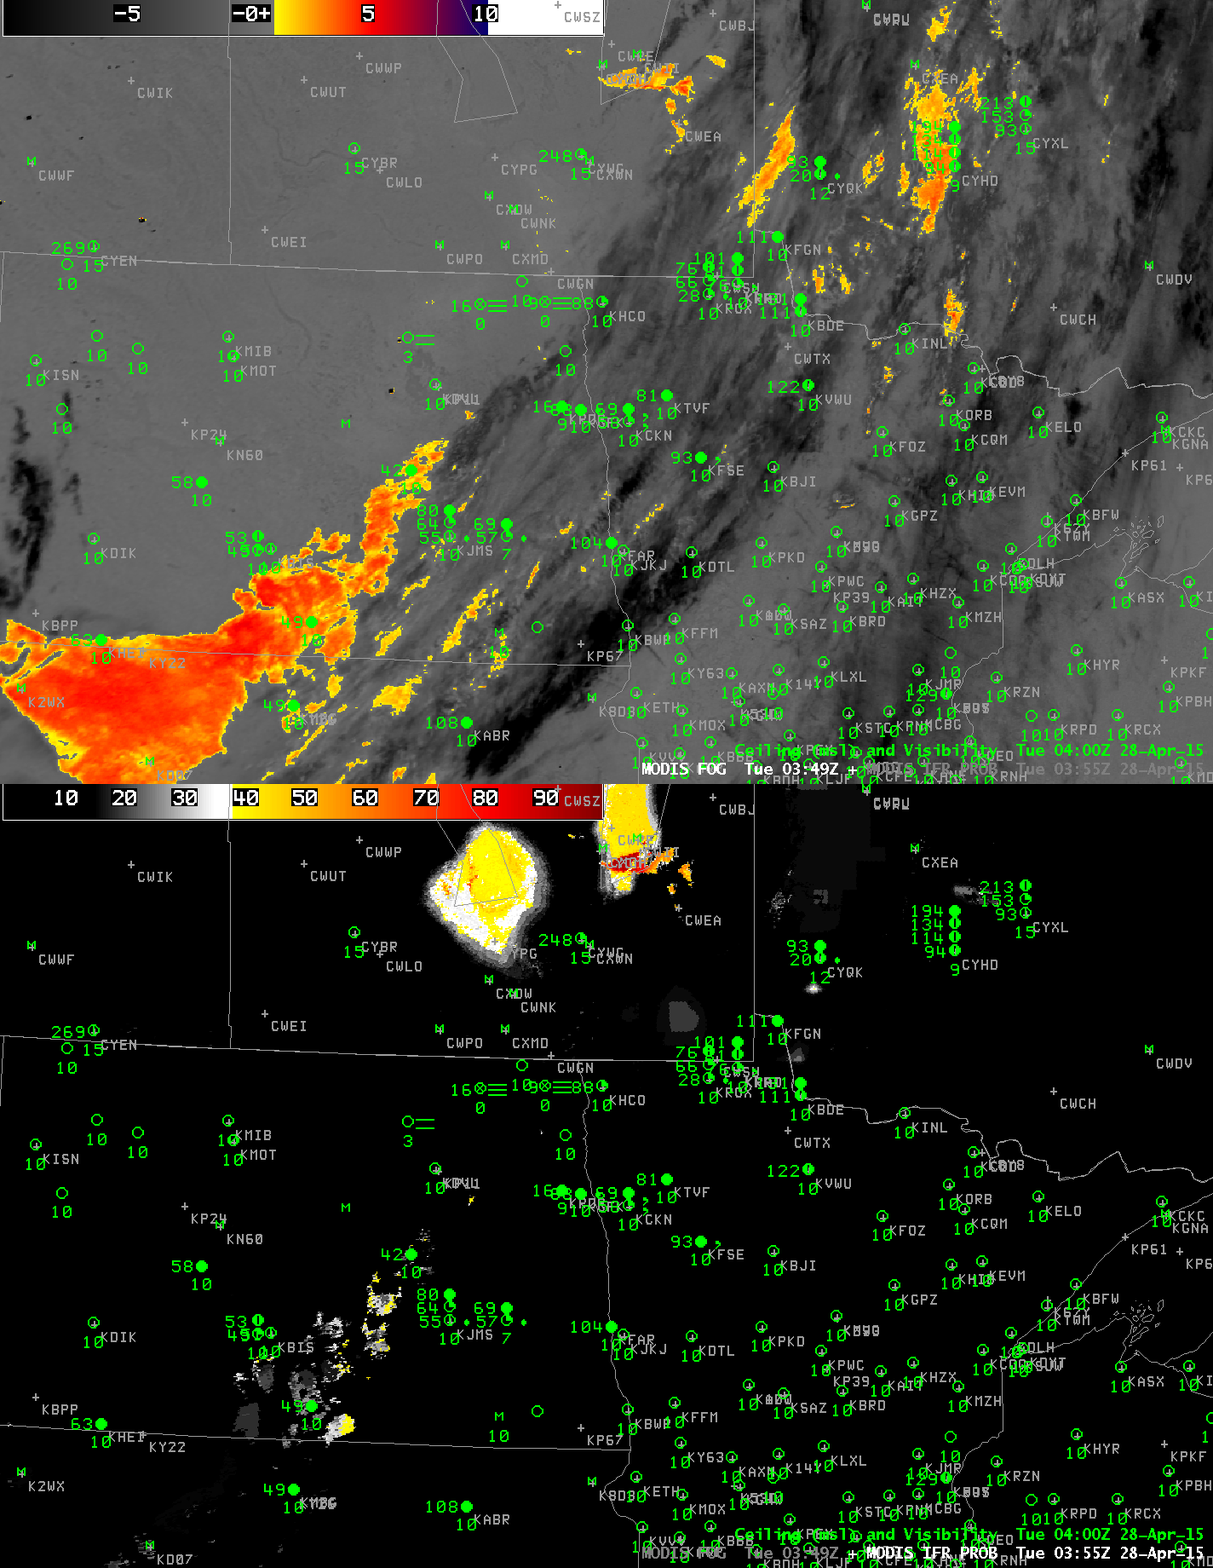
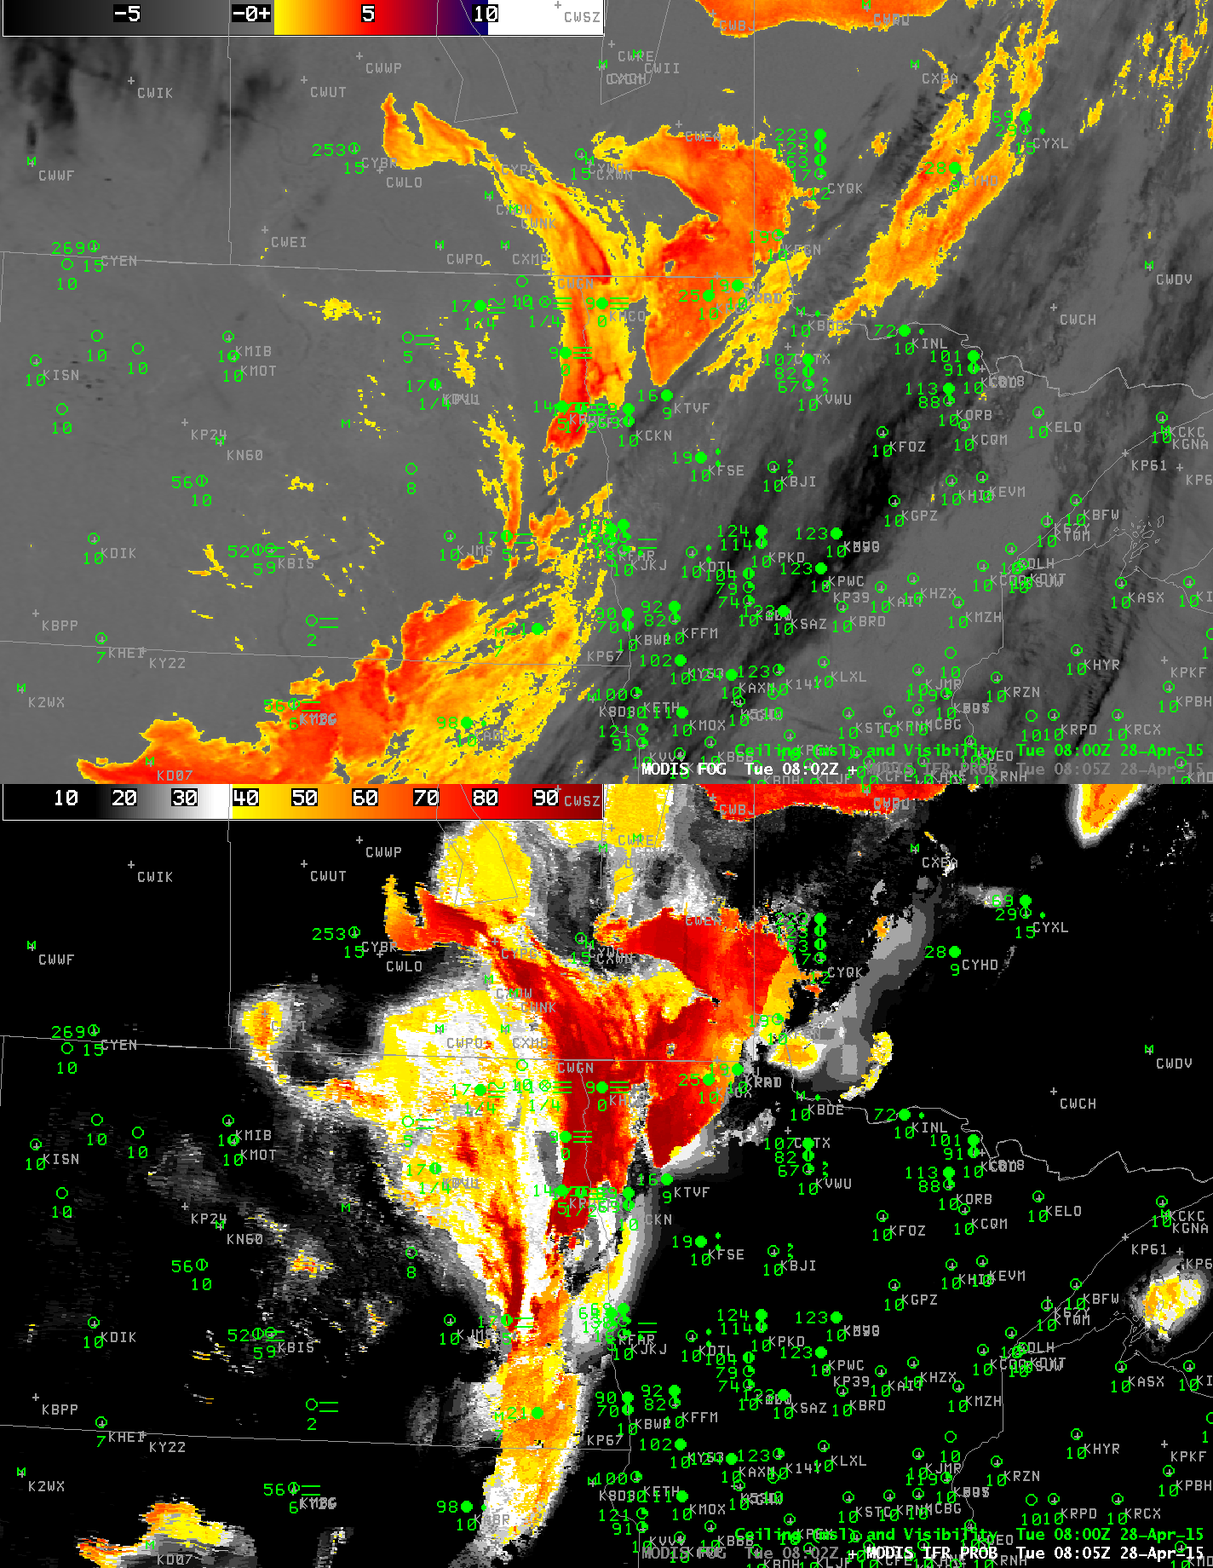
Geostationary GOES fields give good temporal resolution to the evolving field. Polar orbiting satellites, such as Suomi NPP (carrying the VIIRS instrument) and Terra/Aqua (each carrying MODIS) each gave snapshot views of the developing fog. At 0355, IFR Probabilities are low, and the Red River valley is mostly obscured by higher clouds. Four hours later, at 0805 UTC, dense fog has developed and IFR probabilities are large.

MODIS_FOG_IFR_PROB_20150428_0355

Terra MODIS Brightness Temperature Difference (11µm – 3.9µm) and IFR Probability fields, ~0355 UTC on 28 April 2015 (Click to enlarge)

MODIS_FOG_IFR_PROB_20150428_0805

Aqua MODIS Brightness Temperature Difference (11µm – 3.9µm) and IFR Probability fields, ~0805 UTC on 28 April 2015 (Click to enlarge)

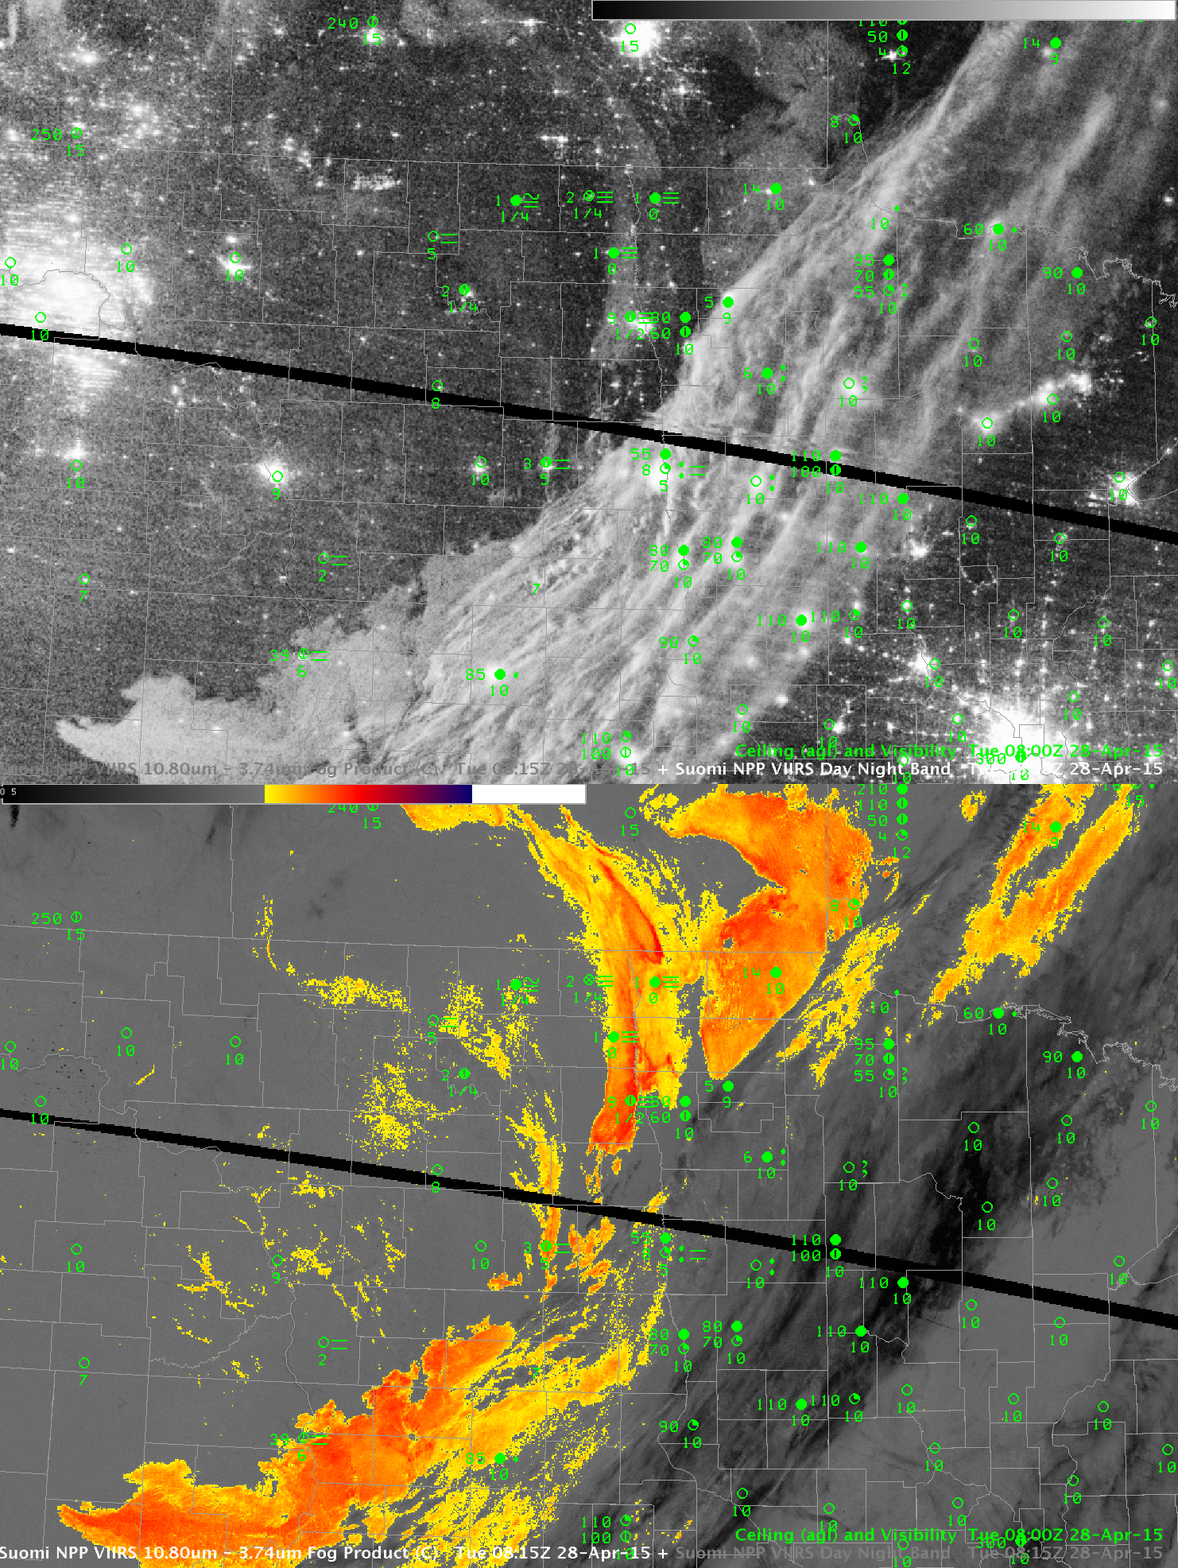
Suomi NPP also viewed the fog field. The toggle between the Day Night Band and the Brightness Temperature Difference field (11.45µm – 3.74µm), below, shows evidence of fog in the visible Day Night band imagery.  The lights of western North Dakota’s oil shale fields are also evident.

Polar-orbiting satellites give excellent high-resolution imagery of fog fields. When used in concert with the excellent time resolution of GOES imagery, a complete picture of the evolving fog field can be drawn.

SNPP_DNB_BTD_0815UTC_28April2015

Toggle between Day Night Band (0.70 µm) and Brightness Temperature Difference (11.45µm – 3.74µm) field from VIIRS on Suomi NPP at 0815 UTC (Click to enlarge)

Fog over the Northern Plains

Reg_11-3.9_Sat_20150128_03_15anim

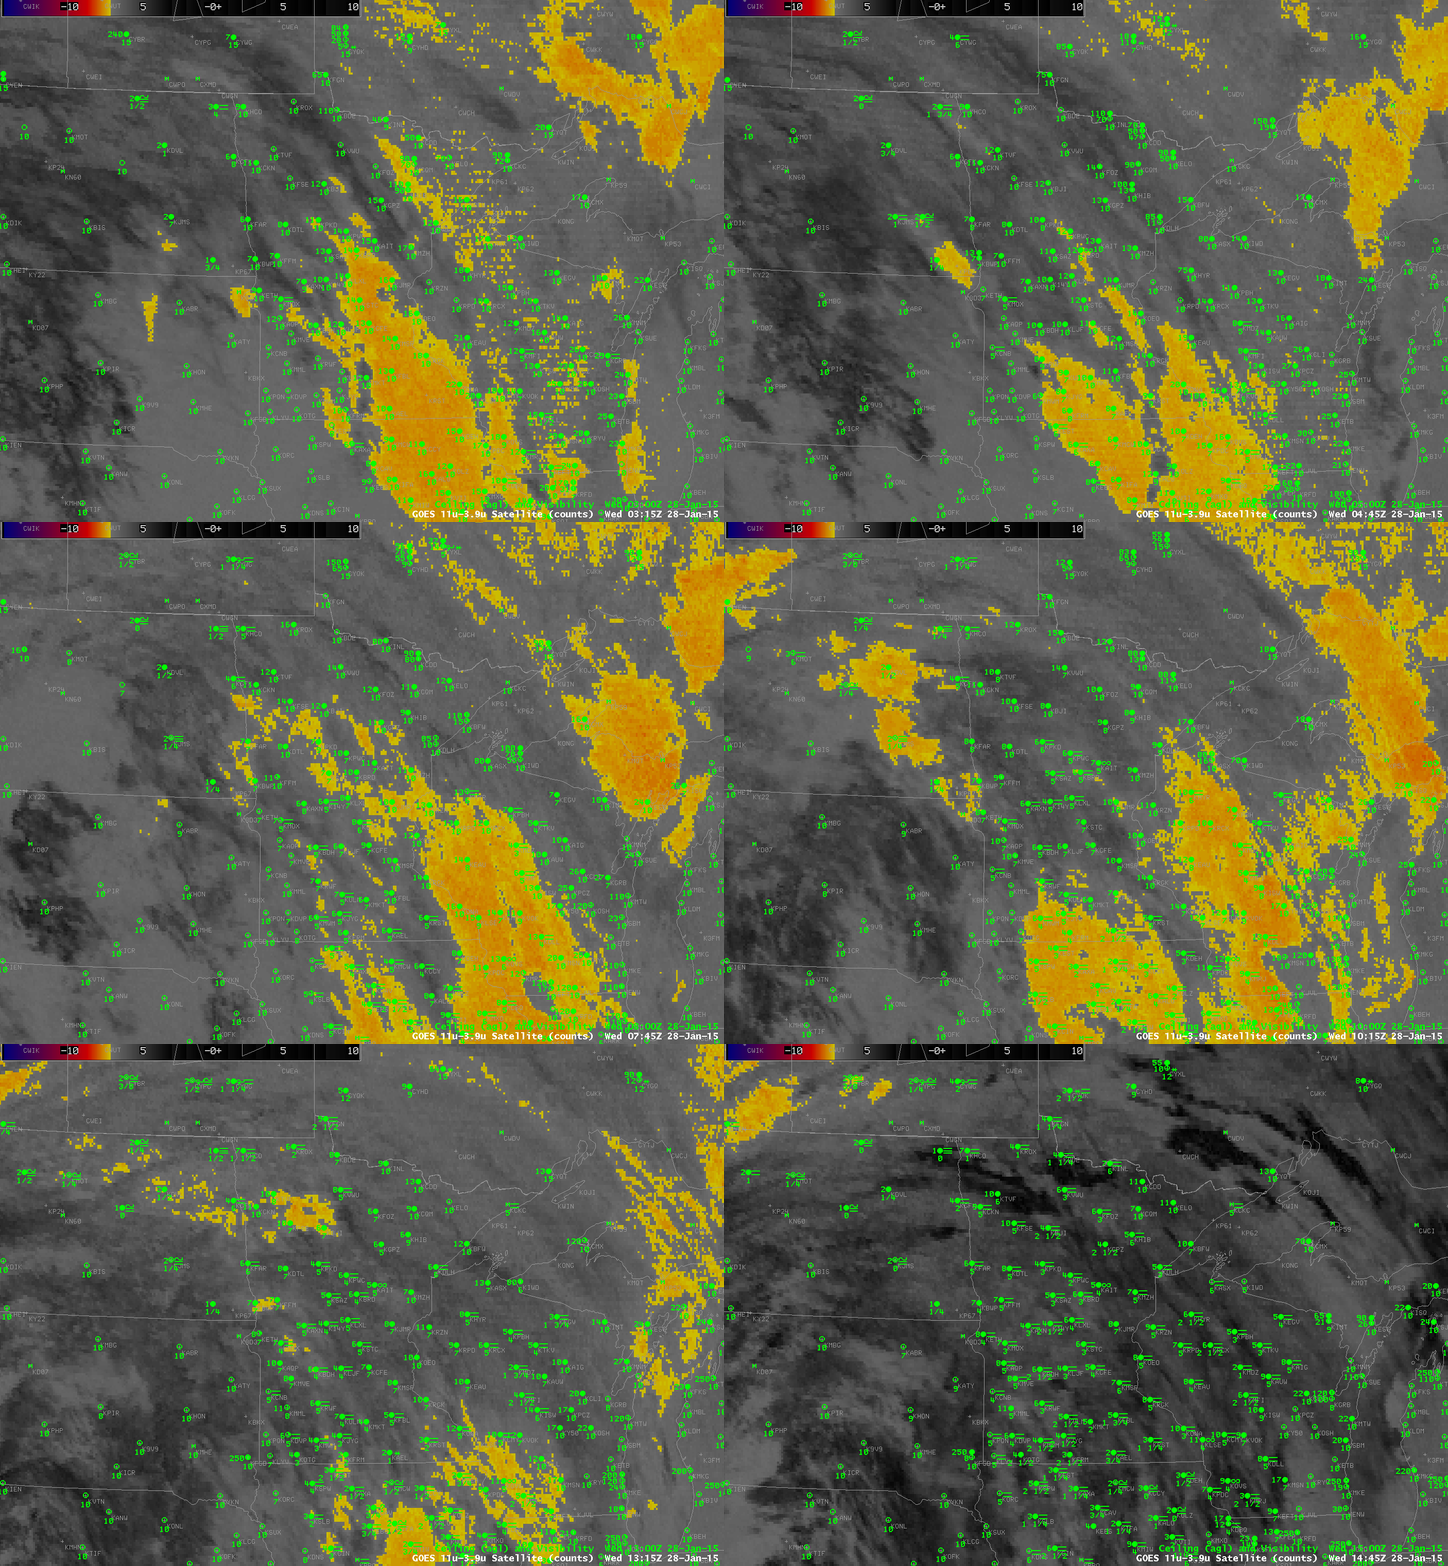
Brightness Temperature Difference (10.7µm – 3.9µm) field from GOES-13, half-hourly from 0315 through 1445 UTC, 28 January 2015, along with surface observations of ceiling and visibility (Click to enlarge)

The traditional method of detecting fog/low stratus is the brightness temperature difference between the shortwave (3.9 µm) and longwave (10.7 µm) infrared channels on GOES. This identification scheme is based on the fact that water droplets do not emit shortwave radiation (3.9 µm) as a blackbody; because of that, the amount of shortwave radiation detected by the satellite is less than it would be if blackboard emissivity were occurring, and the inferred temperature (computed assuming blackboard emission) of the emitting cloud is therefore colder. Water droplets do emit longwave radiation more like a blackbody, so the 10.7 µm brightness temperature is warmer. If the satellite view of low clouds is blocked by cirrus, as above, or by mid-level clouds, then satellite detection of low clouds/fog is hampered or impossible. In the animation above, there are many regions of near-IFR or IFR conditions — low ceilings and reduced visibility — where the Brightness Temperature Difference Product gives no indication that fog/low stratus exists.
GOES_IFR_PROB_20150128_03_15anim

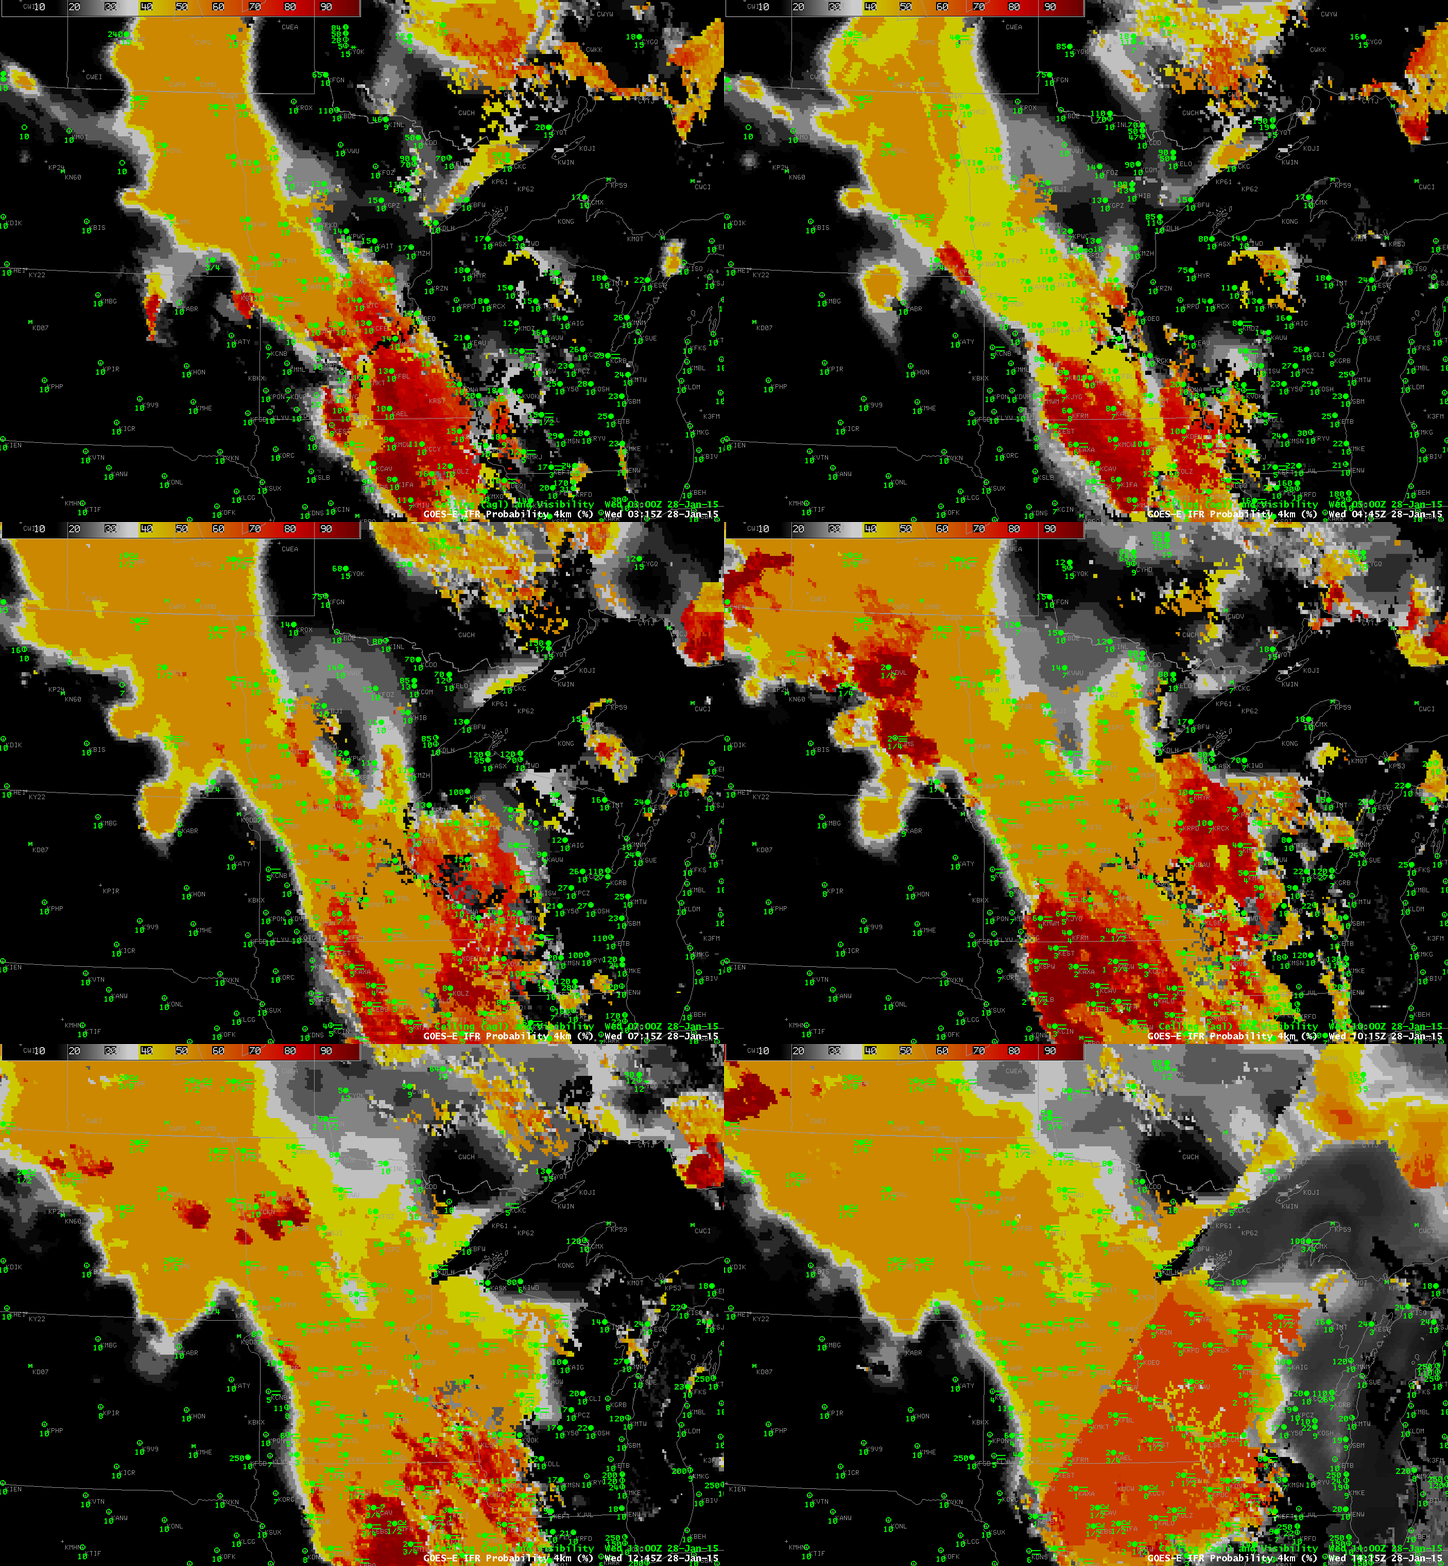
GOES-R IFR Probability fields from GOES-13, half-hourly from 0315 through 1415 UTC, 28 January 2015, along with surface observations of ceiling and visibility (Click to enlarge)

GOES-R IFR Probability fields, above, better capture the horizontal extent of the low ceilings and reduced visibilities. This is because surface data is incorporated into the fields via output from the Rapid Refresh Model output. IFR Probabilities are heightened where the Rapid Refresh Model shows saturation (or near saturation) near the surface, and that includes regions under high/middle clouds, such as the Red River Valley between Minnesota and North Dakota. That model data are controlling the value of the IFR Probability field in those regions is apparent because of two things: (1) The field is horizontally uniform, and not pixelated as it is in regions where higher-resolution satellite data can be used; (2) IFR probability values are smaller because there is less certainty that low clouds are present because the satellite cannot detect them. A well-trained user of this product, then, will interpret IFR Probability values of around 50-60 percent differently in regions of high clouds vs. in regions where low clouds only are present. Note the obvious line in the fields at 1415 UTC — the last image in the animation. This is the boundary between night-time predictors (to the north and west) and daytime predictors (to the south and east). Generally, IFR Probabilities increase as the sun rises because visible satellite data can be used to distinguish between clear and cloudy skies. If there is more certainty that clouds exist, then IFR Probabilities will be greater.

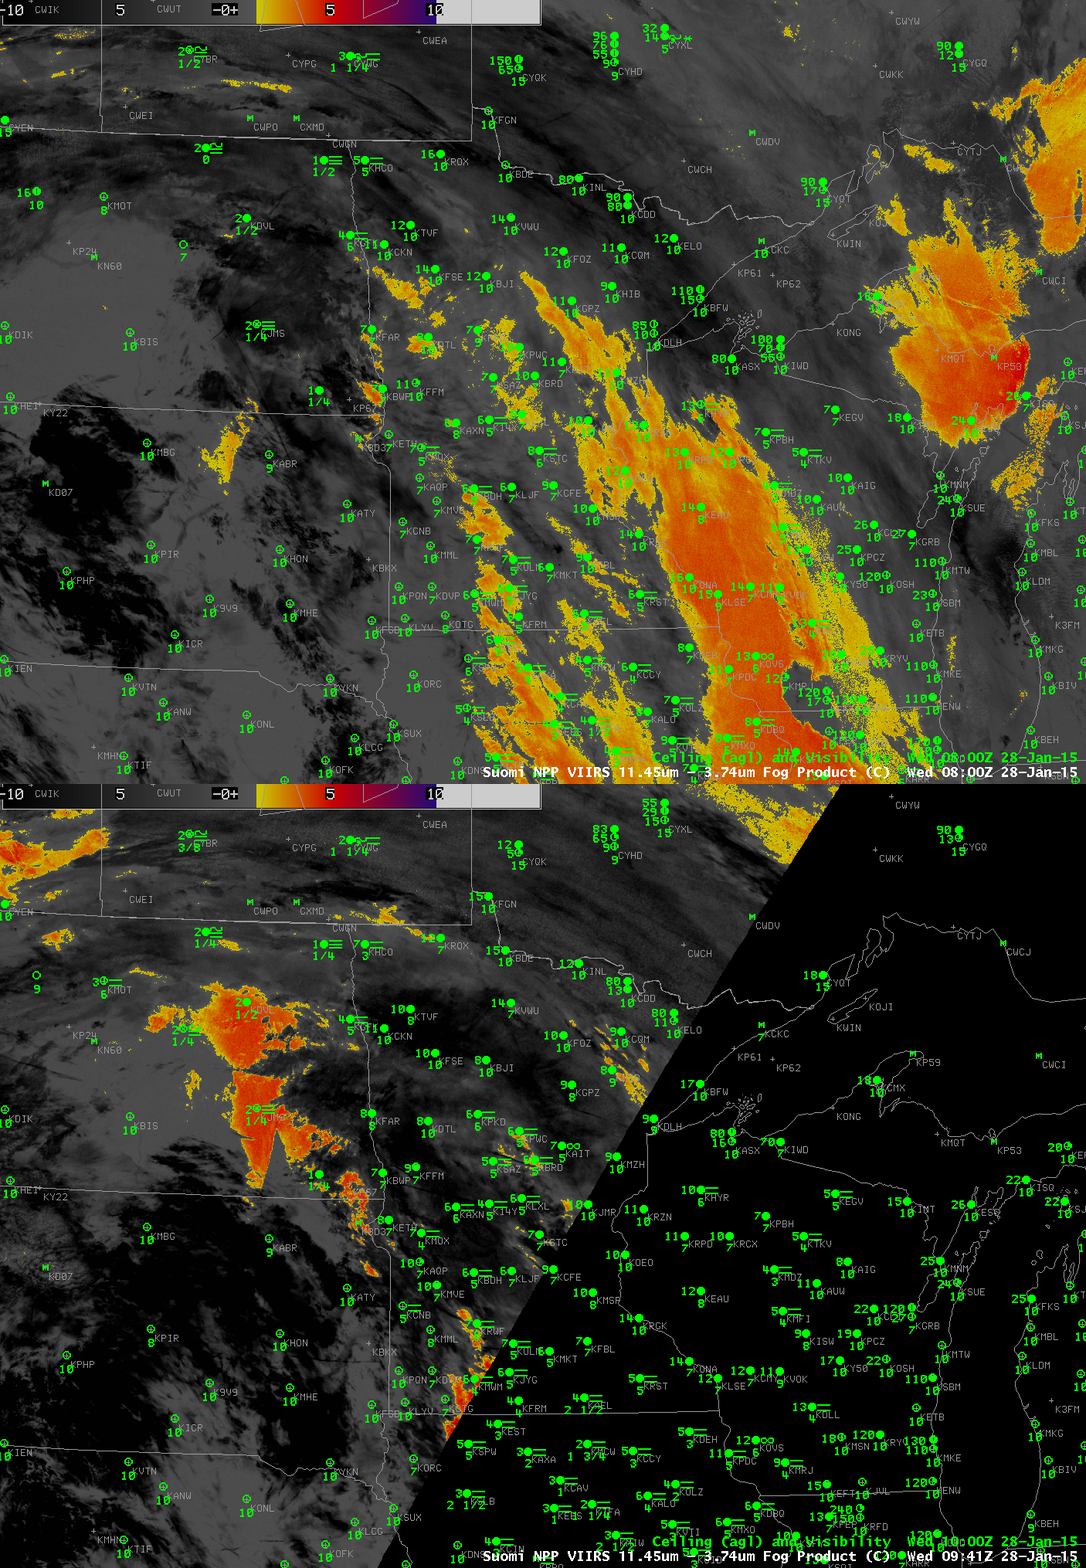
MODIS and Suomi NPP overflew this region and provided information about the clouds. GOES-R IFR Probability is not yet computed using Suomi NPP data; the brightness temperature difference product (11.35 – 3.74), below, shows the widespread cirrus over the region during two sequential overpasses. Scattered breaks allow identification of low clouds. As with any brightness temperature difference product, however, the information is about the top of the cloud, not necessarily the cloud base.
VIIRS_FOG_20150128_0800_0941

Brightness Temperature Difference (11.35 µm – 3.74 µm) field from Suomi NPP at 0800 and 0941 UTC 28 January 2015, along with surface observations of ceiling and visibility (Click to enlarge)

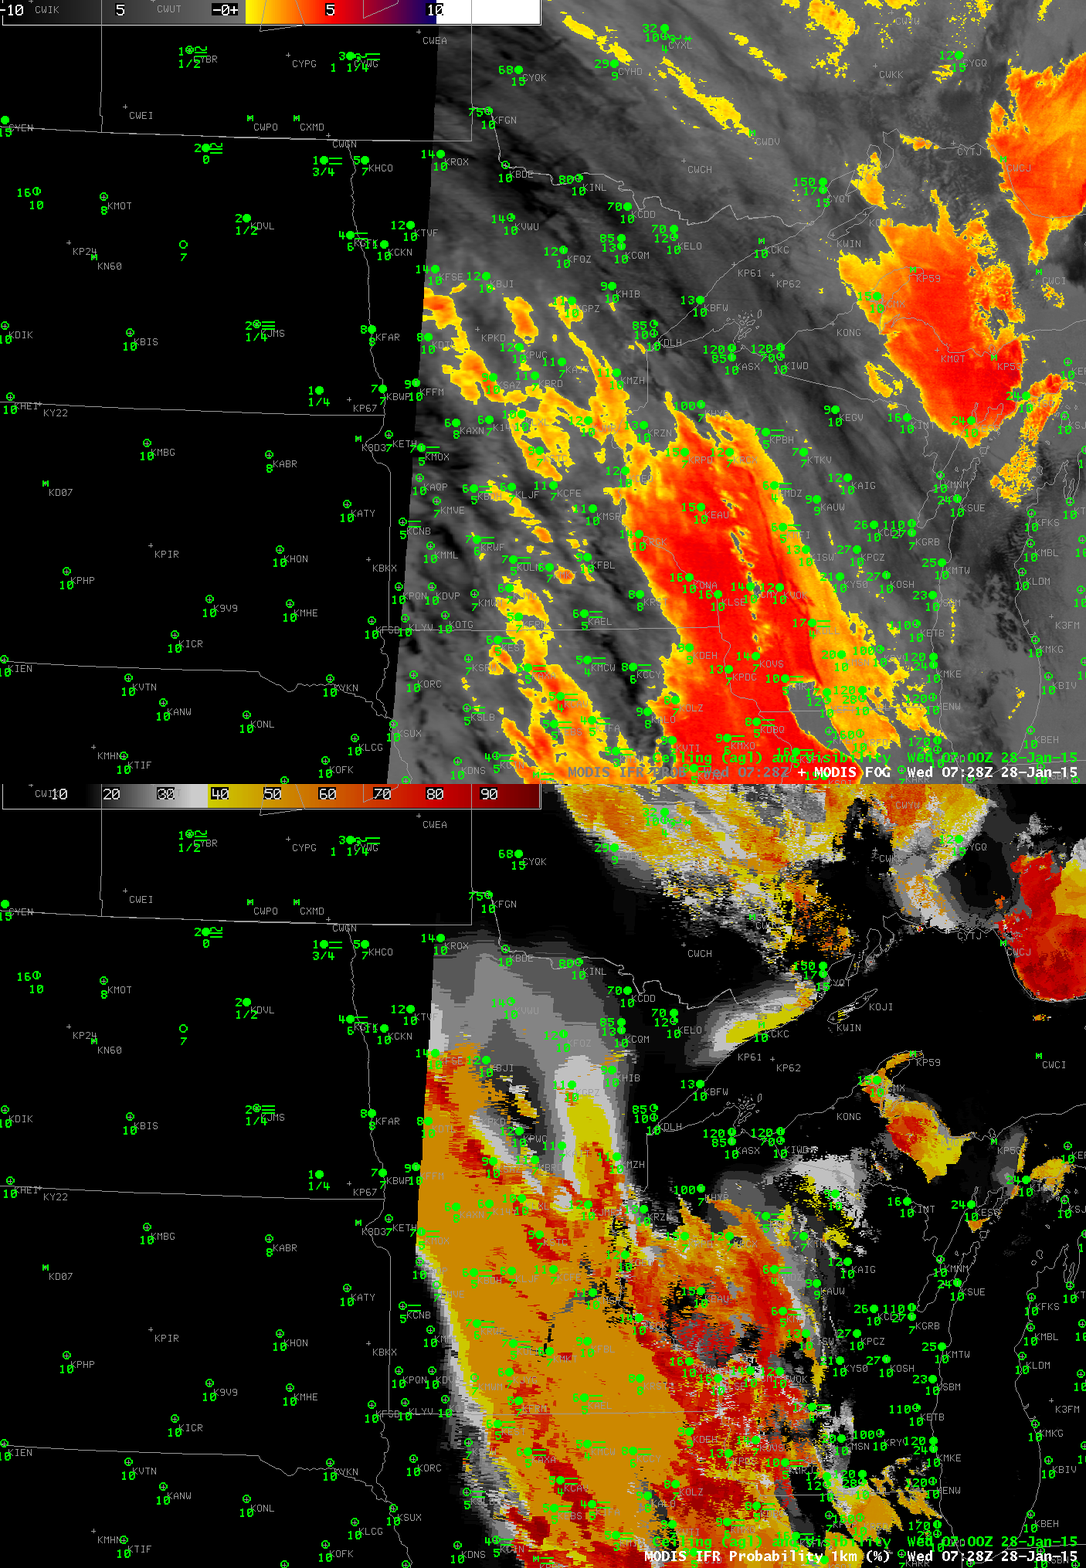
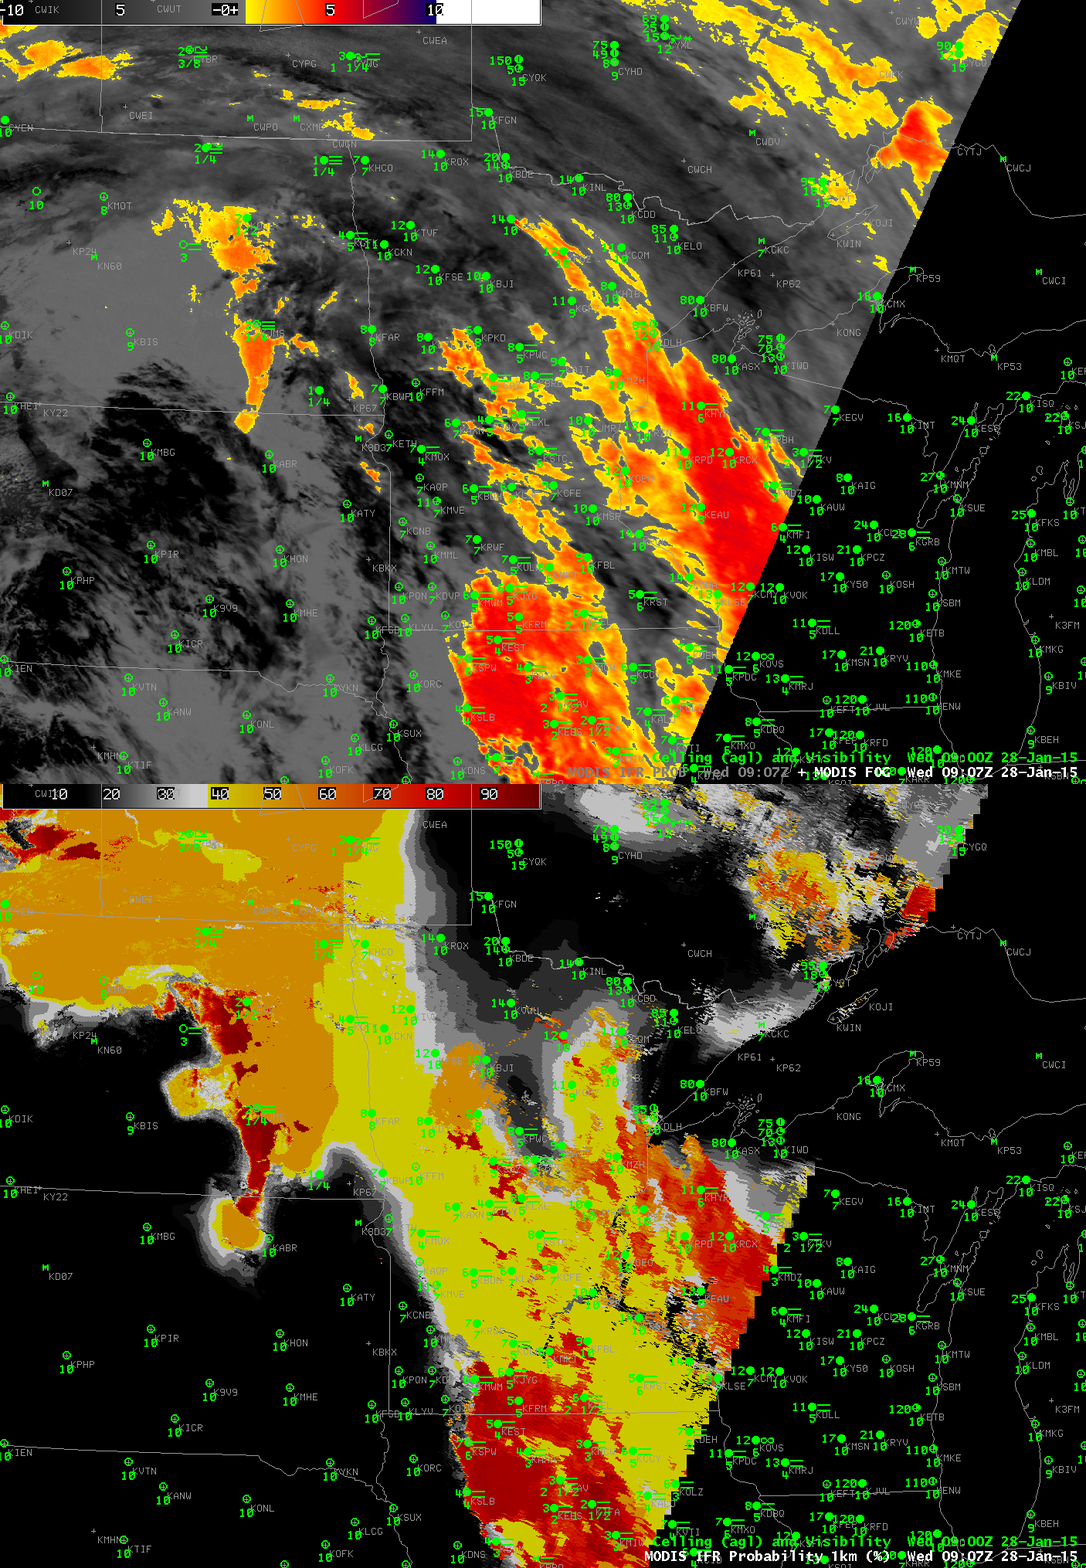
Aqua MODIS estimates of fog are shown below at 0728 and 0907 UTC. Detection using the Brightness Temperature Difference field is hampered by cirrus clouds. IFR Probability fields identify regions under cirrus that show IFR conditions.
MODIS_IFRPROB_FOG_20150128_0728toggle

MODIS Brightness Temperature Difference field and MODIS-based GOES-R IFR Probabilities, 0728 UTC 28 January, with surface observations of ceilings and visibility (Click to enlarge)
MODIS_IFRPROB_FOG_20150128_0907toggle

MODIS Brightness Temperature Difference field and MODIS-based GOES-R IFR Probabilities, 0907 UTC 28 January, with surface observations of ceilings and visibility (Click to enlarge)

IFR Probability when an extratropical storm passes by

The approach of an extratropical cyclone, such as the Colorado Cyclone in this animation in the upper Midwest on 10 September 2014, will frequently result in areas of IFR or near-IFR conditions. However, the many cloud layers that accompany these baroclinic disturbances will always make difficult the task of identifying (using satellite imagery) regions of low stratus and fog. Consider the animation below of Brightness Temperature Difference (10.7µm – 3.9µm) fields (a traditional method of detecting water-based clouds) over the Upper Midwest on 10 September.

BTD_10Sep2014_02-14UTC

Color-enhanced Brightness Temperature Difference fields (10.7µm – 3.9µm), hourly from 0100 UTC to 1400 UTC on 10 September 2014 (Click to enlarge)
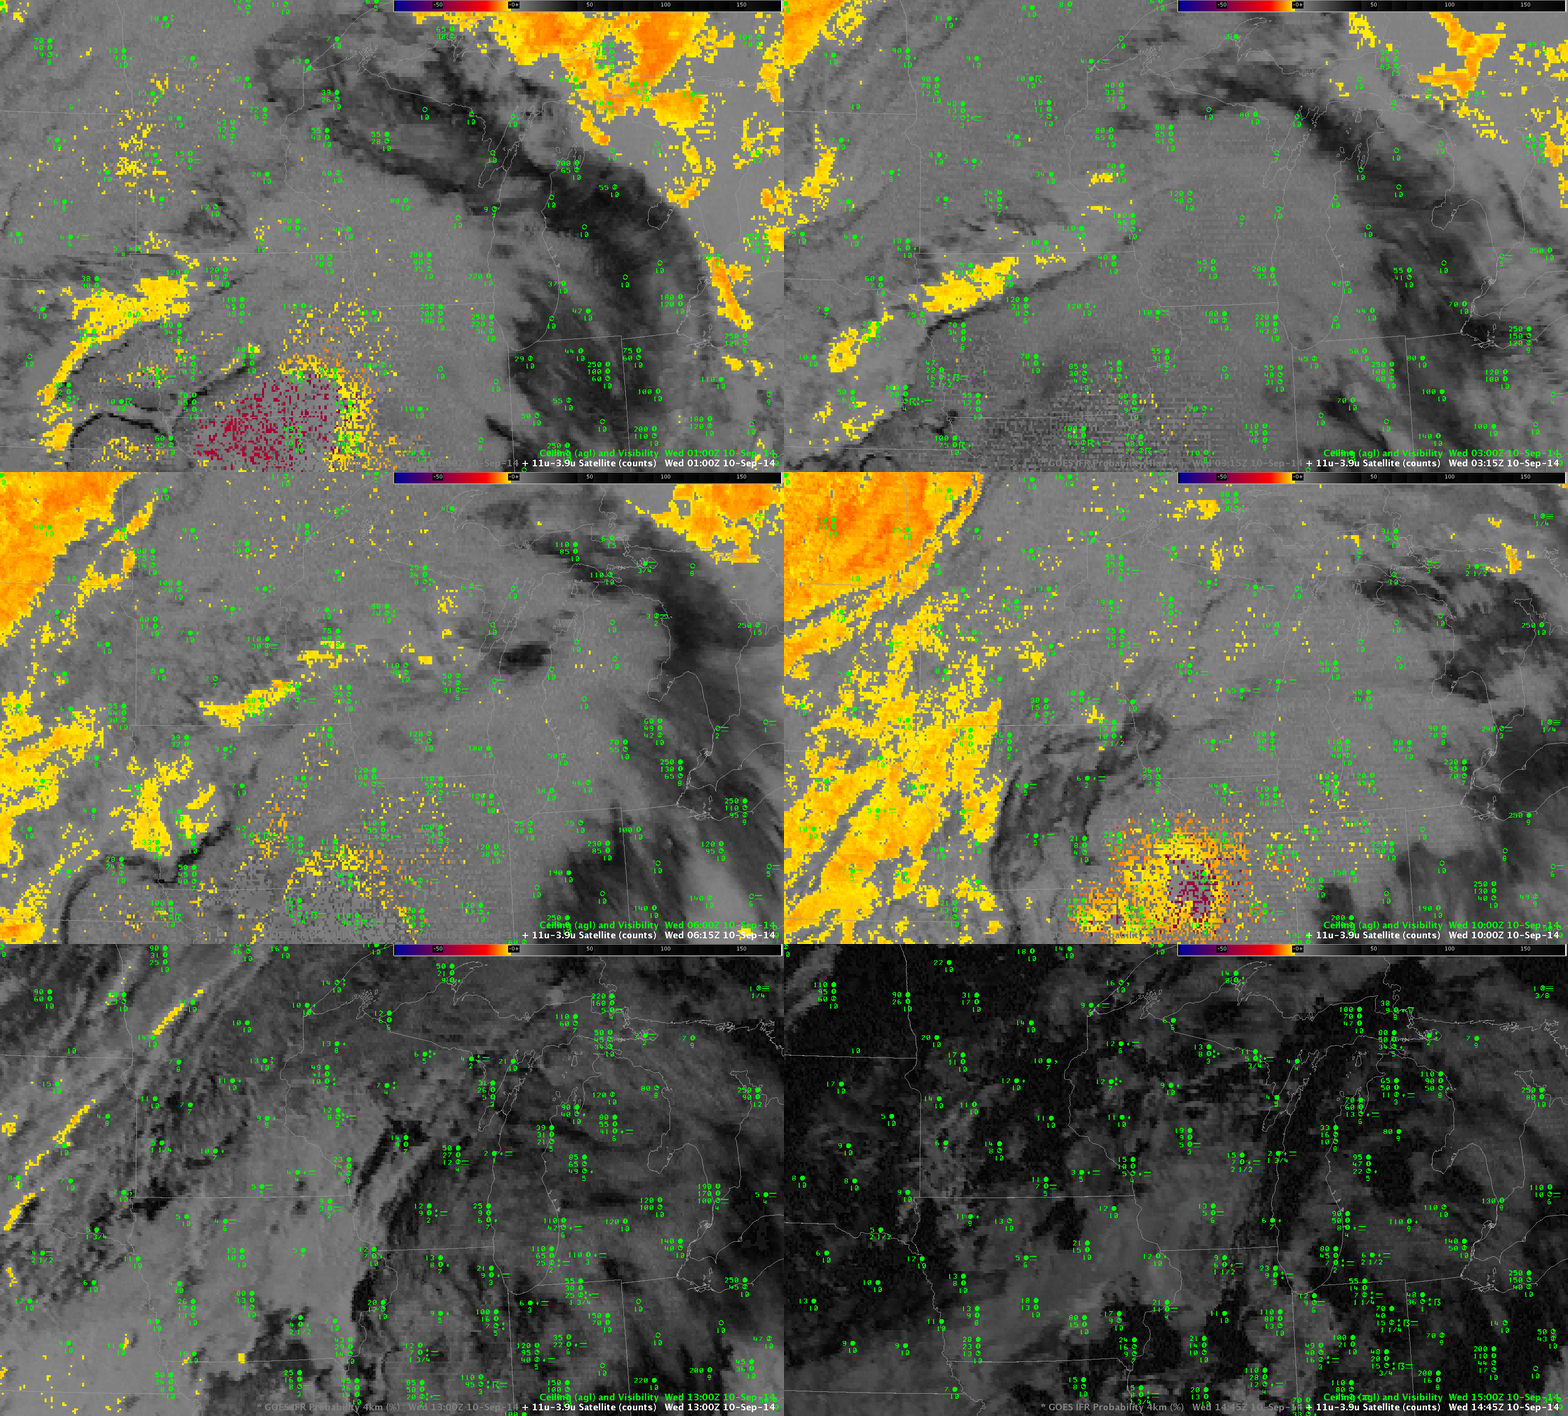
Interpretation of this loop is time-consuming. Not only is there little distinct signal related to observed IFR and near-IFR conditions, but the rising sun (at the end of the animation) causes the Brightness Temperature Difference to flip sign, altering the enhancement. There are regions where the Brightness Temperature Difference field detects water-based clouds that may be associated with fog or stratus, chiefly over the western third of the domain (and especially over the Dakotas) in the later half of the animation.

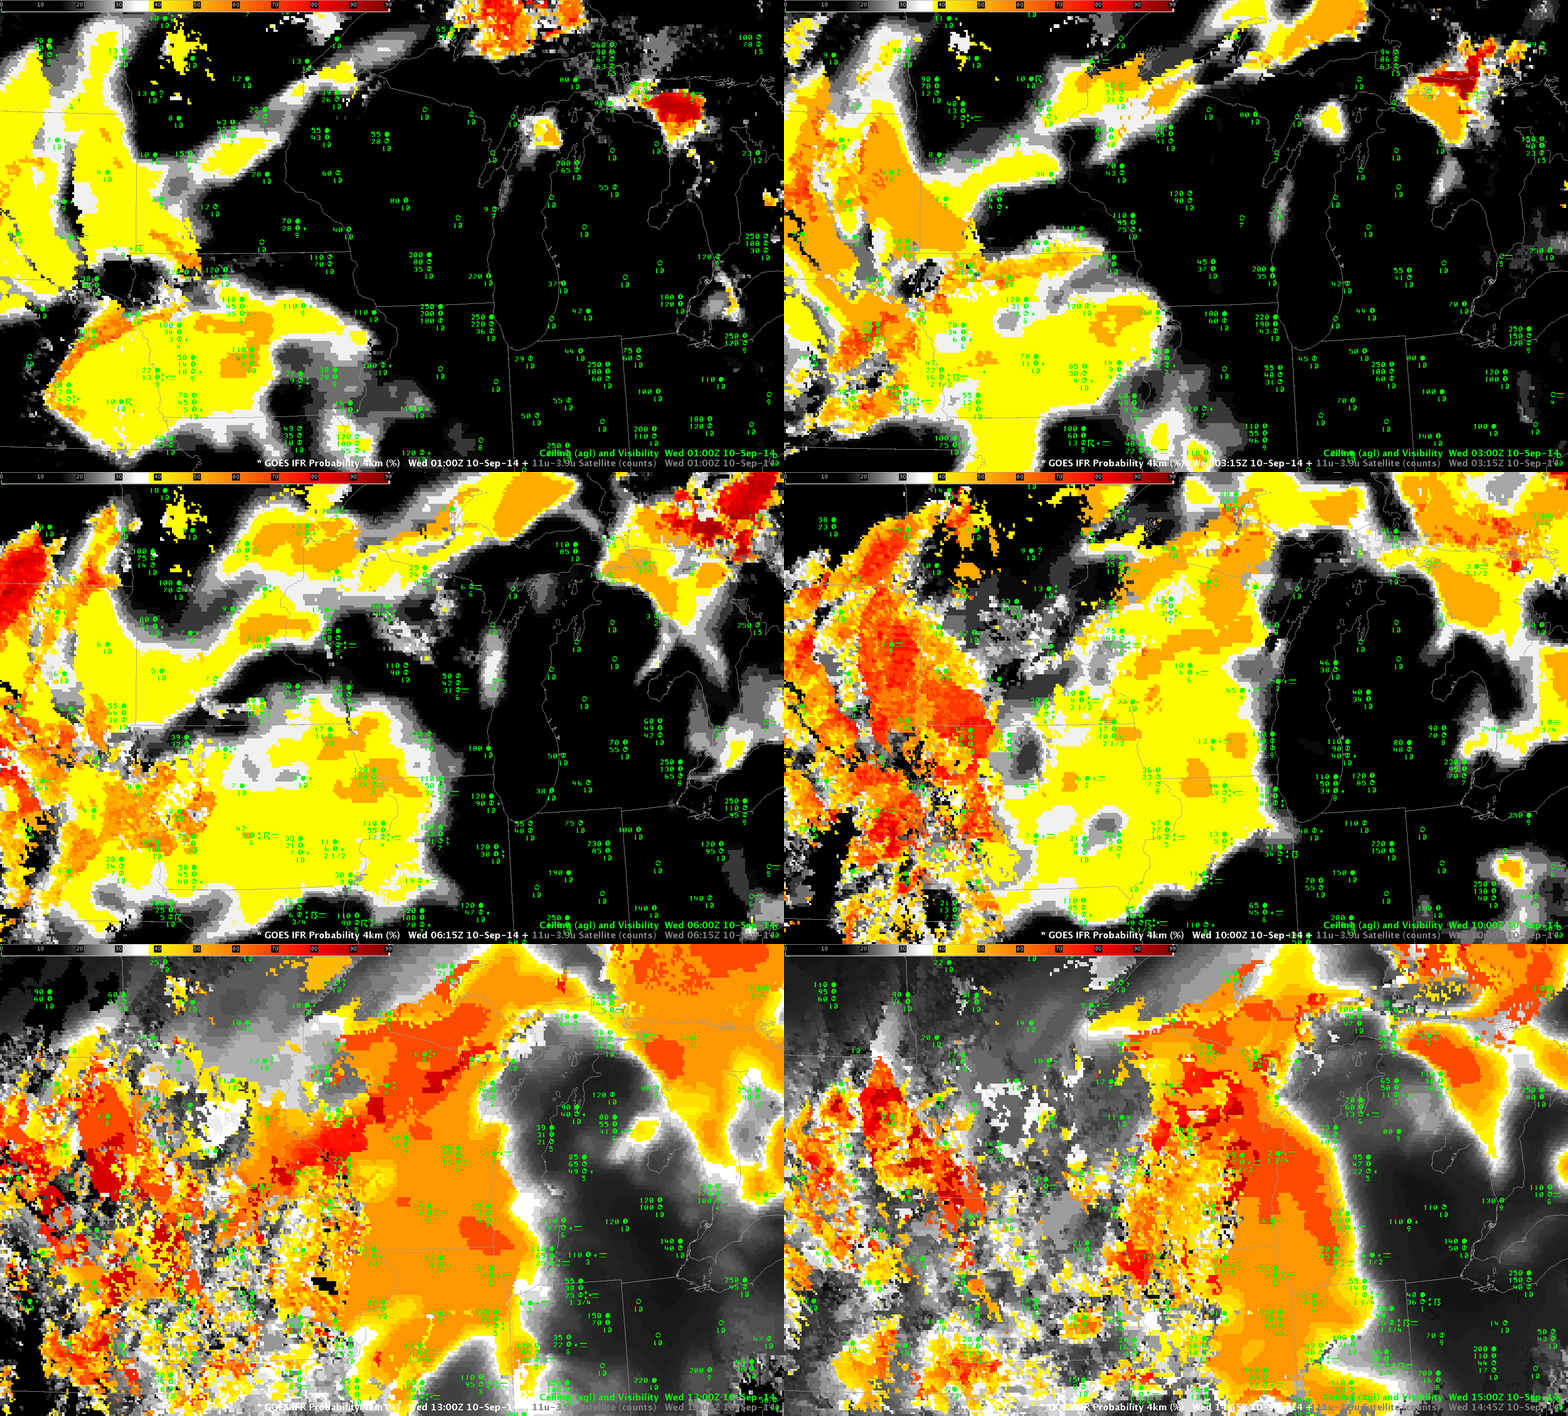
Compare the animation above to the loop of IFR Probabilities for the same time period below. IFR Probabilities are highest where near-IFR or IFR conditions are present, and the IFR Probability field screens out regions where low stratus (but not fog) is present, such as over the Dakotas at the end of the animation. Regions where IFR Probability fields have a flat character — such as over Wisconsin around sunrise — are where only Rapid Refresh model data (but not satellite data) are used as predictors, and the field does not have pixel-scale variability. Because fewer predictors are used, the magnitude of the IFR Probability is smaller than in regions where both satellite and model data can be used as Predictors. Thus, a flat field (over eastern Wisconsin at the end of the animation, or over Iowa at the beginning) has values that should be interpreted differently from similar values in regions where both satellite and model data can be used in the computation of IFR Probabilities.

IFRPROB_10Sep2014_01-14UTC

GOES-R IFR Probability fields (Computed from GOES-13 and Rapid Refresh Data), hourly from 0100 UTC to 1400 UTC on 10 September 2014 (Click to enlarge)
IFR Conditions under multiple cloud layers

Duluth_4panel_2030UTC_29August2014

GOES-R IFR Probabilities with surface observations of ceilings and visibilities (Upper Left), GOES-East Visible Image (Upper Right), GOES-East Brightness Temperature Difference (10.7 µm – 3.9 µm) (Lower Right), GOES-R Cloud Thickness (Lower Left), all near 2100 UTC (Click to enlarge)
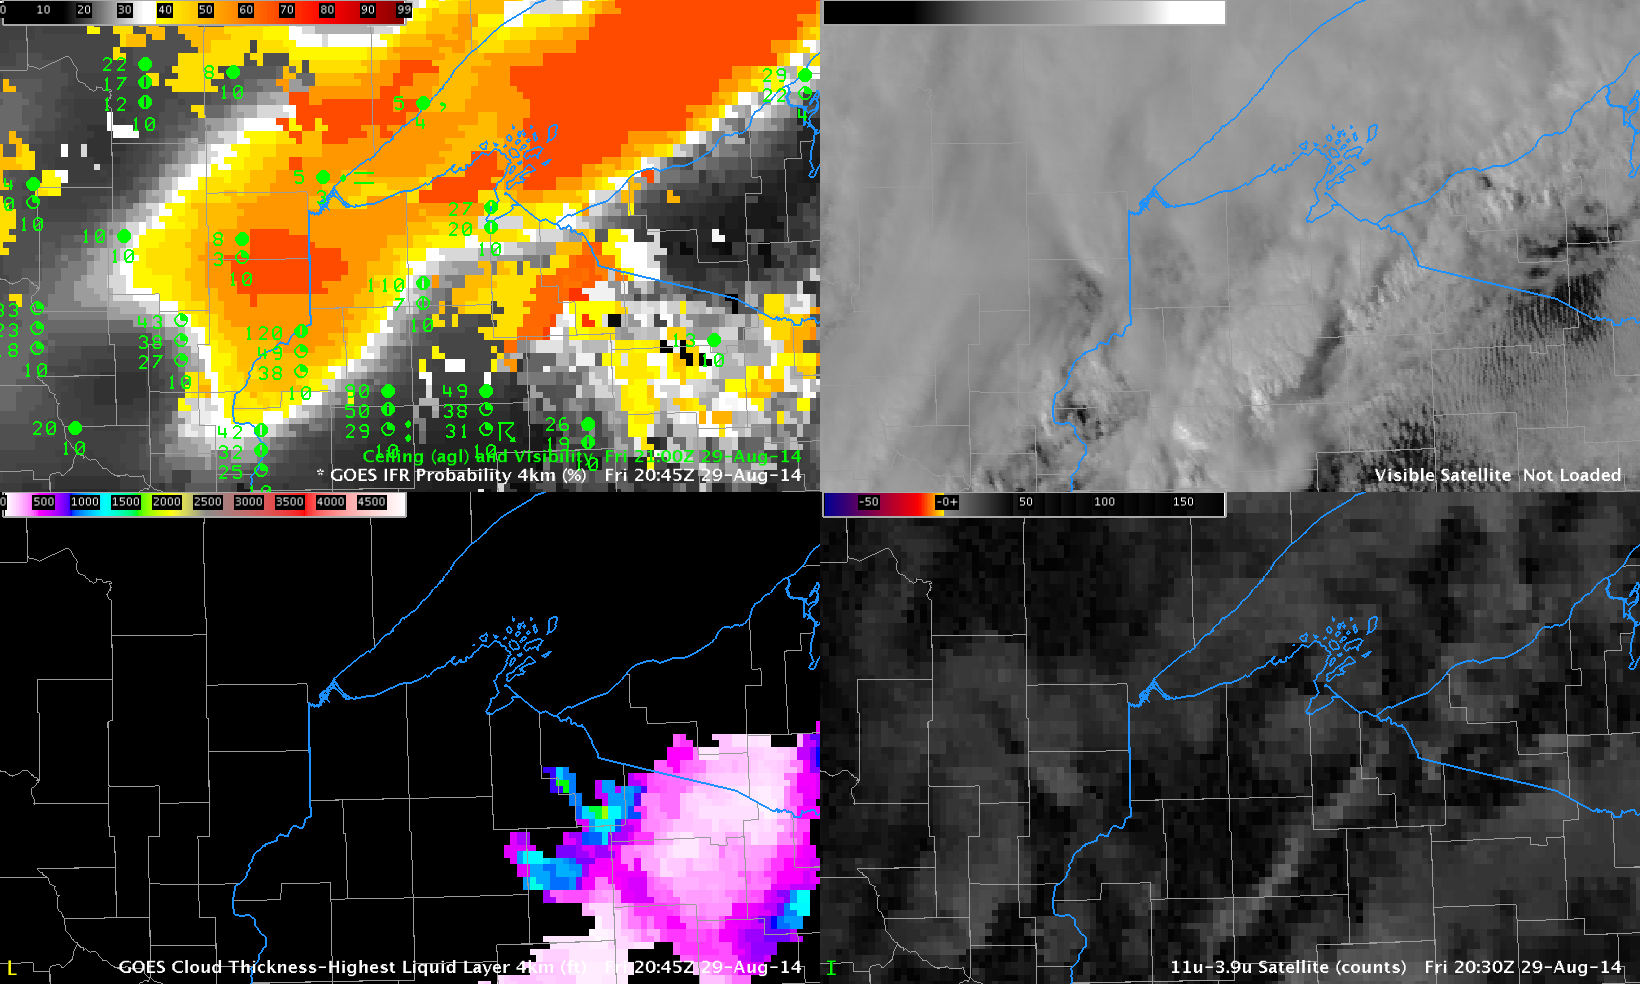
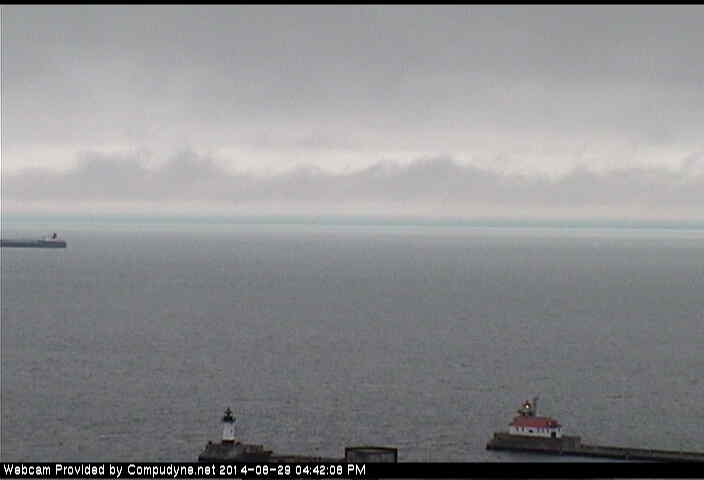
IFR and near-IFR conditions existed near Duluth Minnesota during the day on 29 August 2014; How does information from the satellite help to diagnose the IFR conditions? Both the visible and brightness temperature difference fields, above, show widespread cloudiness, with convective features over Wisconsin and multiple cloud decks over Wisconsin and Minnesota. These multiple cloud decks show no apparent relationship the observed IFR or near-IFR conditions. In cases such as these, the low-level information available through the Rapid Refresh Model is key to providing information defining exactly where the lowest ceilings and visibilities exist. In the case above, that region is centered near Duluth, extending to the southwest. IFR Probabilities are elevated in regions where visibilities and ceilings are low, and they increase as the cloud ceiling increases. The image below shows Duluth Harbor at about 2140 UTC; the low ceiling is apparent (Source).

DLHlivecam2139