Monthly Archives: November 2016

Dense Fog in Georgia and Florida

ifrprob_25nov2016_0000_1300anim

GOES-R IFR Probability Fields, 0000 – 1300 UTC on 25 November 2016 (Click to enlarge)

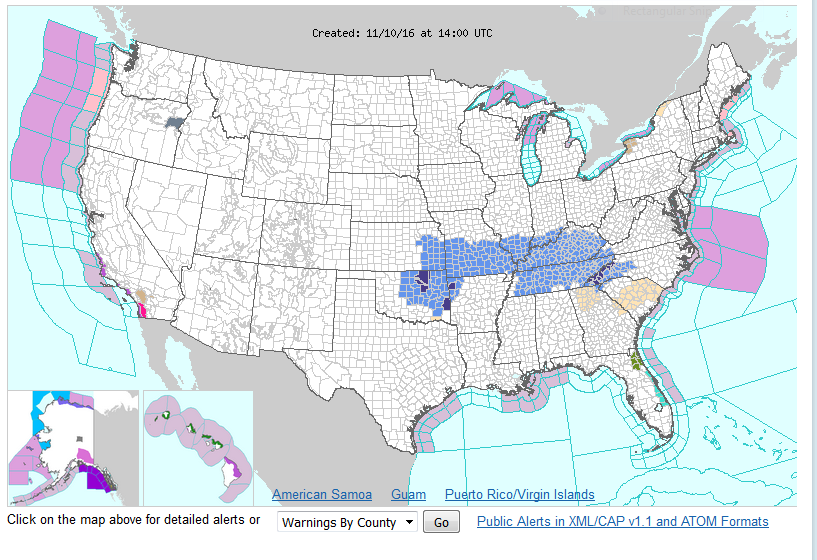
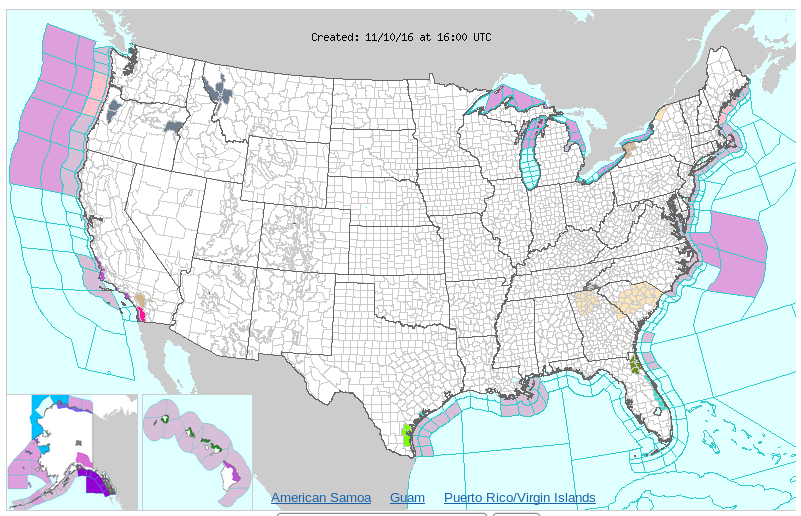
Light winds and a long November night allowed radiation fog formation over much of the deep south early on 25 November 2016. (1200 UTC Surface analysis is here). The Aviation Weather Center Website indicated widespread IFR Conditions, below, over the south, with the sigmet suggesting improving visibilities after 1400 UTC.

The animation above shows the evolution of the GOES-R IFR Probability fields from just after sunset to just after sunrise. There is a good spatial match between observed IFR conditions and the developing field. IFR Probability can thus be a good situational awareness tool, identifying regions where IFR Conditions exist, or may be developing presently.

awc_1400utc_25nov2016_ifr

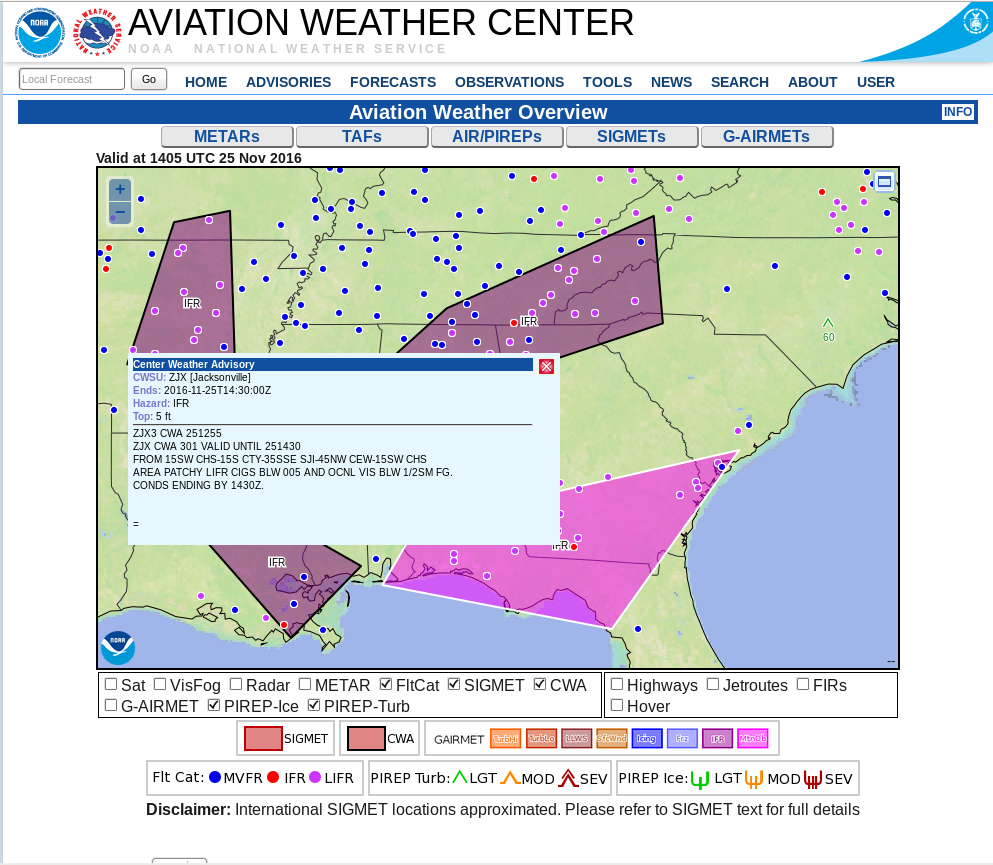
Screenshot of Aviation Weather Center Front Page, 1405 UTC on 25 November (Click to enlarge)

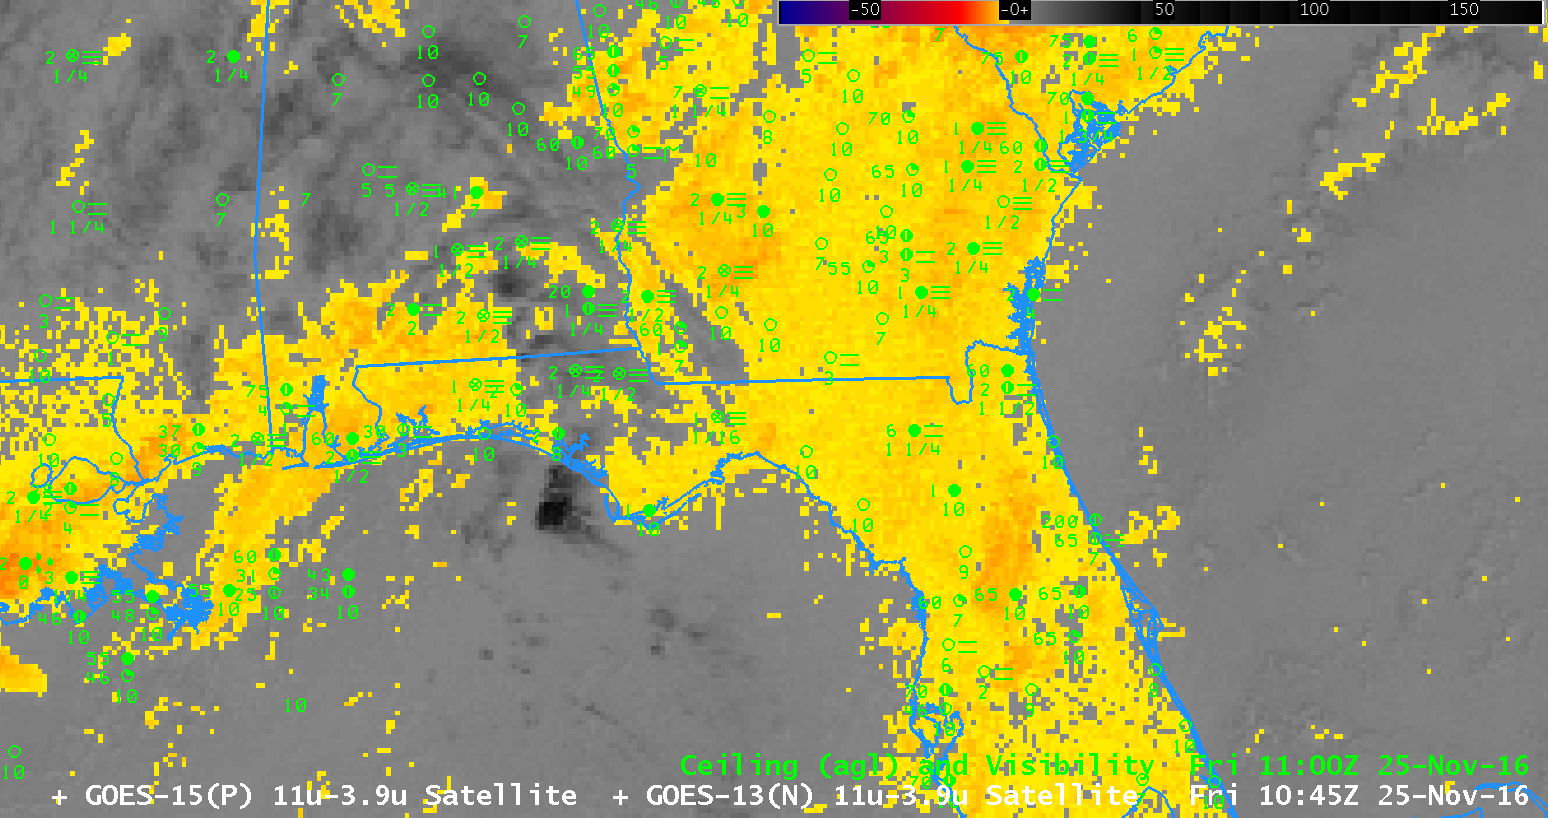
Did the GOES-13 Brightness Temperature Difference Field identify the fields? The animation below, from 0200-1300 UTC, shows a widespread signal that shows no distinguishable correlation with observed IFR conditions.  Note also how the rising sun at the end of the animation changes the difference field as more and more reflected solar radiation with a wavelength of 3.9 µm is present.  In addition, high clouds that move from the west (starting at 0400 UTC over Louisiana) prevent the satellite from viewing low clouds in regions where IFR conditions exist.

btd_25nov2016_0200_1300anim

GOES-13 Brightness Temperature Difference field (3.9 µm – 10.7 µm), 0200-1300 UTC on 25 November 2016 (Click to enlarge)

The high clouds that prevent satellite detection of low clouds, as for example at 1100 UTC over parts of Alabama, cause a noticeable change in the IFR Probability fields, as shown in the toggle below.  Values over the central part of the Florida panhandle are suppressed, and the field itself has a flatter character (compared to the pixelated field over southern Georgia, for example, where high clouds are not present).  Even though high clouds prevent the satellite from providing useful information about low clouds in that region, GOES-R IFR Probability fields can provide useful information because of the fused nature of the product:  Rapid Refresh information adds information about low-level saturation there, so IFR Probability values are large.  In contrast, over southern Florida — near Tampa, for example, Rapid Refresh data does not show saturation, and IFR Probabiities are minimized even through the satellite data has a strong signal — caused by mid-level stratus.  Soundings from Tampa and from Cape Kennedy suggest the saturated layer is around 800 mb.

ifr_btd_25nov2016_1100toggle

GOES-R IFR Probability fields and GOES-13 Brightness Temperature Difference Fields, 1100 UTC on 25 November 2016 (Click to enlarge)

GOES-R Cloud Thickness, below, related 3.9 µm emissivity to cloud thickness via a look-up table that was generated using GOES-West Observations of marine stratus and sodar observations of cloud thickness. The last pre-sunrise thickness field, below, is related to dissipation time via this scatterplot. The largest values in the scene below are around 1000 feet, which value suggests a dissipation time of about 3 hours, or at 1445 UTC.

cloudthickness_25nov2016_1145

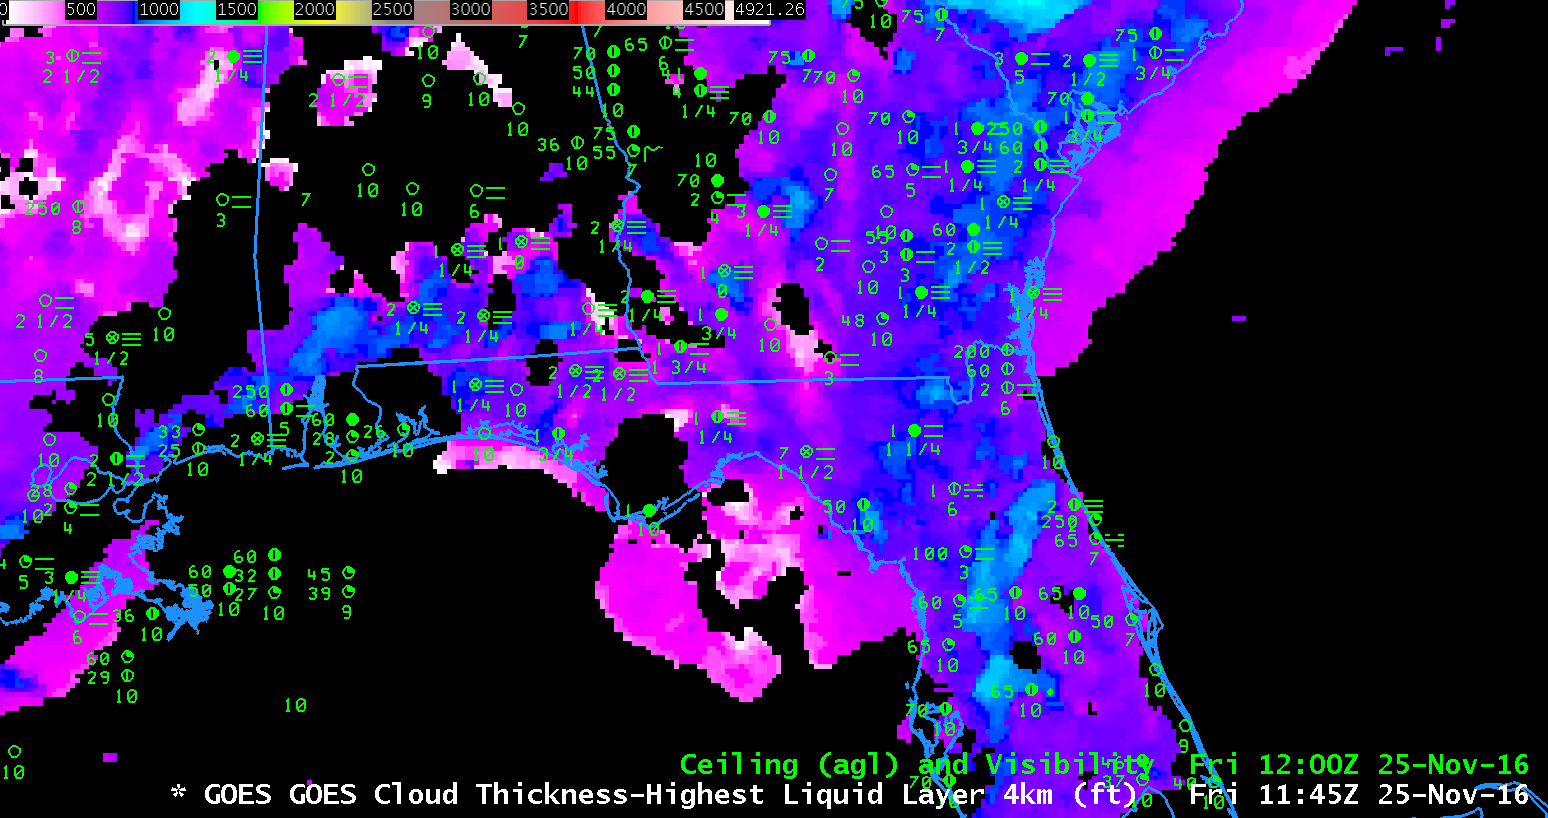
GOES-R Cloud Thickness Field, 1145 UTC on 25 November 2016 (Click to enlarge)

IFR Probability vs. Brightness Temperature Differences over California

btd_21nov2016anim_0600_1200

GOES-15 Brightness Temperature Difference Fields (3.9 µm – 10.7 µm), 0600-1200 UTC on 21 November 2016 (Click to enlarge)

GOES-15 Brightness Temperature Difference fields (3.9 µm – 10.7 µm, above, from 0600-1200 UTC on 21 November) can detect low clouds because water-based clouds do not emit 3.9 µm radiation as a blackbody, but they do emit 10.7 µm radiation as a blackbody. Consequently, the brightness temperature computed from 3.9 µm radiation is cooler than that computed by 10.7 µm radiation. The animation above depicts two challenges that arise from using brightness temperature difference fields. If mid-level clouds or cirrus are present, the satellite cannot view the low-level clouds that might be associated with fog. That is the case above over the San Joaquin Valley at the start of the animation. Later on, as the higher clouds move out, a strong signal develops everywhere. Brightness Temperature Difference fields are not giving useful information because alone they cannot distinguish between mid-level stratus and low stratus/fog.

In contrast, the GOES-R IFR Probability fields suggest the likelihood of IFR conditions in three distinct regions: Along the Sierra Nevada, where terrain is likely to rise up into the Cloud Base, in the San Joaquin Valley, and along the coastal range. Largest values of IFR Probability do occur where (or near where) ceilings and visibilities are reduced and can help a forecaster restrict interest to where it is actually warranted. IFR Probability fields combine satellite observations of stratus with Rapid Refresh model predictions of low-level saturation, so IFR Probability fields are better able to highlight regions of low stratus and fog.

ifrprob_21nov2016anim_0600_1200

GOES-R IFR Probability Fields, 0600-1200 UTC on 21 November 2016 (Click to enlarge)

The Challenge of Satellite Fog Detection at Very Small Scales

weather-gov-screencapture_1400utc_10nove2016

Hazards as depicted by http://weather.gov front page at 1400 UTC on 10 November 2016 (Click to enlarge)

Isolated regions of dense fog developed over eastern Oregon early in the morning on 10 November 2016, and one county — around Baker City — was placed in a Dense Fog advisory (Counties in the Willamette Valley of western Oregon, and near Glacier Park in Montana were placed under Dense Fog Advisories a bit later in the morning on 10 November). Click here to see a 1400 UTC mapping of IFR/LIFR conditions from the Aviation Weather Center.

URGENT – WEATHER MESSAGE
NATIONAL WEATHER SERVICE BOISE ID
600 AM MST THU NOV 10 2016

ORZ062-101800-
/O.NEW.KBOI.FG.Y.0012.161110T1300Z-161110T1800Z/
BAKER COUNTY-
500 AM PST THU NOV 10 2016

…DENSE FOG ADVISORY IN EFFECT UNTIL 10 AM PST THIS MORNING…

THE NATIONAL WEATHER SERVICE IN BOISE HAS ISSUED A DENSE FOG
ADVISORY…WHICH IS IN EFFECT UNTIL 10 AM PST THIS MORNING.

* VISIBILITY…ONE QUARTER MILE OR LESS.

* IMPACTS…TRAVEL HAZARD DUE TO POOR VISIBILITY…ESPECIALLY
ALONG INTERSTATE 84 BETWEEN BAKER CITY AND NORTH POWDER

PRECAUTIONARY/PREPAREDNESS ACTIONS…

A DENSE FOG ADVISORY MEANS VISIBILITIES WILL FREQUENTLY BE
REDUCED TO LESS THAN ONE QUARTER MILE. IF DRIVING…SLOW DOWN…
USE YOUR HEADLIGHTS…AND LEAVE PLENTY OF DISTANCE AHEAD OF YOU.

&&

$$

What kind of Fog-detection products are available to assist a forecaster in seeing at a glance that fog is developing? How useful are they for small-scale features such as that in Baker County Oregon?

Brightness Temperature Difference Fields (3.9 µm – 10.7 µm) have historically been used to detect fog; the difference field keys on the Emissivity Differences that exist in water-based cloud droplets: they do not emit 3.9 µm radiation as a blackbody, but do emit 10.7 µm radiation more nearly as a blackbody, so computed brightness temperatures are different: cooler at 3.9 µm than at 10.7 µm. The Brightness Temperature Difference fields for 0900 and 1200 UTC are shown below (Note the seam — GOES-13 data are used east of the seam, GOES-15 data are used to the west). There is no distinct signal over Baker County, nor any pattern that can really help identify regions of fog. Cirrus is present over western Oregon (depicted as dark grey or black in this enhancement); satellite-only detection of low fog is not possible if cirrus prevents a view of the surface.

goes15btd_10nov_0900_1200toggle

GOES Brightness Temperature Difference Fields (3.9 µm – 10.7 µm) at 0900 and 1200 UTC on 10 November 2016 (Click to enlarge)

For a small-scale event, the nominal 4-km pixel size on GOES-15 and GOES-13 (a size that is closer to 6-7 km over Oregon because of the distance from the sub-satellite point) may prevent satellite detection of developing fog. The toggle below shows Brightness Temperature Difference fields at 0928 UTC from MODIS on Aqua, as well as the GOES-R IFR Probability fields computed using the MODIS data.  As with GOES data, the presence of cirrus in the Brightness Temperature Difference field is obvious and shown by a black enhancement.  Little signal is present over Baker County.  (There is a strong signal, however, in the valleys of northwest Montana and northern Idaho — compare this to the GOES-based brightness temperature difference above).

Note:  MODIS resolution is 1-km;  data from the Advanced Baseline Imager (ABI) on GOES-R will have nominal 2-km resolution at the sub-satellite point.

modis_btd_ifr_10nov_0928toggle

MODIS Brightness Temperature Difference fields (3.7 µm – 11 µm) and MODIS-based GOES-R IFR Probability, 0928 UTC on 10 November 2016 (Click to enlarge)

What does the GOES-based GOES-R IFR Probability field show during the early morning hours of 10 November? The animation below, from 0800-1200 UTC, shows some returns in/around Baker County. It would have been difficult to use this product alone to diagnose this fog feature however. (It did do a better job of diagnosing the presence of fog over northwest Montana and western Oregon where Advisories were later issued).

goesr_ifr_10nov_0800_1200anim

GOES-R IFR Probability fields, hourly from 0800 – 1200 UTC on 10 November 2016 (Click to enlarge)