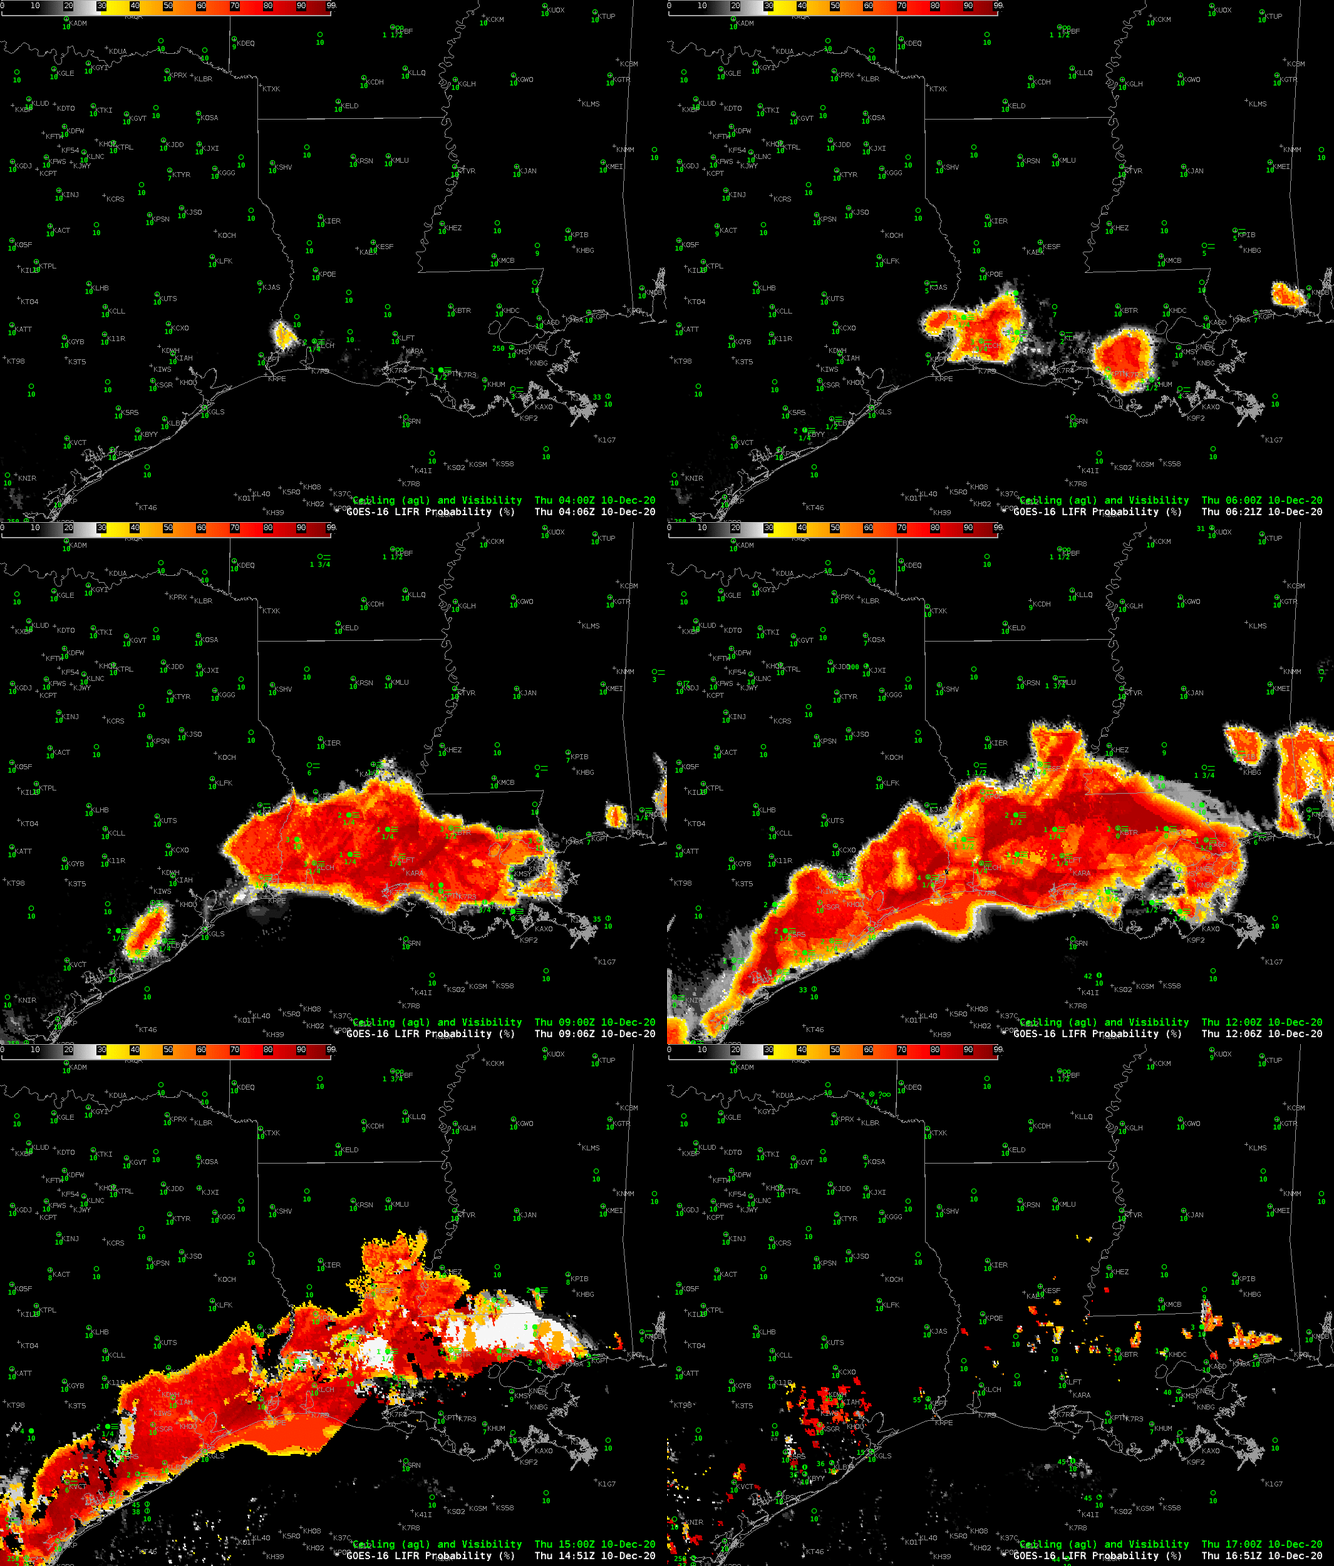
High Pressure (link), cold air, and proximity to warm Sea Surface Temperatures (image here, ACSPO SSTs from the Direct Broadcast Antenna at CIMSS) meant dense fog over southwestern Louisiana. The animation above shows Probabilty of Low IFR Conditions from 0400 UTC through sunrise. Low IFR Probability fields originate near Lake Charles and Franklin before consolidating into one large field over southern Louisiana. Surface observations of ceilings and visibilities also indicate dense fog.
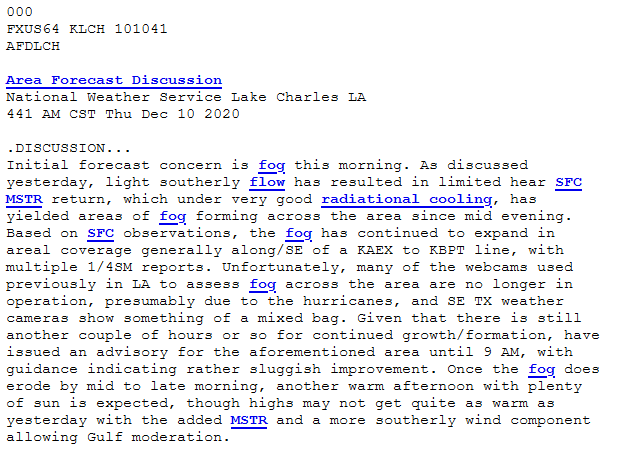
An after-effect of the landfall of Hurricanes is the destruction of webcams that can be used to monitor fog, as noted in the Area Forecast Discussion from WFO Lake Charles, below, from 441 AM CST on 10 December. IFR Probability products in AWIPS combine model predictions of low-level saturation and satellite observations of low cloud to mitigate this loss of information. Regions where low IFR Probability values are high are likely regions that would have dense fog on webcams.
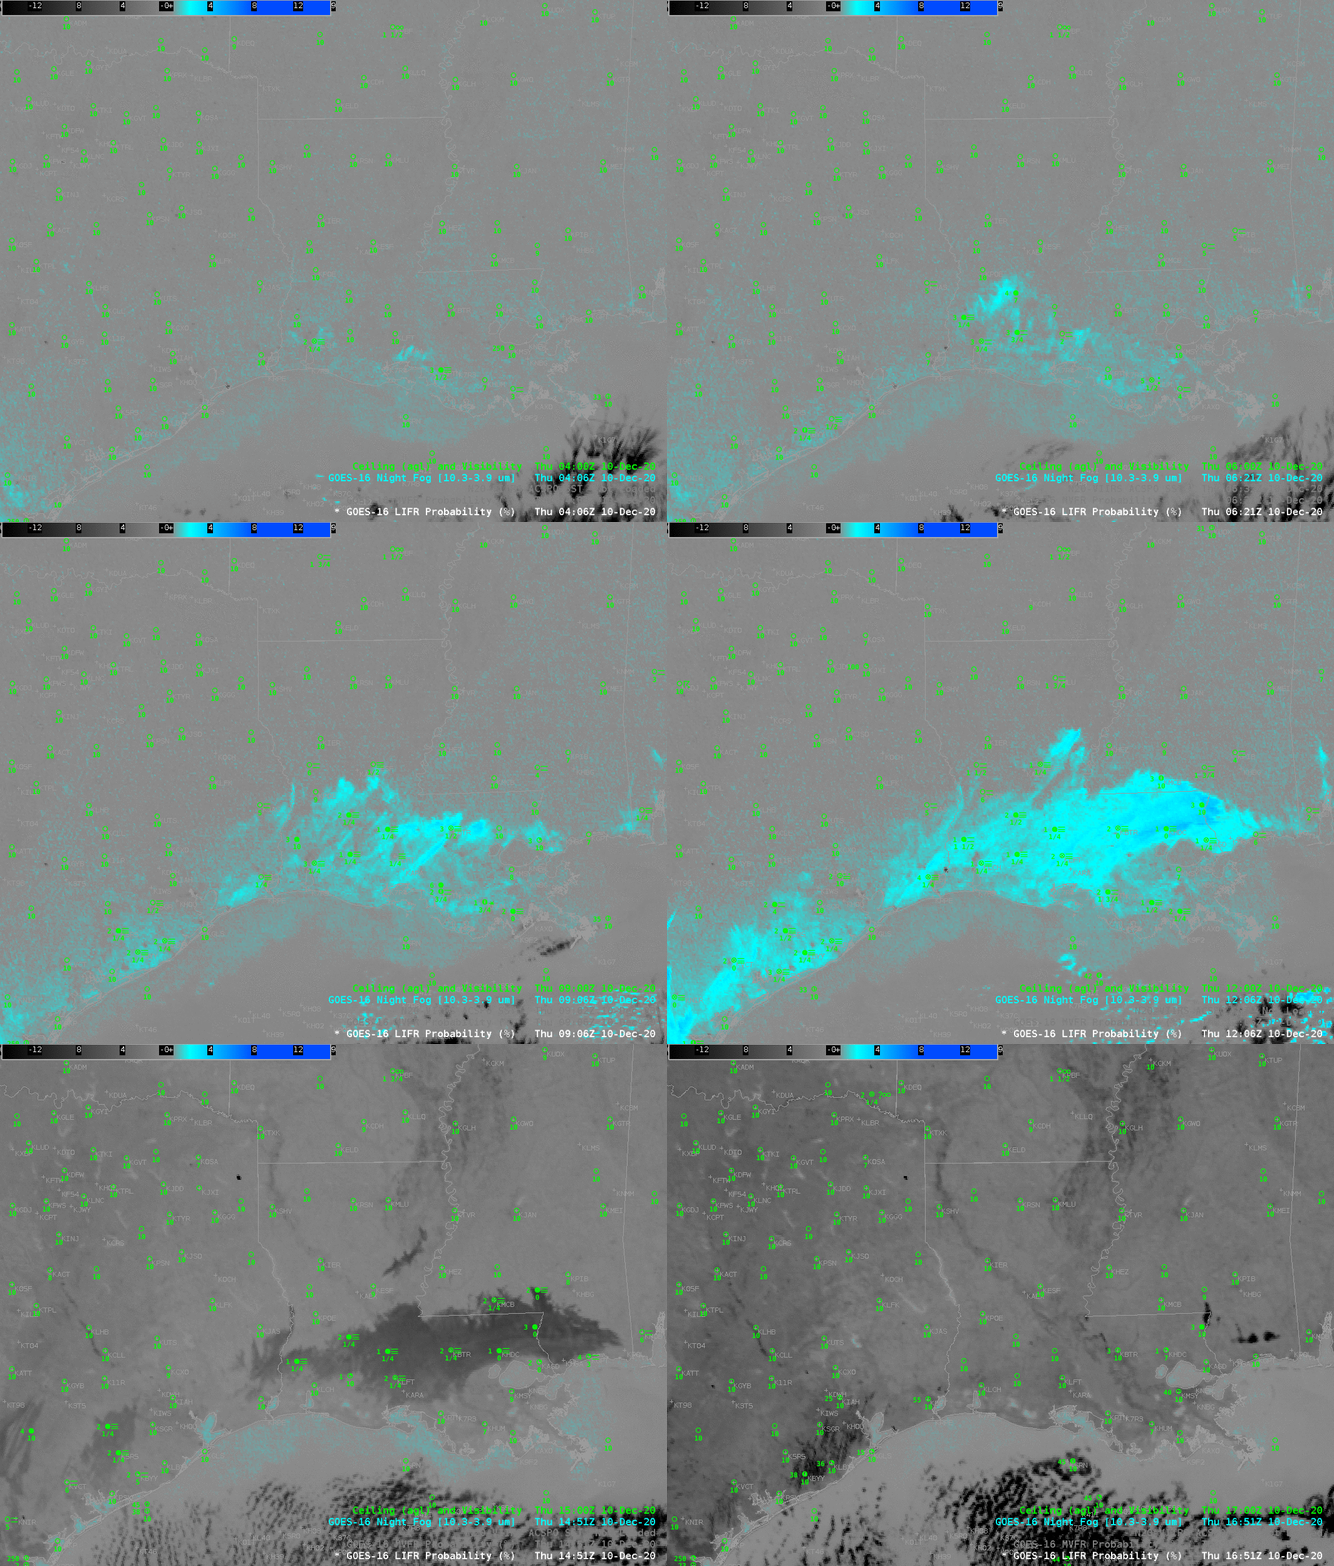
Night Fog Brightness Temperature difference (10.3 µm – 3.9 µm) fields, below, also show the region of stratus clouds. But this satellite-only product does not contain information on how dense the fog is underneath the cloud top (or even if the stratus cloud is also fog). The combination of model data and satellite data by IFR Probability products gives more information than satellite data alone.
The suite of IFR Probability products includes a GOES-R Cloud Thickness field, shown below overlain on top of a Night Fog Brightness Temperature Difference field. Cloud Thickness is not computed in the 90-120 minutes surrounding sunrise, and the terminator is apparent in the image below, where the Night Fog Brightness Temperature Difference becomes apparent. The thickest cloud (nearly 400 m) is northwest of Lake Ponchartrain. That is where the fog should dissipate last, perhaps.
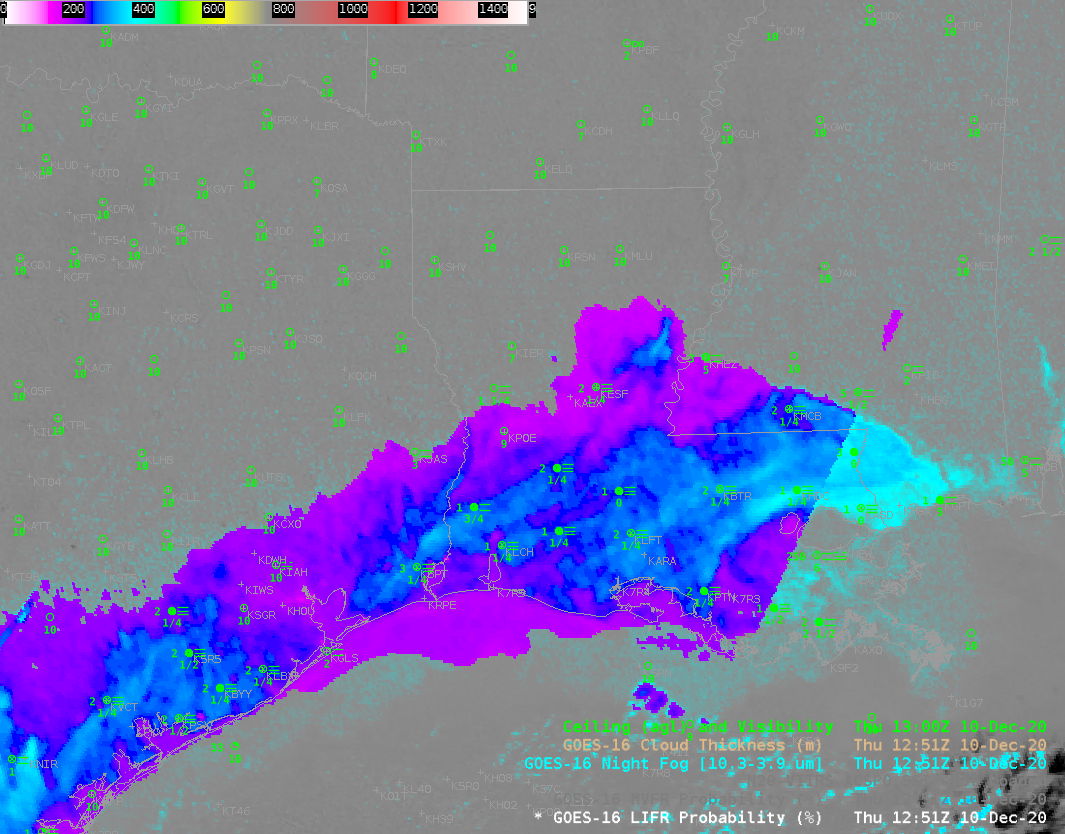
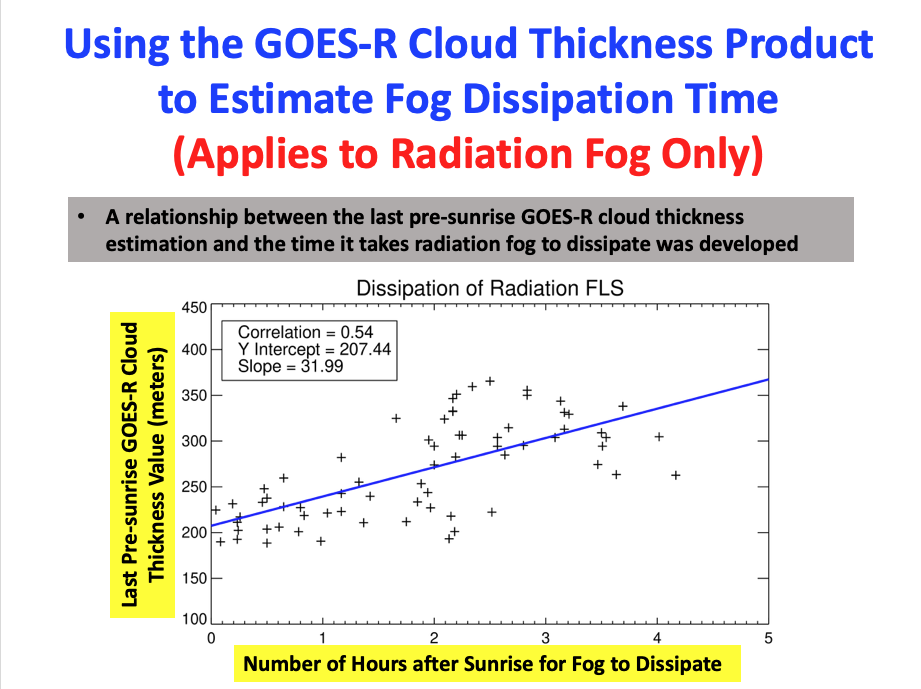
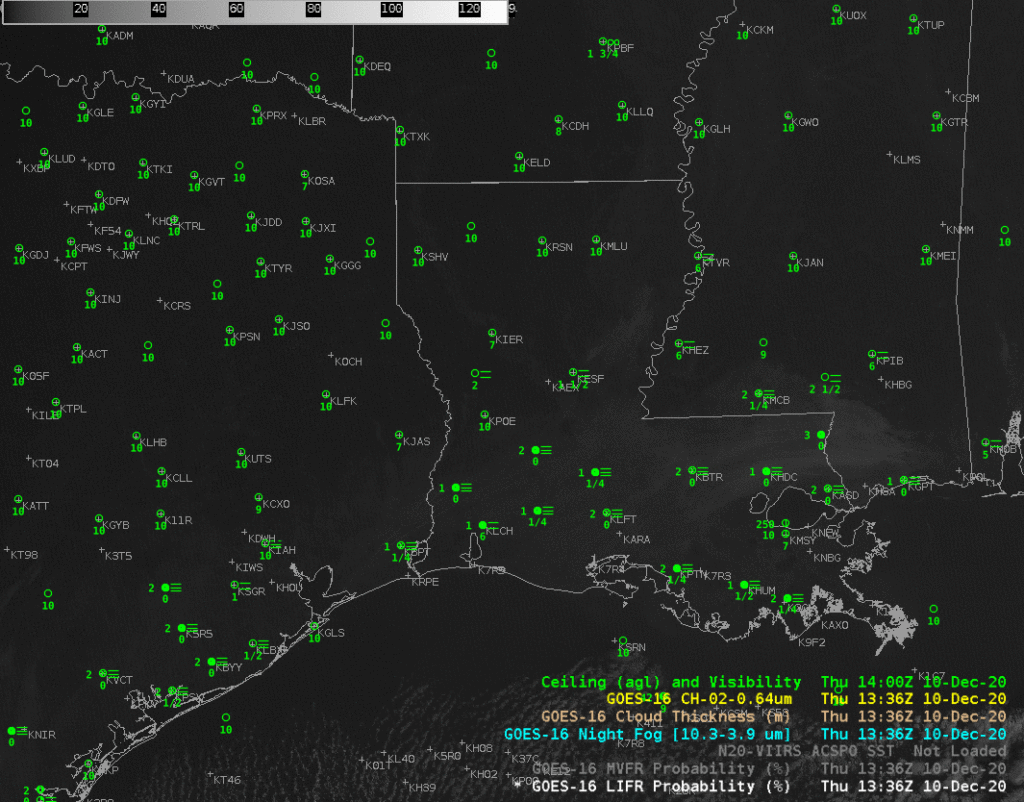
The scatterplot below can be used to estimate when radiation fog might dissipate. It relates the last pre-sunrise observation of GOES-R Cloud Thickness, as shown above, to the number of hours until burn-off. A value of almost 400 m suggests a burnoff nearly four hours after the image above: 1651 UTC. The Thickness field also suggests fog dissipation will be more rapid over southwestern Louisiana than over regions near Lake Ponchartrain. Animations of the Night Fog Brightness Temperature, above, and the visible imagery, below, show that the estimate was a good one on this day.
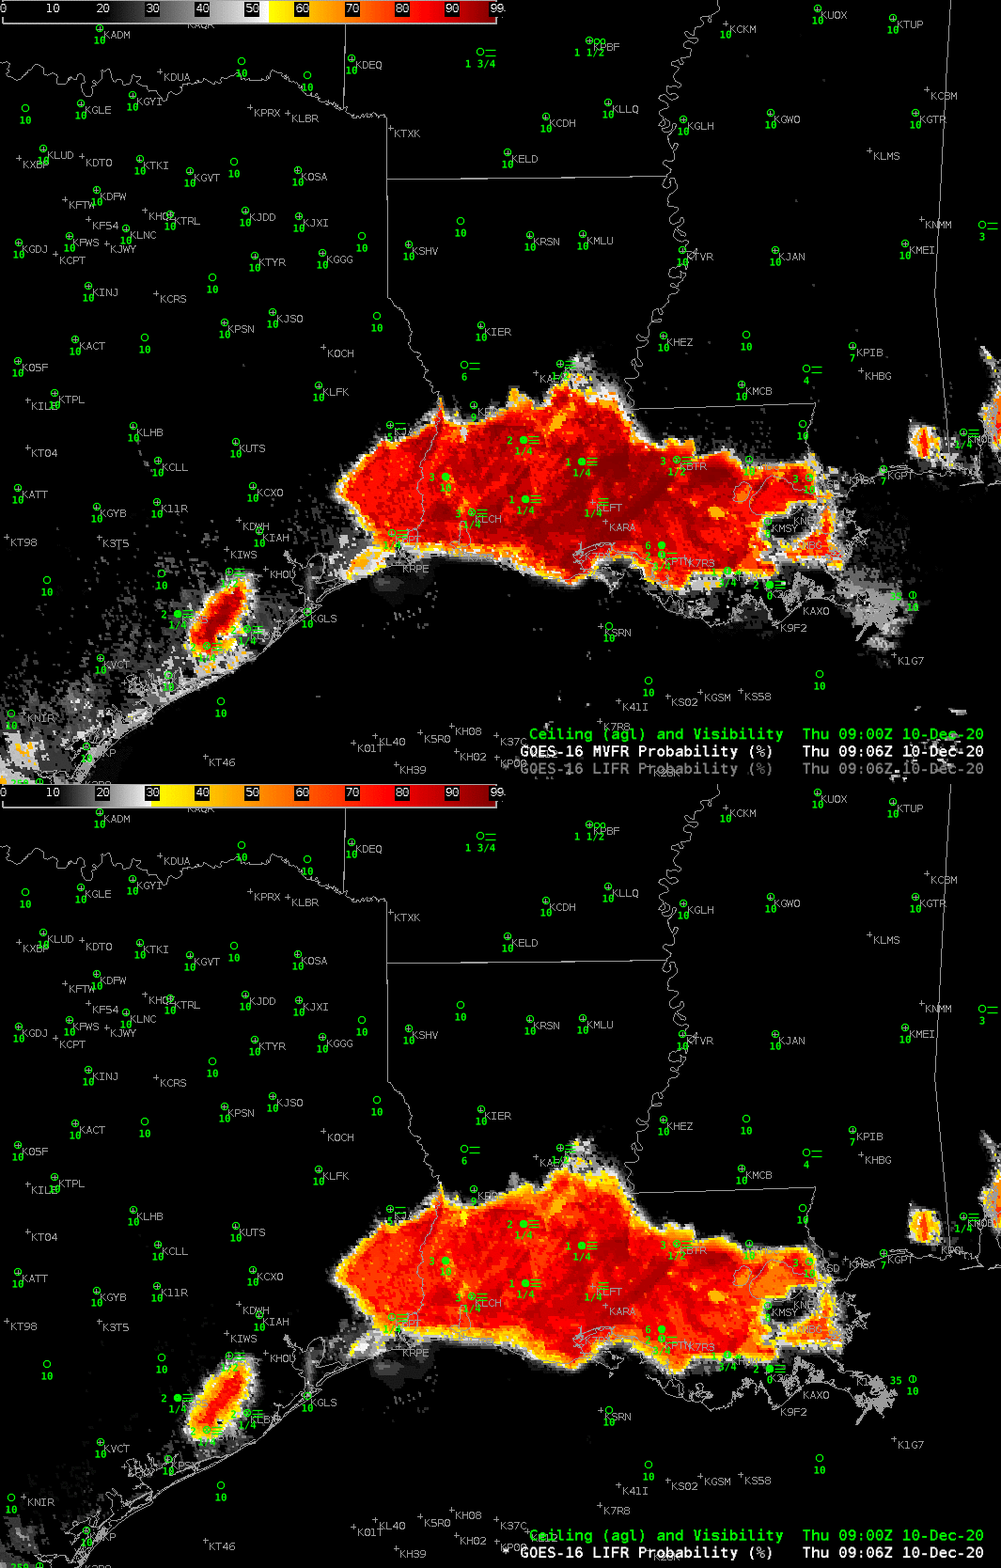
The IFR Probability products include Low IFR Probability, shown above, IFR Probability, and Marginal VFR (MVFR) Probability, in addition to Cloud Thickness. The toggle below, from 0906 UTC, shows that MVFR Probability and Low IFR Probability fields were co-located. As expected, probability of MVFR conditions are greater than probabilities of Low IFR conditions.
Added: Lake Charles WFO also tweeted out this excellent image of a Fog Bow as the fog dissipated!
