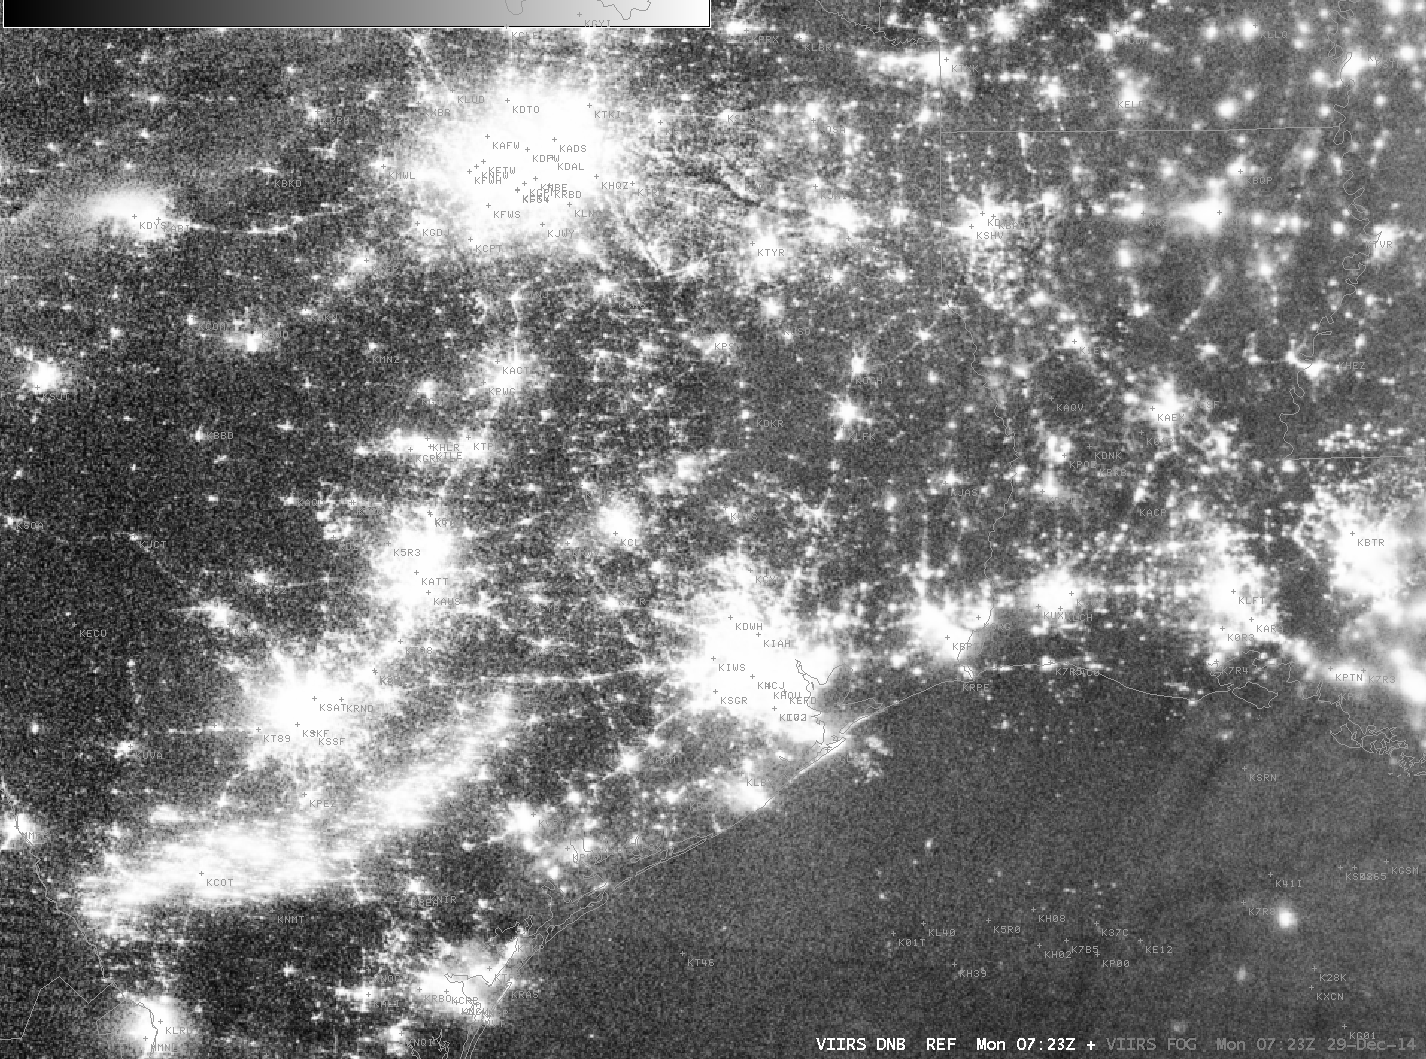
Dense fog developed along the I-10 corridor over southern Louisiana during the early morning hours of 21 April 2014. From the AFDs issued by Lake Charles:
000
FXUS64 KLCH 210153
AFDLCH
AREA FORECAST DISCUSSION
NATIONAL WEATHER SERVICE LAKE CHARLES LA
853 PM CDT SUN APR 20 2014
.UPDATE…A WEAK TROF WILL APPROACH FROM THE WEST TONIGHT,
BRINGING A LIGHT SOUTHERLY FLOW AND SOME MOISTURE NEAR THE SURFACE.
THIS MOISTURE SHOULD BE SUFFICIENT FOR THE FORMATION OF PATCHY
GROUND FOG LATER TNITE…WHICH IS ALREADY IN THE FORECAST.
The 319 AM CDT Forecast Discussion noted the increase in IFR Probabilities:
000
FXUS64 KLCH 210819
AFDLCH
AREA FORECAST DISCUSSION
NATIONAL WEATHER SERVICE LAKE CHARLES LA
319 AM CDT MON APR 21 2014
.DISCUSSION…
MID AND HIGH LEVEL CLOUDS STREAMING ACROSS INTERIOR SOUTHEAST
TEXAS…OTHERWISE…TEMPERATURES MAINLY IN THE UPPER 50S TO LOWER 60S
AREAWIDE. CLEAR SKIES AND LIGHT WINDS SETTING UP AGAIN FOR FOG
DEVELOPMENT MAINLY ALONG THE I-10 CORRIDOR FROM BEAUMONT EAST TO
SHORT OF LAFAYETTE LOUISIANA. GOES-E/MODIS MVFR PRODUCT SHOWING
INCREASING PROBABILITY OF LOW VISIBILITY FOR DEVELOPING IN THE
BPT AREA WHICH LATEST OBSERVATION CONFIRM THAT TREND…AND ANOTHER
AREA FROM LAKE CHARLES TO NEAR LAFAYETTE. THEREFORE…ASKING FOLKS
TO DRIVE CAREFULLY THIS MORNING IF YOUR DRIVING IN THESE AREAS.
Shortly after sunrise, a Dense Fog Advisory was issued:
000
FXUS64 KLCH 211150
AFDLCH
AREA FORECAST DISCUSSION
NATIONAL WEATHER SERVICE LAKE CHARLES LA
650 AM CDT MON APR 21 2014
.UPDATE…
ISSUED DENSE FOG ADVISORY FOR THE I-10 CORRIDOR AREA FROM
SOUTHEAST TEXAS TO LAKE CHARLES TO LAFAYETTE. MAIN CONCERN WAS
LIGHT WINDS AND STRONG RADIATIONAL COOLING WHICH HAS RESULTED IN
A SHARP DROP IN VISIBILITIES OVER A SHORT TIME PERIOD. DENSE FOG
MAY BOUNCE UP AND DOWN A BIT DURING THE ADVISORY TIMES. DENSE FOG
SHOULD DISIPATE BY 9 AM.
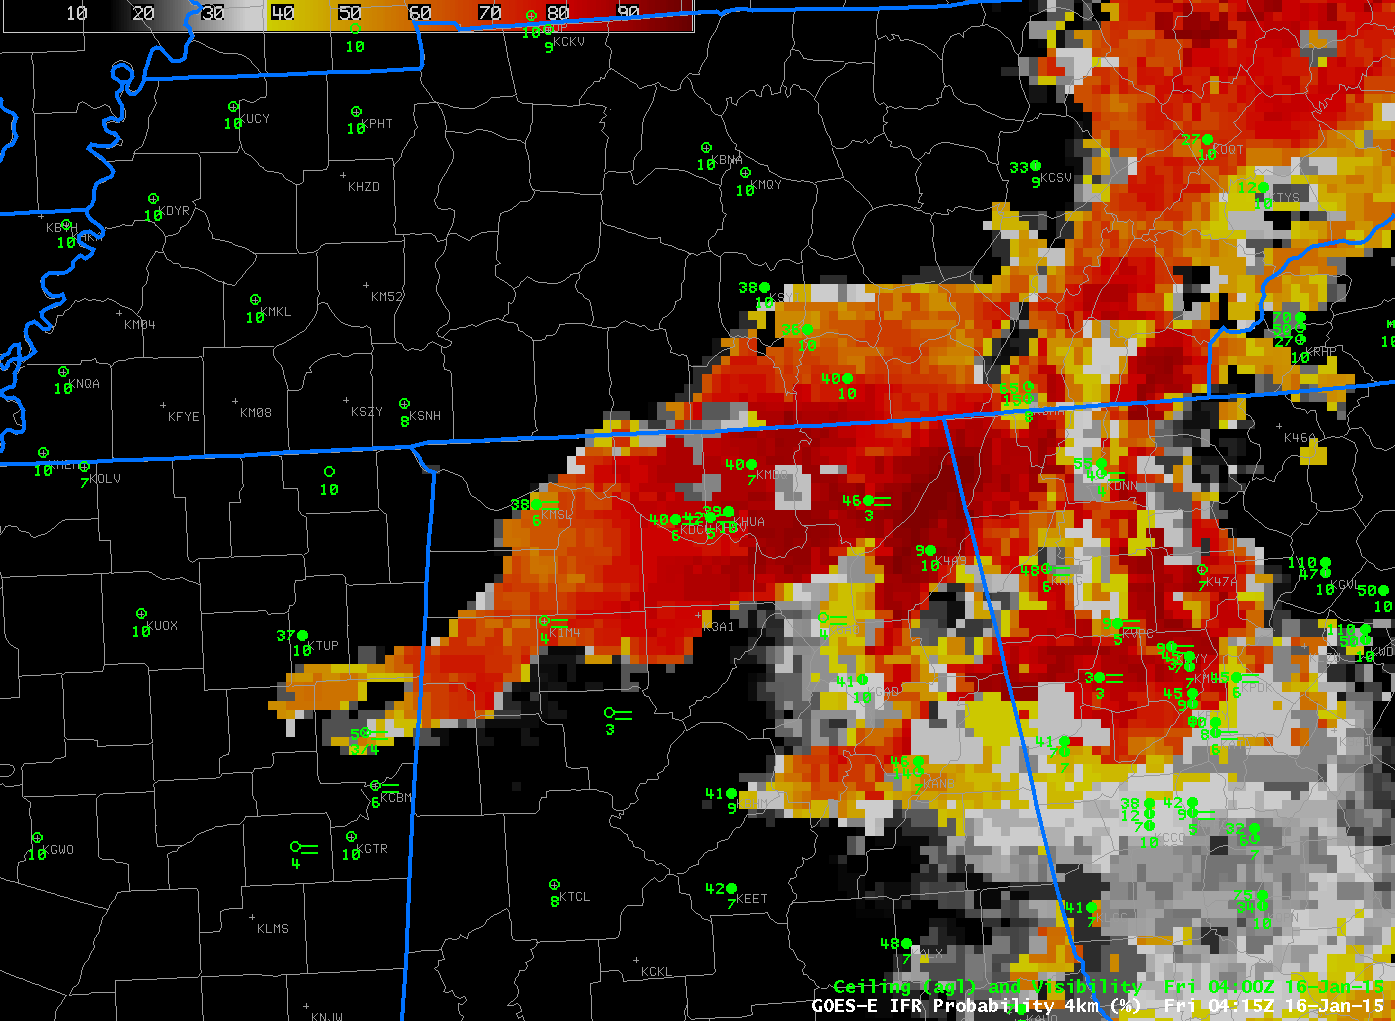
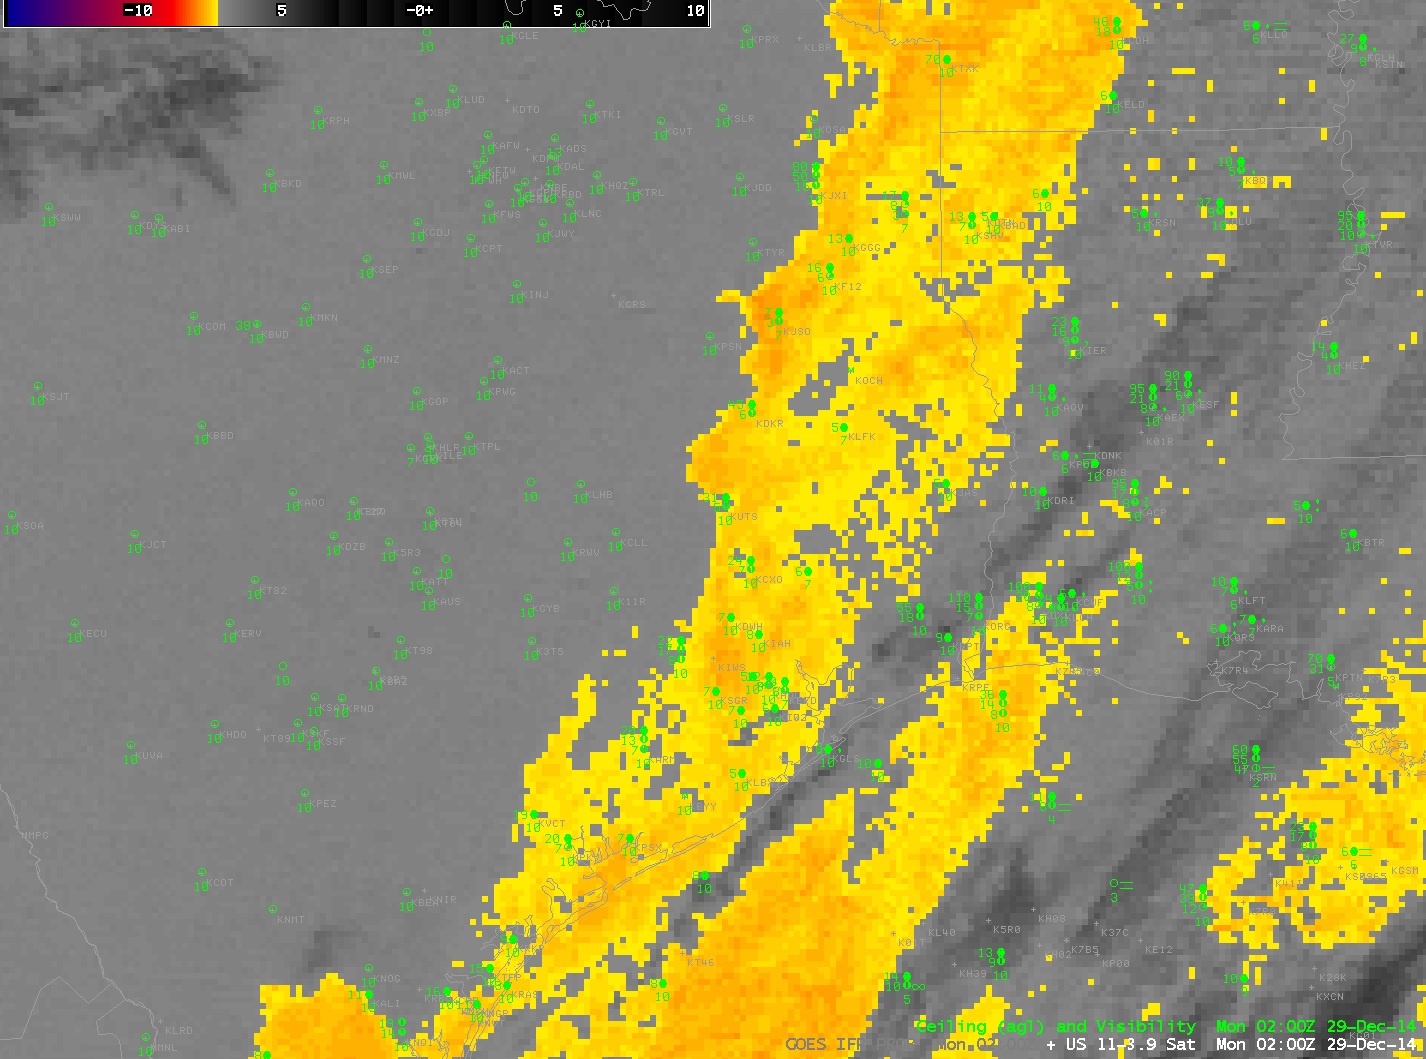
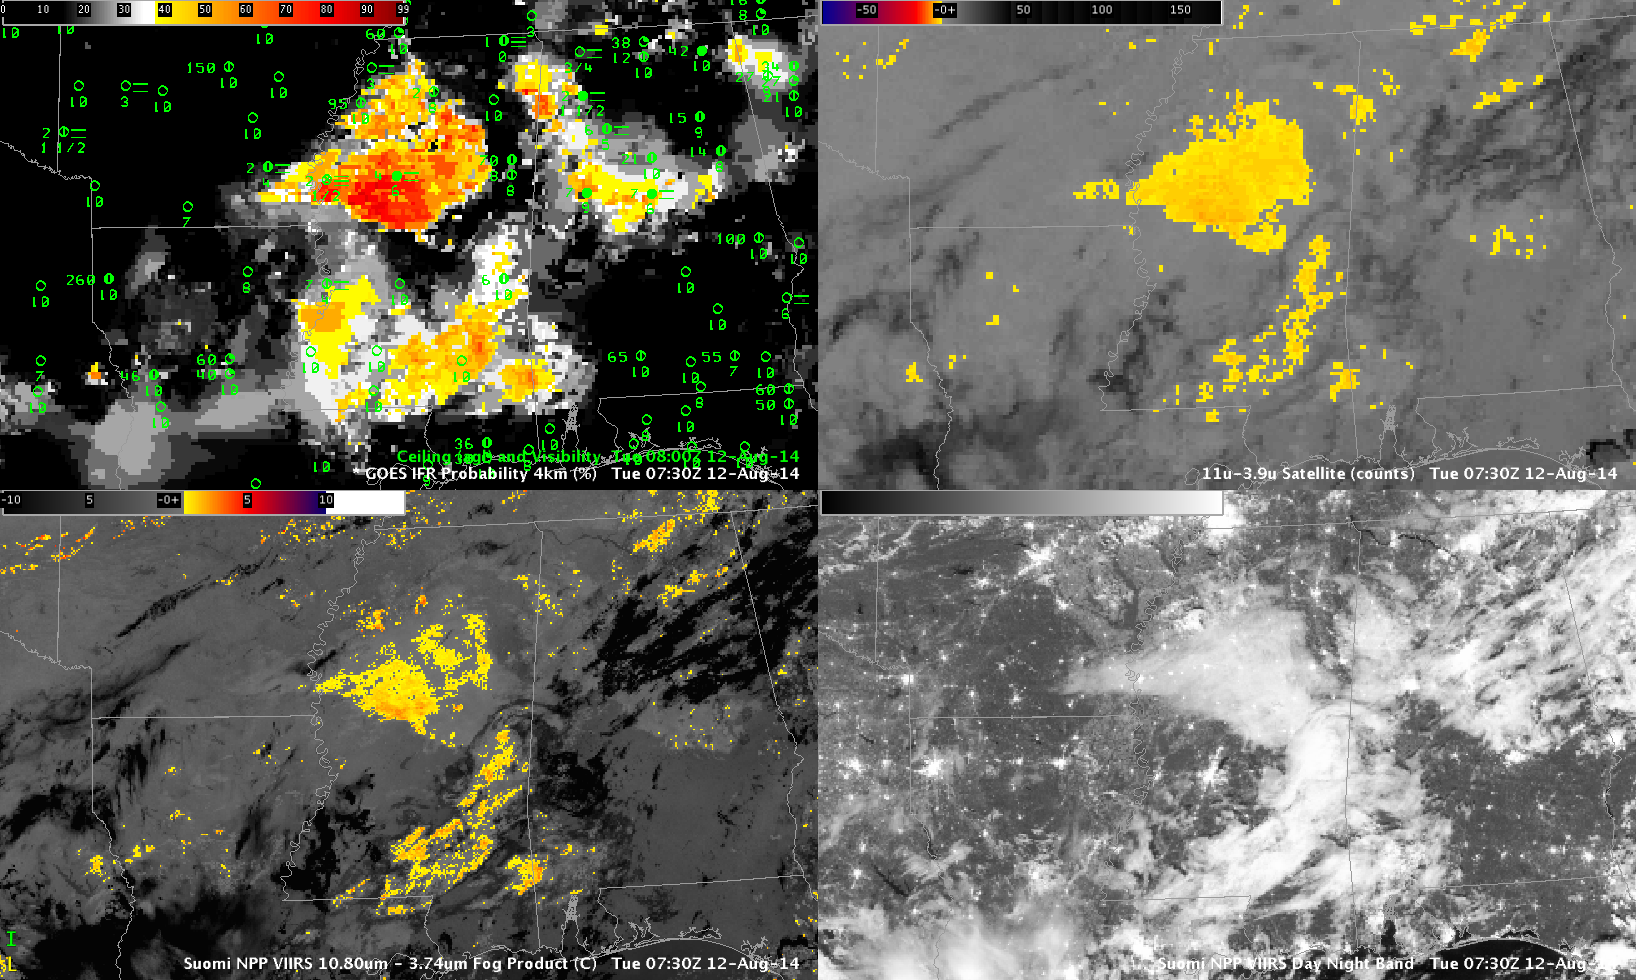
How did the IFR probability forecasts do during this event? At 0400 UTC (below), neither the IFR probabilities nor the traditional method of fog/low cloud detection suggest fog/low clouds are present.
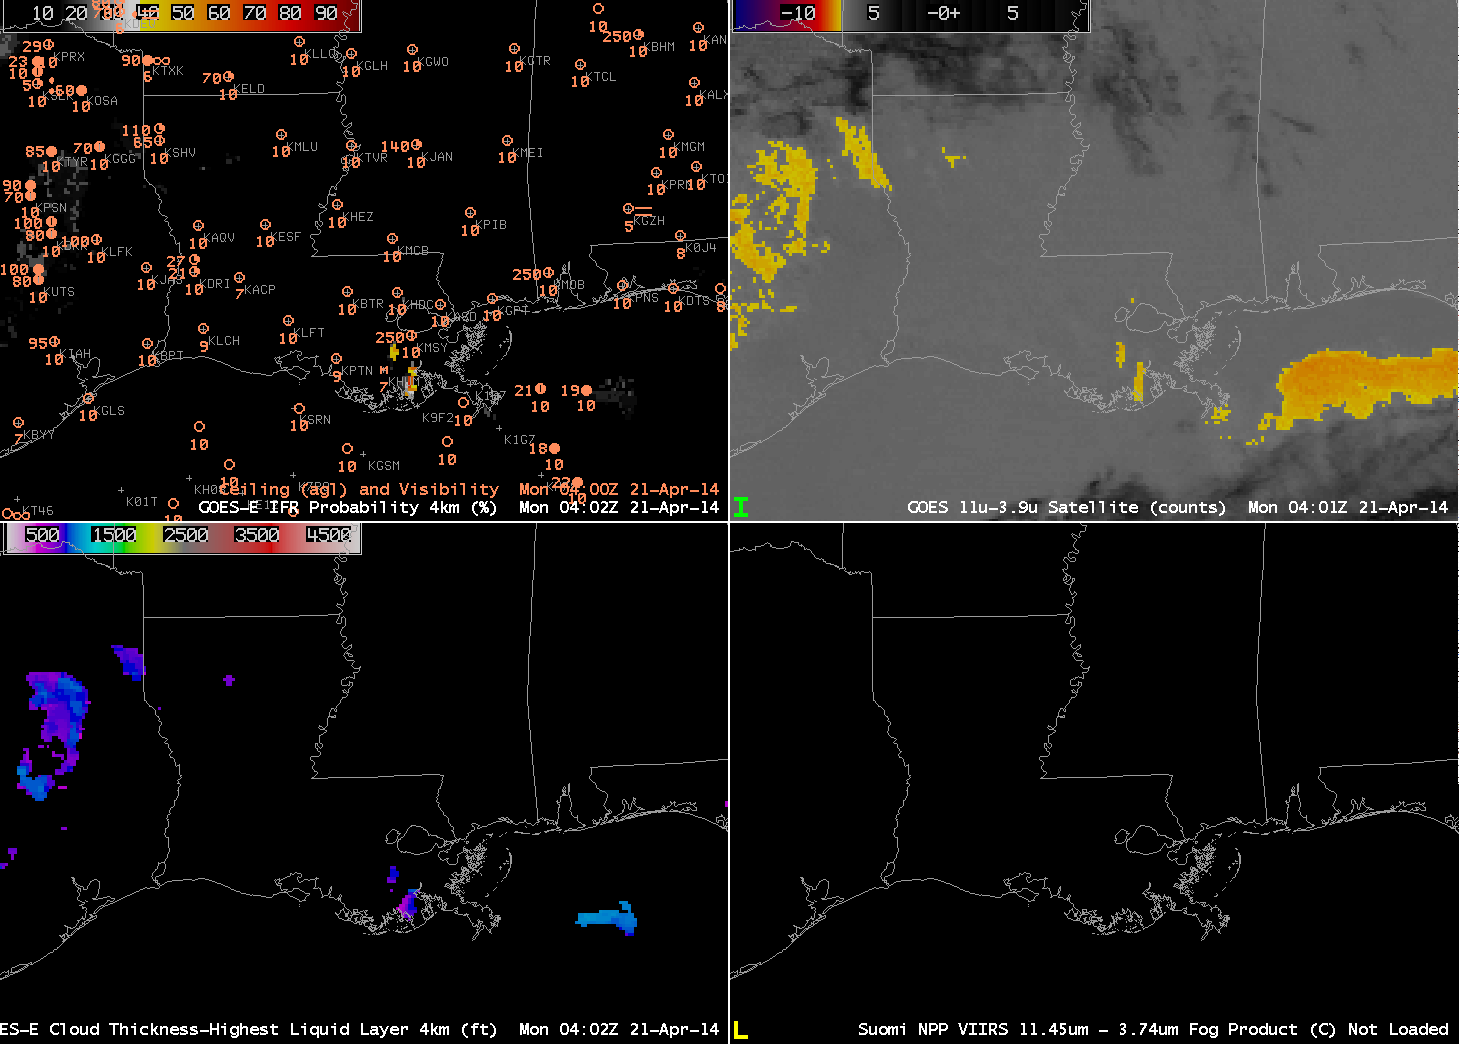
GOES-R IFR Probabilities computed from GOES-East (Upper Left), GOES-East Brightness Temperature Differences (10.7 µm – 3.9 µm) (Upper Right), GOES-R Cloud Thickness (Lower Left), Suomi/NPP VIIRS Brightness Temperature Difference (11 µm – 3.74 µm) (Lower Right), 0400 UTC on 21 April 2014 (click to enlarge) (click to enlarge)
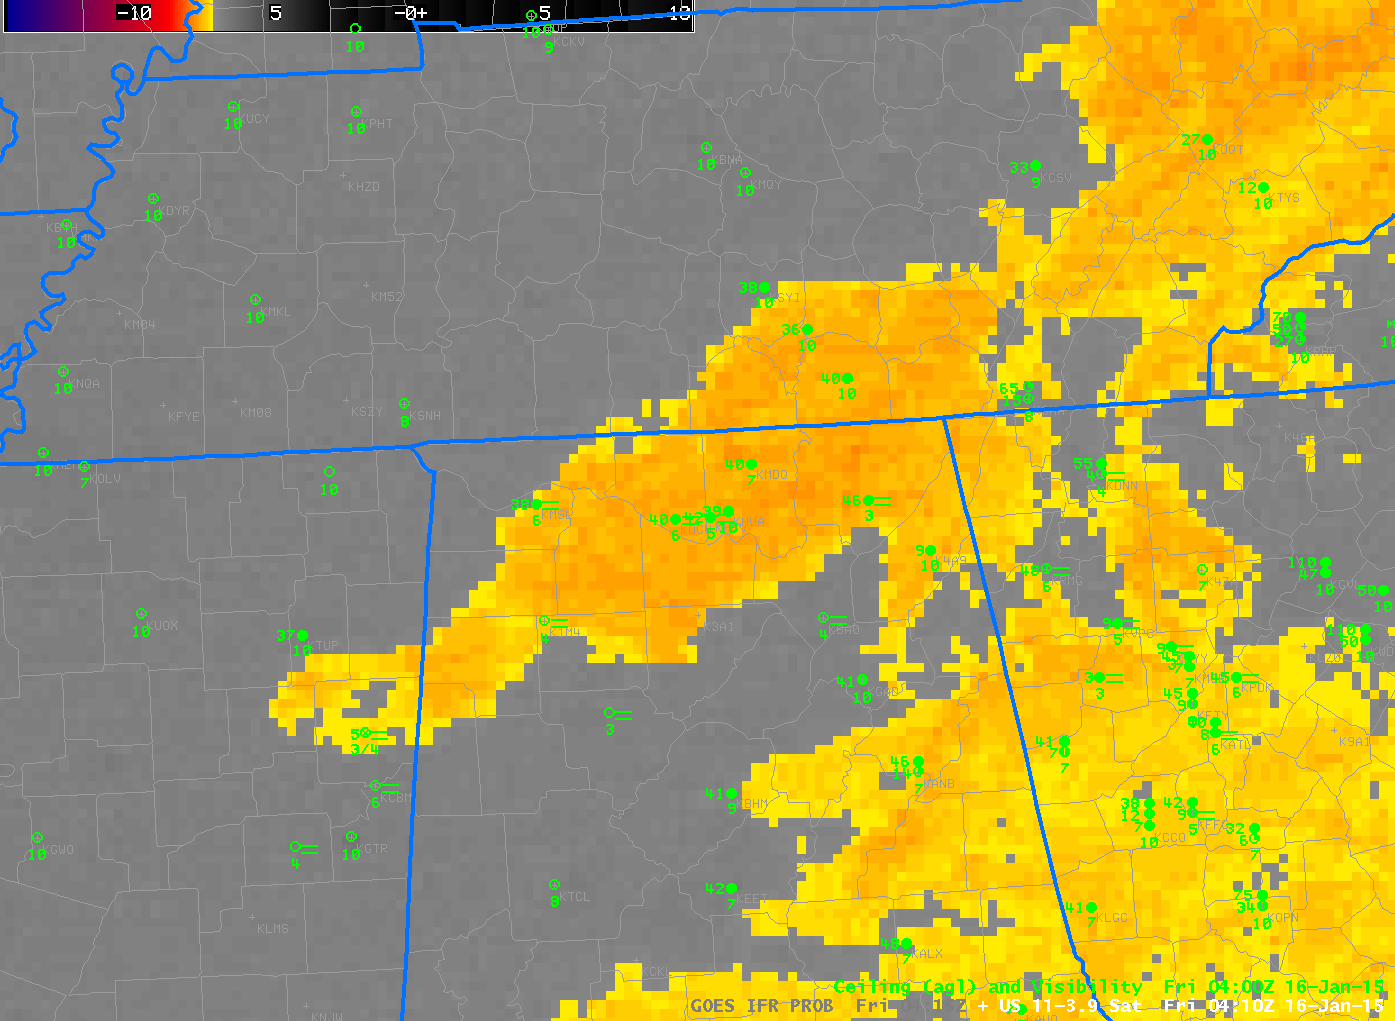
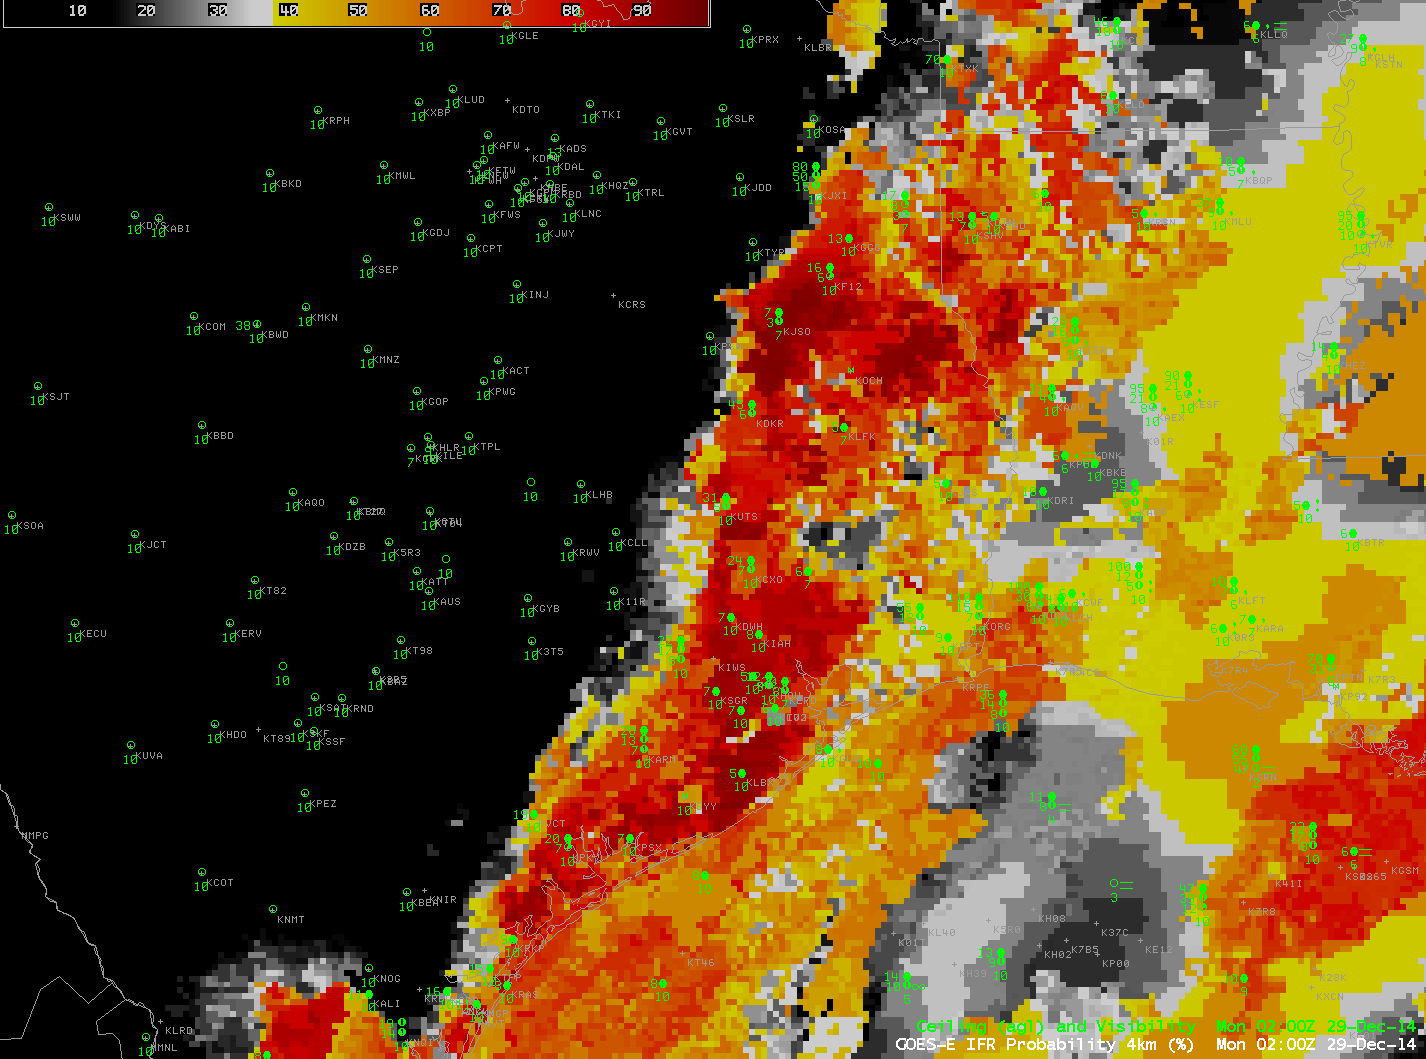
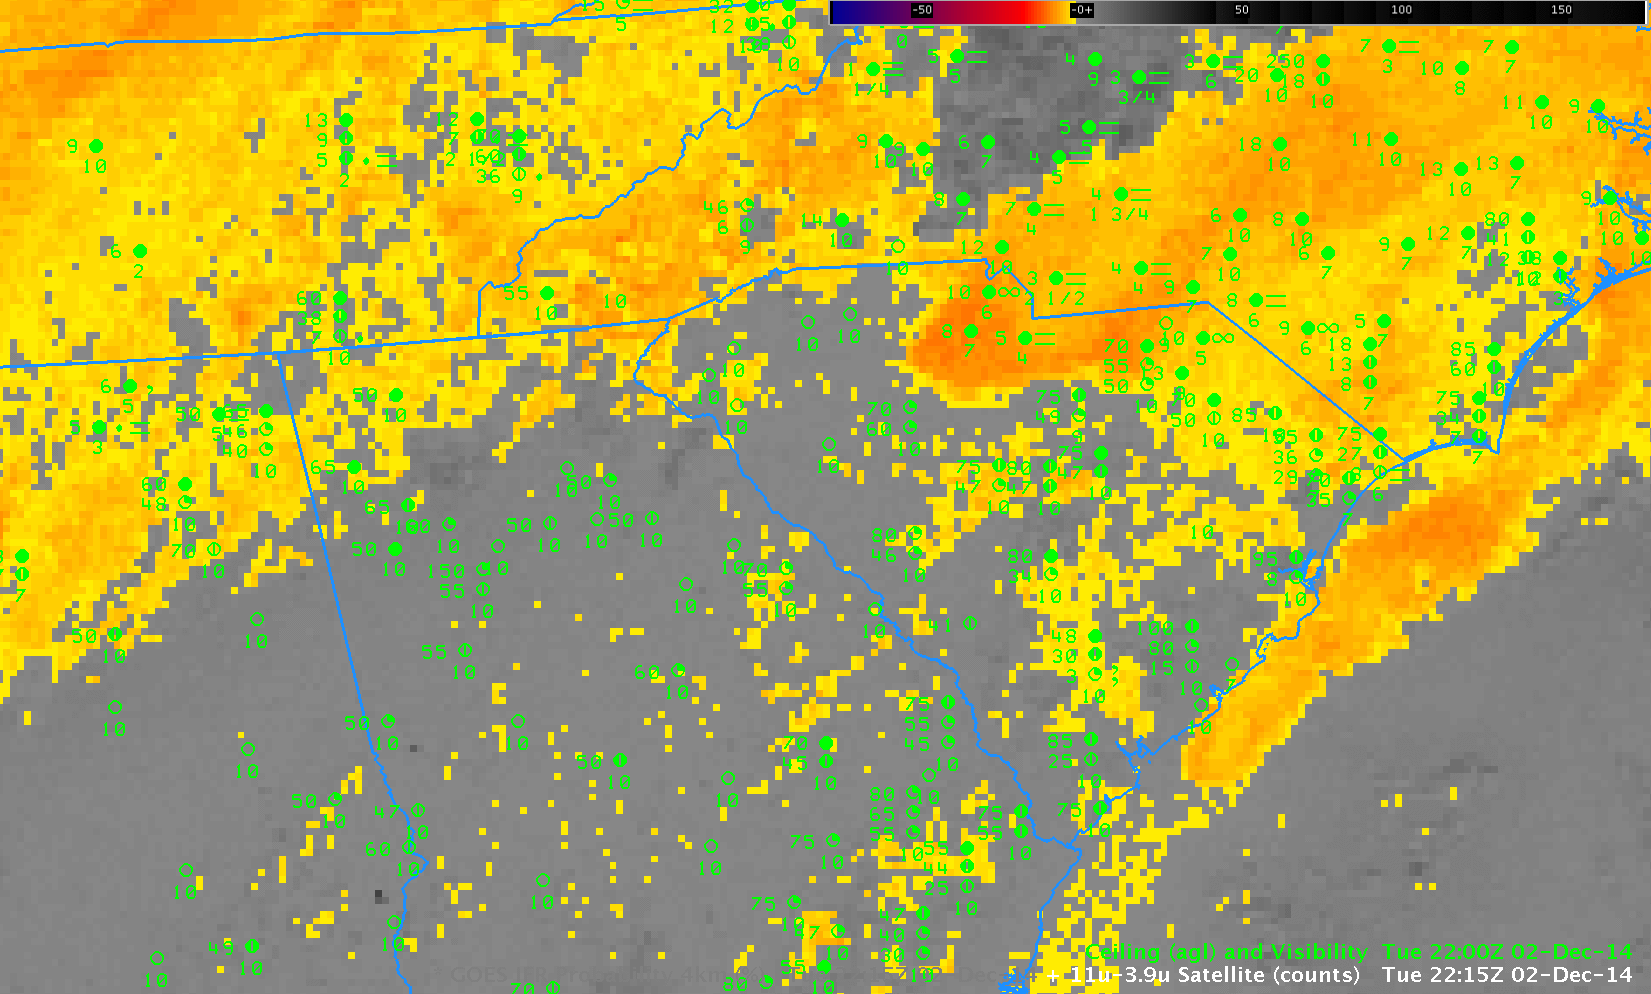
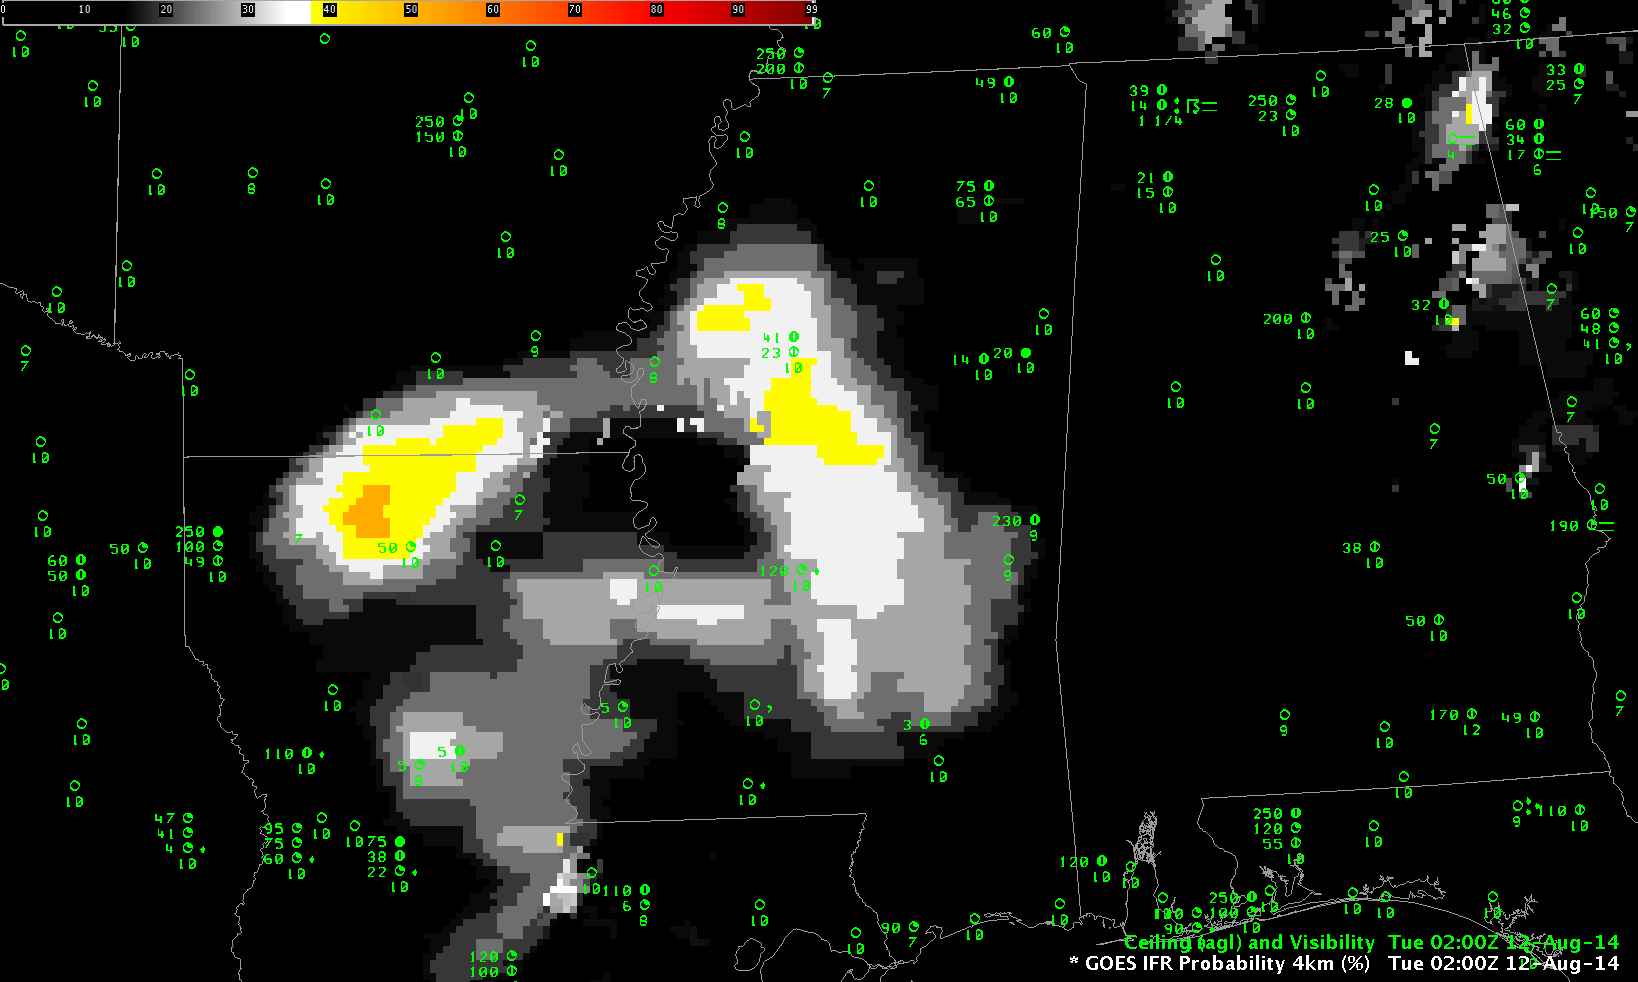
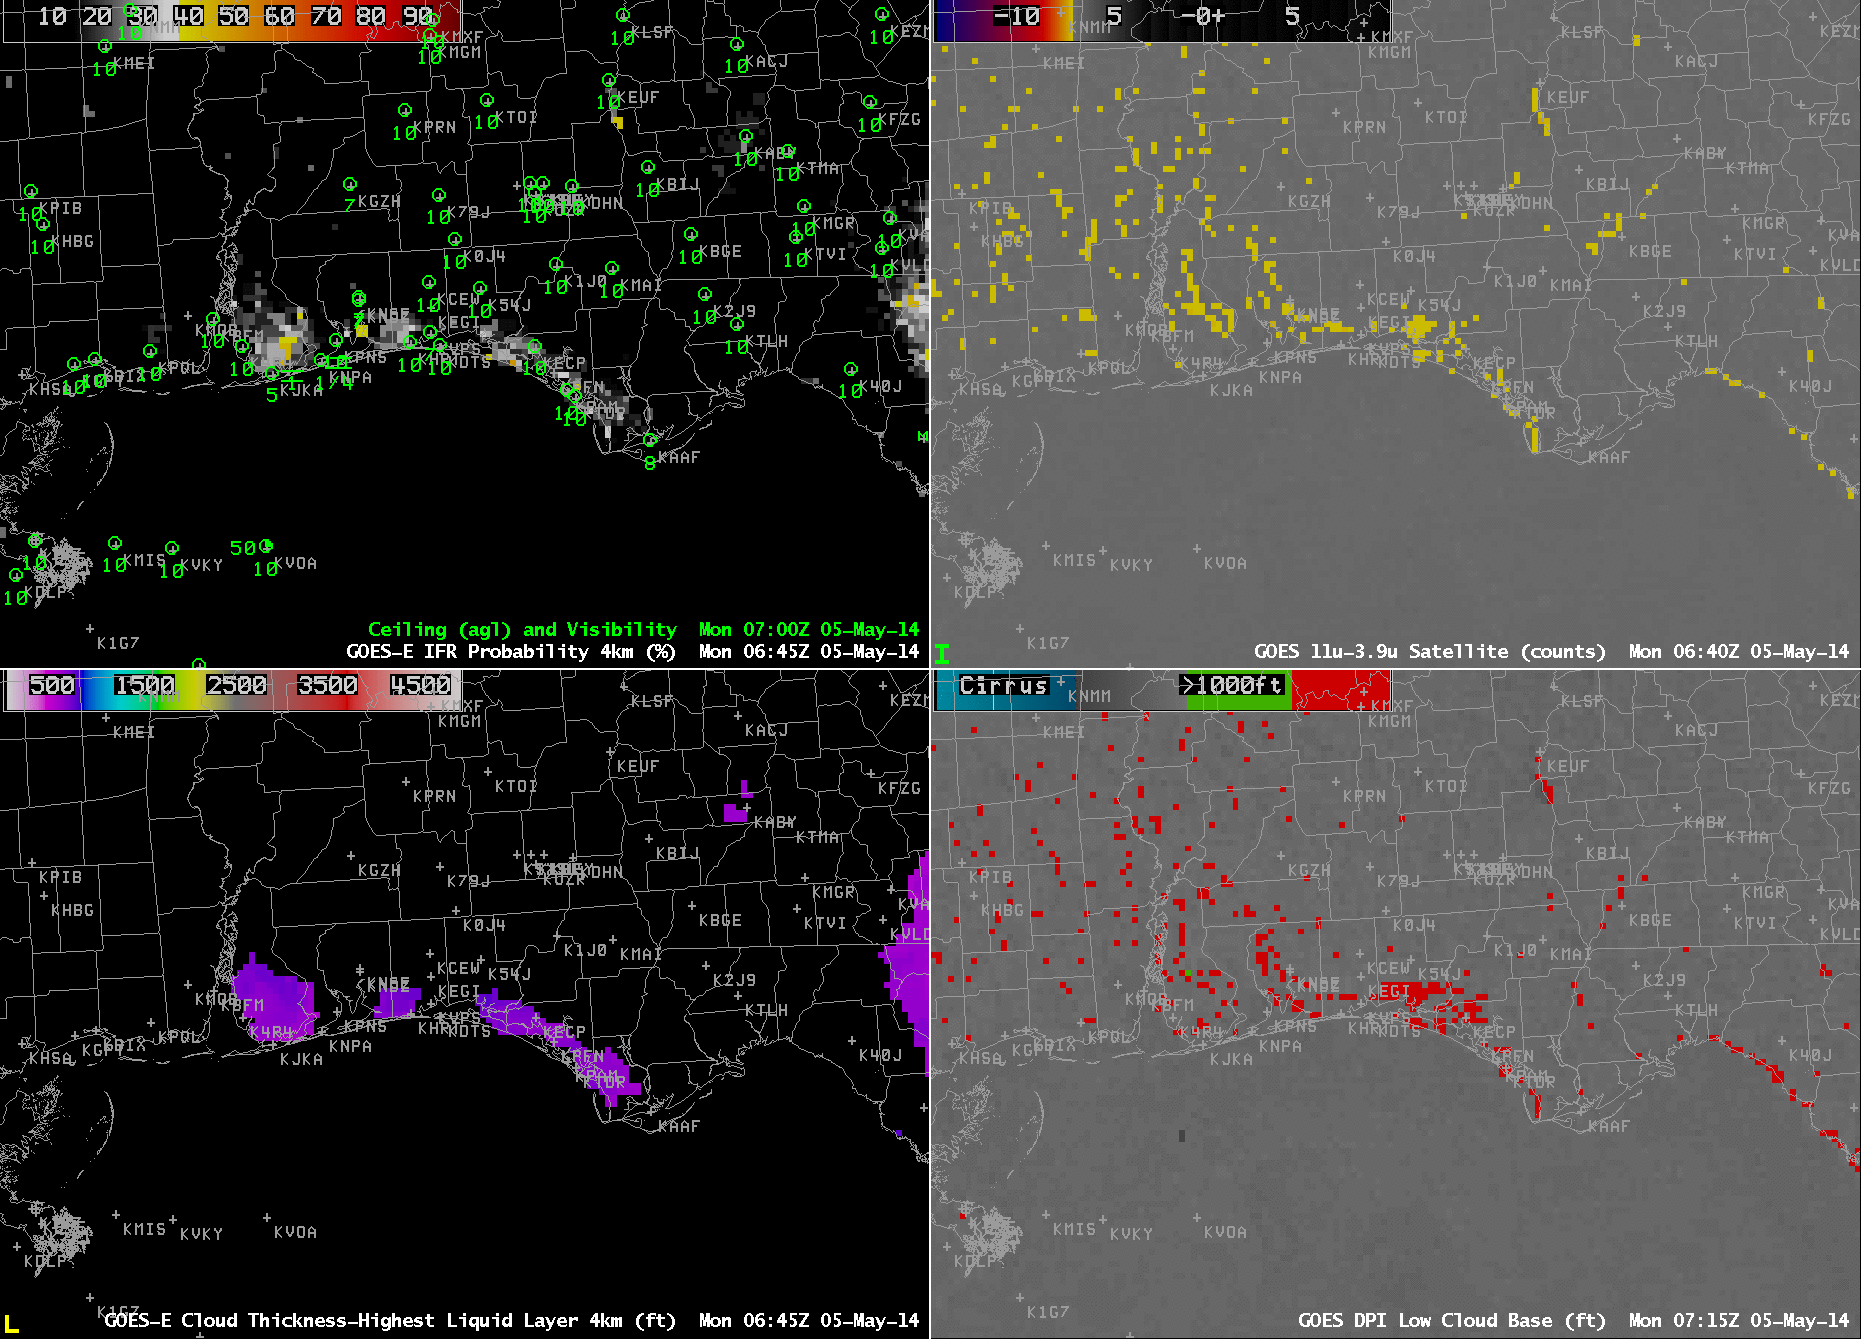
By 0600 UTC, IFR Probabilities have increased to around 10% in/around Lake Charles as visibilities have dropped. GOES-R Cloud Thickness values are around 600 feet.
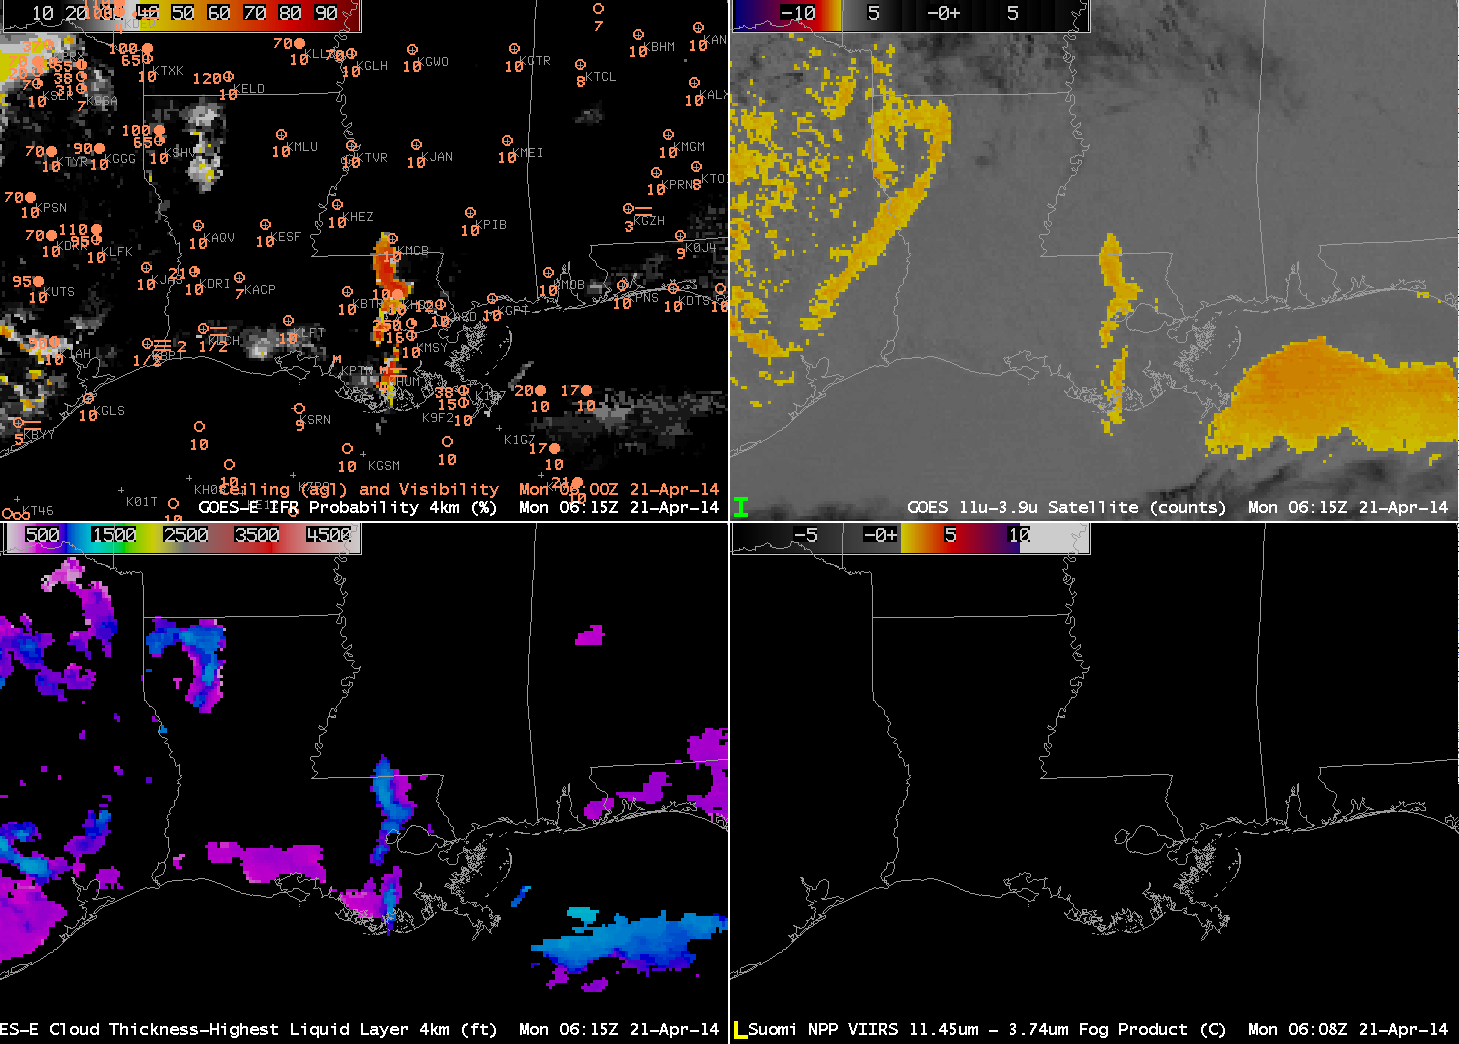
As above, but at 0615 UTC on 21 April 2014 (click to enlarge)
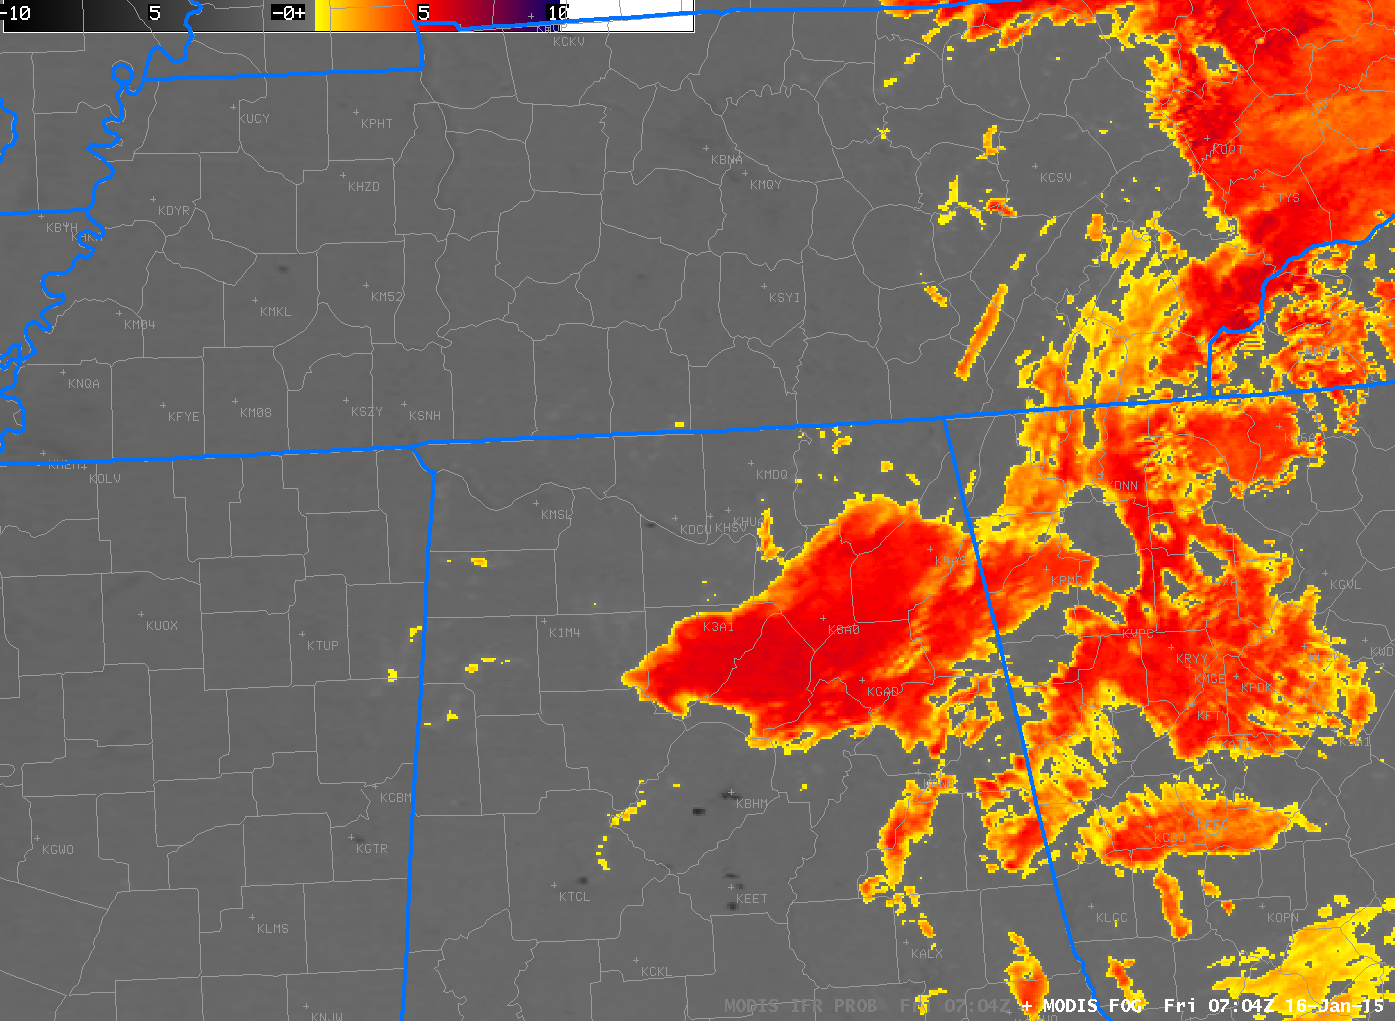
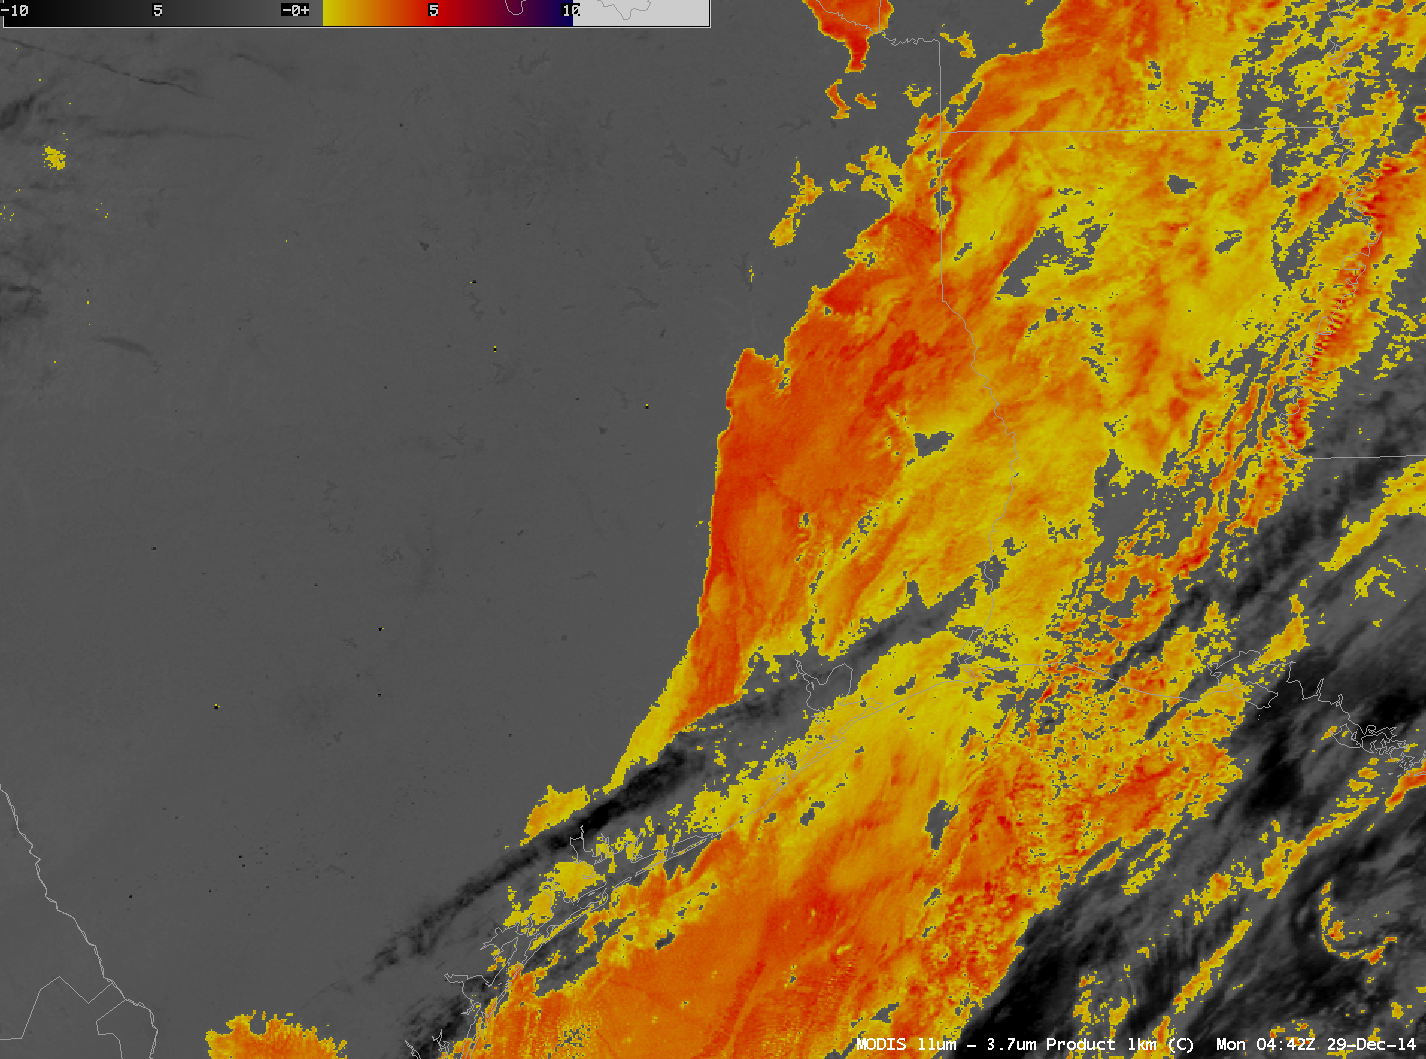
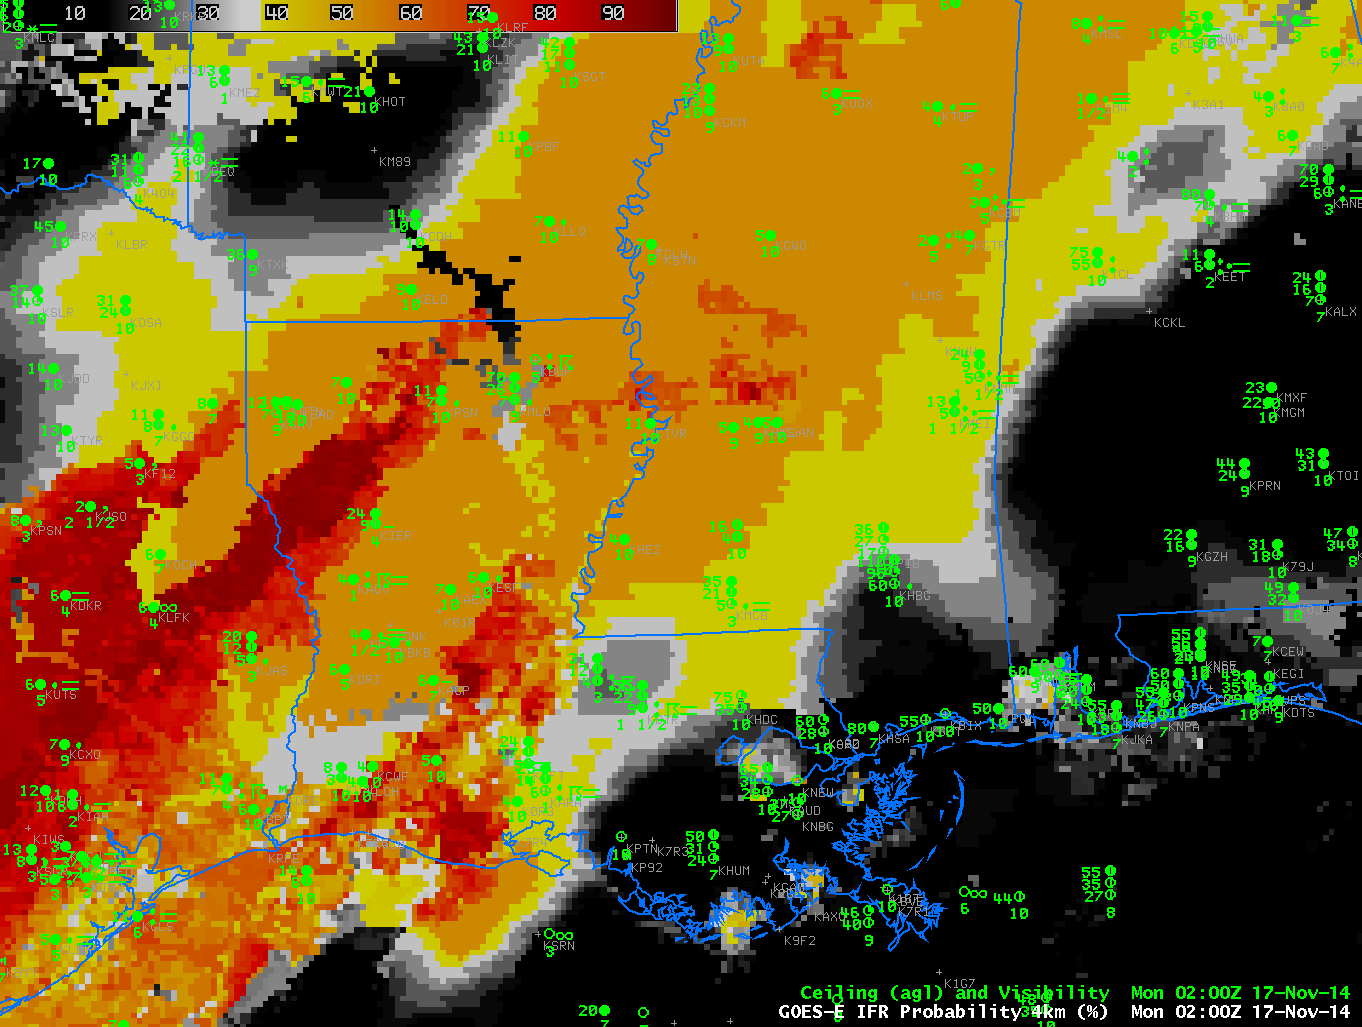
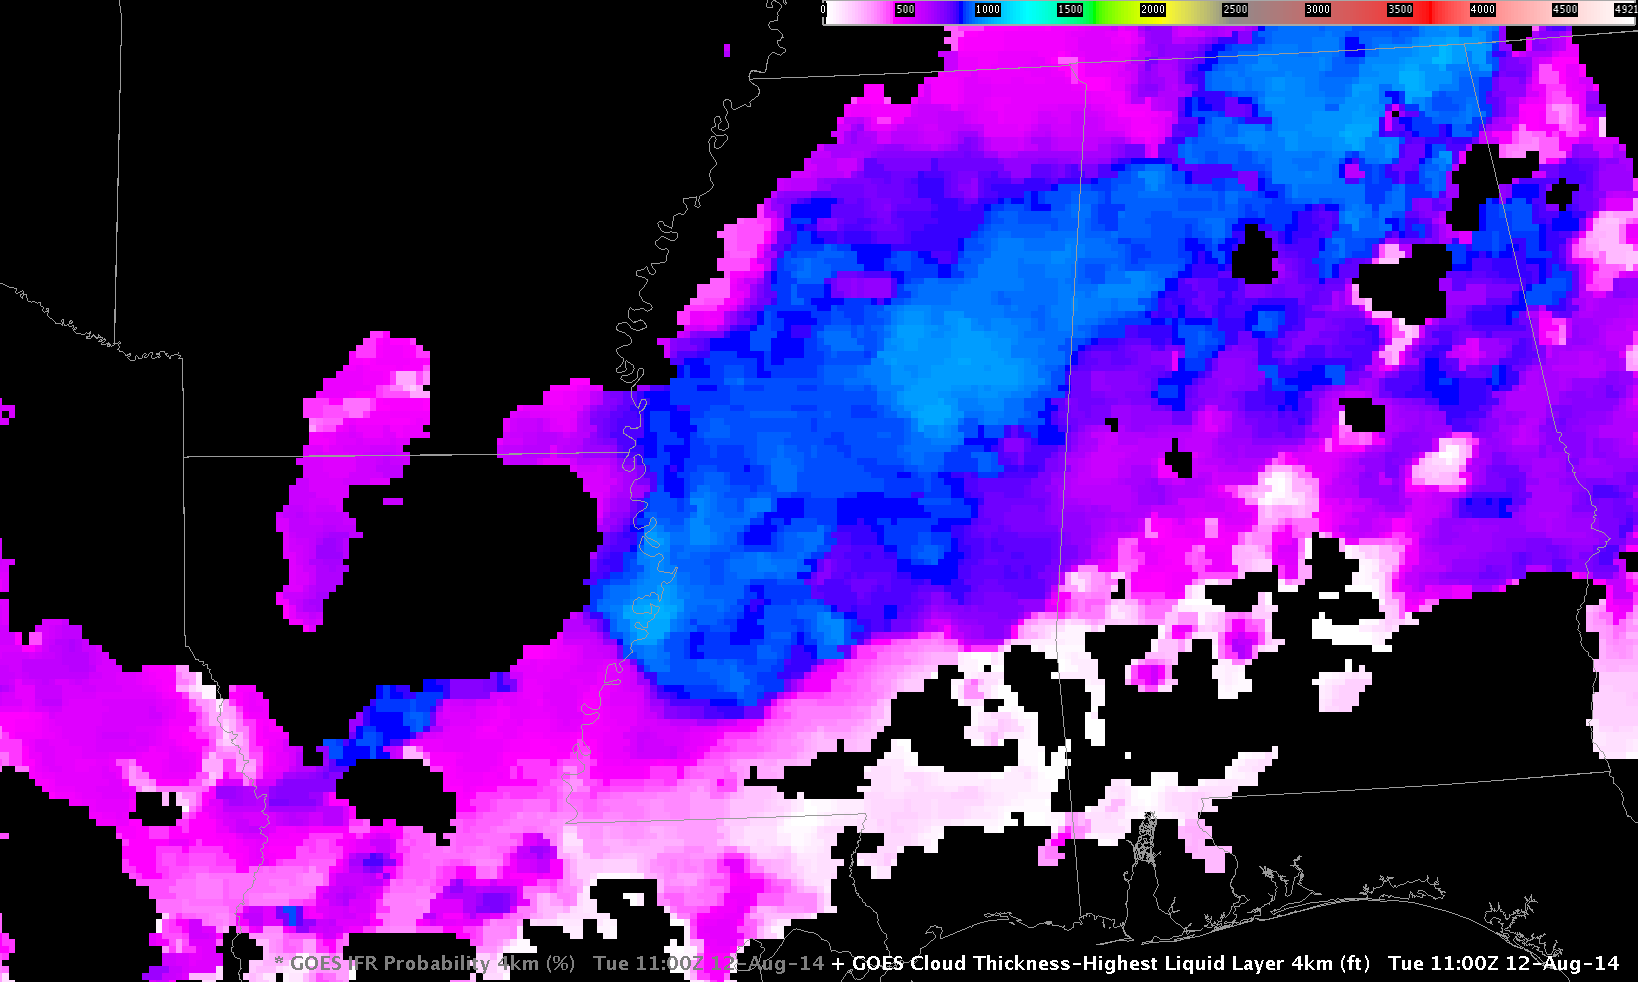
Just before 0800 UTC, a Suomi/NPP overpass provided high-resolution data. Neither the GOES-East nor the VIIRS data brightness temperature difference products show a distinct fog/stratus signal over southwestern Louisiana, where GOES-R Cloud Thickness values persist at around 600 feet, and where IFR probabilities have increased past 50%.
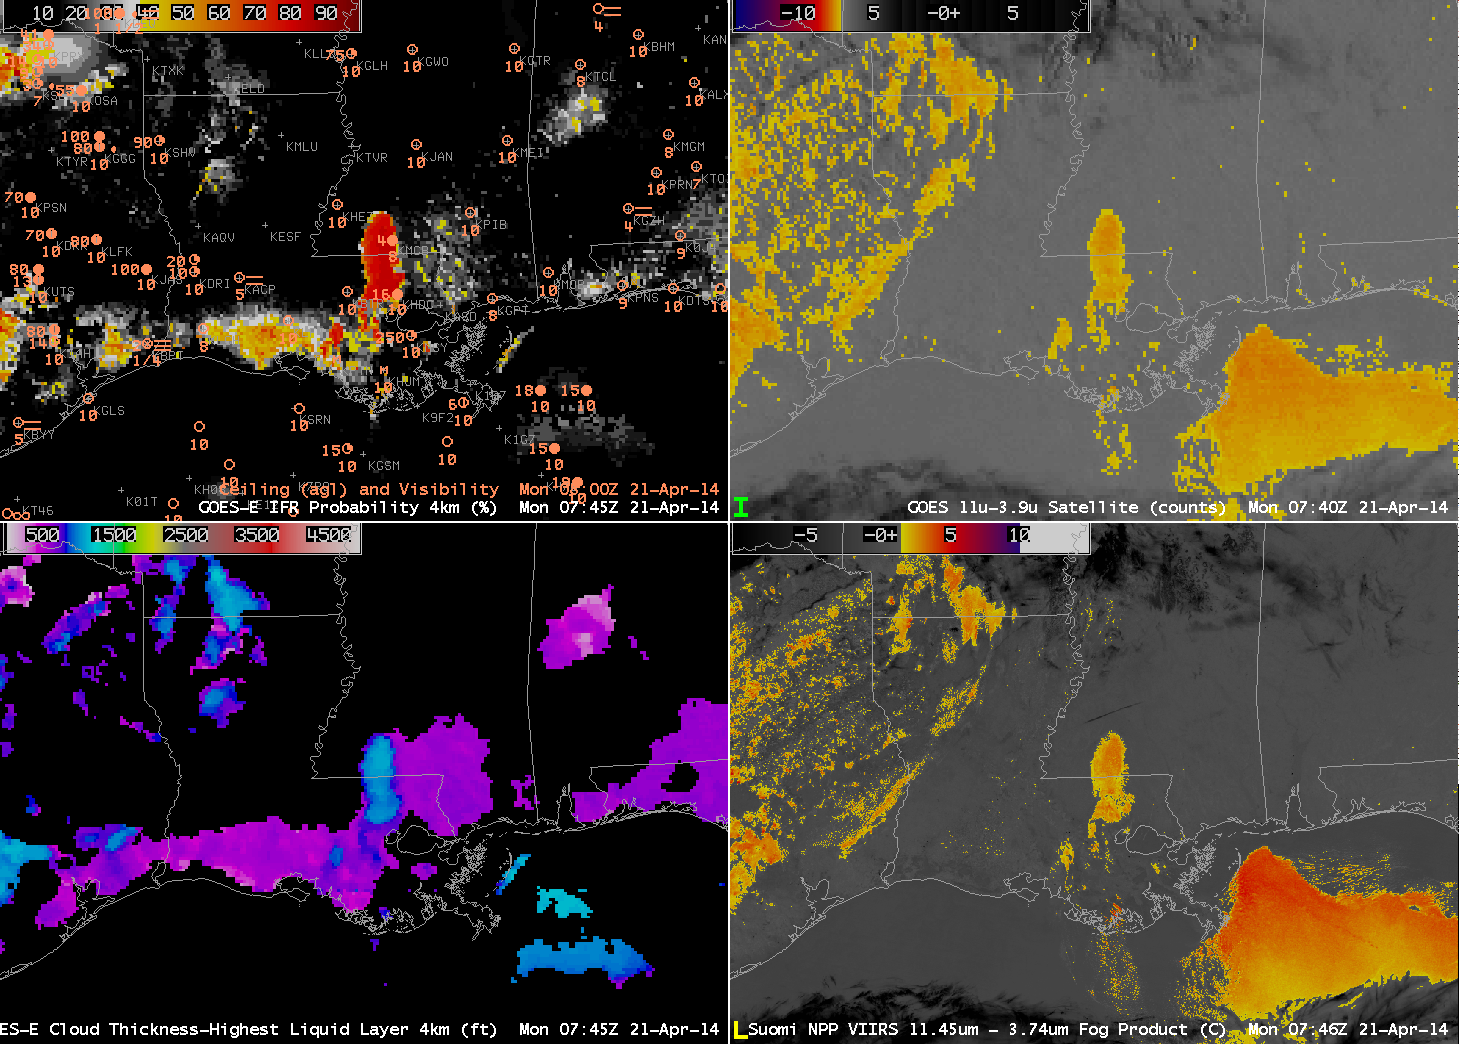
As above, but at 0745 UTC on 21 April 2014 (click to enlarge)
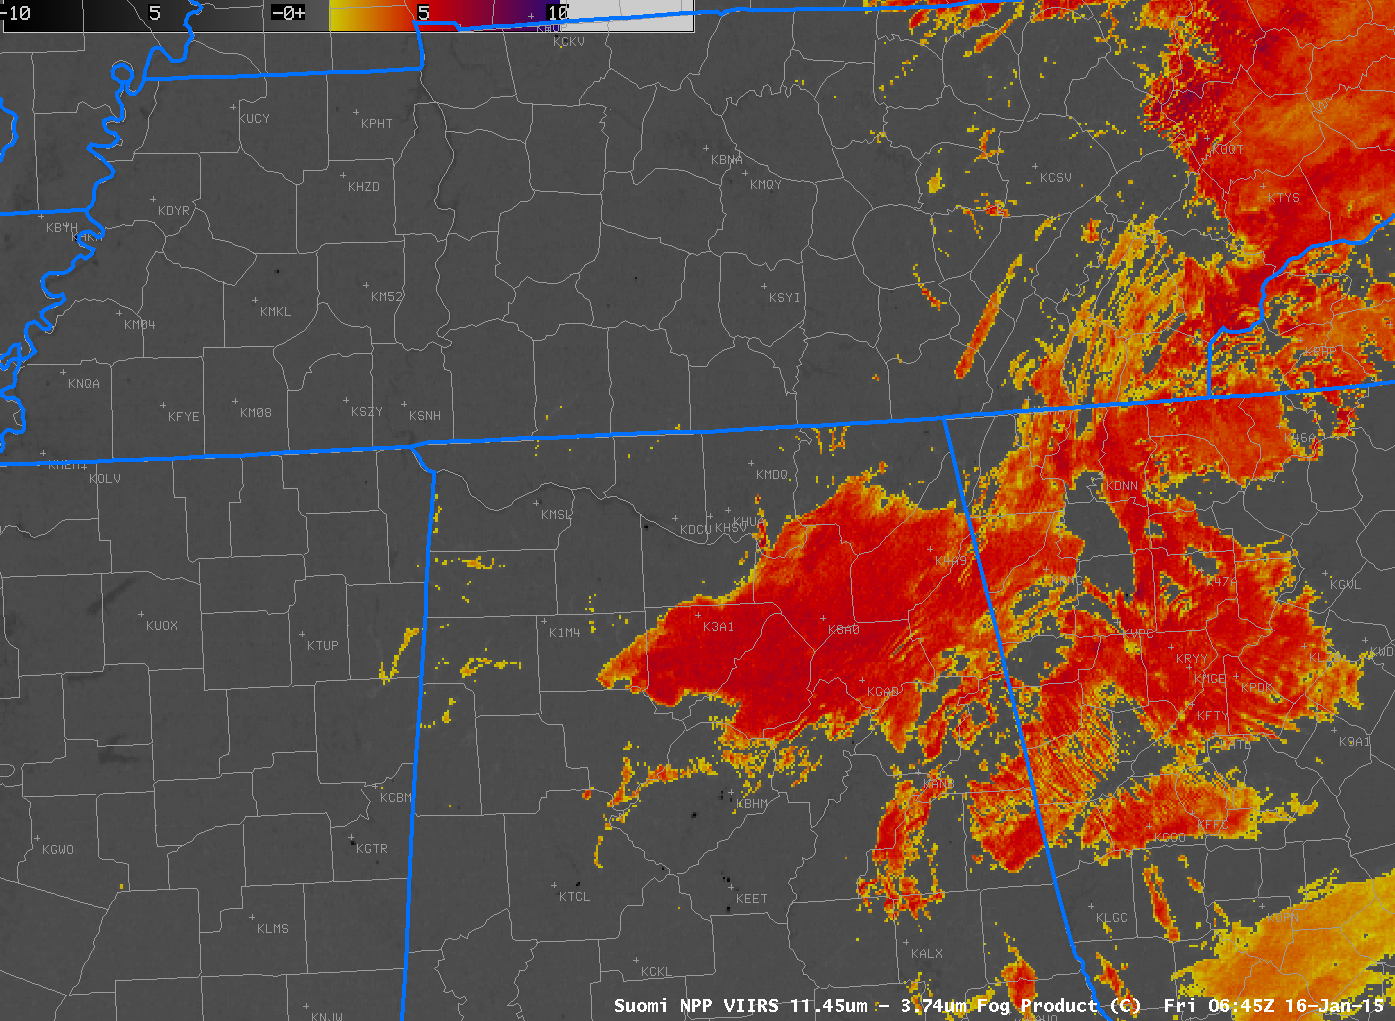
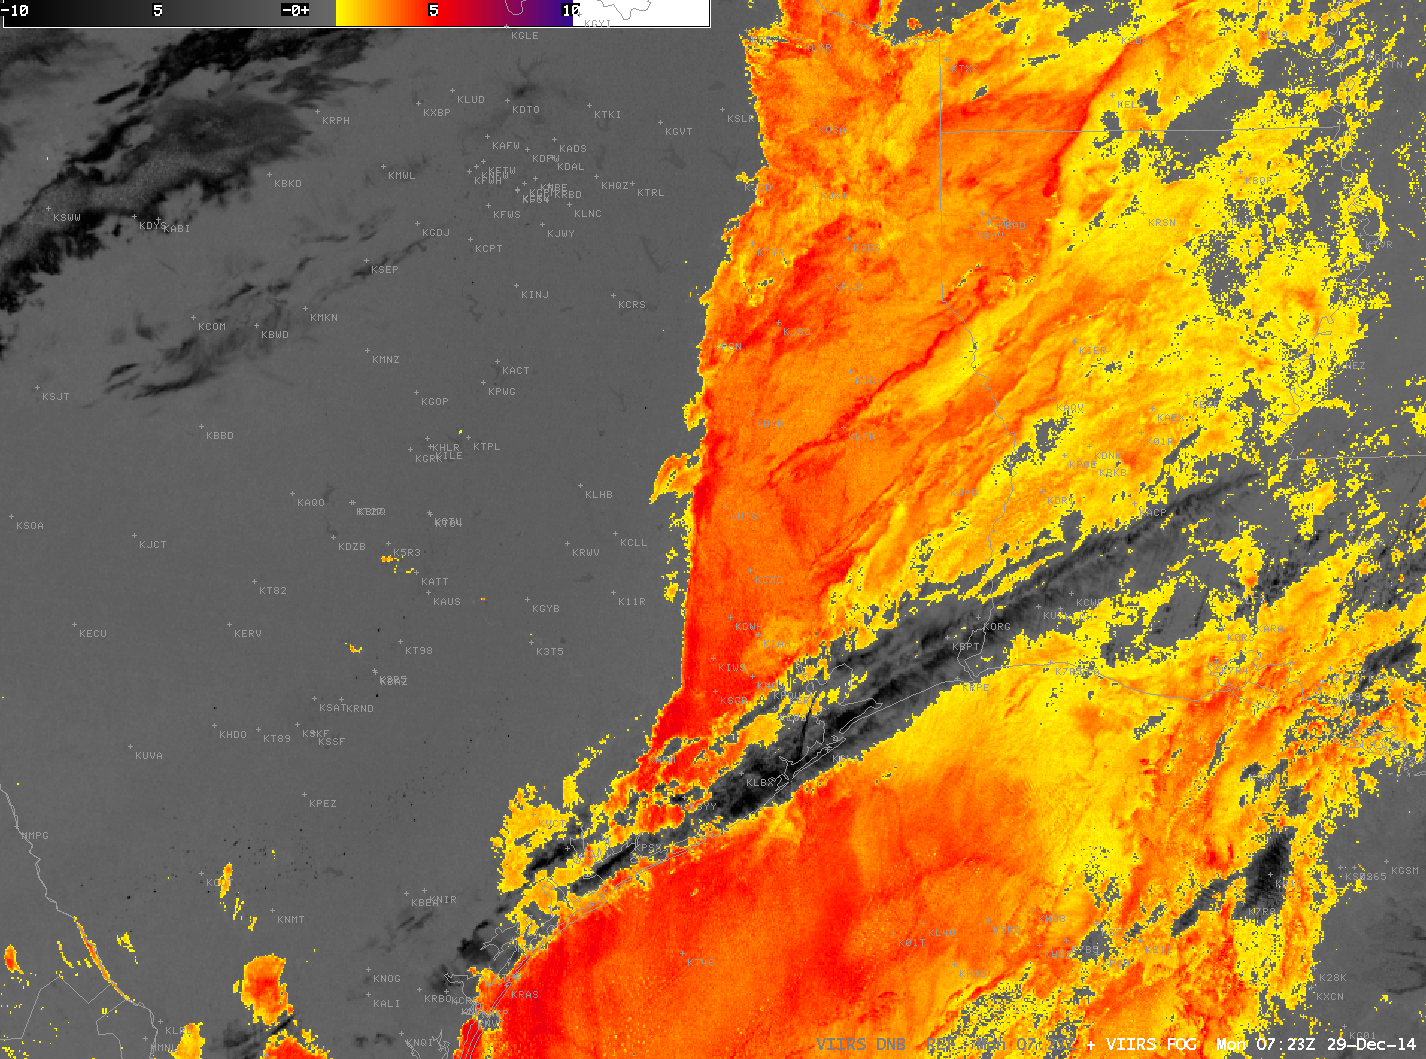
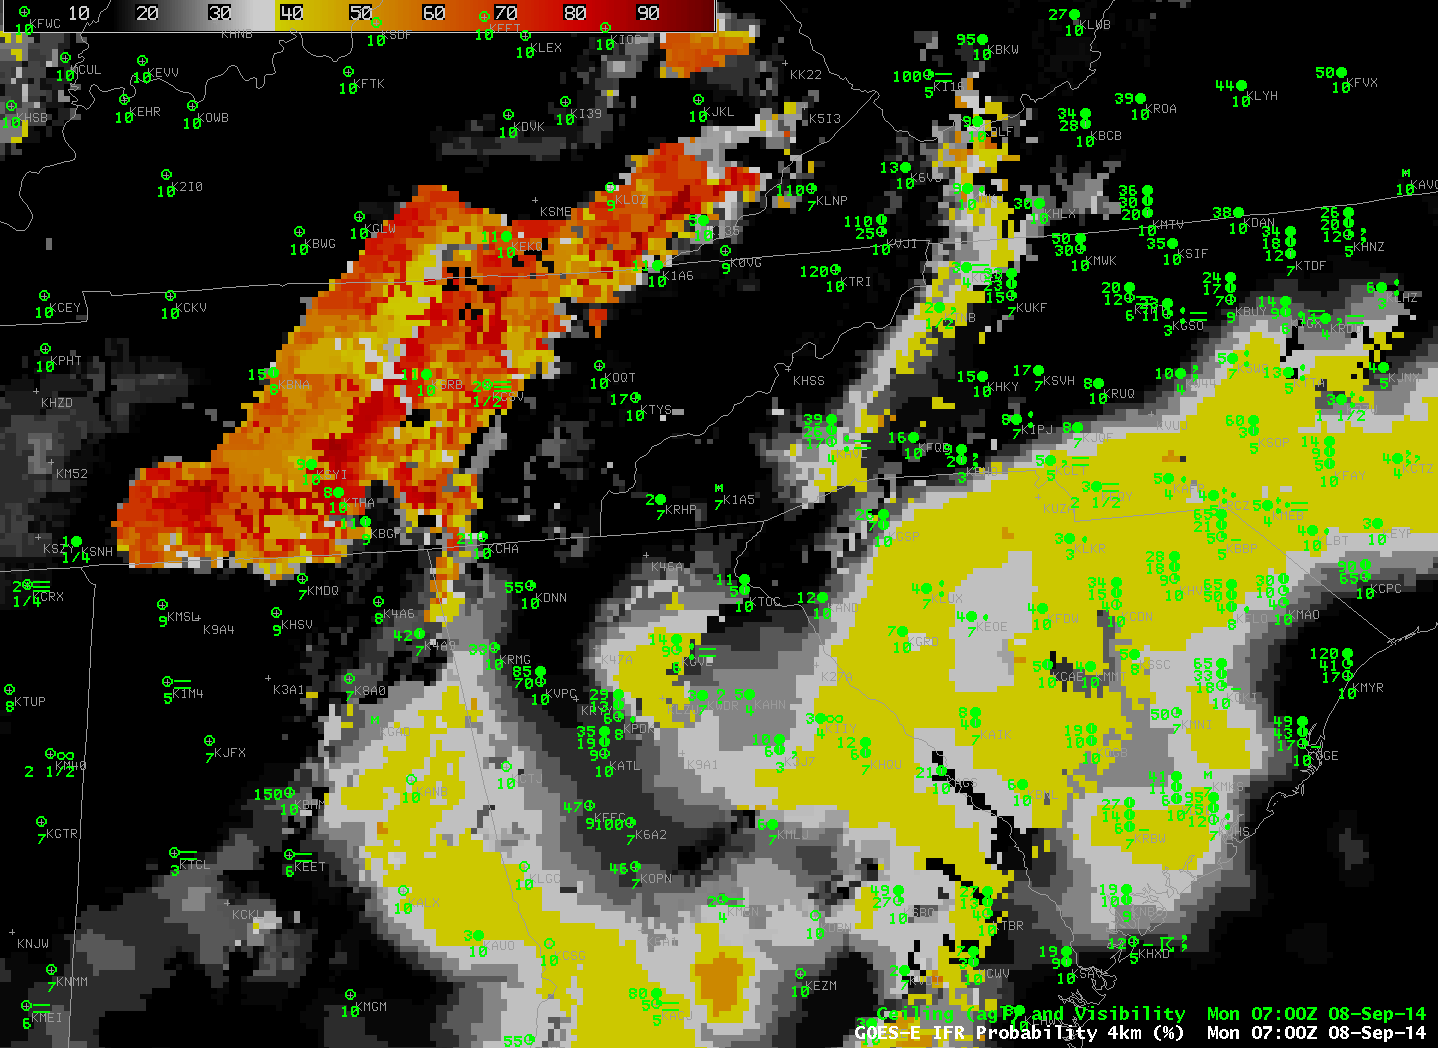
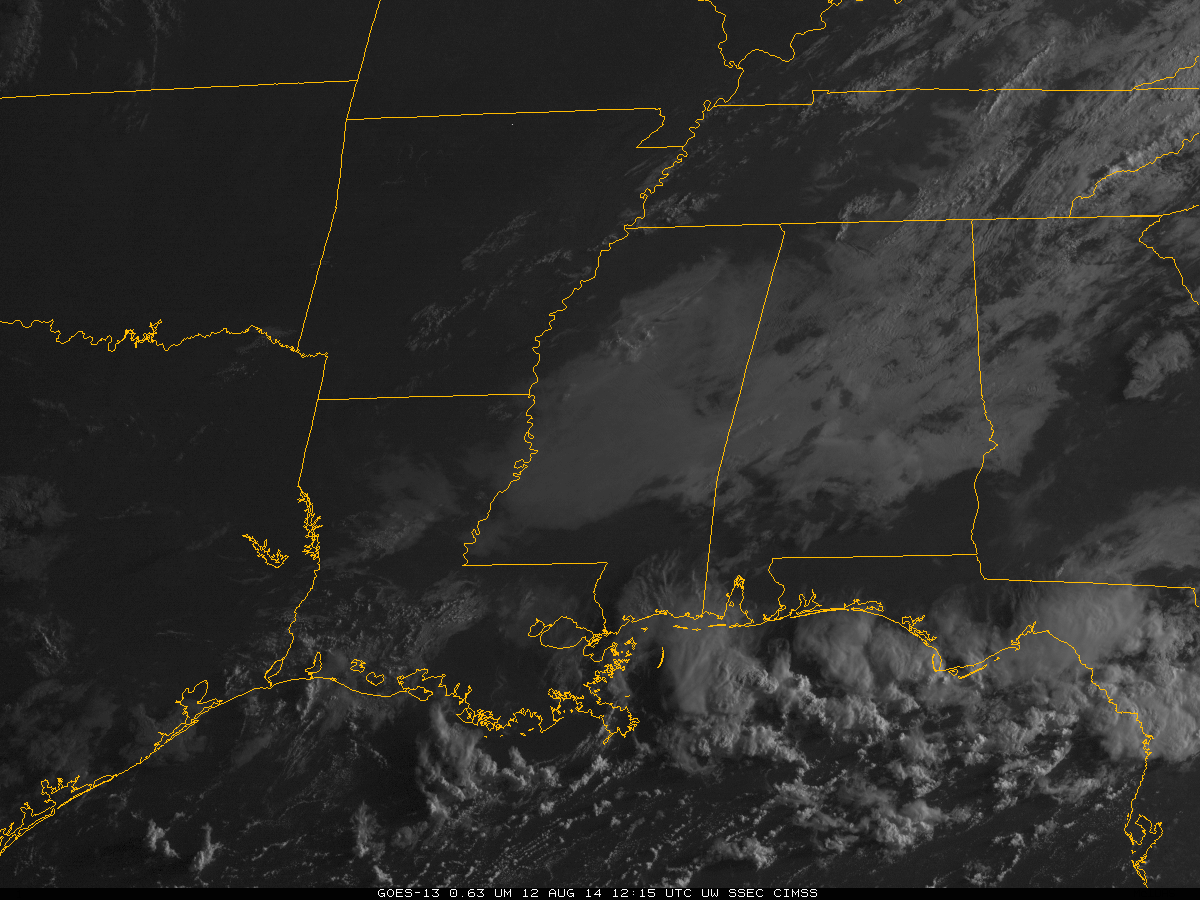
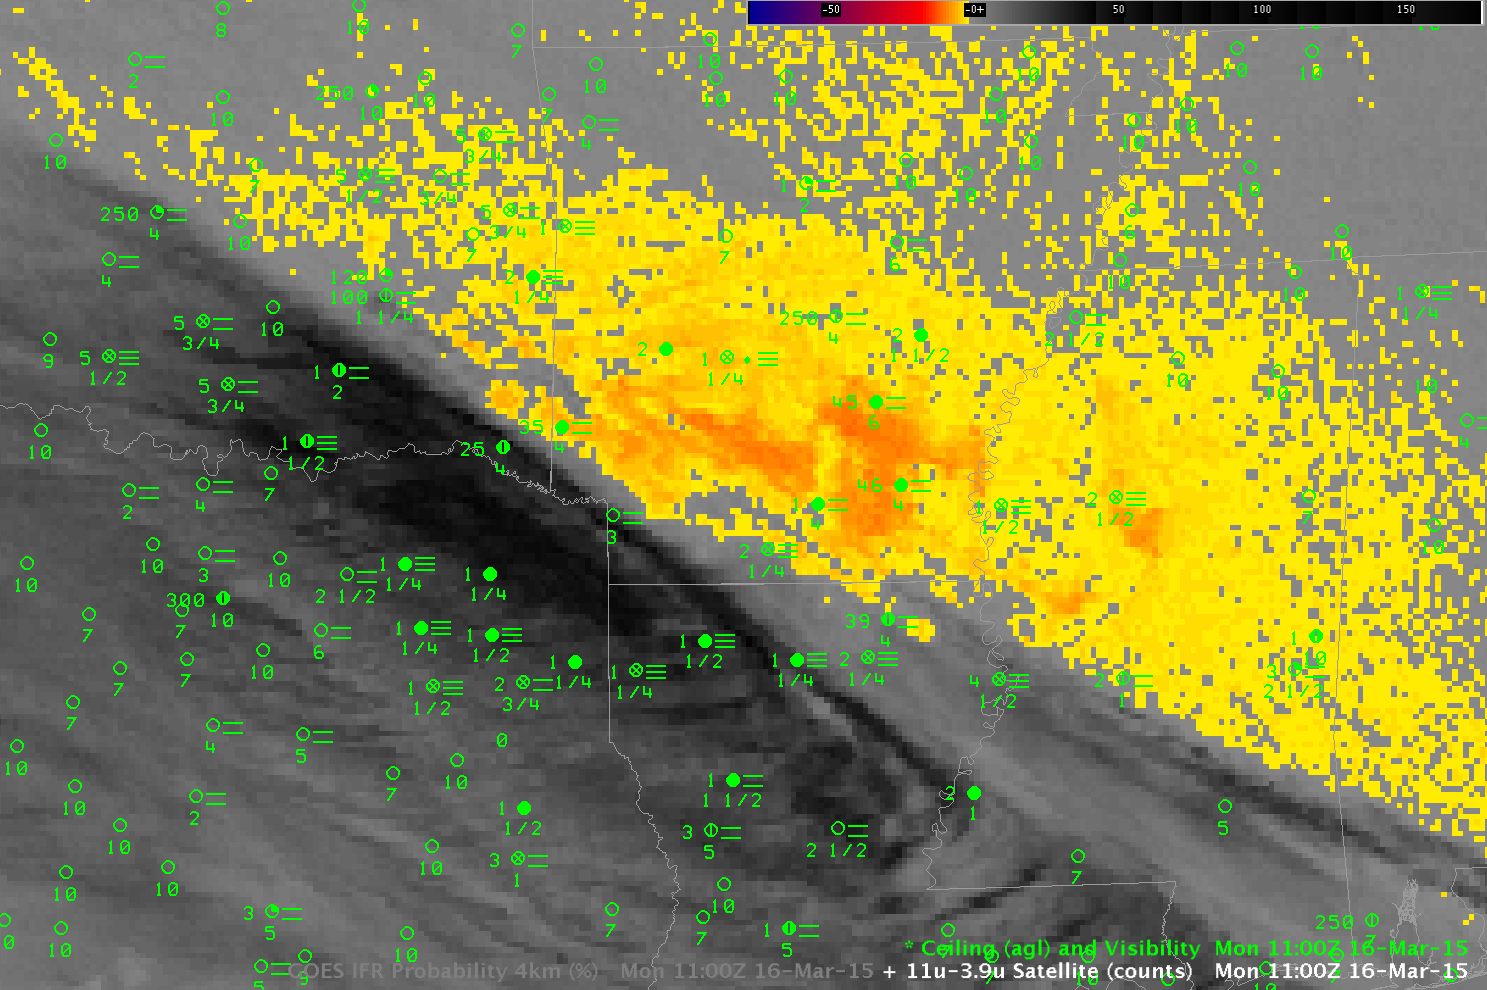
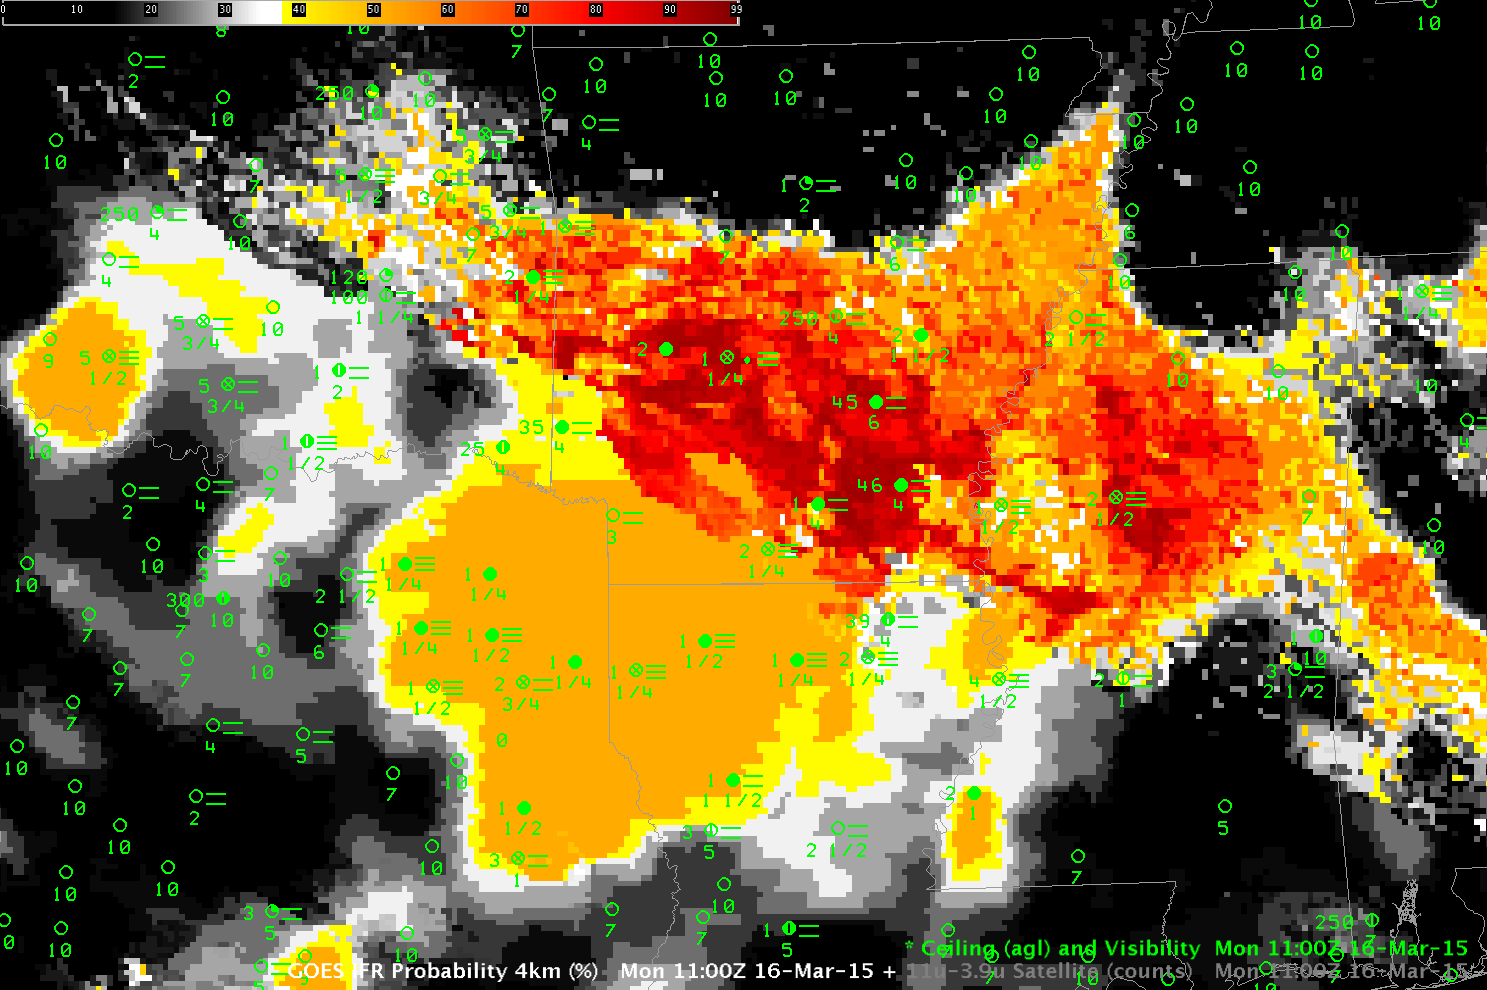
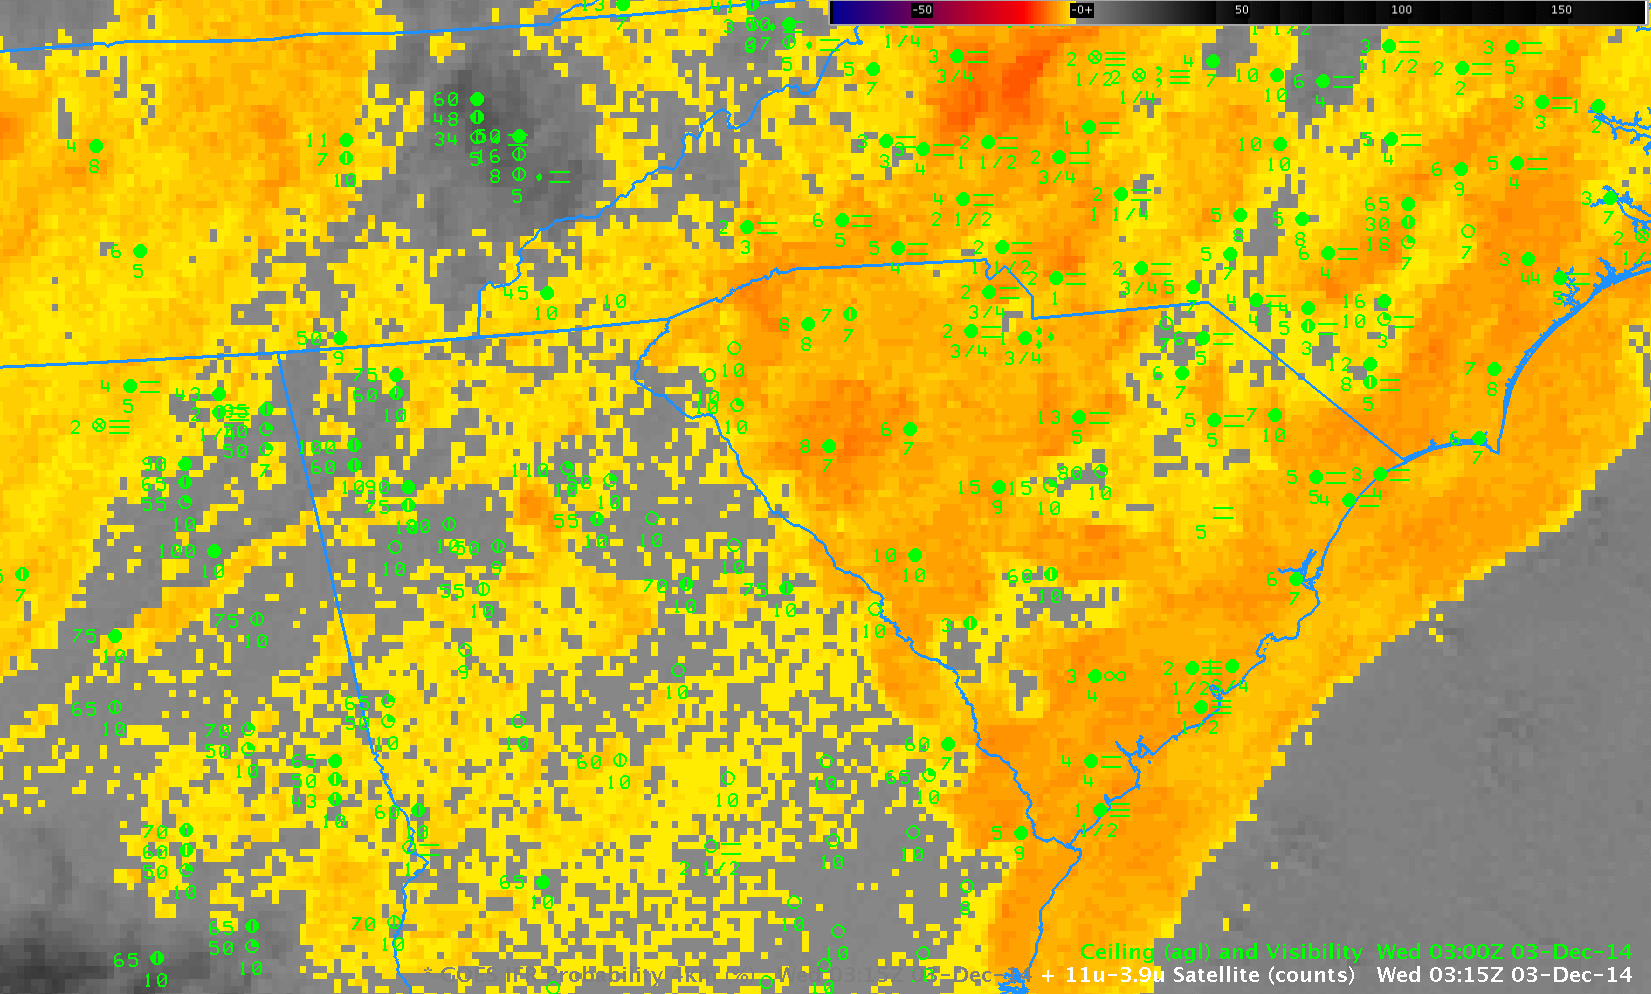
By 1100 UTC (below), when the Dense Fog Advisory is issued (hours after the IFR Proabilities first increased), the Brightness Temperature Difference product from GOES-East is finally showing a faint (albeit noisy) signal of fog/low stratus over southwestern Louisiana. A stronger signal extends northeast and southwest from Baton Rouge.

As above, but at 1100 UTC on 21 April 2014 (click to enlarge)

