Category Archives: Cloud Thickness

Radiation Fog and Dissipation Time in Florida

GOES-R IFR Probability computed from GOES-East (Upper left), GOES-East Brightness Temperature Difference (10.7 µm- 3.9 µm) (Upper right), GOES-R Cloud Thickness (Lower Left), GOES-East 3.9 µm Brightness Temperature (Lower Right)

GOES-R Fog/Low Stratus fields can be used to predict fog dissipation times, and in cases of radiation fog, the IFR probability fields sometimes give advance notification of developing IFR conditions before the traditional brightness temperature difference field has a strong signal.

In the example above, for instance, IFR probabilities at 0715 UTC suggest IFR conditions are possible over Perry, FL — in Taylor County, Florida — (where IFR conditions are observed) before the Brightness Temperature Difference field has a signal.   Predictions of IFR conditions via that GOES-R fields before the Brightness Temperature Difference field has a strong signal are common.

The GOES-R Cloud Thickness observed just before twilight conditions is used with this scatterplot to predict dissipation time.  In the example above, thicknesses are near 1000 feet over northern Florida and southern Georgia, so fog will dissipate in between 2 and 4 hours, according to the points plotted, or in a little over 3 hours according to the best linear fit through the plotted points.  The visible imagery animation, below, shows the fog dissipating as expected from the scatterplot.

GOES-13 Visible Imagery over northern Florida

Stratus and Fog over the Midwest, Tuesday Morning May 7 2013

GOES-East Brightness Temperature Difference (10.7 µm – 3.9 µm) (Upper left), Suomi/NPP VIIRS Brightness Temperature Difference (10.35 µm – 3.74 µm) (Lower Left), GOES-R IFR Probability computed from GOES-East (Upper Right), GOES-R Cloud Thickness of highest water cloud (Lower Right), all imagery near 0645 UTC May 7 2013.

Areas of low stratus and fog developed over the upper Midwest in the morning on Tuesday, May 7th 2013.  In the image above from ~0645 UTC, both GOES and Suomi/NPP detect clouds comprised of water droplets over central Illinois southwestward through St. Louis and into central Missouri.  Careful examination of the ceilings/visibilities in that region, however, suggests that this is a mid-level stratus deck, and IFR Probabilities are suitably low.  Fog is observed in northwest Missouri and over western Iowa.  In this region, GOES does not detect water-based clouds, and IFR probabilities are low.

As above, but for times near 0830 UTC 7 May 2013

Two hours later, at 0830 UTC, (above) the mid-level clouds persist near St. Louis.  IFR conditions are not occurring there, however, and IFR probabilities are low.  IFR probabilities have increased around Kansas City, however, and they’re increasing in western Iowa as well, where numerous reports of reduced visibilities due to fog are occurring. This is a region where the brightness temperature difference product, the heritage method for detecting fog and low stratus, gives no information because of multiple cloud layers.

As above, but for times near 0930 UTC

At 0930 UTC (above), IFR Probabilities continue to increase over western Iowa southward into eastern Kansas, and they continue to be (correctly) suppressed near St. Louis where the traditional brightness temperature difference field notes the presence of a cloud comprised of water droplets.

As above, but for 1100 UTC

By 1100 UTC (above), IFR probabilities are fairly high over most of western Iowa, western Missouri and eastern Kansas where many stations are reporting lowered ceilings and reduced visibility.  Again, this is a region where the traditional brightness temperature difference does not indicate the presence of fog and stratus.

As above, but for 1230 UTC 7 May.  GOES-East Visible Imagery substituted for Suomi/NPP VIIRS Brightness Difference (bottom left)

 Shortly after sunrise, at 1230 UTC, above, IFR probabilities continue to be fairly high over western Missouri and eastern Kansas, a region where some stations are reporting IFR conditions (most notably in the Missouri River valley).  One reason that IFR Probabilities have dropped quickly over Iowa is that visible imagery shows no fog there, so the cloud-clearing part of the IFR Probability algorithm used during daytime conditions is operating properly.  Note also the false brightness temperature difference signal along the western shores of the Great Lakes.  This signal arises from a co-registration error between the longwave and shortwave infrared channels.  It continues through 1400 UTC (below).

As above, but for 1402 UTC

Radiation Fog over the Allegheny Mountains of Pennsylvania

GOES-R IFR Probabilities computed using GOES-East data, hourly from 0400 UTC through 1000 UTC (excluding 0500 UTC), 26 April 2013

GOES-R IFR Probabilities show a region over the Allegheny Mountains of northwest Pennsylvania slowly acquiring higher and higher probabilities, as ceilings and visibilities drop.  How did this product perform relative to traditional fog detection imagery (the brightness temperature difference product) and relative to data from Polar Orbiting satellites?  (The 0500 UTC imagery is excluded from the animation above because Stray Light Contamination in the 3.9 channel was apparent in the IFR probability fields).

GOES-R IFR Probability computed from GOES-East, 0332 UTC (Upper Left), GOES-East Brightness temperature Difference field (10.7µm – 3.9µm) at 0340 UTC (Upper Right), GOES-R Cloud Thickness (Lower left), GOES-R IFR Probability computed from MODIS data, 0328 UTC (Lower Left).

The ‘traditional’ method of fog detection that exploits emissivity difference of water clouds at 10.7µm and 3.9 µm, upper right in the figure above, at about 0330 UTC, just as the radiation fog was starting to develop, shows clouds detected over north-central Pennsylvania, but also from Centre County southwestward to the Laurel Highlands and to West Virginia.  GOES-based and MODIS-based IFR Probability fields have very low probabilities with these primarily mid-level clouds.

As above, but at 0615 UTC 26 April 2013

By 0615 UTC, IFR probabilities continue to increase over north-central Pennsylvania, and they remain low over southern and central Pennsylvania where mid-level clouds are reported (4100-foot ceilings at Johnstown, for example).

As above, but at 0740 UTC 26 April 2013

Another MODIS overpass at 0740 UTC better resolves the character of the developing fog and low stratus over north-central Pennsylvania.  Very high IFR probabilities in the MODIS-based fields outline the river valleys of the Allegheny Plateau in north-Central Pennsylvania.  GOES-based IFR Probabilities are high, but GOES lacks the resolution to view clearly the individual river valleys.

As above, but with Suomi/NPP brightness temperature difference (10.8 µm- 3.74µm) and Day-Night Visible imagery in the bottom right (0652 UTC), with the GOES-R IFR Probabilities (Upper Left), GOES-E Brightness Temperature Difference field (Upper Right), and GOES-R Cloud Thickness toggling between 0645 and 0702 UTC.

Suomi/NPP can also give information at high resolution about the evolving fog field.  The tendrils of fog developing in the river valleys are evident in the visible imagery created using reflected lunar illumination (A mostly full moon was present the morning of 26 April) and those water-based clouds are also highlighted in the Suomi/NPP Brightness Temperature Difference Field.  The clouds over the Laurel Highlands are higher clouds — they are casting shadows visible in the Day/Night band.

As in the figure above, but for 1015 UTC 26 April 2013

The final GOES-R Cloud Thickness field before twilight conditions, above, shows maximum thicknesses of 900 feet over Warren County, Pennsylvania, and around 850 feet over southern Clarion County.  According to this link, such a radiation fog will burn off in less than 3 hours after sunrise.  The animation below of visible imagery at 1315 and 1402 UTC shows the fog, initially widespread in river valleys at 1315 UTC mostly gone by 1402 UTC.

GOES-13 Visible Imagery, 1315 and 1402 UTC, 26 April 2013.  Warren and Clarion Counties are highlighted.

Fog Dissiplation over western Tennessee

Late-in-the-day rains followed by clearing skies and light winds set the stage for radiation fog over much of western Tennessee early on April 5th.  The GOES-R Cloud Thickness product allows forecasters to estimate when radiation fog will burn off.

GOES-R IFR Probabilities computed with GOES-East data (Upper left), GOES-East traditional brightness temperature difference (Upper right), GOES-R Cloud Thickness Product (Lower Left), GOES-R IFR Probabilities computed with MODIS data (Lower right), hourly from 0415 UTC through 1115 UTC on April 5th 2013.

The animation above shows the retreat of rain clouds to the south and east, and the development of radiation fog.  The IFR Probabilities around 0815 UTC — both GOES and MODIS — suggest a separation between the low stratus that is over Mississippi and Alabama and the fog over western Tennessee (the stratus shifts eastward and the radiation fog quickly develops).

GOES-R Cloud Thickness can be used to predict when a radiation fog will burn off, using this chart and the final pre-twilight cloud thickness field (Cloud thickness is not computed during twilight conditions).  The last cloud thickness field image produced is shown below:

GOES-R Cloud Thickness, Friday 5 April 2013 at 1132 UTC

Fog/Cloud Thickness is greatest, a bit more than 1100 feet, in Fayette County just east of Memphis and in Henderson and Chester Counties a bit farther to the east and north.  Scatterplot points on the chart suggest that the fog could burn off in 3 or so hours after the 1132 UTC image above.  The visible loop animation, below, shows fog has cleared by 1432.

Visible imagery animation, 1232-1432 UTC on April 5 2013

Resolution Issues over the Pacific Northwest

GOES-R IFR Probabilities computed from GOES-West (Upper Left), GOES-E/W Brightness Temperature Difference (10.7 µm – 3.9µm) (Upper Right), GOES-R Cloud Thickness (Lower Left), Suomi/NPP VIIRS Brightness Temperature Difference  (Lower Right)
As on top, but with MODIS Brightness Temperature Difference (11 µm – 3.7 µm) in the bottom right.

The imagery above underscores the power of higher resolution on fog detection.  The images on the right side of the images are brightness temperature difference fields, the heritage method for detecting fog and low stratus.  The GOES field (top right) actually includes data from GOES-East (eastern Washington and points east — a faint seam is discernible in the image) and GOES-West (western Washington).  Pixel size over Washington is large — 6 or 8 kilometers (vs. 4 kilometers at the subsatellite point).  In contrast, Suomi/NPP VIIRS data and MODIS data (bottom right) has a resolution of 1 km.  The brightness temperature difference from MODIS and VIIRS more easily resolves the fine-scale structure of the topographically influenced or topographically constrained fog and low stratus.  The brightness temperature difference field from GOES is one of the predictors used to generate the IFR Probabilities shown in the upper right.  When poor resolution smears out the horizontal domain of the fog and low stratus in the brightness temperature difference field, you might expect a similar effect on the IFR probabilities.

As above, but with MODIS-based GOES-R IFR Probabilities in the lower right

 MODIS data can be used to compute IFR probabilities.  Compare the lower right and upper left figures.  High MODIS IFR Probabilities are far more restricted to regions where IFR conditions are observed.  In contrast, GOES-based IFR probabilities seem to leak into regions where IFR conditions are not reported.

The higher resolution MODIS-based IFR Probabilities (and coming soon, Suomi/NPP-based IFR probabilities) nicely complement the higher temporal resolution of the GOES imagery.  Ideally, use of the changes in the GOES-based IFR probabilities shows how IFR conditions evolve over the course of a night.  These changes should be tempered with knowledge of the limitations of the horizontal resolution of GOES that are highlighted in the above imagery.

IFR conditions in Maine

GOES-R IFR Probabilities computed from GOES-East (Upper Left), GOES-East Brightness Temperature Difference (10.7 µm – 3.9 µm) (Upper Right), GOES-R Cloud Thickness (Lower Left), Toggle between Suomi/NPP Brightness Temperature Difference (10.8 µm – 3.74 µm) and Day/Night Band “Nighttime Visible” imagery (Lower Right), all around 0815 UTC on 28 February

Weak Low pressure in the Gulf of Maine helped generate IFR conditions over the northeastern United States early in the morning on 28 February 2013.  The brightness temperature difference fields over New England from Suomi/NPP include very sharp cloud edges (also present in the Day/Night band imagery).  Because the GOES-R IFR Probability field also includes information from the Rapid Refresh, it is better able to distinguish fog and low stratus, as present over most of Maine, from elevated stratus, present over western New Hampshire and Quebec.

GOES-R IFR Probabilities computed from GOES-East (Upper Left), GOES-East Brightness Temperature Difference (10.7 µm – 3.9 µm) (Upper Right), GOES-R Cloud Thickness (Lower Left), Suomi/NPP Brightness Temperature Difference (10.8 µm – 3.74 µm) (Lower Right), times as indicated

The animation of the imagery, above, demonstrates how the GOES-R IFR probability product can be used to monitor the evolving nature of a low cloud field.  As the low pressure system in the Northeast starts to move away, the fog/low clouds rotate eastward.   Two noteworthy events in the loop are present.  The 0515 UTC imagery (mislabeled as 0510 UTC), contains stray light in the 3.9 µm field, and the traditional GOES brightness temperature difference field is therefore changed significantly, but the GOES-R IFR probability field is not.  Note also that multiple cloud layers exist over coastal Maine and New Hampshire at the end of the animation, but GOES-R IFR probabilities correctly maintain high probabilities in a region where IFR conditions are present and where the traditional brightness temperature difference field does not show a signal consistent with low clouds.

IFR conditions over the upper Midwest

GOES-R IFR Probabilities from GOES-East (Upper Left) at 0832 UTC, along with 0900 UTC observations, Traditional GOES-East Brightness Temperature Difference (10.7  µm – 3.9  µm) at 0832 UTC (Upper Right), GOES-R Cloud Thickness computed from GOES-East (Lower Left), Suomi/NPP Day/Night Band Nighttime visible imagery, 0838 UTC (Lower Left)

Stratus and low clouds persisted over western Minnesota and the eastern Dakotas overnight on 25 to 26 February, and the GOES-R IFR Probability field ably captured the region of lowest visibility.  Note that the IFR probability field extends into northwest Iowa (albeit with relatively lower probabilities).  This is a region where high-level cirrus prevents the traditional brightness temperature difference product from giving useful information about the low levels.  In this region, Rapid Refresh data are used to fill in information and more accurately capture the region of IFR conditions.

As above, but for 0802 UTC for GOES-East Products, and with the MODIS-based IFR probability field at 0801 UTC in the lower left

GOES-R IFR Probabilities can be used with MODIS data as well, and the better resolution (1 km at nadir vs. 4 km at GOES nadir) means the MODIS fields have better small-scale detail.    Note, for exanple, the sharper edge to the IFR probability field in east-central Minnesota.

As at the beginning of the post, except for 0415 UTC (top), 0432 UTC (middle) and 0445 UTC(bottom)

Stray-light issues can influence the 3.9 µm imagery, and therefore the brightness temperature difference field, and therefore the GOES-R IFR Probability field.  In the three images above, Stray Light is noteable in the 3.9 µm at 0432 UTC, but that erroneous information can be de-emphasized in the GOES-R IFR probability field because the Rapid Refresh Data in regions where Stray Light is present may show dryer low levels.

Changing IFR probabilities over Gainesville FL as fog develops

GOES-R IFR Probabilities (Upper Left), GOES-R Cloud Thickness (Lower Left), GOES-East Brightness Temperature Difference (10.7 µm – 3.9 µm) Product (Upper Right), GOES-East Visible Imagery (Lower Right), 0500 UTC on 12 February.

This example shows how the IFR Probability Values changed hourly as IFR conditions developed over the north-central Florida peninsula.  IFR Probabilities around Gainesville — KGNV — are below 10%.  These small values persist through about 0545 UTC, but by 0615 UTC, below, they have increased to around 20% although brightness temperature difference returns have not substantively changed.

As above, but at 0615 UTC

By 0702 UTC, below, values continue to increase, to around 30%, but Gainesville continues to report MVFR conditions.  There is a location nearby, however, over eastern Alachua County, where Probabilities exceed 70%.  Abundant surface waters in eastern Alachua County — Newnans Lake, Santa Fe Lake, Ledwith Lake, Orange Lake and Lochloosa Lake — may have contributed to the initial fog development there.  Note also that the traditional fog detection product, the brightness temperature difference, is also starting to show enhanced returns.

As above, but at 0702 UTC.
As above, but at 0802 UTC

Between 0700 and 0800 UTC (above), probabilities at KGNV increase from 31% to 80%.  The increase largely results from increases in the satellite predictors of low clouds/fog, as shown in the rapid increase in the brightness temperature difference signal around Gainesville.  Nevertheless, ceilings and visibilities at KGNV have not deteriorated to IFR conditions at 0800 UTC.  IFR probabilities remain between 70 and 80% from 0800 to 0915 UTC (below), at which time IFR conditions are reported at the Gainesville airport.  From 0915 UTC to 1215 UTC, IFR conditions continue at the airport, and IFR probabilities are from 85% to 95%.

As above, but at 0915 UTC

As above, but at 1002 UTC.

As above, but at 1102 UTC

As above, but at 1215 UTC

Fatal Crash on I-16 in Georgia: Was it fog-related?

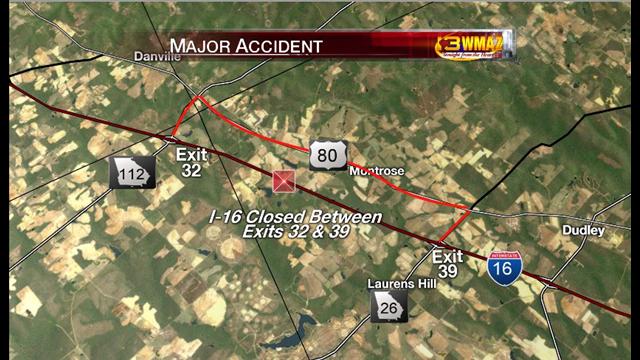
Map of Crash Location, courtesy WMAZ TV in Macon, Georgia

A multi-vehicle accident with fatalities occurred in extreme western Laurens County in central Georgia early Wednesday Morning, 6 February 2013.  (According to this news report, the first crash was around 1310 UTC)  Was fog a factor in this accident?  Fog was reported in and around the scene as first responders arrived.

Laurens County is in the Peachtree City CWA, and the relevant part of the Forecast Discussion at 0000 UTC is as follows: 

000
FXUS62 KFFC 060007
AFDFFC

AREA FORECAST DISCUSSION...UPDATED FOR AVIATION
NATIONAL WEATHER SERVICE PEACHTREE CITY GA
ISSUED BY NATIONAL WEATHER SERVICE BIRMINGHAM AL
705 PM EST TUE FEB 5 2013

.SHORT TERM /TONIGHT THROUGH WEDNESDAY NIGHT/...

FAIRLY QUIET WEATHER THROUGH THE SHORT TERM PERIOD. A WEAK
SHORTWAVE HAS BROUGHT A BAND OF CLOUDS TO THE AREA AND A FEW
SPRINKLES SHOW UP EVERY NOW AND THEN ON RADAR. CLOUDS ARE EXPECTED
TO THIN OUT OVERNIGHT AND FOG COULD BECOME AN ISSUE IN THE FEW
HOURS BEFORE SUNRISE. THIS IS SOMETHING THAT WILL HAVE TO BE
MONITORED THROUGH THE EVENING. MILD TEMPERATURES THROUGH THE
PERIOD.

.LONG TERM /THURSDAY THROUGH TUESDAY/... 
[...snipped...]
&&

.AVIATION... 00Z TAF DISCUSSION.

VFR CIGS WILL CONTINUE ACROSS THE TAF SITES THIS EVENING.
EXPECT MVFR CONDITIONS LATE TONIGHT AS FOG AND LOW CLOUDS DEVELOP
BEGINNING AFTER 06Z NEAR CSG SPREADING NORTH AND EAST. THE ATLANTA
TAF SITES SHOULD EXPECT TO BE IMPACTED BY 08-09Z. IMPROVING
CONDITIONS BY 15Z. LIGHT WESTERLY WINDS EXPECTED. 
 
 So, overnight fog was considered a possibility at 0000 UTC.
And updated AFD was issued shortly before 0600 UTC.  In that update the Aviation discussion was tweaked:
FXUS62 KFFC 060553
AFDFFC

AREA FORECAST DISCUSSION...UPDATED FOR AVIATION
NATIONAL WEATHER SERVICE PEACHTREE CITY GA
ISSUED BY NATIONAL WEATHER SERVICE BIRMINGHAM AL
1245 AM EST WED FEB 6 2013

.SHORT TERM /TONIGHT THROUGH WEDNESDAY NIGHT/... 
 
[...no changes...]
 
.LONG TERM /THURSDAY THROUGH TUESDAY/... 
 
[...snipped for brevity...]
&&

.AVIATION... 06Z TAF DISCUSSION.

PATCHY CEILINGS BKN030-040 LINGERING THROUGH THE NIGHT. POTENTIAL
FOR LIFR CONDITIONS WHERE SKIES ARE CLEAR...BUT EXPECT ALL TAF SITES
TO HAVE AT LEAST MVFR CONDITIONS 08Z THROUGH 14Z. IMPROVING AFTER
THAT TO VFR. WINDS NORTHWEST 5 TO 10KT AFTER 15Z.


//ATL CONFIDENCE...06Z UPDATE...
MEDIUM CONFIDENCE ON ALL ELEMENTS.
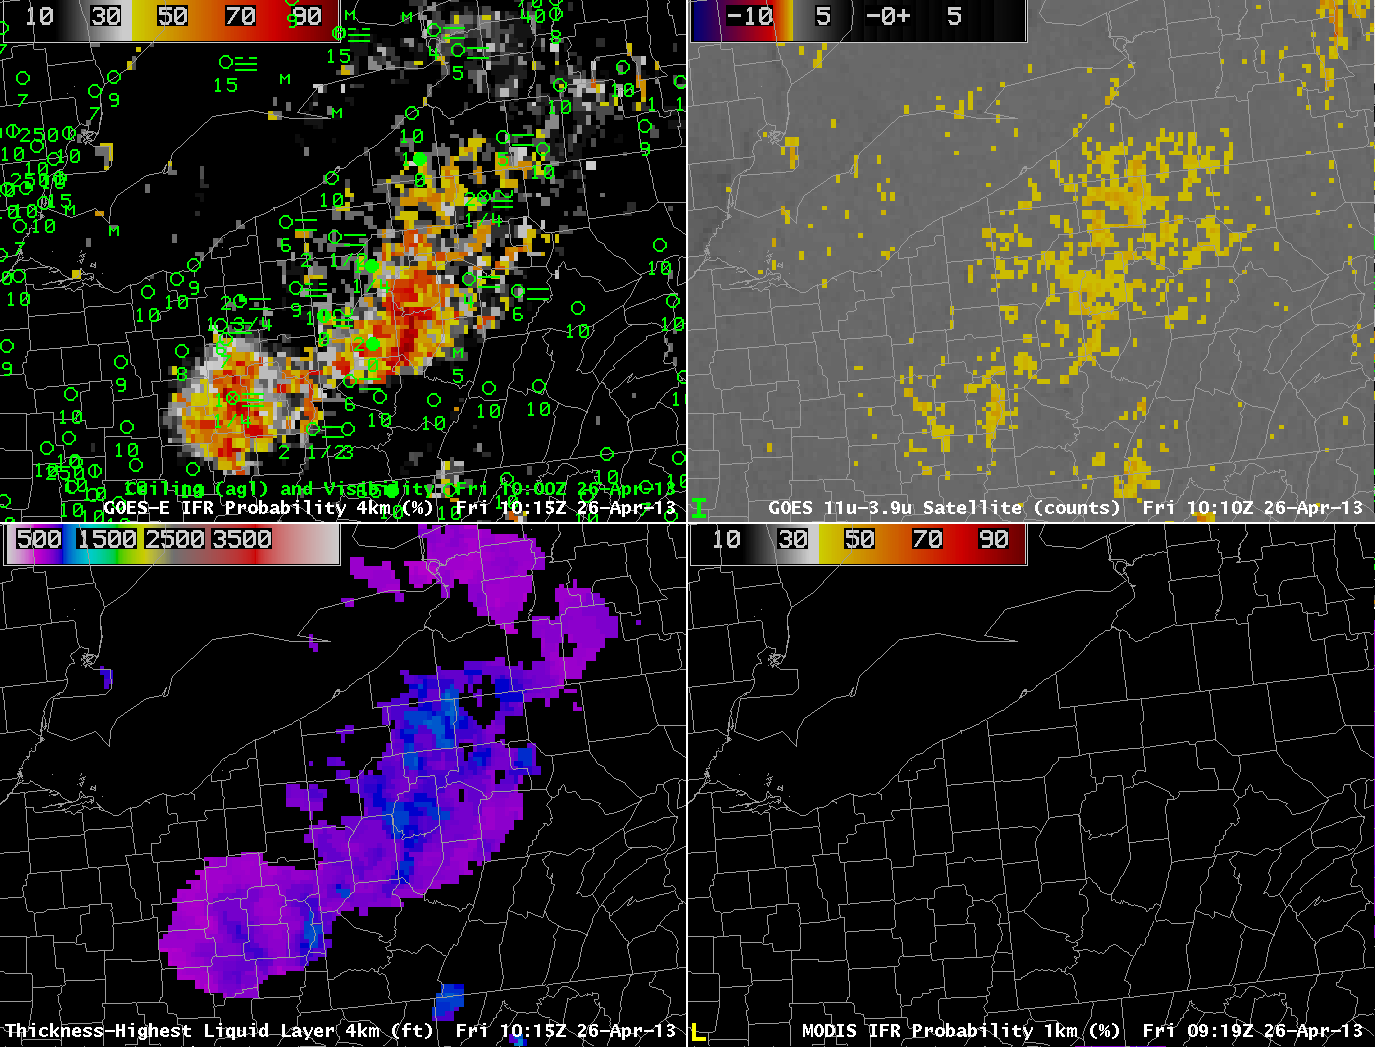
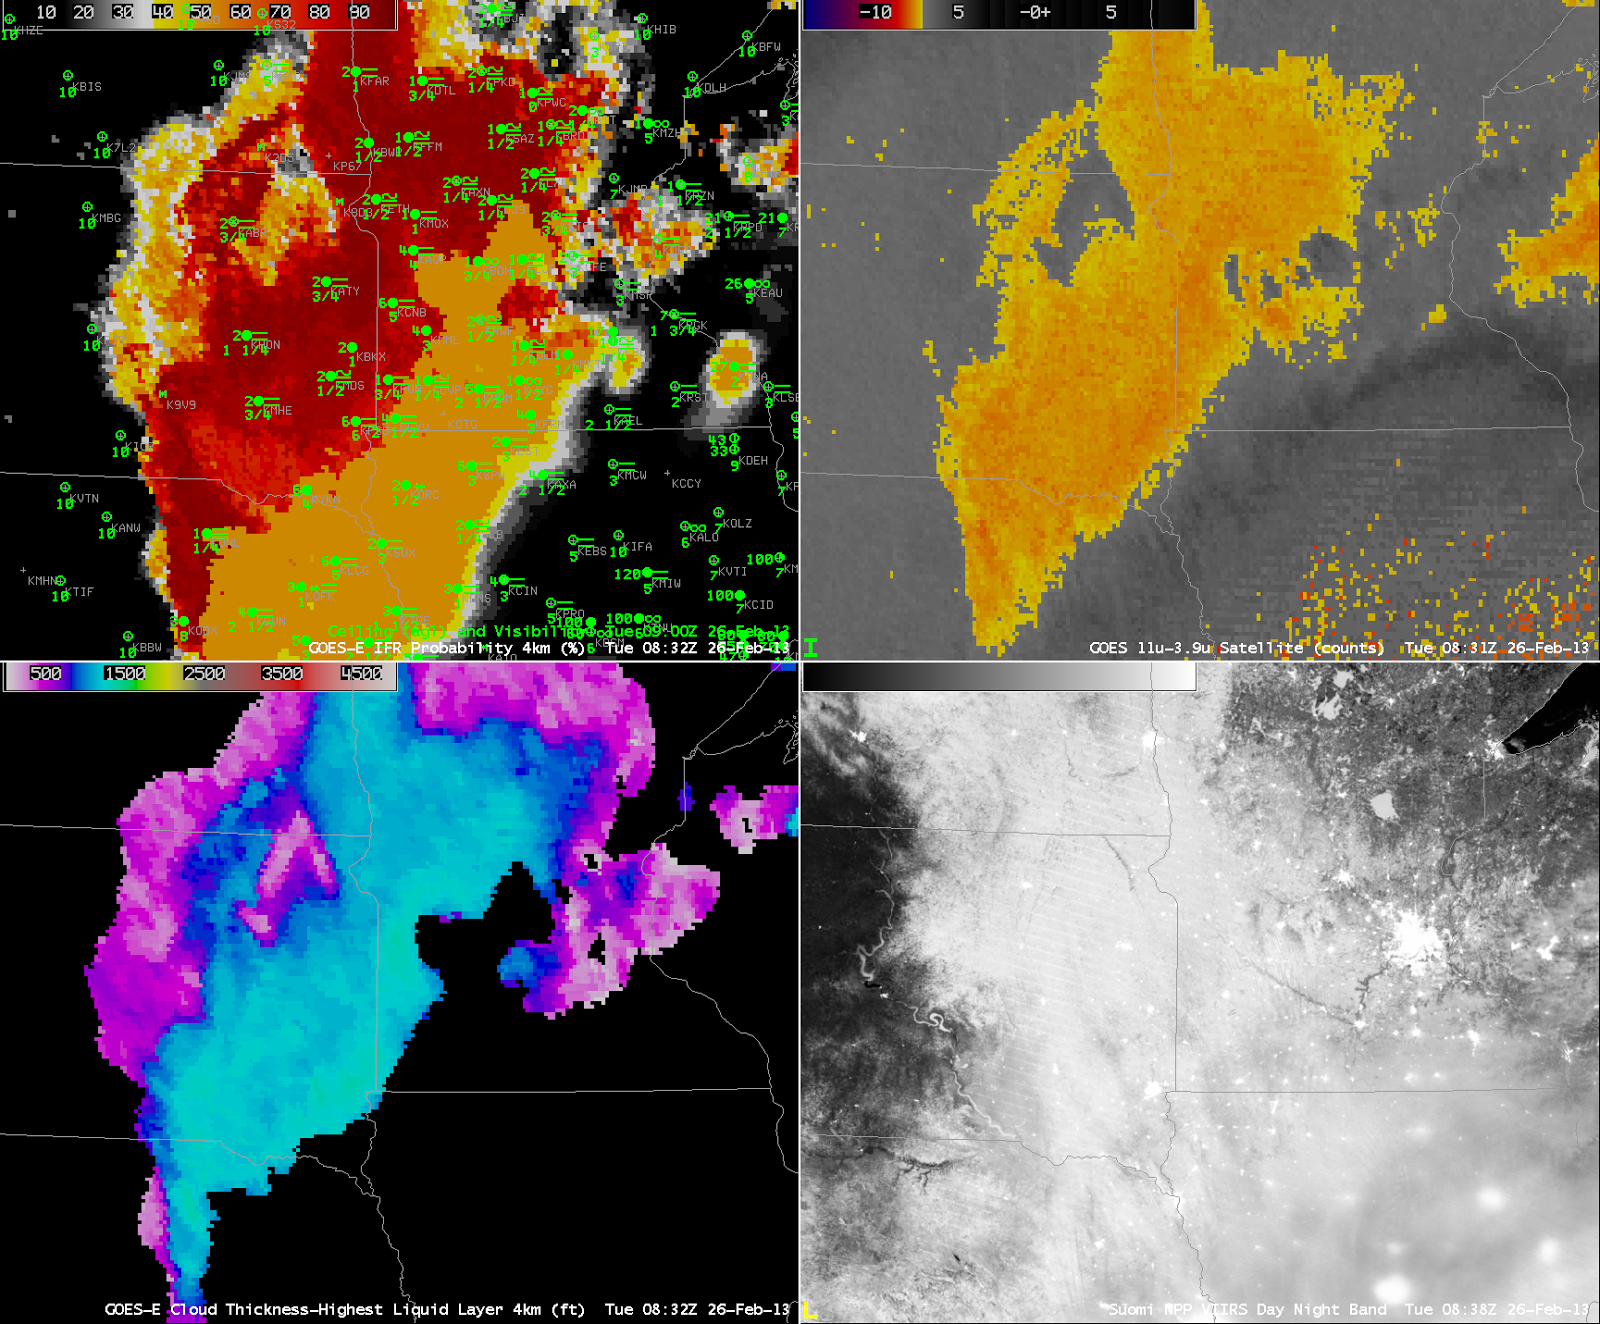
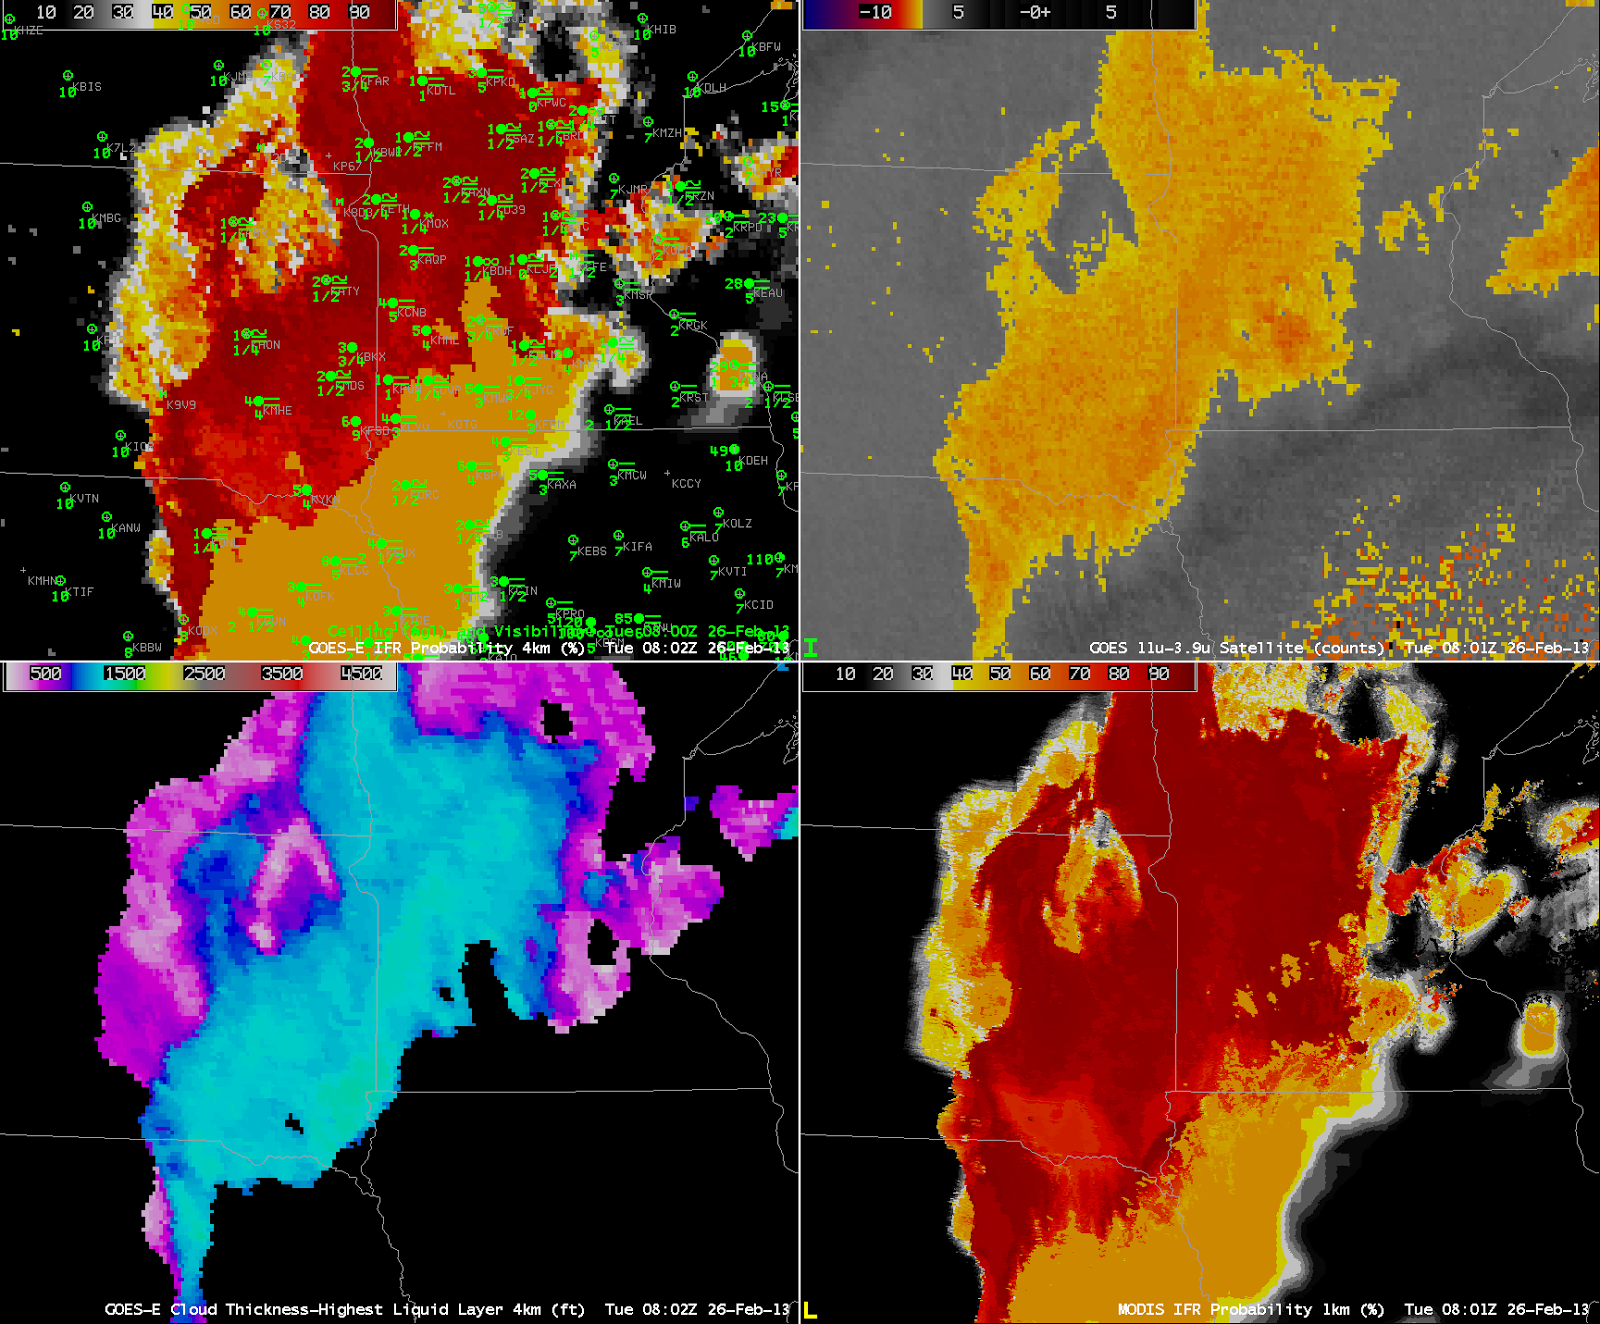
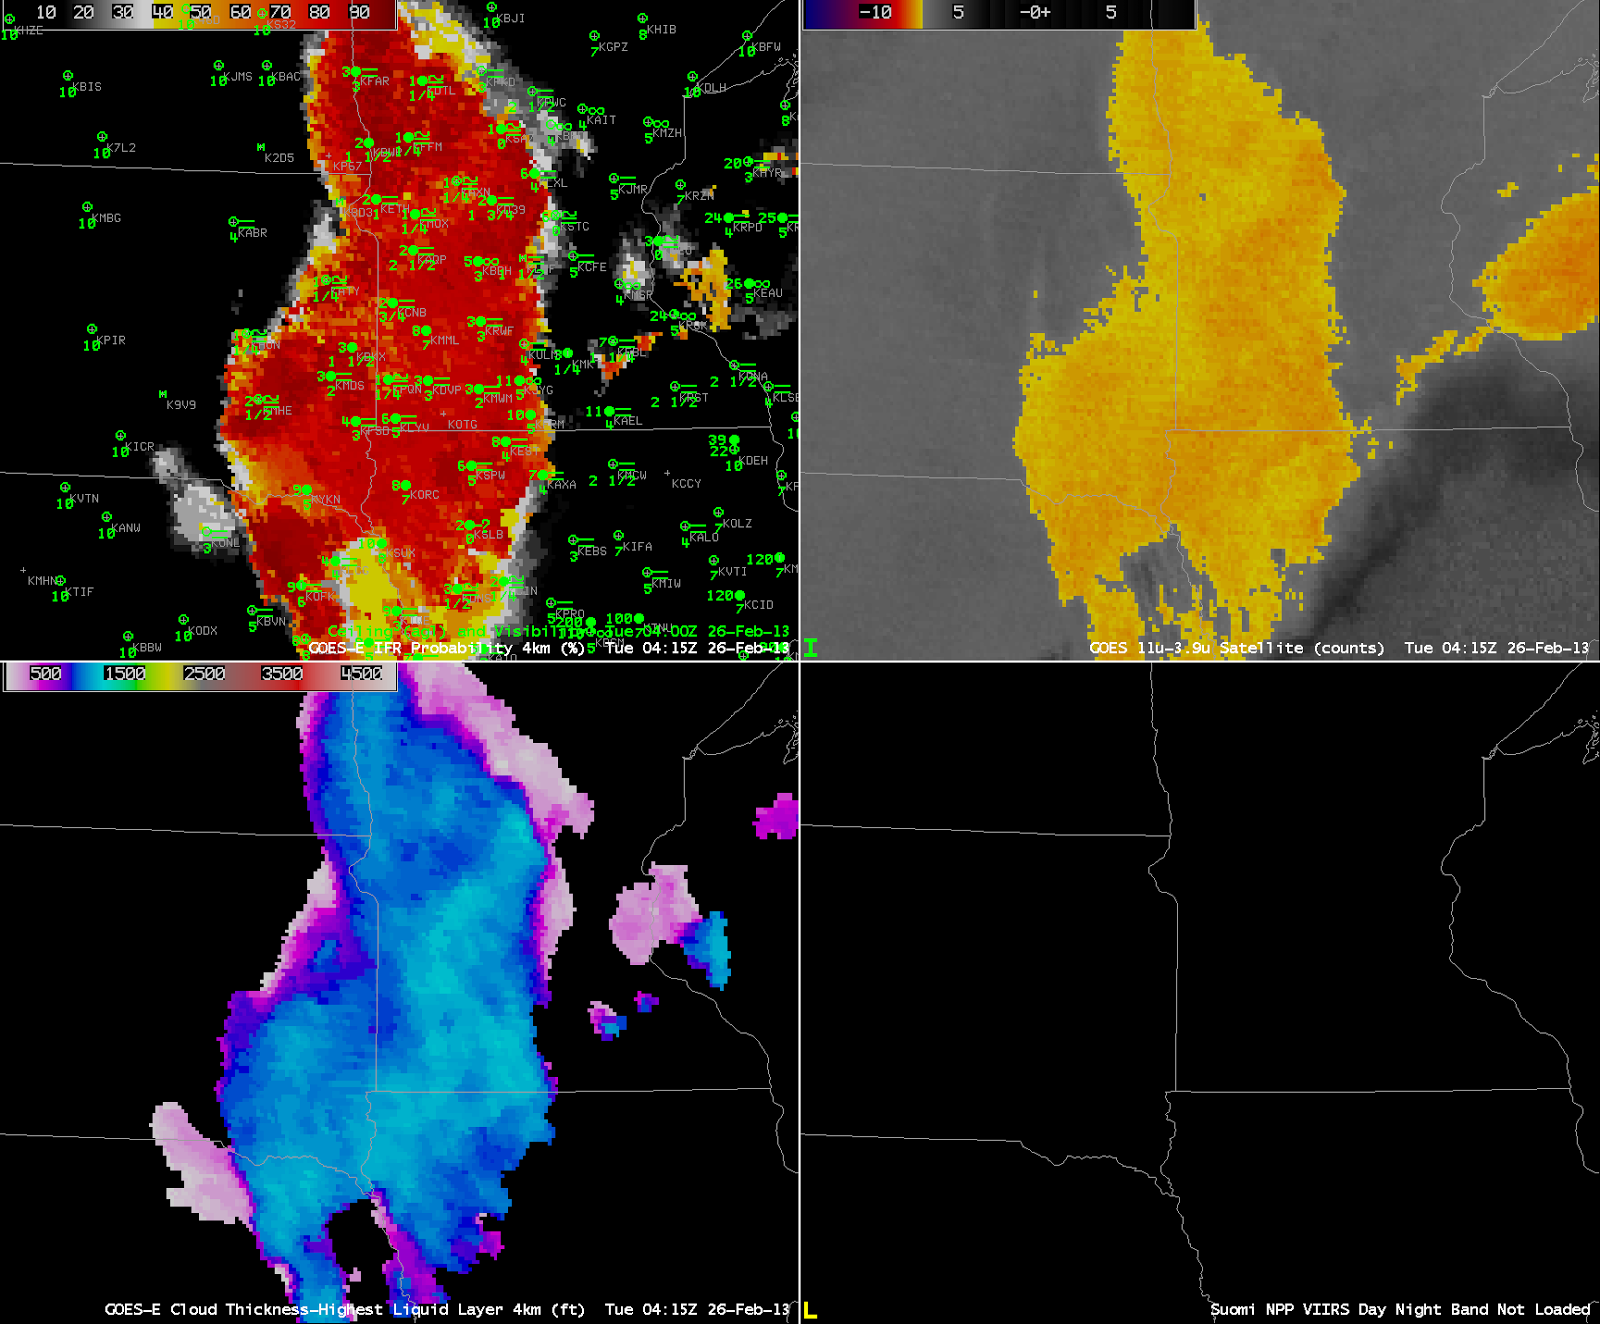
 Note that a mention of LIFR conditions has appeared in the Aviation Discussion.  What did the GOES-R IFR Probability show between 0000 and 0600 UTC?
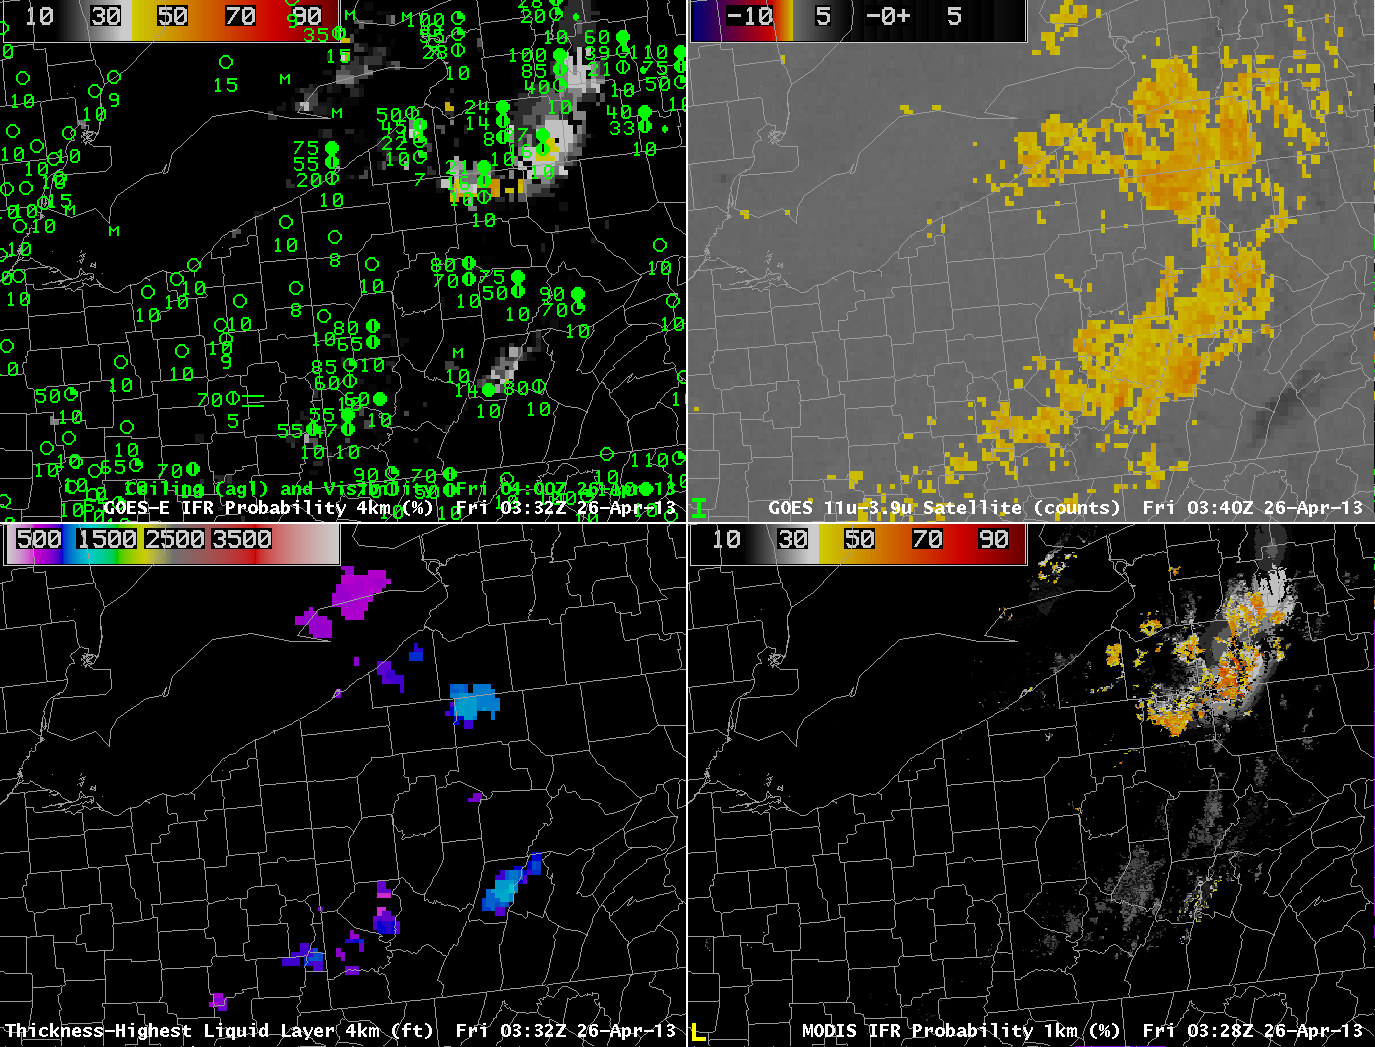
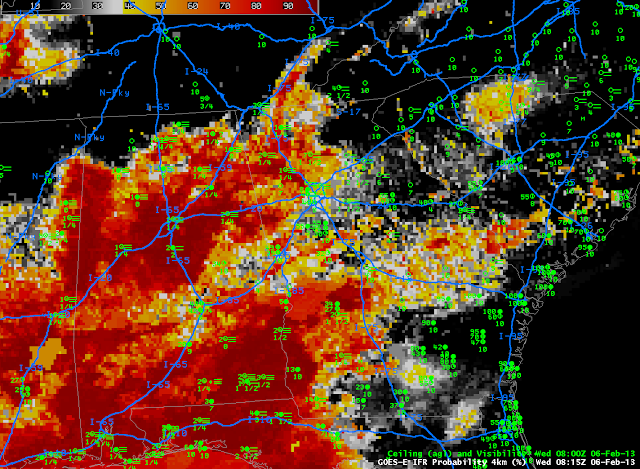
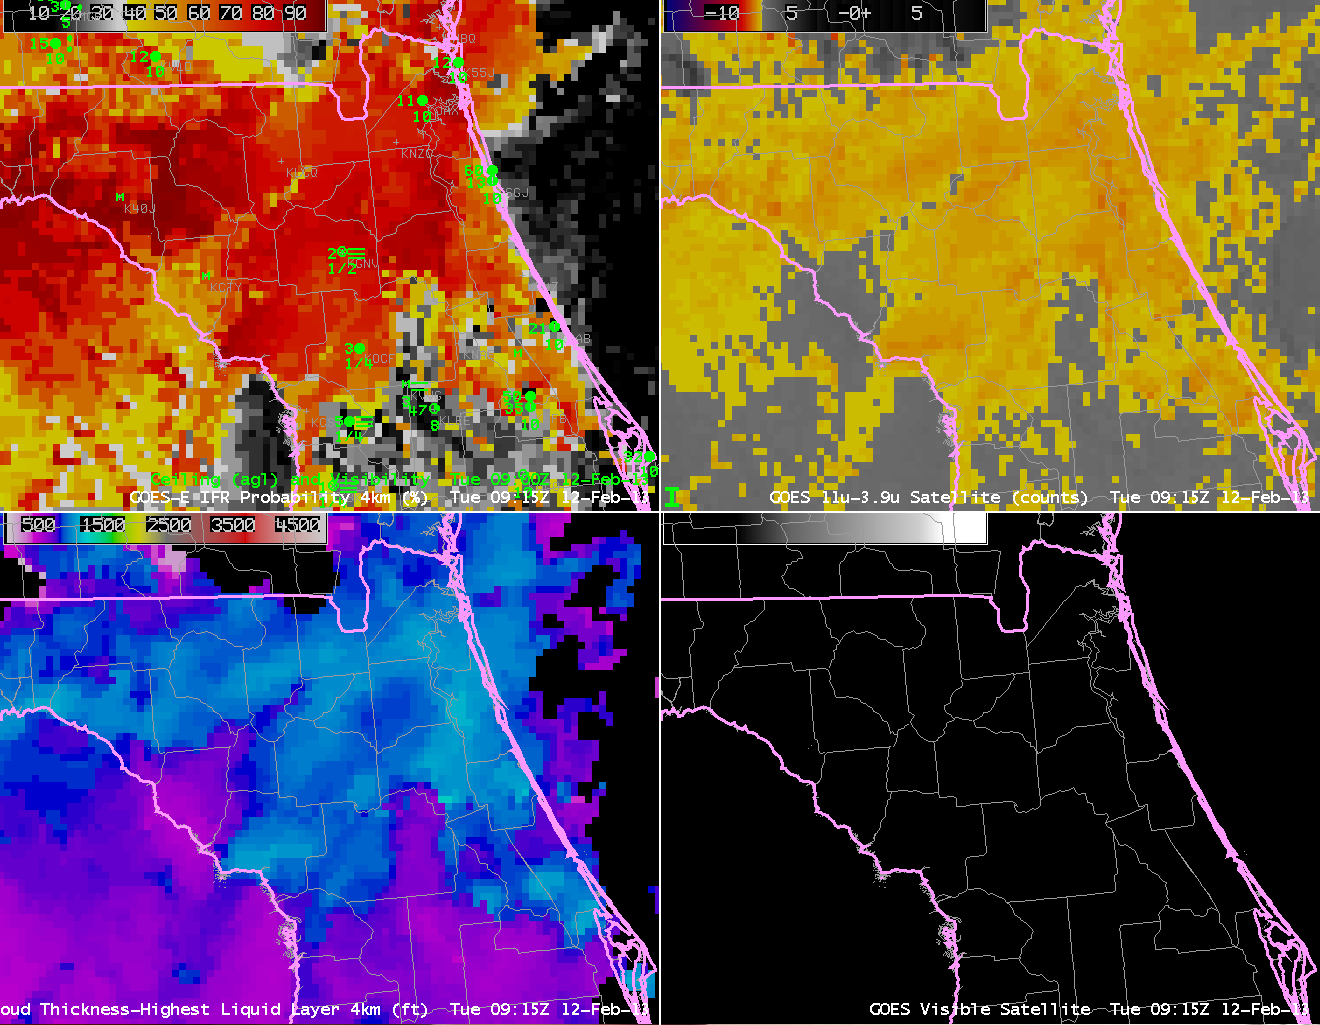
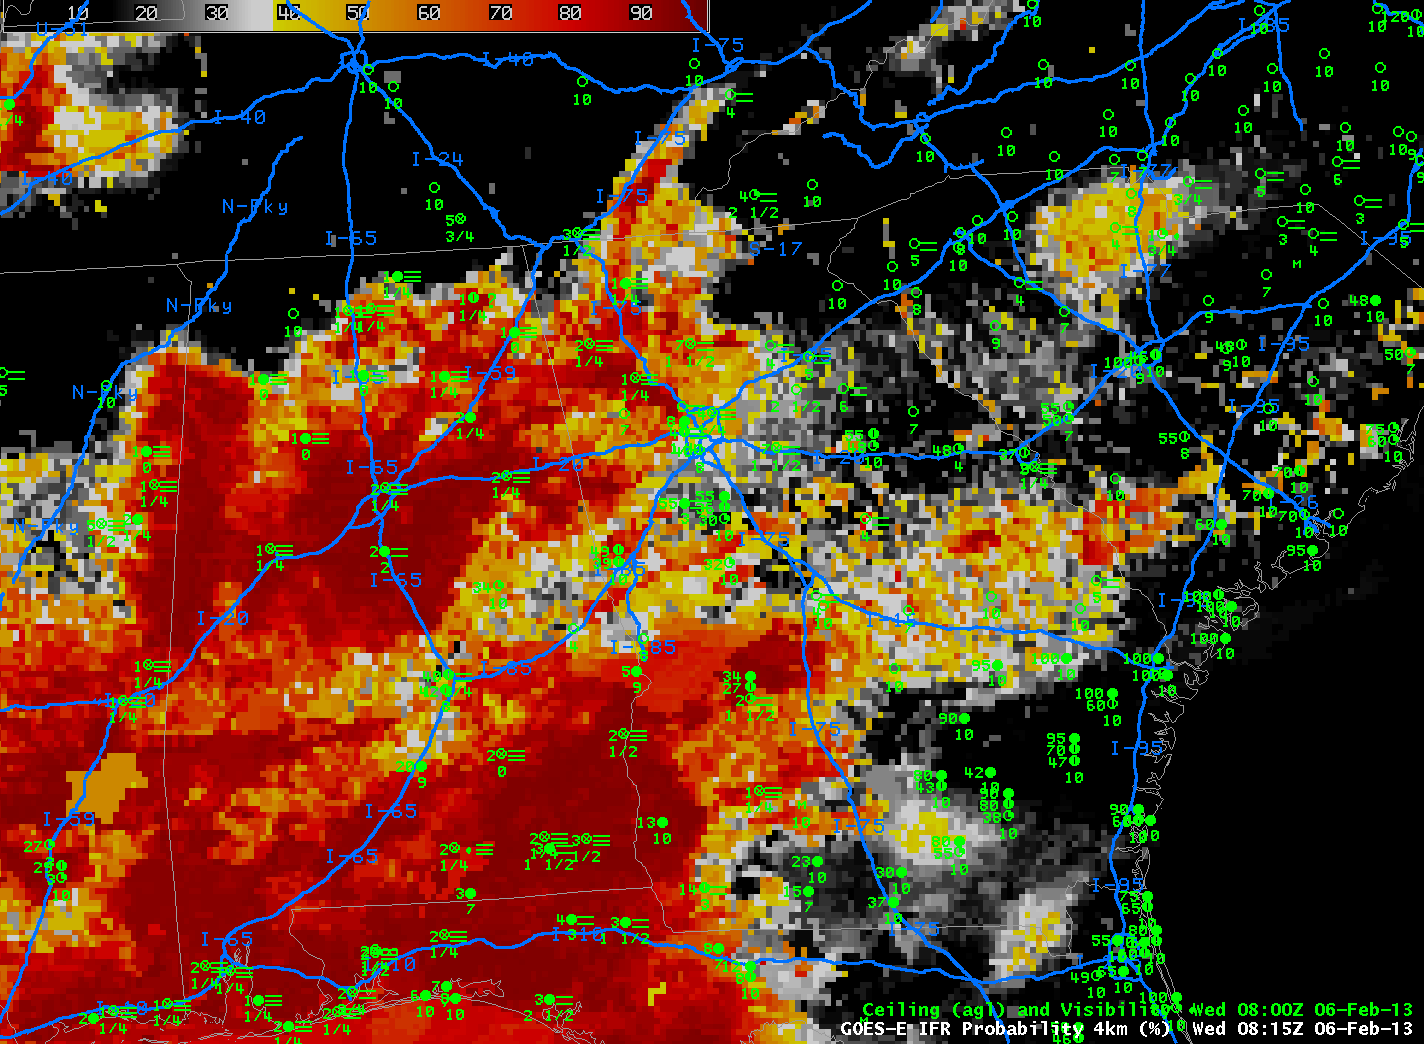
GOES-R IFR Probabilities computed from GOES-East and Rapid Refresh Data, 0115 through 0515 UTC 6 February, along with hourly observations of ceilings/visibility
Especially in the last two hours — 0415 and 0515 UTC — there is a general expansion in high probabilities from west to east across southern Georgia, with probabilities increasing north of I-16.  By 0815 UTC, below, IFR conditions are being reported at many locations in northwest Georgia, and IFR probabilities continue to increase over east-central Georgia.
As in the loop above, but for 0815 UTC only.  Interstate Highways are denoted in Blue.
The AFD issued at 0930 coincided with the issuance of a dense fog advisory (highlighted in red) for most of the CWA:

000
FXUS62 KFFC 060930
AFDFFC

AREA FORECAST DISCUSSION
NATIONAL WEATHER SERVICE PEACHTREE CITY GA
430 AM EST WED FEB 6 2013

.SHORT TERM /TODAY THROUGH THURSDAY NIGHT/...
SOME LOW LEVEL MOISTURE REMAINING THIS MORNING AND THIS HAS PRODUCED
FOG ACROSS MANY AREAS. WILL GO AHEAD AND ISSUE A DENSE FOG ADVISORY
SINCE MOST PLACES SEEM TO BE HEADED FOR VERY LOW
VISIBILITY.
OTHERWISE DRY HIGH PRESSURE BUILDING OVER THE SOUTHEAST TODAY AND
MOVING OFF THE ATLANTIC COAST TONIGHT. NEXT SHORT WAVE COMING ACROSS
THE NORTHERN GULF SHOULD BEGIN TO AFFECT OUR CWA MAINLY 06Z THURSDAY
AND BEYOND. THIS SOUTHERN STREAM SYSTEM MOVES ACROSS THE STATE
THURSDAY AND THURSDAY NIGHT WITH SOME DIFFERENCES BETWEEN MODELS
WITH LOCATION AND STRENGTH OF SURFACE LOW. IN GENERAL...LOOKS LIKE A
WEDGE SETTING UP LATE TONIGHT INTO THURSDAY WITH MUCH OF THE CWA IN
EASTERLY FLOW. THERE SHOULD BE A SHARP GRADIENT OF TEMPERATURES
BETWEEN NORTH AND CENTRAL ZONES AND FOR NOW HAVE KEPT THE WARMER AIR
ON THURSDAY CONFINED TO COLUMBUS TO MACON AND SOUTH. CATEGORICAL
POPS FOR THURSDAY TAPERING OFF WEST TO EAST THURSDAY NIGHT AS THE
SURFACE LOW MOVES EAST. NO MENTION OF THUNDER AS WEDGE SHOULD BE
STABLE. HOWEVER SOME INSTABILITY COULD PUSH INTO THE CENTRAL ZONES
THURSDAY AFTERNOON ALONG THE BOUNDARY.

41


.LONG TERM /FRIDAY THROUGH TUESDAY/... 
[...snipped...] 
01

&&

.AVIATION...
06Z TAF DISCUSSION.
PATCHY CEILINGS BKN030-040 LINGERING THROUGH THE NIGHT. POTENTIAL
FOR LIFR CONDITIONS WHERE SKIES ARE CLEAR...BUT EXPECT ALL TAF
SITES TO HAVE AT LEAST MVFR CONDITIONS 08Z THROUGH 14Z. IMPROVING
AFTER THAT TO VFR. WINDS NORTHWEST 5 TO 10KT AFTER 15Z.

//ATL CONFIDENCE...06Z UPDATE...
MEDIUM CONFIDENCE ON ALL ELEMENTS.

41

&&

.PRELIMINARY POINT TEMPS/POPS... 
[...snipped...]
 &&

.FFC WATCHES/WARNINGS/ADVISORIES...
DENSE FOG ADVISORY UNTIL 9 AM EST THIS MORNING FOR THE FOLLOWING
ZONES
: BALDWIN...BANKS...BARROW...BARTOW...BIBB...BLECKLEY...
BUTTS...CARROLL...CATOOSA...CHATTAHOOCHEE...CHATTOOGA...
CHEROKEE...CLARKE...CLAYTON...COBB...COWETA...CRAWFORD...CRISP...
DADE...DAWSON...DEKALB...DODGE...DOOLY...DOUGLAS...EMANUEL...
FANNIN...FAYETTE...FLOYD...FORSYTH...GILMER...GLASCOCK...
GORDON...GREENE...GWINNETT...HALL...HANCOCK...HARALSON...
HARRIS...HEARD...HENRY...HOUSTON...JACKSON...JASPER...
JEFFERSON...JOHNSON...JONES...LAMAR...LAURENS...LUMPKIN...
MACON...MADISON...MARION...MERIWETHER...MONROE...MONTGOMERY...
MORGAN...MURRAY...MUSCOGEE...NEWTON...NORTH FULTON...OCONEE...
OGLETHORPE...PAULDING...PEACH...PICKENS...PIKE...POLK...
PULASKI...PUTNAM...ROCKDALE...SCHLEY...SOUTH FULTON...SPALDING...
STEWART...SUMTER...TALBOT...TALIAFERRO...TAYLOR...TELFAIR...
TOOMBS...TOWNS...TREUTLEN...TROUP...TWIGGS...UNION...UPSON...
WALKER...WALTON...WARREN...WASHINGTON...WEBSTER...WHEELER...
WHITE...WHITFIELD...WILCOX...WILKES...WILKINSON.

&&

$$

SHORT TERM...41
LONG TERM....01
AVIATION...41

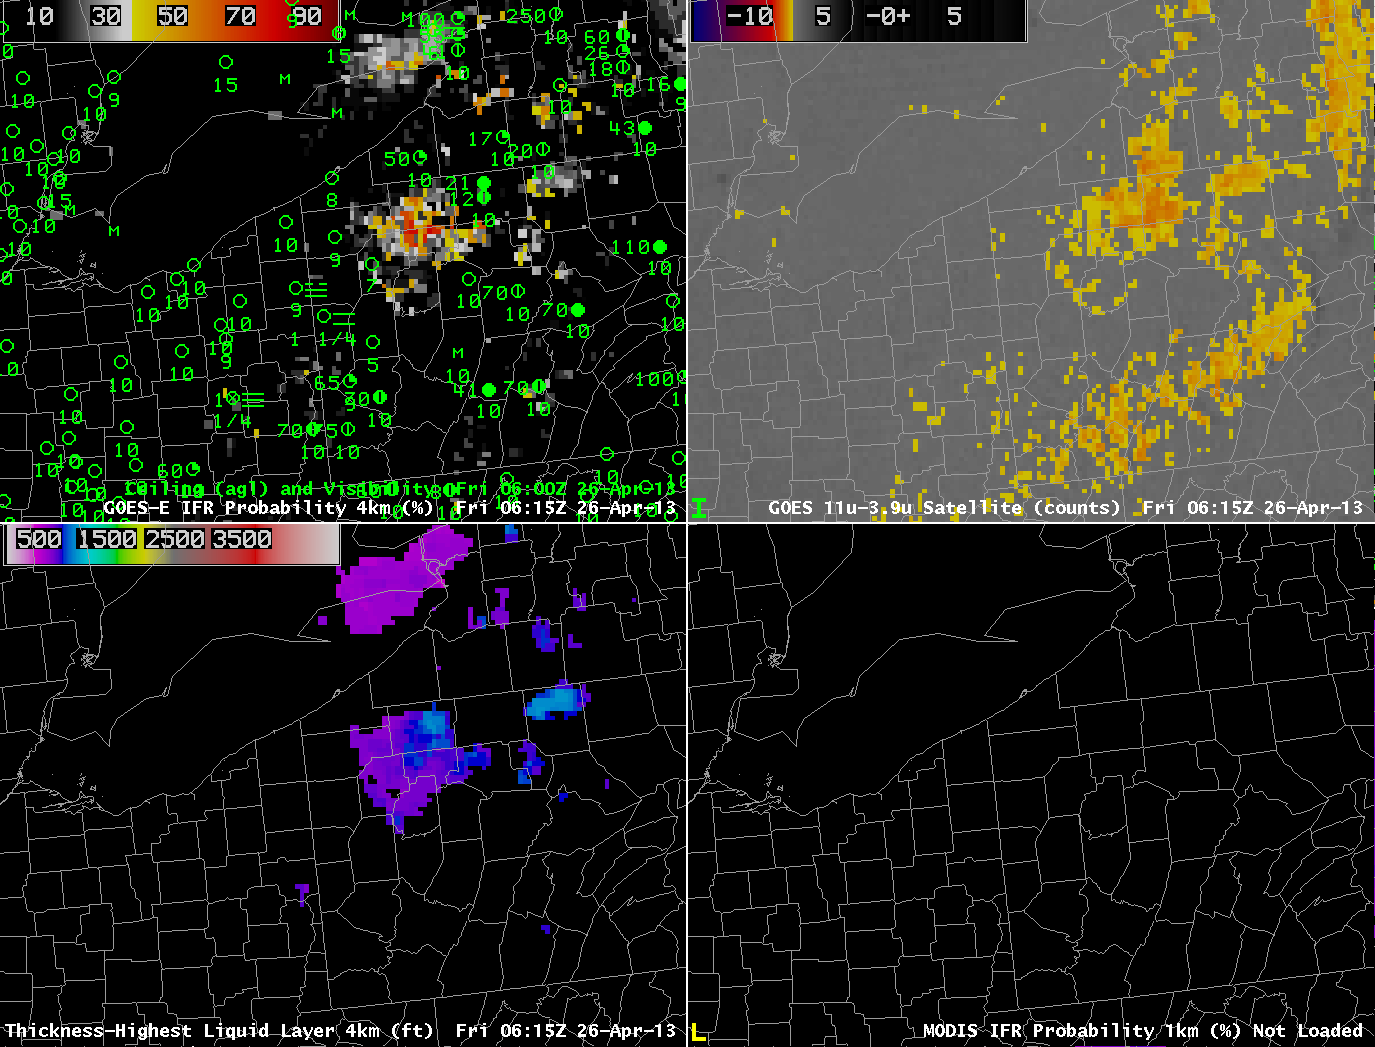
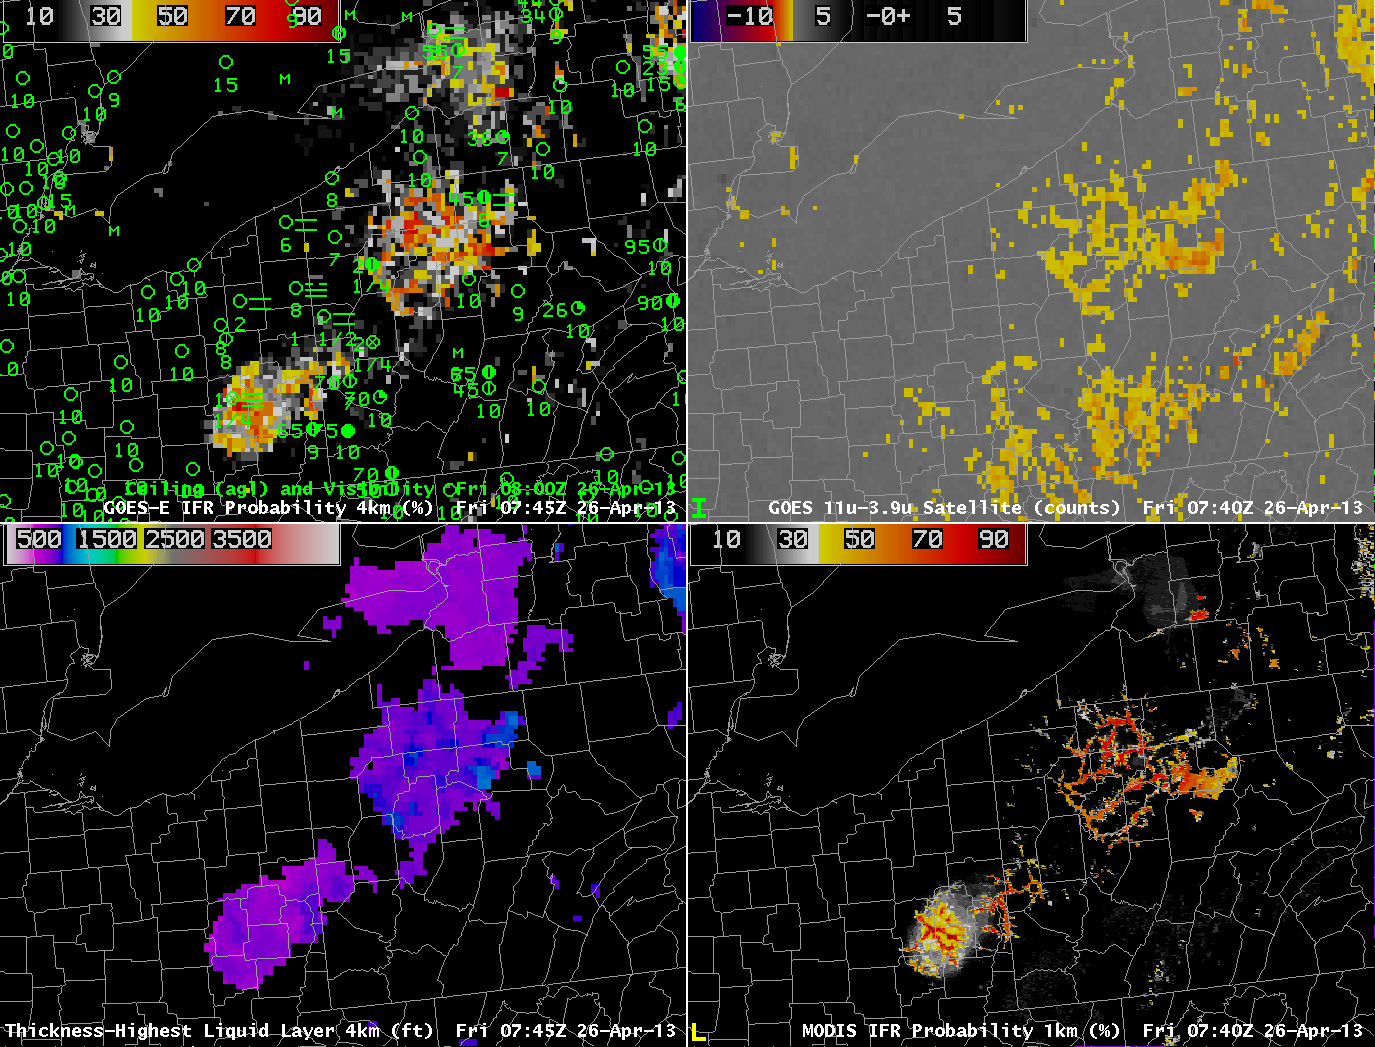
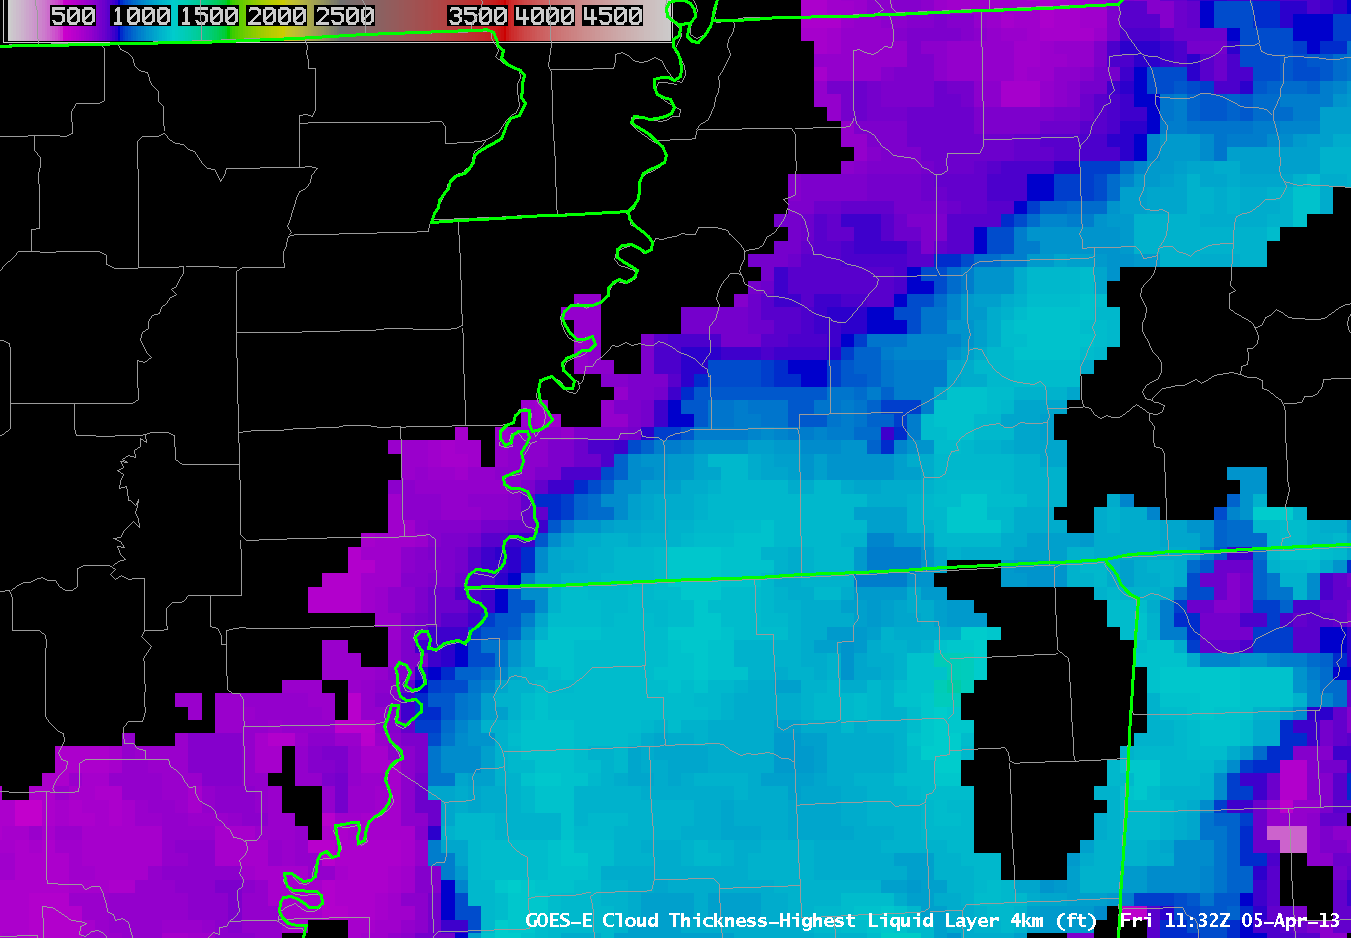
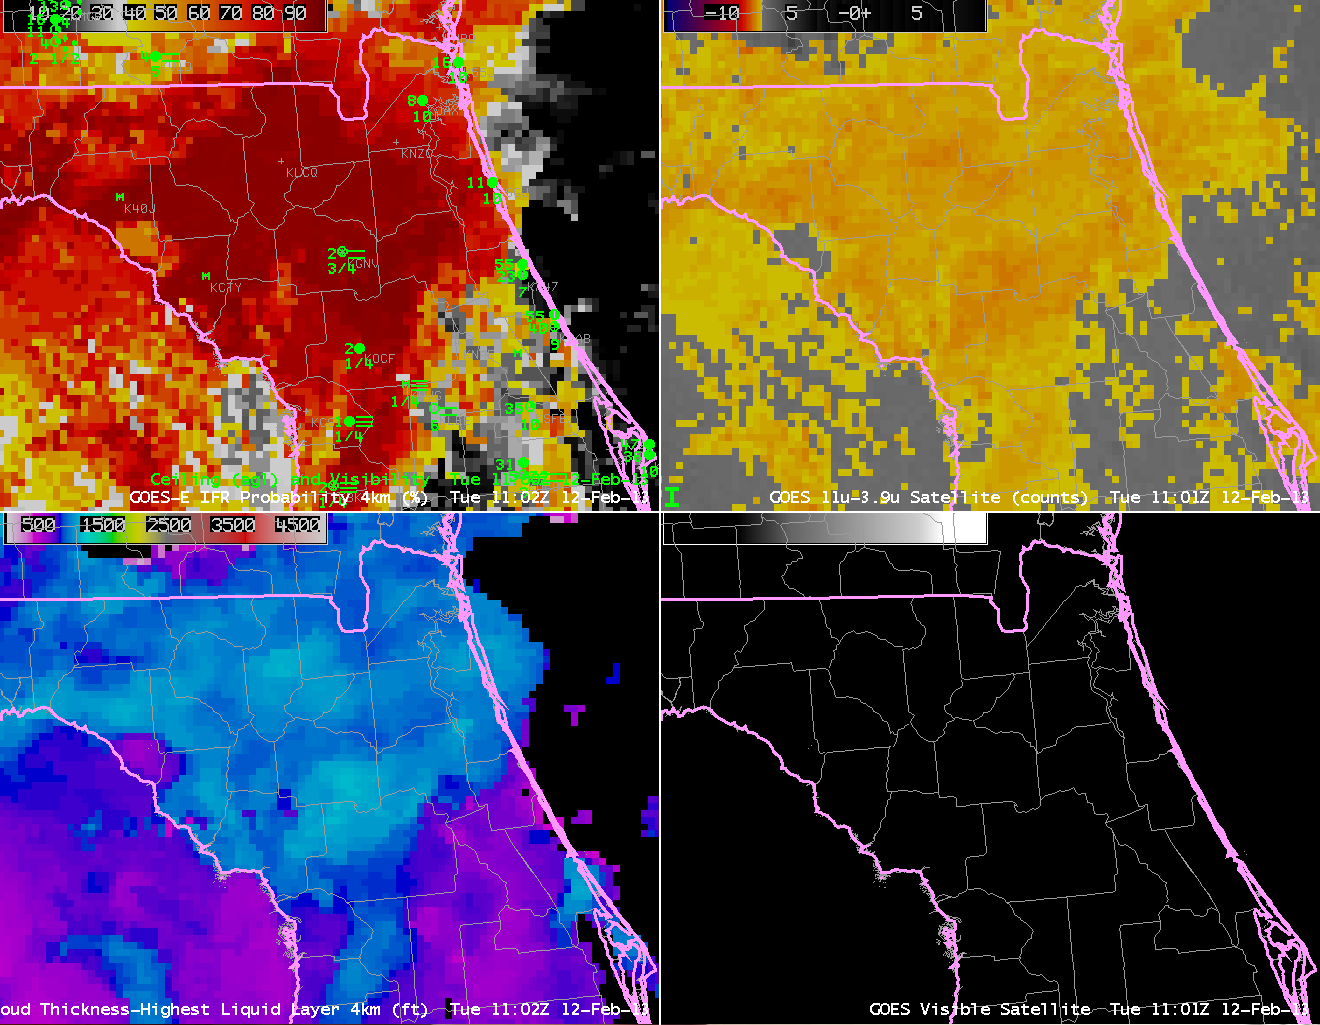
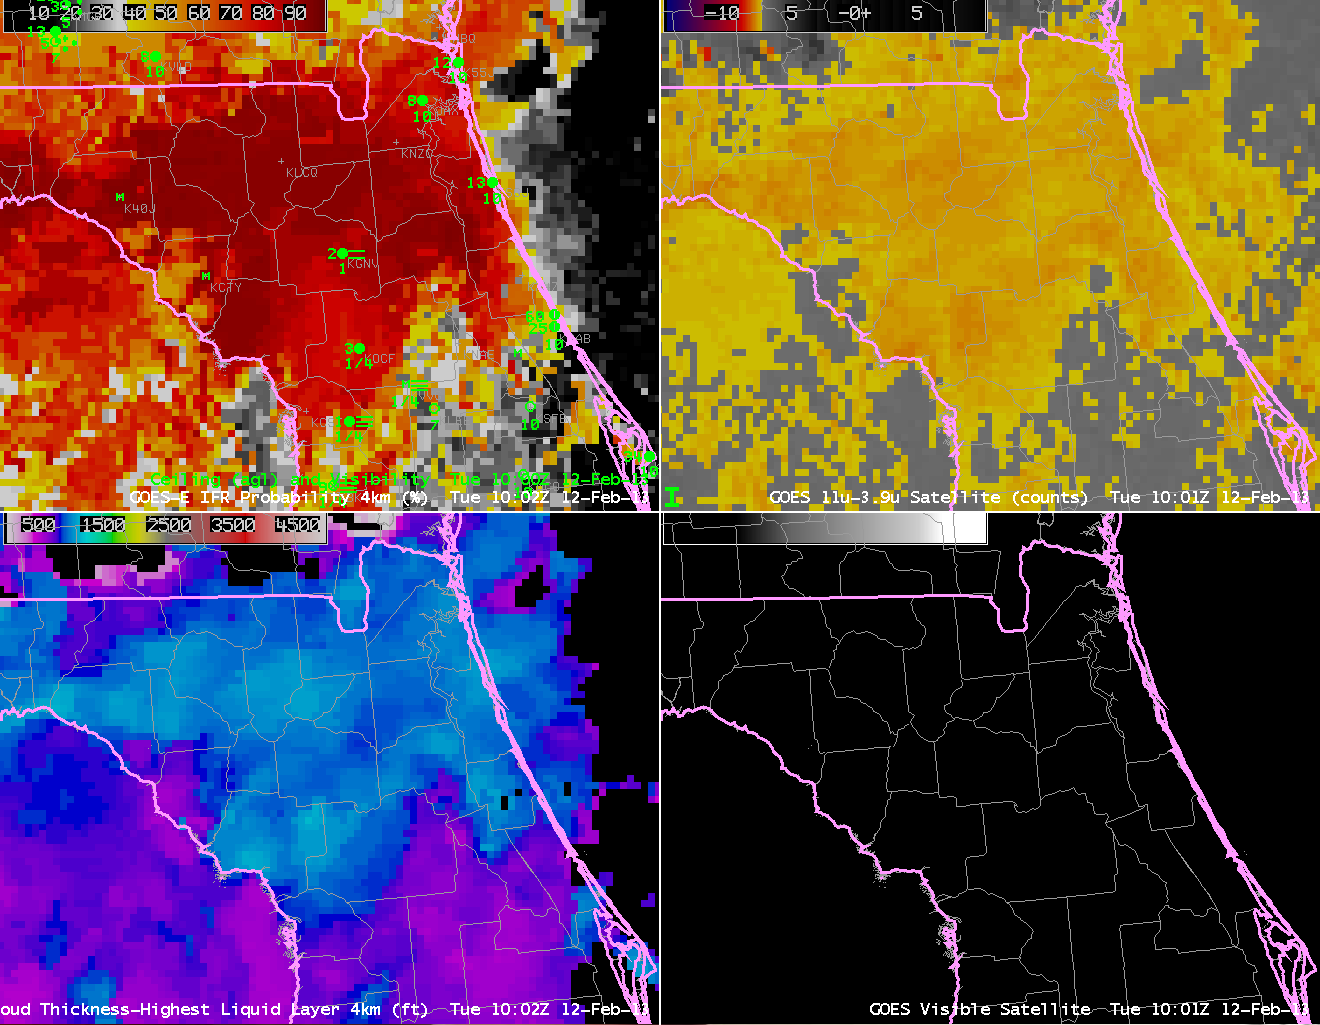
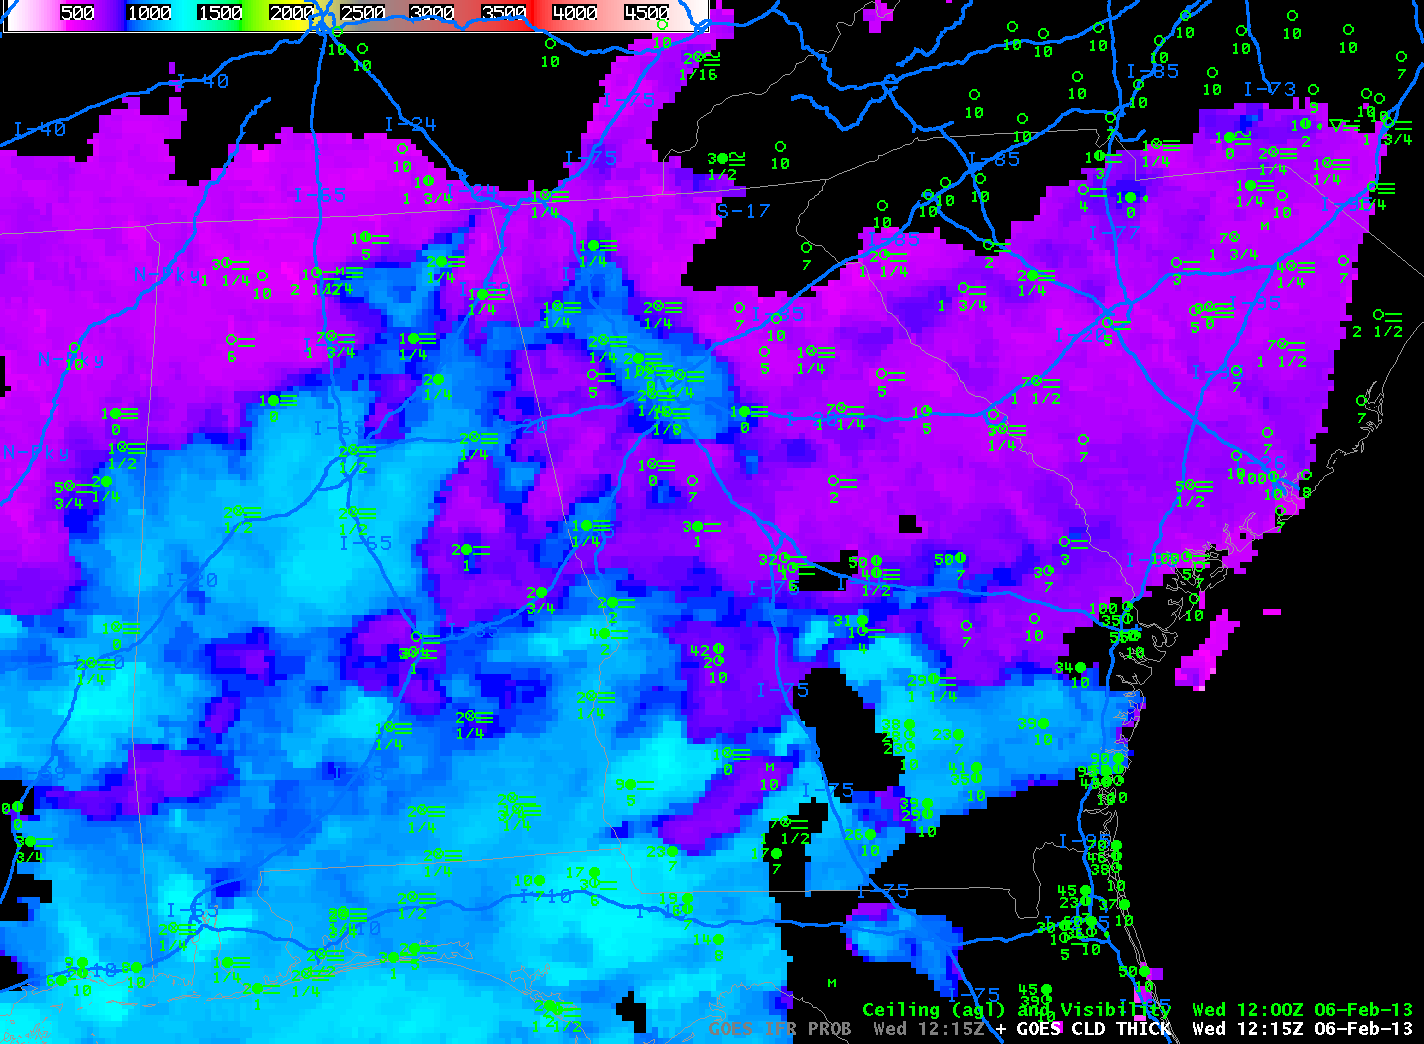
The animation from 0815 UTC through 1315 UTC shows a continued increase in the probabilities over the crash site on I-16.  In addition, observations decrease to IFR conditions.  Note that at 1315 UTC the switch between nighttime and daytime predictors is present in the image as a southwest to northeast boundary over extreme eastern Georgia.  Probabilities are high over the crash site, but by 1415 UTC, they have all but vanished as the fog quickly dissipated at sunrise.  This suggests a fog that is not thick, and the GOES-R Cloud Thickness corroborates this assumption (see below)

As in the loop above, but from 0815 UTC through 1315 UTC.  Crash occurred at 1310 UTC
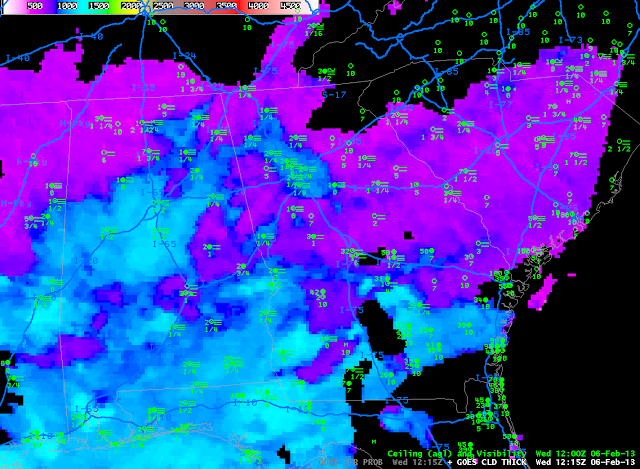
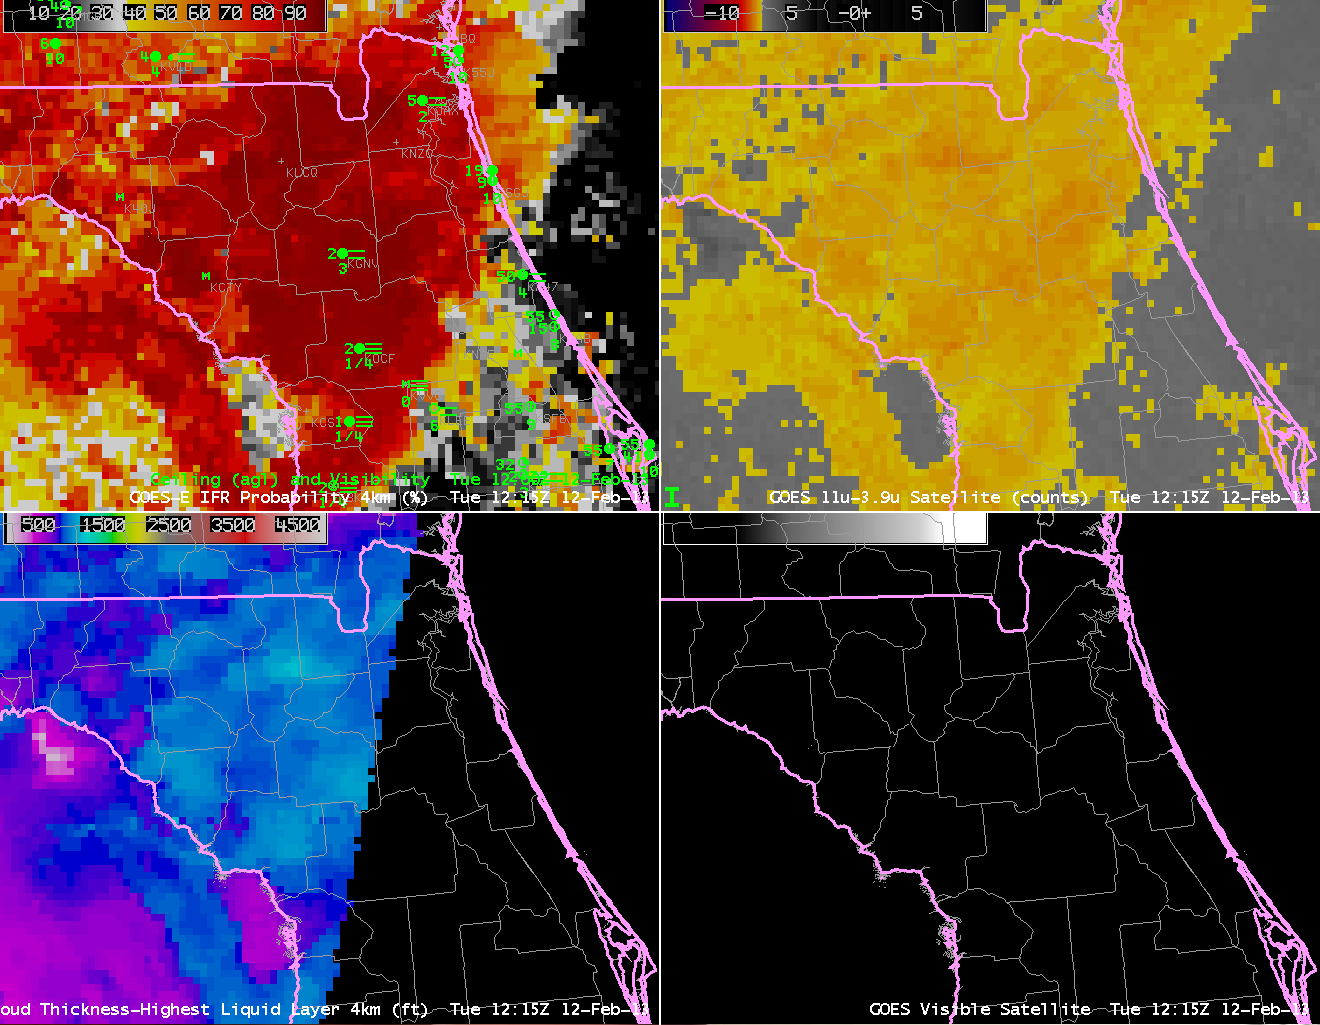
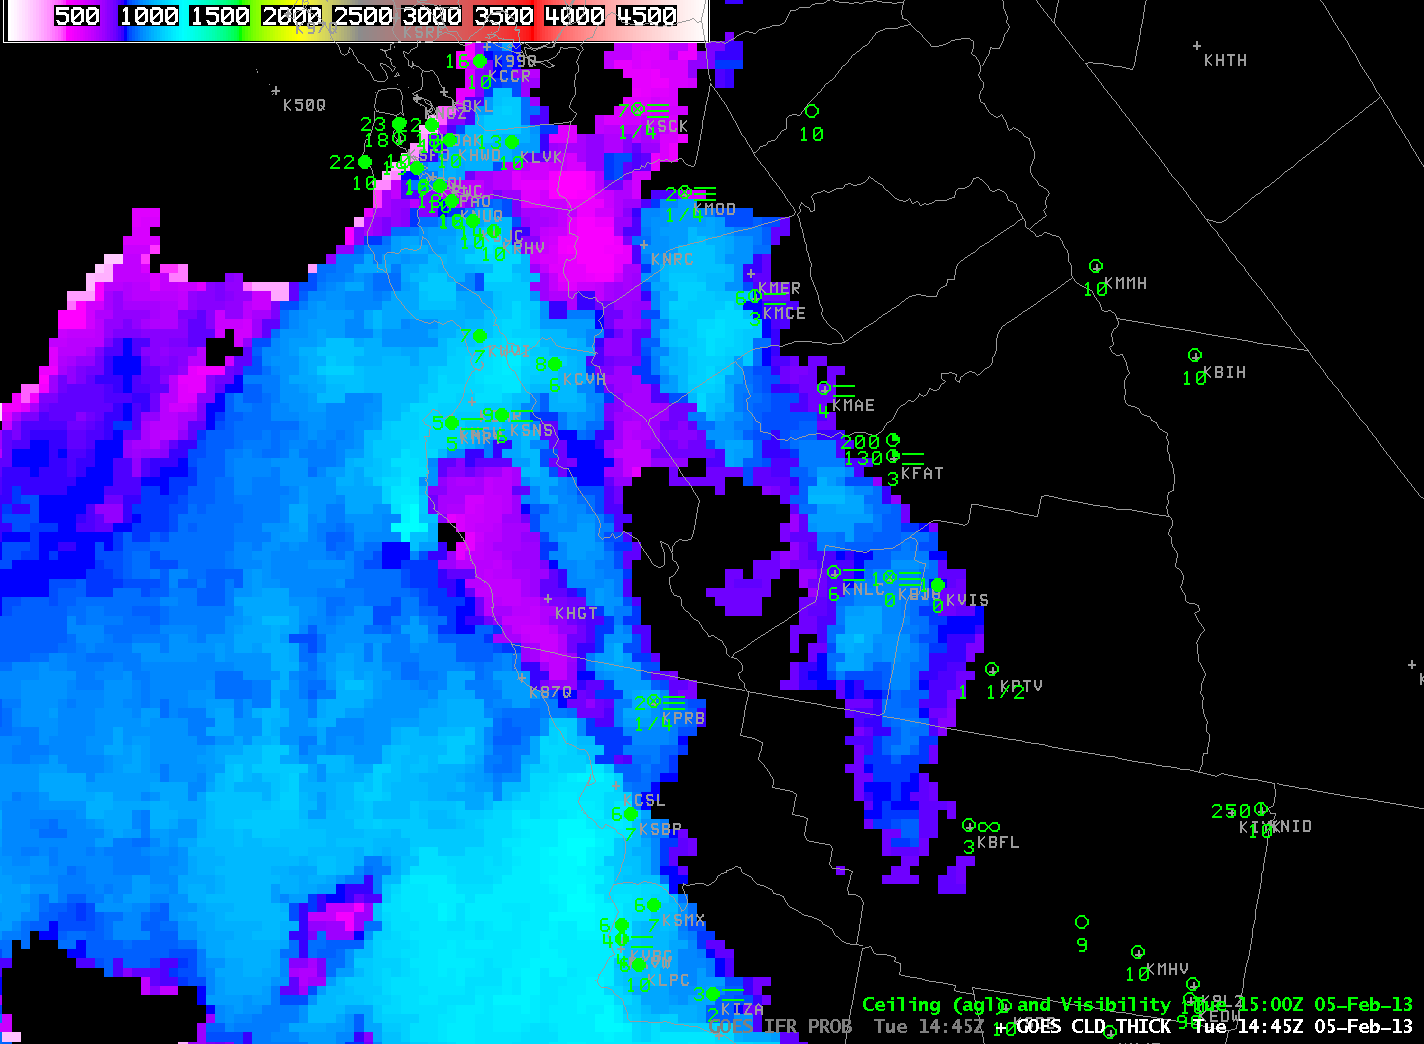
GOES-R Cloud Thickess just before Twilight Conditions, 1215 UTC 6 February.  Values near the Crash Site are 600-700 feet.
The Cloud Thickness field, above, at 1215 UTC, just before twilight conditions, shows values around 600 to 700 feet.  This chart suggests a rapid dissipation time of around 1 hour.  Indeed, visible imagery around  sunrise shows scant evidence of widespread fog.
Zoomed-in GOES-13 Visible Imagery over east-central Georgia, times as indicated.  Montrose (Yellow square) is indicated within Laurens County (outlined in green)
Polar orbiters also provide information — at higher spatial resolution — about the evolving situation overnight.  Suomi/NPP made two passes over Georgia between 0600 and 0900 UTC, and the brightness temperature difference product that was produced is shown below.    There is a noticeable increase in water clouds over Georgia between 0632 UTC and 0811 UTC, the times of the images.

Suomi-NPP Brigthness Temperature Difference (10.80 µm- 3.74 µm) at 0632 UTC and 0811 UTC.  Interstate 16 crosses Laurens County near the center of these images.

MODIS data from Aqua were used to produce IFR probabilities at 0645 UTC, below.  This was before the most fog had developed, but it does confirm the picture painted with GOES data’s broader brush:  IFR probabilities are increasing over Georgia.

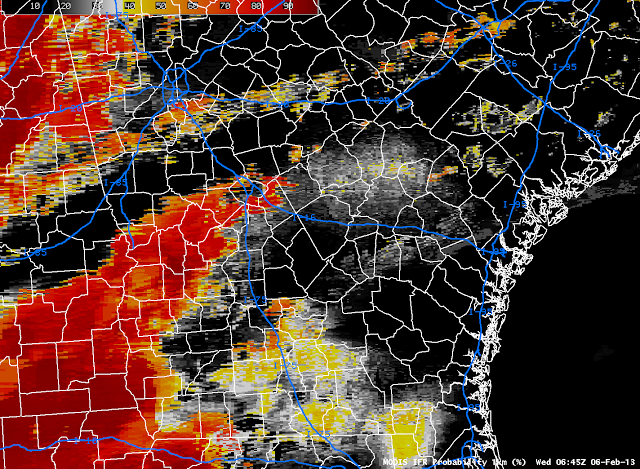
MODIS-based GOES-R IFR Probabilities over Georgia, 0645 UTC on 6 February 2013.

Finally, AVHRR data from NOAA-15 from 1015 UTC show widespread stratus extending eastnortheast from southwest Georgia to central Georgia.

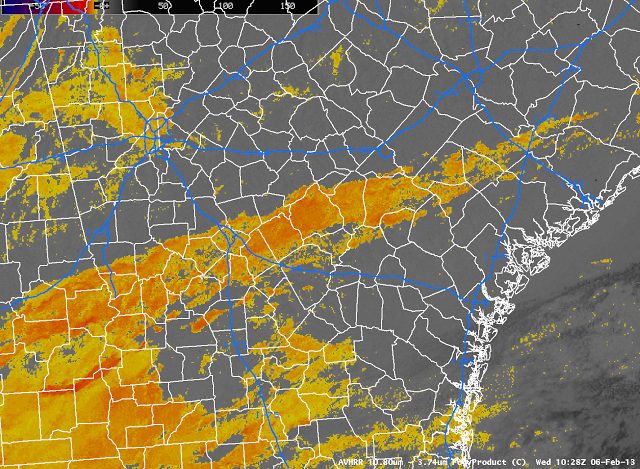
Brightness Temperature Difference (10.8 µm – 3.74 µm) from AVHRR data, 1028 UTC 6 Feb 2013

Fog Dissipation Example over California

GOES-R Cloud Thickness over California, 1445 UTC on 5 Feb 2013

GOES-R Cloud Thickness can be used to esimate when radiation fog will dissipate.   In this example from central California, radiation fog has developed to a depth of around 1000 feet near Hanford, 1000 feet just southwest of Fresno, and 1100 feet near Merced.  This chart shows the relationship between Cloud Thickness and burn-off time.  1000 feet correlates well with a 3-hour burn-off time;  1100 feet correlates well with a 4-hour burnoff time.  The animation below, with imagery at 1800, 1830, 1900 and 1930 UTC shows that the fog around Hanford was slow to burn off — by about an hour.  Fog near Merced was also slow to burn off, but high clouds moving in may have been responsible for that delay.

GOES-15 Visible Imagery over Central California.  Times as indicated.