Category Archives: California

Fog vs. Stratus over southern California

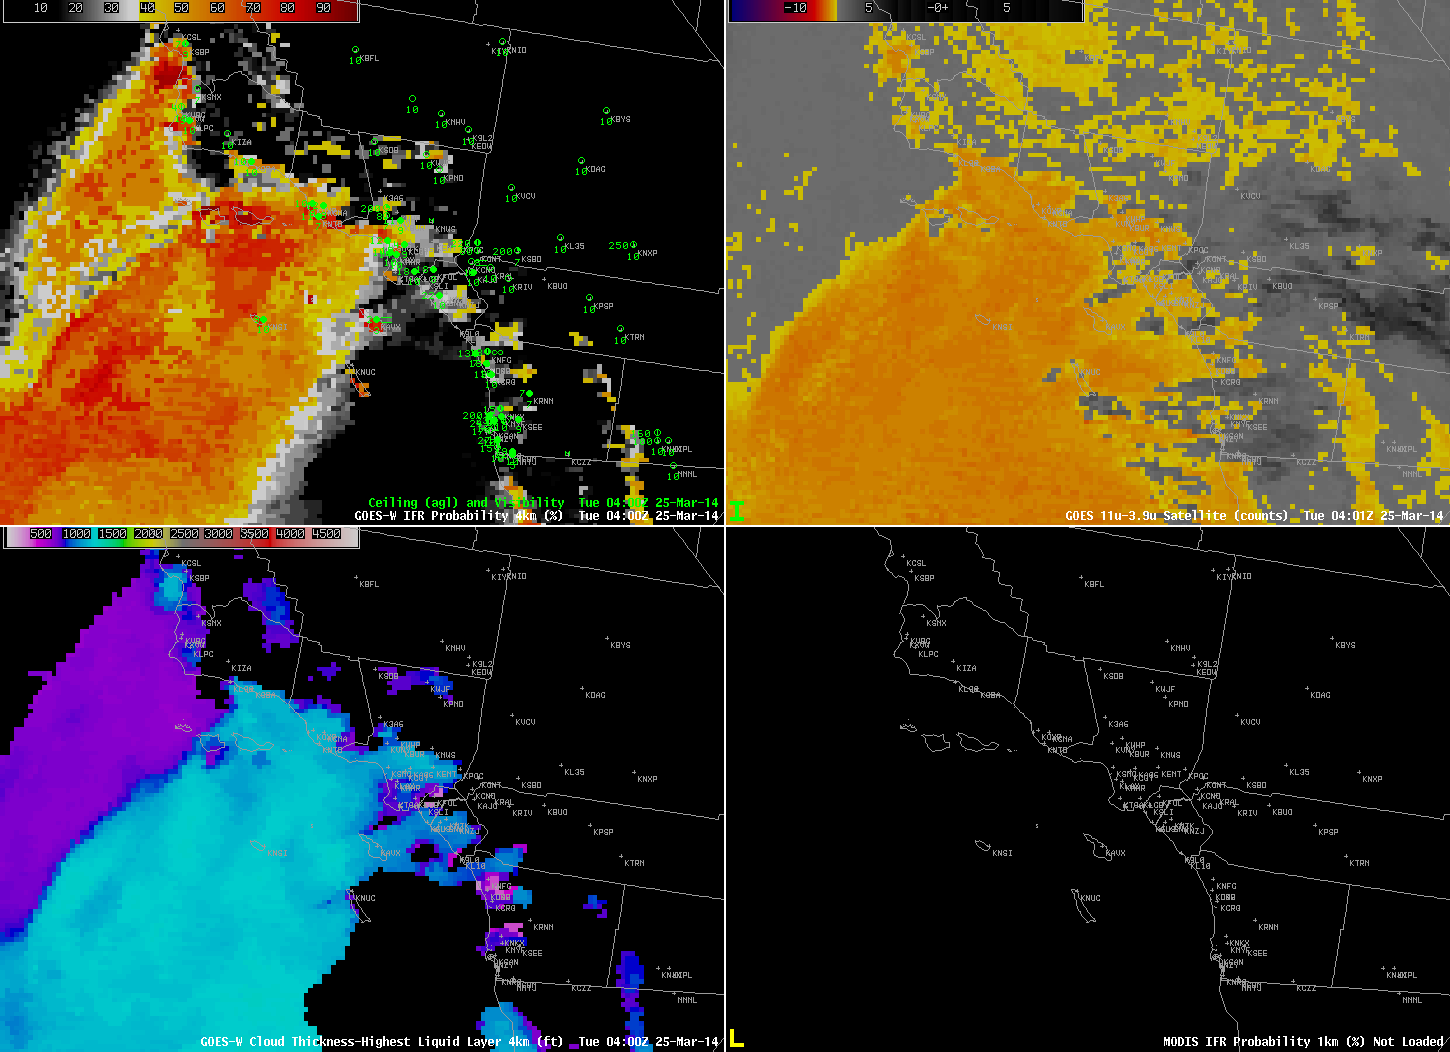
Brightness temperature difference fields over the Pacific Ocean offshore of southern California showed a solid field of clouds overnight. How can this information about the top of the cloud be used to predict where low clouds and fog (IFR conditions) might exist? If you blend the satellite predictors with predictors from the Rapid Refresh model, you have information about the presence of clouds (the satellite predictors) and about the likelihood of saturation in the lowest kilometer of the model atmosphere. Consider the example below from 0400 UTC on 25 March 2014.

GOES_IFR_PROB_20140325_0400

GOES-R IFR Probabilities computed from GOES-15 (Upper Left), GOES-West Brightness Temperature Differences (10.7 µm – 3.9 µm) (Upper Right), GOES-R Cloud Thickness (Lower Left), GOES-R IFR Probabilities computed from MODIS (Lower Right), all near 0400 UTC on 25 March 2014 (click to enlarge)

Brightness temperature differences suggest a deck of stratus over most of the Gulf of Santa Catalina (and over the Channel Islands as well). The IFR Probability field, however, suggests that the stratus just offshore of southern California, between the mainland and the Islands, is not reducing surface visibilities, and IFR conditions do not exist right along the coast of the mainland. The station reporting IFR conditions, KAVX, Catalina Airport on Catalina Island, is 1600′ above sea level.

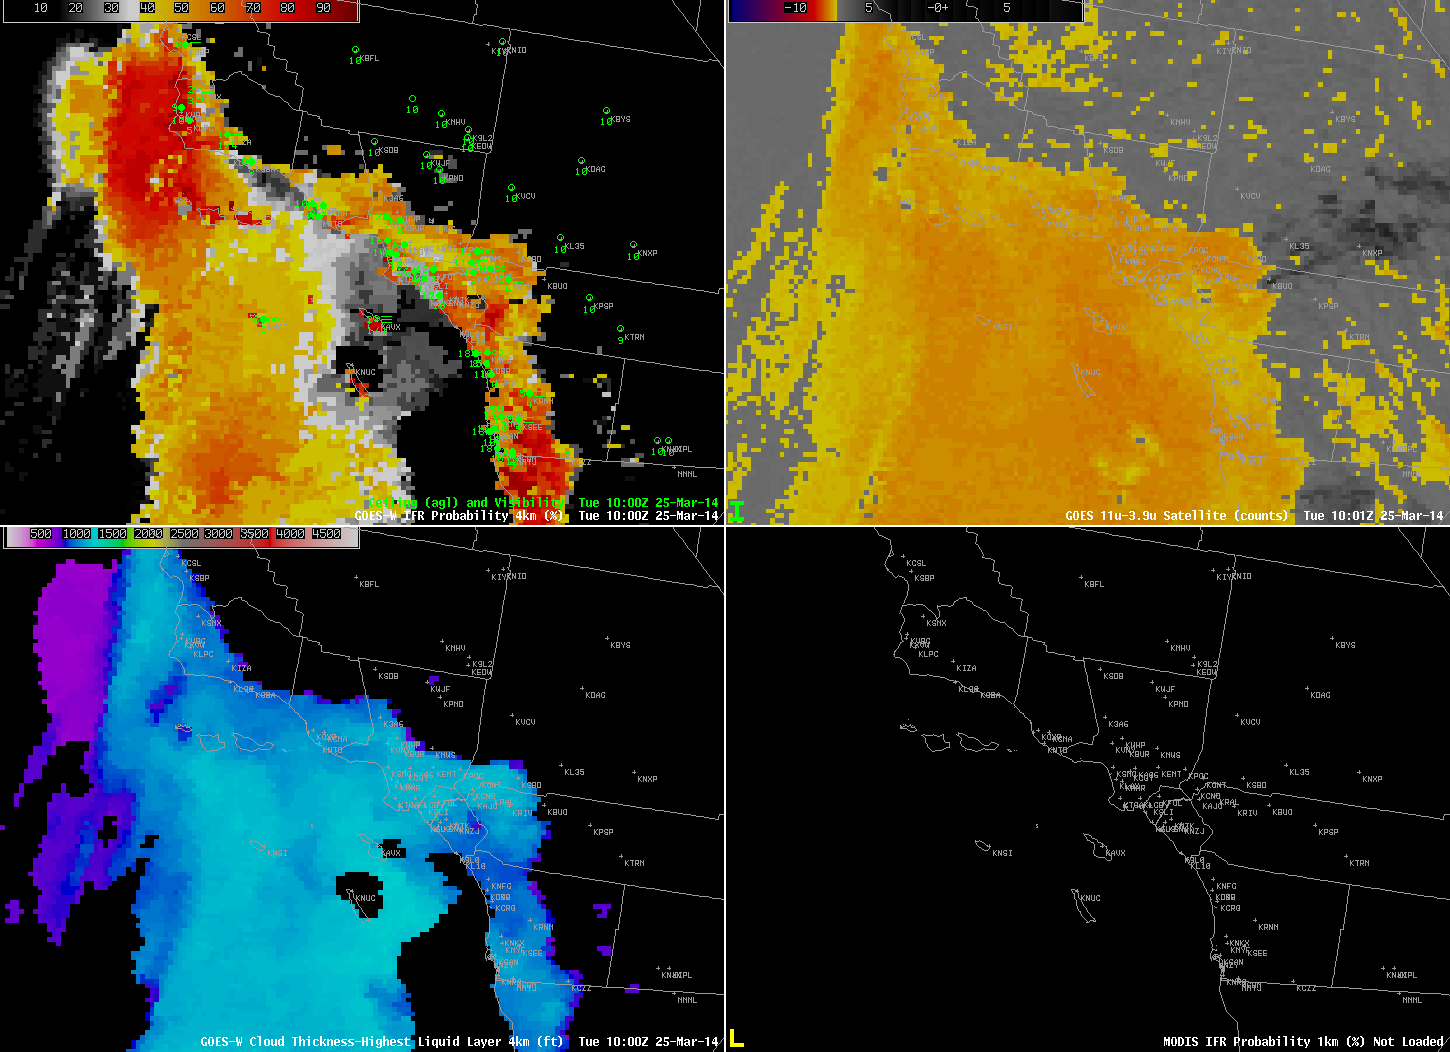
By 1000 UTC, below, visibilities have lowered (and IFR Probabilities have increased) near Vandenberg AFB north of Point Conception. IFR conditions persist over Catalina Island (demonstrating the importance of knowing the elevation of the stations!).

GOES_IFR_PROB_20140325_1000

As above, but at 1000 UTC on 25 March 2014 (click to enlarge)

Low clouds and Fog along the West Coast

Low clouds and fog developed along the west coast this morning. From the Monterey (CA) AFD:

FXUS66 KMTR 141143
AFDMTR

AREA FORECAST DISCUSSION
NATIONAL WEATHER SERVICE SAN FRANCISCO BAY AREA
443 AM PDT FRI MAR 14 2014

.SYNOPSIS…AFTER A BIT OF COOLING TODAY…A WARM AND DRY UPPER LEVEL
RIDGE OF HIGH PRESSURE WILL BUILD STRONGLY INTO THE WEST COAST
OVER THE WEEKEND. THIS WILL RESULT IN AFTERNOON TEMPERATURES
REACHING WELL ABOVE SEASONAL NORMS…AND POSSIBLY TO NEAR RECORD
LEVELS FOR THESE DATES. THIS WARM-UP WILL BE SHORT-LIVED HOWEVER…WITH
INCREASED ONSHORE FLOW AND A SIGNIFICANTLY COOLER AIR MASS MOVING
IN ALOFT THE FIRST PART OF NEXT WEEK. DRY CONDITIONS ARE EXPECTED
TO CONTINUE THROUGH MID WEEK…BUT THEN WITH UPPER LEVEL TROUGHING
AND A CHANCE OF RAIN FOR THE OUTER PORTION OF THE FORECAST PERIOD.

&&

.DISCUSSION…AS OF 4:10 AM PDT FRIDAY…THE DRY TAIL END OF A
WEATHER SYSTEM MOVING IN TO THE PACIFIC NORTHWEST IS APPROACHING
OUR DISTRICT…AND RESULTING IN ENHANCEMENT OF THE MARINE LAYER
AND A RETURN OF THE MARINE STRATUS. LATEST GOES FOG PRODUCT
IMAGERY…AND IN RATHER SPECTACULAR DETAIL JUST REC’D SUOMI VIIRS
NIGHTTIME HIGH RES VISUAL IMAGE…SHOW COVERAGE ALONG MUCH OF THE
COAST FROM PT REYES SOUTH TO THE VICINITY OF THE MONTEREY
PENINSULA…AND A BROAD SWATH EXTENDING INLAND ACROSS SAN
FRANCISCO AND THROUGH THE GOLDEN GATE TO THE EAST BAY. LATEST
BODEGA BAY AND FT ORD PROFILER DATA INDICATE A MARINE LAYER DEPTH
OF ABOUT 1300 FT. SOME THIN HIGH CLOUDS ARE ALSO PASSING THROUGH ABOVE.

NAM MODEL AND IN-HOUSE LOCAL WRF MODEL BOUNDARY LAYER RH OUTPUT
BOTH INDICATE STRATUS SHOULD GENERALLY CLEAR BY MIDDAY…EXCEPT
ALONG THE SAN MATEO COAST AND IN THE VICINITY OF THE MONTEREY
PENINSULA. EXPECT AFTERNOON HIGHS TO BE AROUND 3 TO 5 DEGS COOLER
THAN ON THURSDAY…BUT STILL WELL ABOVE SEASONAL NORMS ESPECIALLY
INLAND.
GOES_IFR_PROB_20140314loop

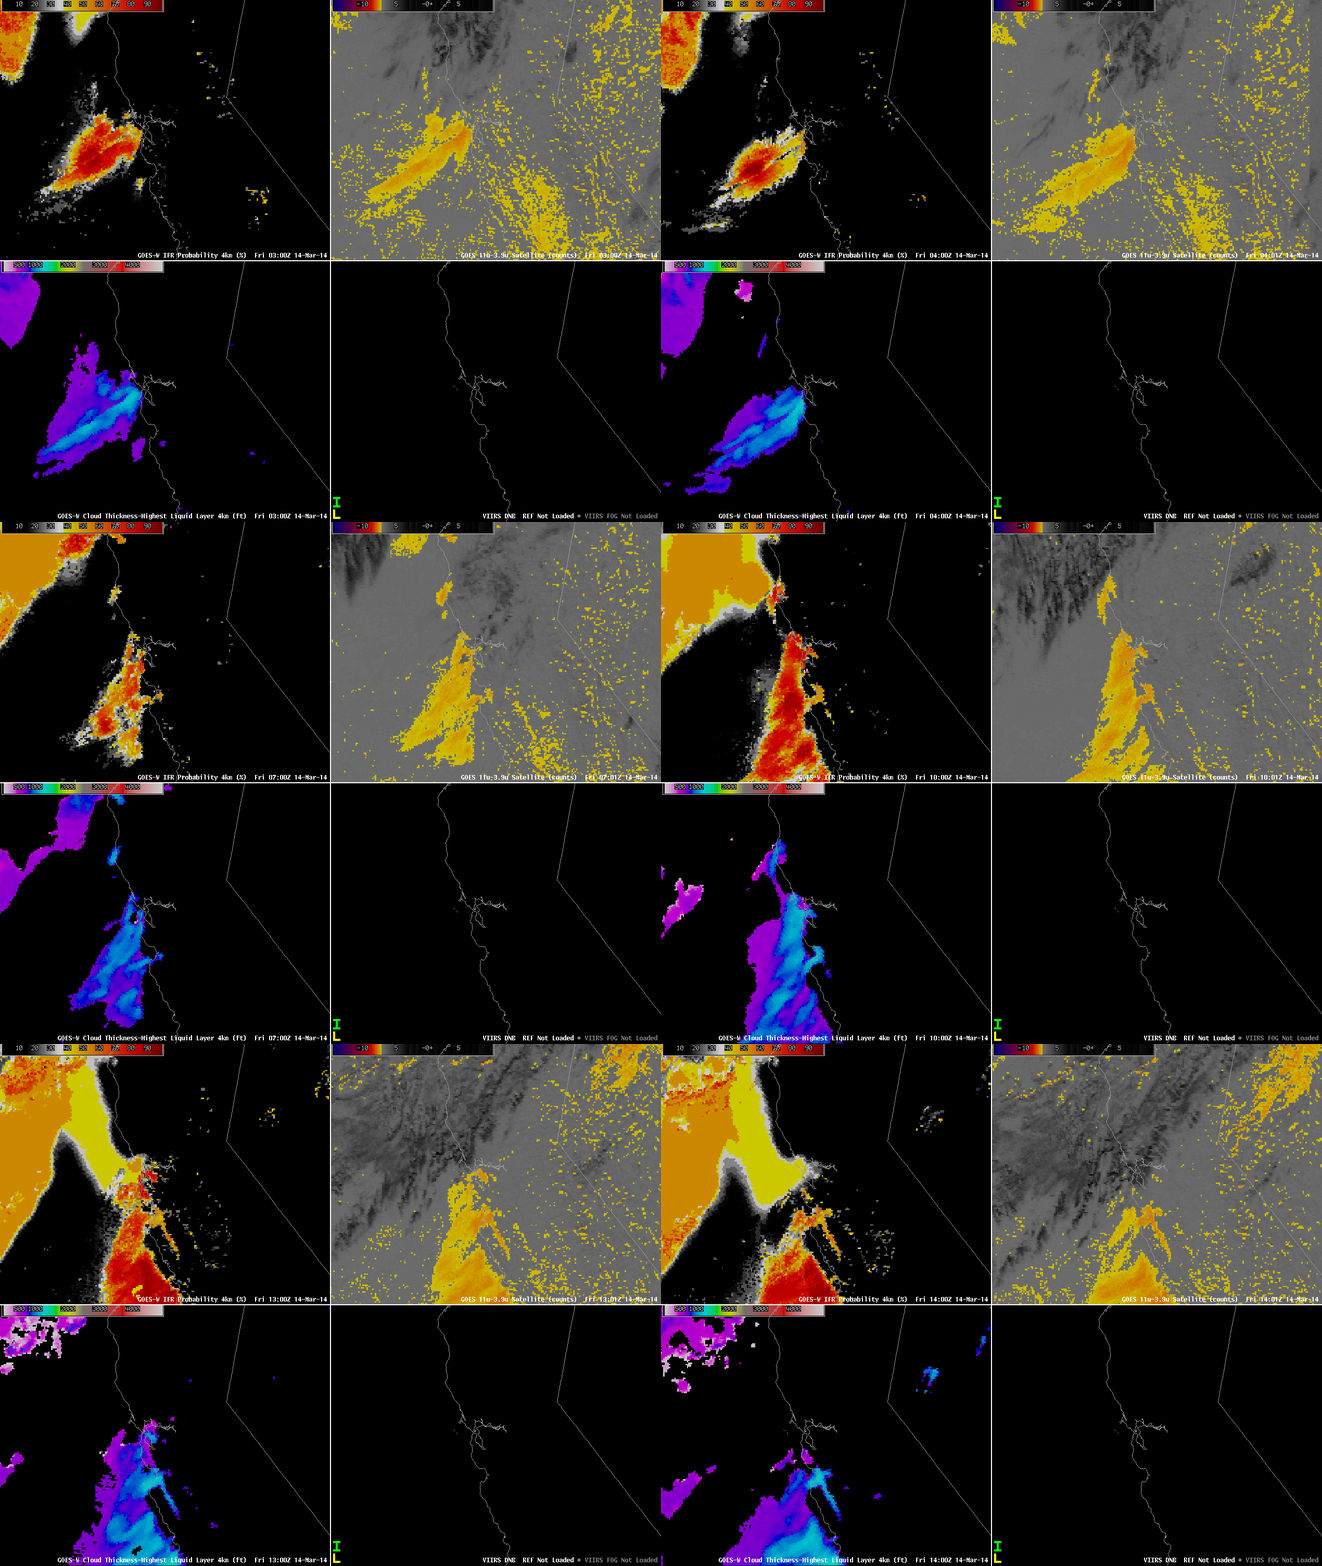
GOES-R IFR Probabilities computed from GOES-15 (Upper Left), GOES-West Brightness Temperature Differences (10.7 µm – 3.9 µm) (Upper Right), GOES-R Cloud Thickness (Lower Left), Suomi/NPP Day/Night Band (Lower Right), all hourly times as indicated (click to enlarge)

The animation of satellite and satellite-derived fields, above, shows how the GOES-R and GOES-West fields depicted the development of the low clouds. Note how the brightness temperature difference fields over CA and NV throughout the animation have a speckled appearance. These positive signals are due not to the presence of fog/low clouds but rather to differences in emissivity properties of the dry land. Near the end of the animation, high clouds are widespread over northern California. For such cases, the brightness temperature difference product provides little information about low-level clouds. However, the GOES-R IFR Probability field, because it blends together information from satellite and from Rapid Refresh does provide a signal under clouds. It is a much smoother signal because it does vary from one satellite pixel to the next, and the Probability values are smaller because satellite predictors cannot be used in the algorithm.

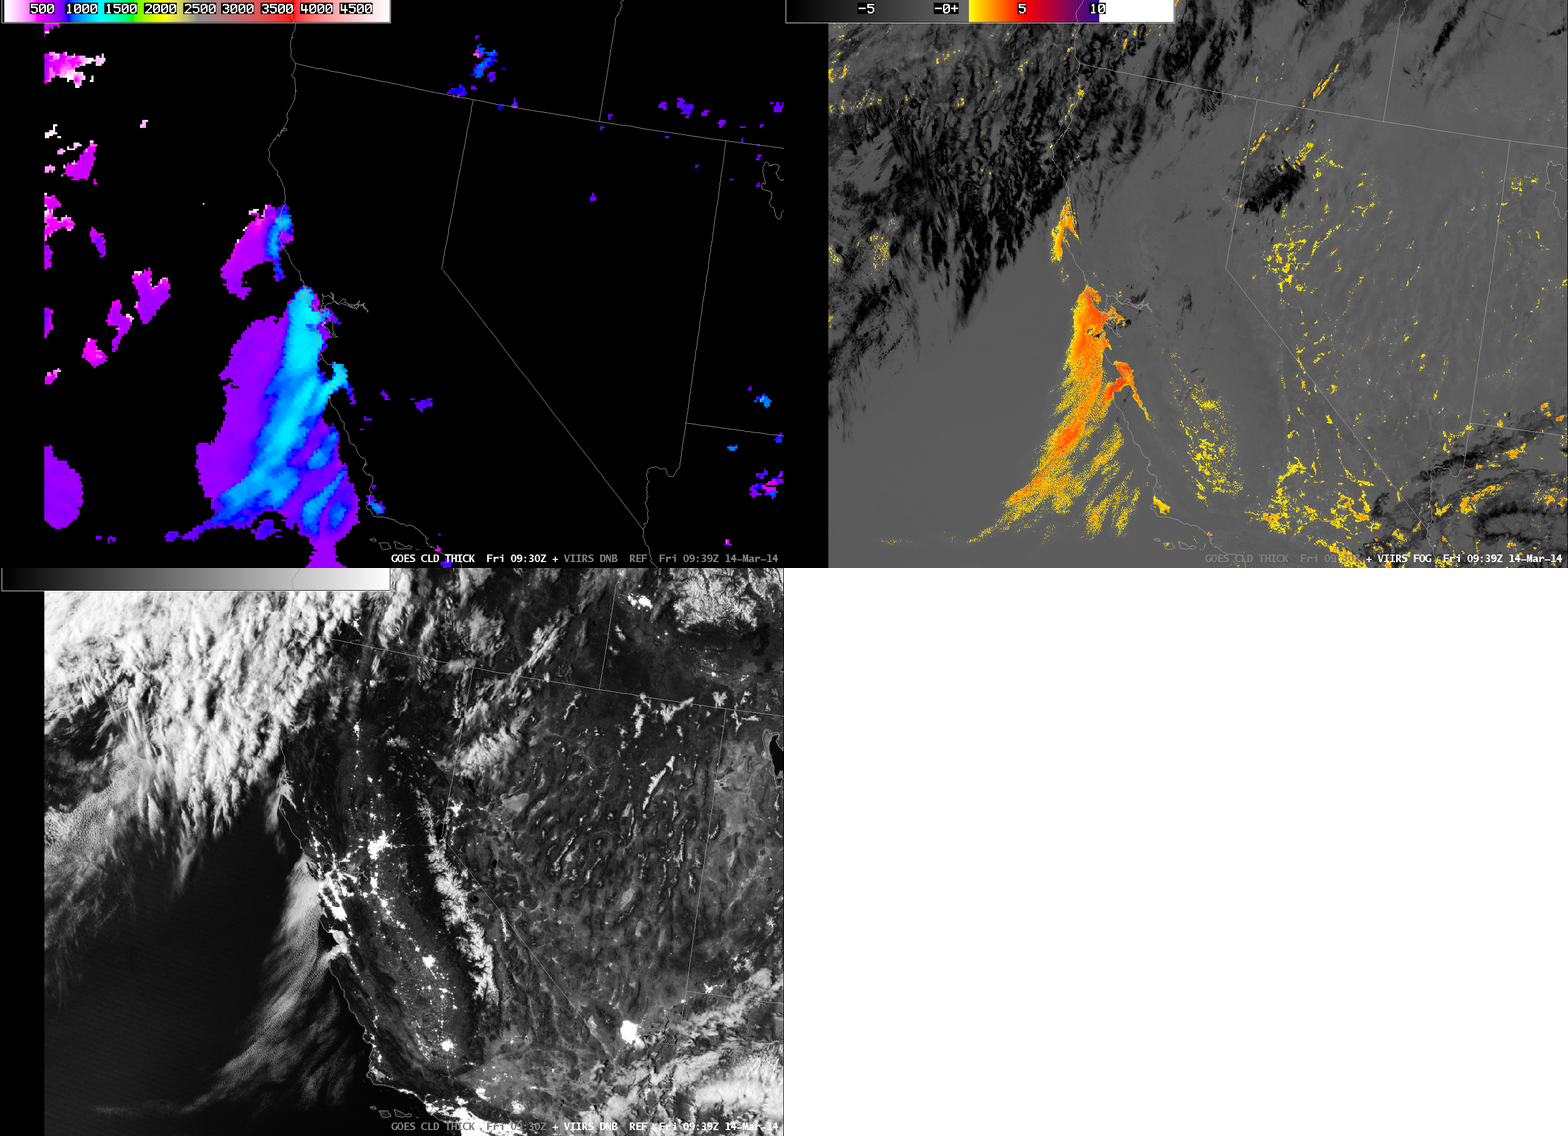
The AFD above notes the Day/Night band, and also the depth of the marine stratus. The toggle of Cloud Thickness, Day/Night Band, and brightness temperature difference, below (useful to distinguish white clouds from white city lights!), shows a nice overlap between the GOES-R product and the clouds detected at high resolution by Suomi/NPP. Cloud thickness is around 1150 feet at Bodega Bay, and closer to 1250 feet at Fort Ord, in good agreement with the profile data cited.
VIIRS_DNB__REF_GOES_CLD_THICK_20140314_09

Toggle of GOES-R Cloud Thickness, Suomi/NPP Brightness Temperature Difference and Day/Night Band (click to enlarge)
Marine Stratus moves over Sacramento

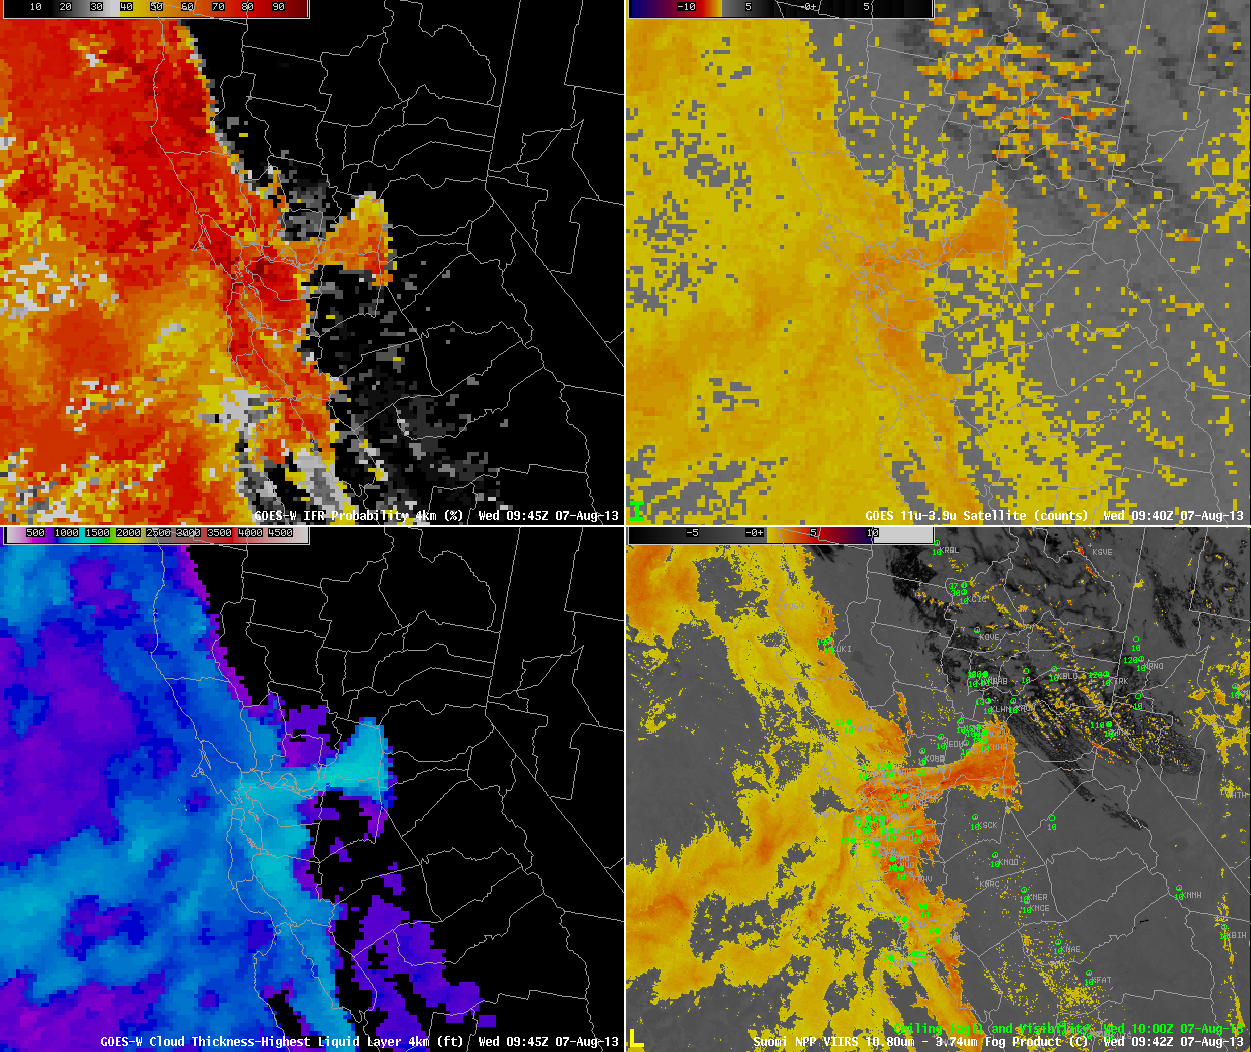
GOES-based GOES-R IFR Probabilities (Upper Left), GOES-West Brightness Temperature Difference (Upper Right, 10.7 µm - 3.9 µm), GOES-R Cloud Thickness (Lower Left), Suomi/NPP Brightness Temperature Difference (click image to play animation)

GOES-based GOES-R IFR Probabilities (Upper Left), GOES-West Brightness Temperature Difference (Upper Right, 10.7 µm – 3.9 µm), GOES-R Cloud Thickness (Lower Left), Suomi/NPP Brightness Temperature Difference (click image to play animation)

GOES-based IFR Probabilities track the incursion of a deck of marine stratus into metropolitan Sacramento and its surroundings on the morning of August 7. The cloud movement is also captured in the GOES-West (GOES-15) Brightness Temperature Difference fields. Note, however, how the GOES-R IFR Probability fields correctly suppress the signal in regions surrounding the stratus deck. These are regions where emissivity differences at 10.7 and 3.9 µm are more likely due to soil variability than to the presence of small liquid clouds droplets.

Suomi/NPP overflew the region at approximately 0945 UTC. The brightness temperature difference field for that time is shown here. The sharp edges of the stratus deck are readily apparent.

Although IFR Probabilities are high in this cloud bank, widespread IFR conditions were not reported. Much of the stratus was apparently elevated off the ground.

Some forecast models ably captured the evolution of this cloud field. A brightness temperature difference field from the 0000 UTC 7 August NSSL WRF, shown here (Courtesy of Dan Lindsey, NOAA) shows a cloud field evolving between 0900 and 1900 UTC on 7 August. Combining the forecast model output with real-time IFR Probability observations allows anticipation and monitoring of an evolving stratus deck.

Fog/Low Stratus over southern California viewed by many Satellites

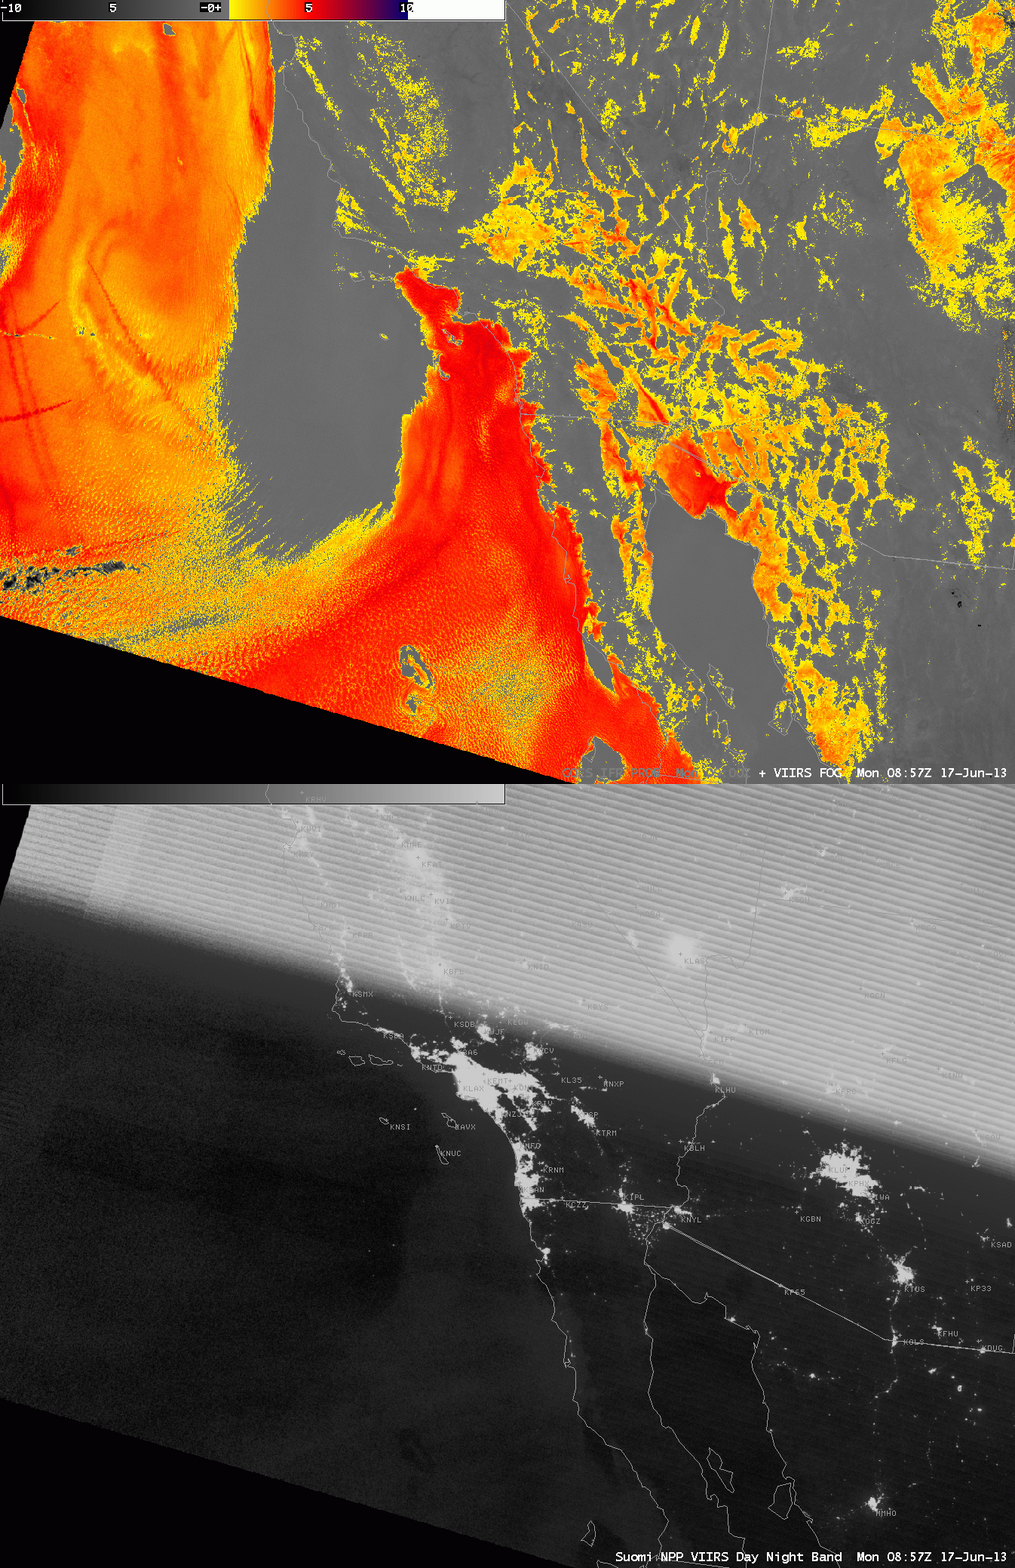
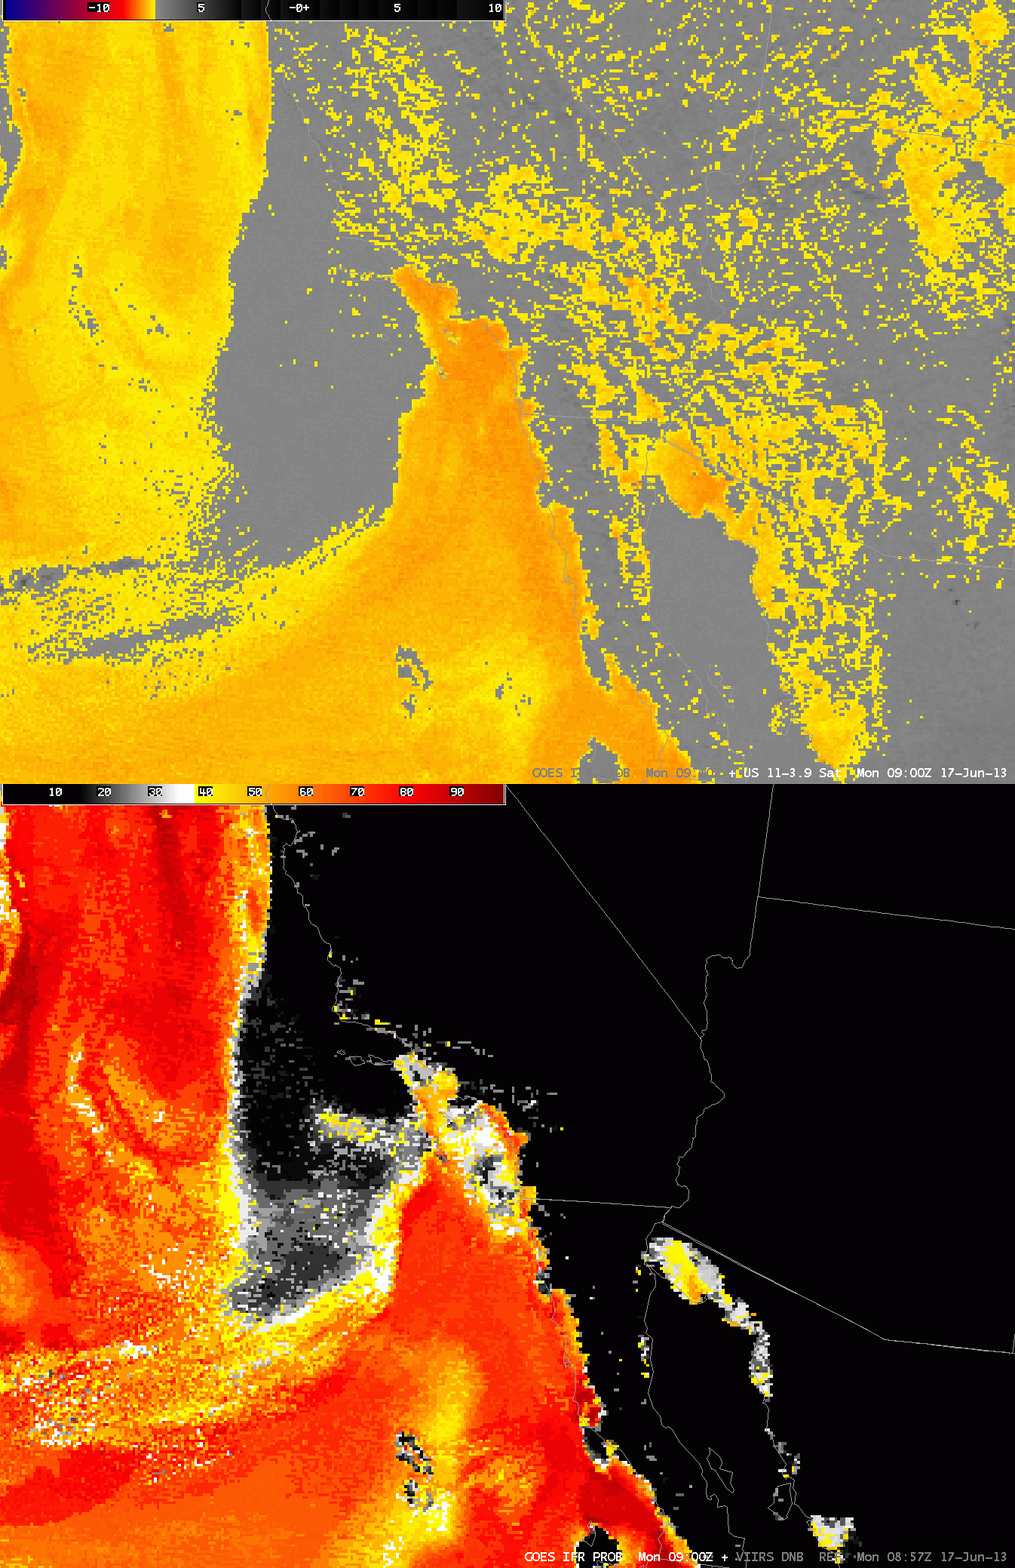
Suomi-NPP VIIRS imagery at 0857 UTC 17 June 2013.  Imagery includes the Day/Night band (including regions north of Southern California within the Stray Light zone) and the brightness temperature difference between 11 µm and 3.74 µm

There are a variety of ways to detect fog and low stratus using satellites.  The imagery above uses VIIRS data aboard the Suomi/NPP satellite.  Both the Day/Night band and the brightness temperature difference product show a region of clear skies west of the Channel Islands, with low clouds hugging the coast from Los Angeles southward.  There are also low cloud signals in the brightness temperature difference field over the deserts of California, Arizona and Mexico.

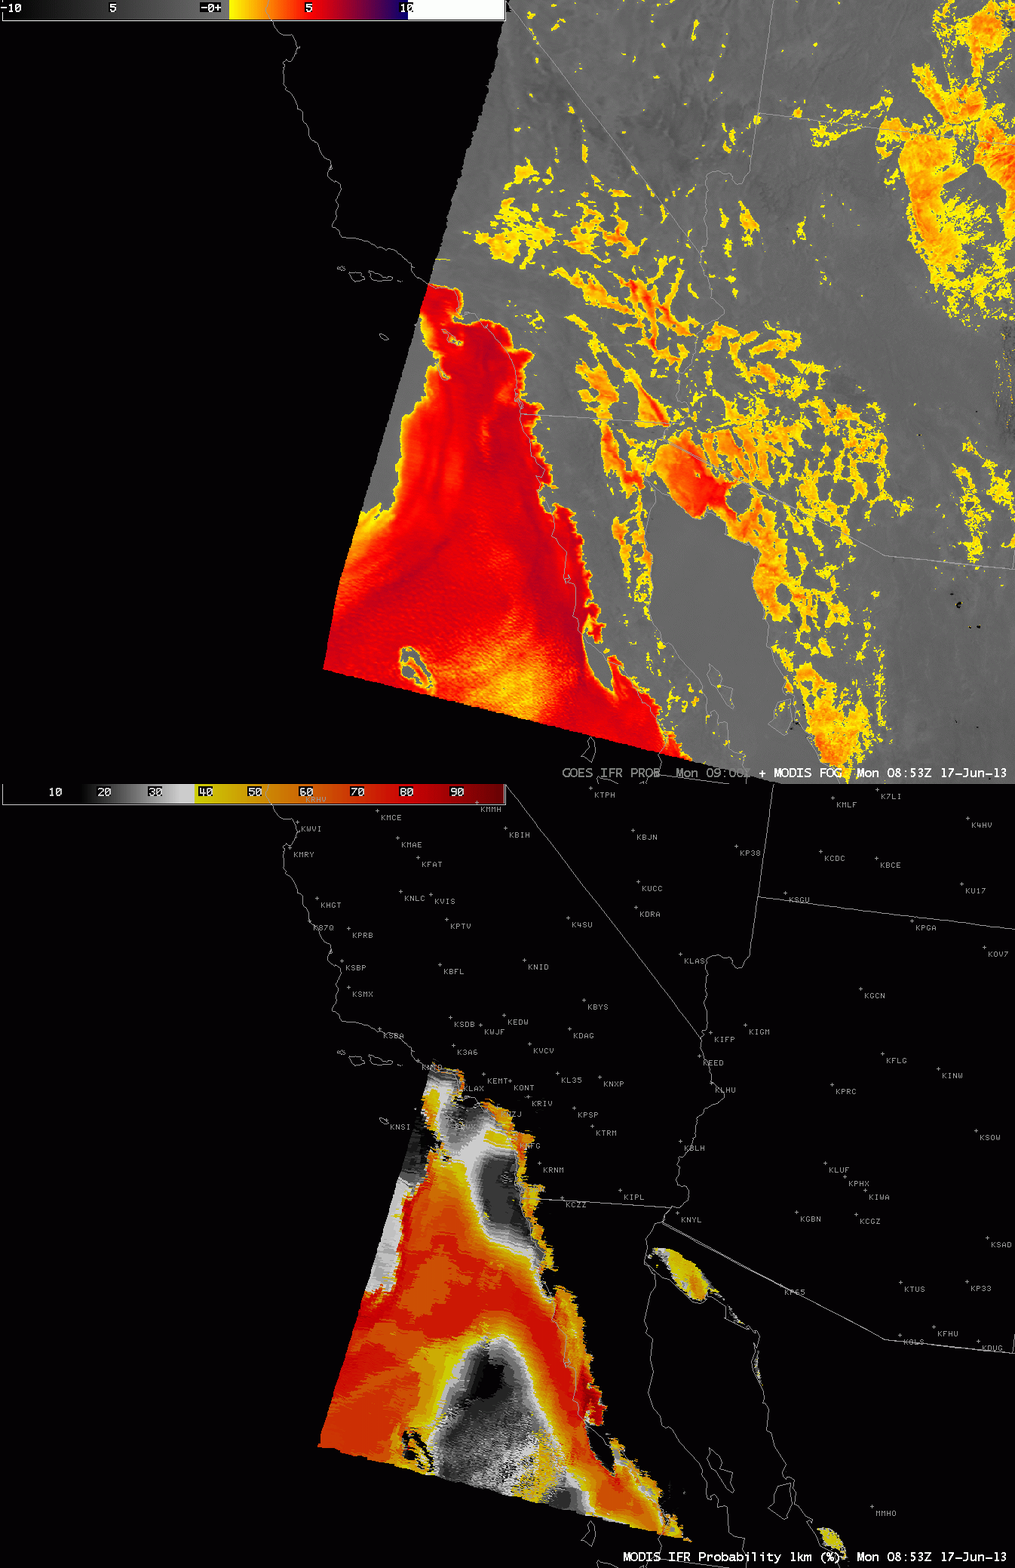
MODIS-based imagery at 0853 UTC 17 June 2013.  The brightness temperature difference (10.8 µm – 3.9 µm ) and MODIS-based GOES-R IFR Probabilities

MODIS data also hints at a clear pocket west of the Channel Islands, and shows fog/stratus extending southward from Los Angeles along the coast.  Whereas the brightness temperature difference also shows a signal over the deserts of California, Arizona and Mexico, the GOES-R IFR probability field suggests probabilities for IFR conditions are enhanced only along the north coast of the Gulf of California.  The other signals over land are likely related to emissivity property differences in the dry soils over the deserts.  MODIS data does show the sharp edge to the fog/low stratus deck that has moved onshore over coastal northern Baja California.  That sharp edge demonstrates an advantage of 1-km MODIS data.

GOES-West Brightness Temperature Difference (10.7 µm – 3.9 µm ) and GOES-R IFR Probabilities computed from GOES-West data, 0900 UTC 17 June 2013

GOES-West data also suggest a clear spot west of the Channel Islands, with fog and low stratus that extends southward along the coast from Los Angeles.  The brightness temperature difference signal over the deserts of the southwest is not in the IFR probability field because the Rapid Refresh model data does not show low-level saturation (save for that small region along the north coast of the Gulf of California).  The cloud edge along the Pacific Coast is not quite so sharp as it is in the MODIS data because the pixel size of GOES is larger.  GOES data does have an advantage over MODIS, however:  it views the scene every 15 minutes so temporal changes can be monitored.

Resolution: MODIS vs. GOES

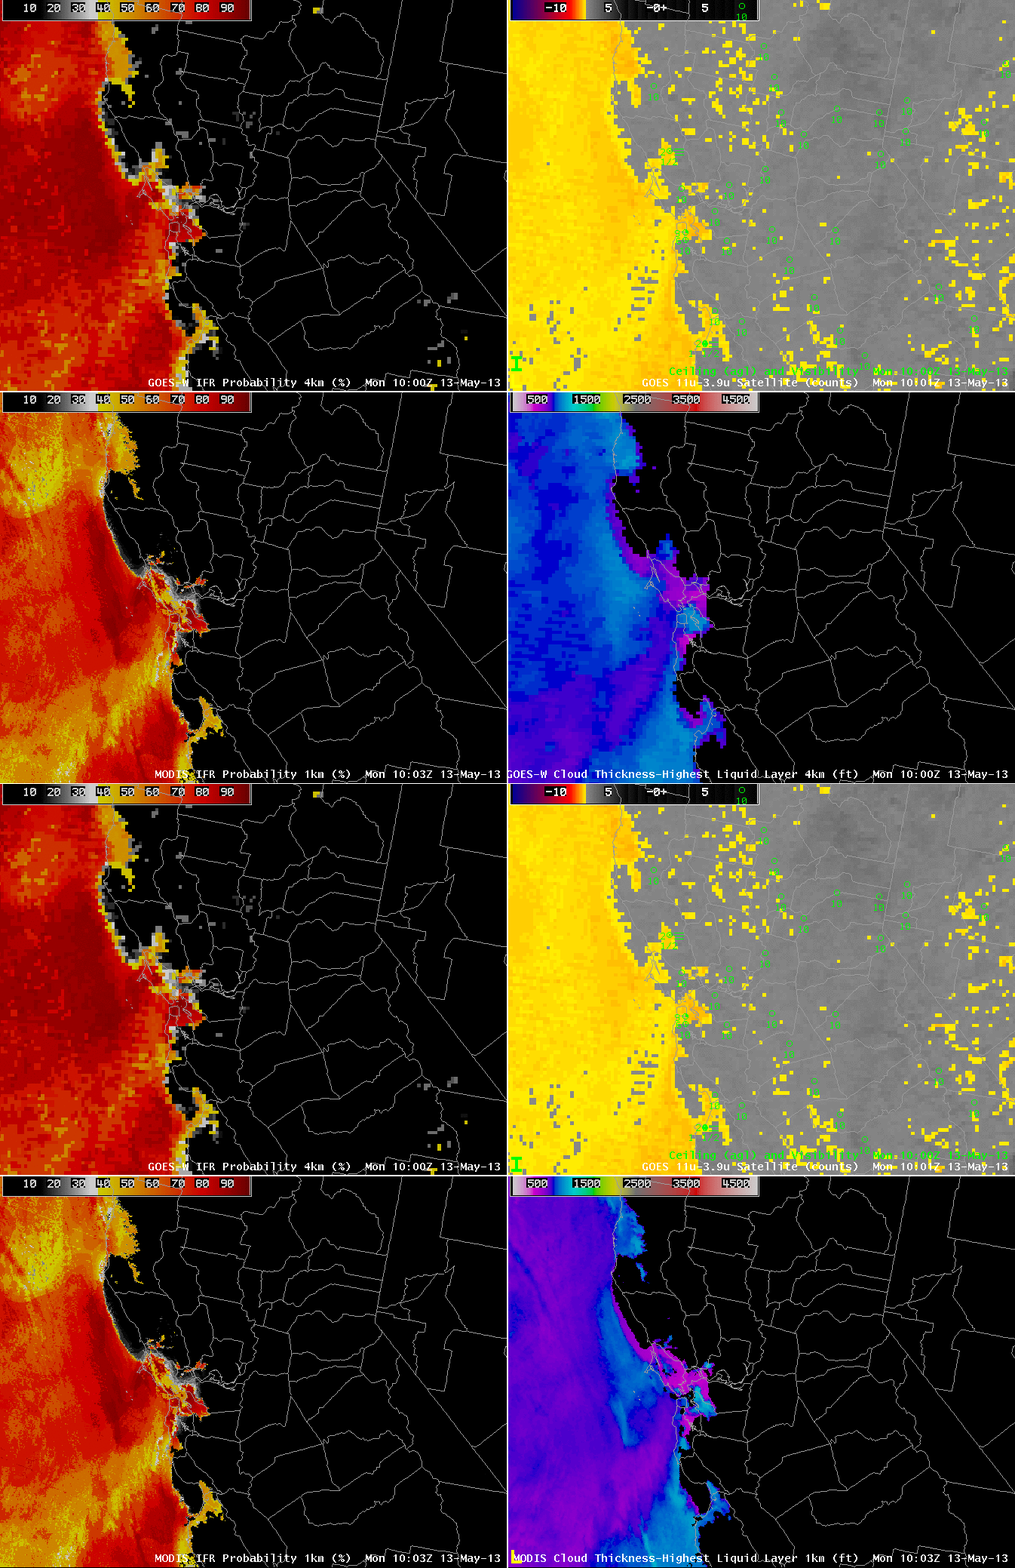
GOES-R IFR Probabilities computed from GOES-West data (Upper Left), GOES-West Brightness Temperature Difference (10.7 – 3.9 ) (Upper Right), GOES-R IFR Probabilities computed from MODIS data (Lower Left), Toggle between GOES-R Cloud Thickness computed with GOES-West data and with MODIS data, all imagery around 1000 UTC on 13 May 2013

The high spatial resolution on MODIS allows a much more detailed description of IFR probability fields, and cloud thickness fields, than from the GOES-West Imager instrument.  Note in the IFR probability fields on the left, and in the toggle of the Cloud Thickness fields, how the MODIS fields show crisper edges to the fog.  The IFR probability is also — correctly — screening out brightness temperature difference signal in regions where fog and low stratus are not present (in central California and over Nevada).  Note how the three stations reporting IFR conditions all sit within the region where the brightness temperature difference field has a strong signal, and where the IFR Probability is high.

GOES-R Resolution will be between MODIS and present GOES;  that is, nominal pixel size in the GOES-R era will be 2 km.

Stratus over Southern California

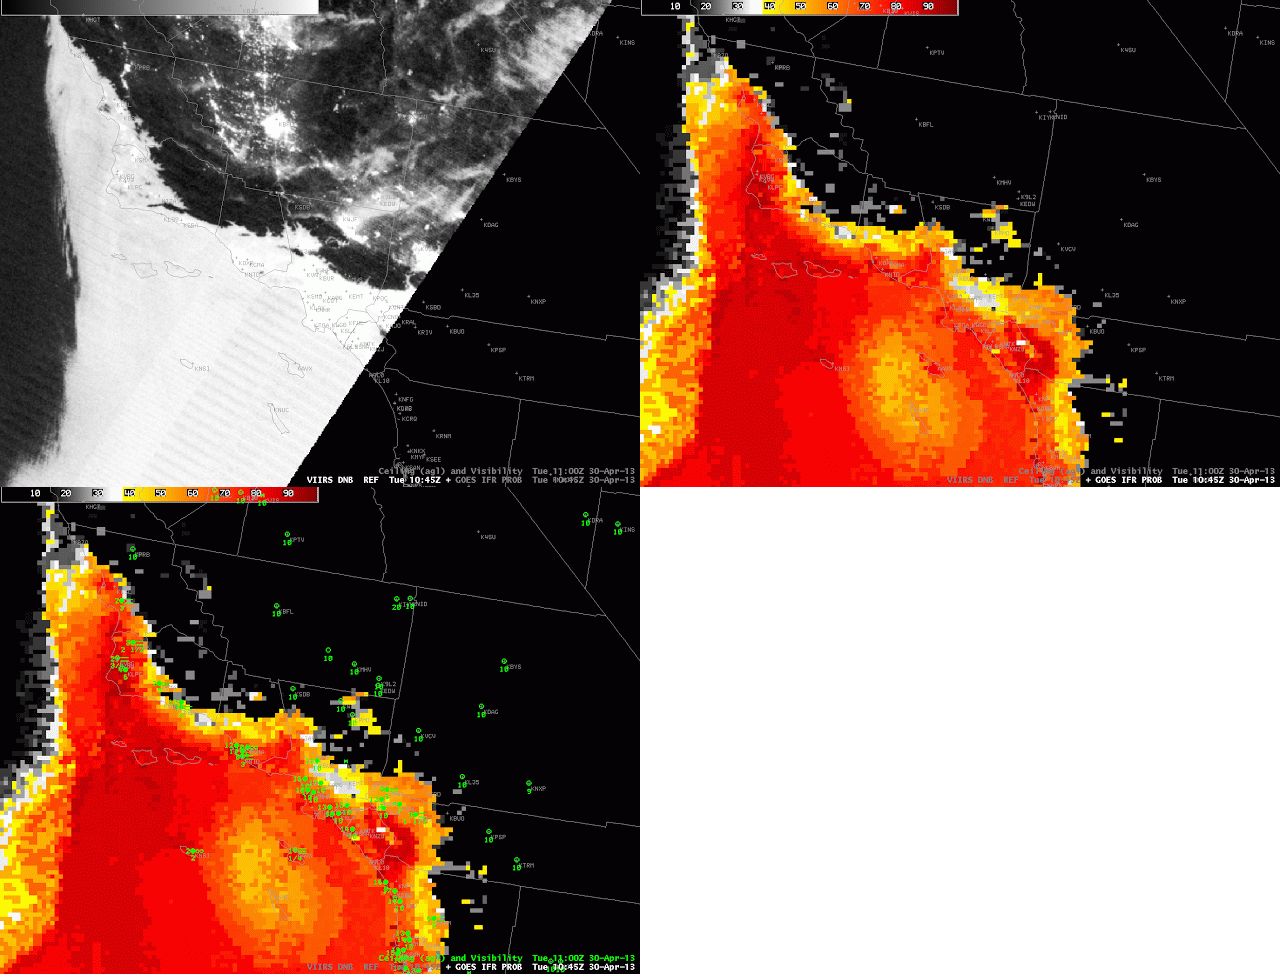
VIIRS Day/Night Band (from Suomi/NPP), GOES-R IFR Probabilities (From GOES-West) and ceilings/visibilities, all near 0900 UTC on 30 April 2013

Day/Night imagery produced from VIIRS data on Suomi/NPP easily shows the large extent of marine stratus off the west coast of southern California at 0900 UTC on 30 April 2013.  That stratus may or may not be associated with low ceilings and reduced visibility that accompany IFR conditions.  A fused product that incorporates surface-based data will show where IFR conditions are most likely, and that is shown above as well.  Data from GOES-West and Rapid Refresh model output are combined to predict where IFR conditions are most likely.  Plotted observations of ceilings and visibilities confirm that the highest probabilities neatly overlay observed IFR conditions.  It is important to note that not all of the region covered by the marine stratus observed by the Day/Night band has IFR conditions.

The careful viewer may have noted that the IFR Probability fields over the ocean are quite high in regions where the Day/Night band shows no clouds at 0900 UTC.  GOES-R IFR Probabilities can be artificially enhanced in regions of Stray Light contamination in the GOES-West imager 3.7 data.  This contamination occurs around 0900 UTC at this time of year.   Note that by 1045 UTC (below), the stray light contamination has passed, and IFR probablilities over the ocean more properly align with the Day/Night band-observed cloud edges.

As above, but for 1045 UTC 30 April 2013

A similar set of imagery from 1045 UTC shows a general reduction in the predicted area of IFR probabilities, although the region of highest IFR probabilities, along the coast, persists and as do IFR conditions.

There was also fog over Monterey Bay on this morning.  Click here to read about it.

Fog/Low Stratus Examples on both Coasts

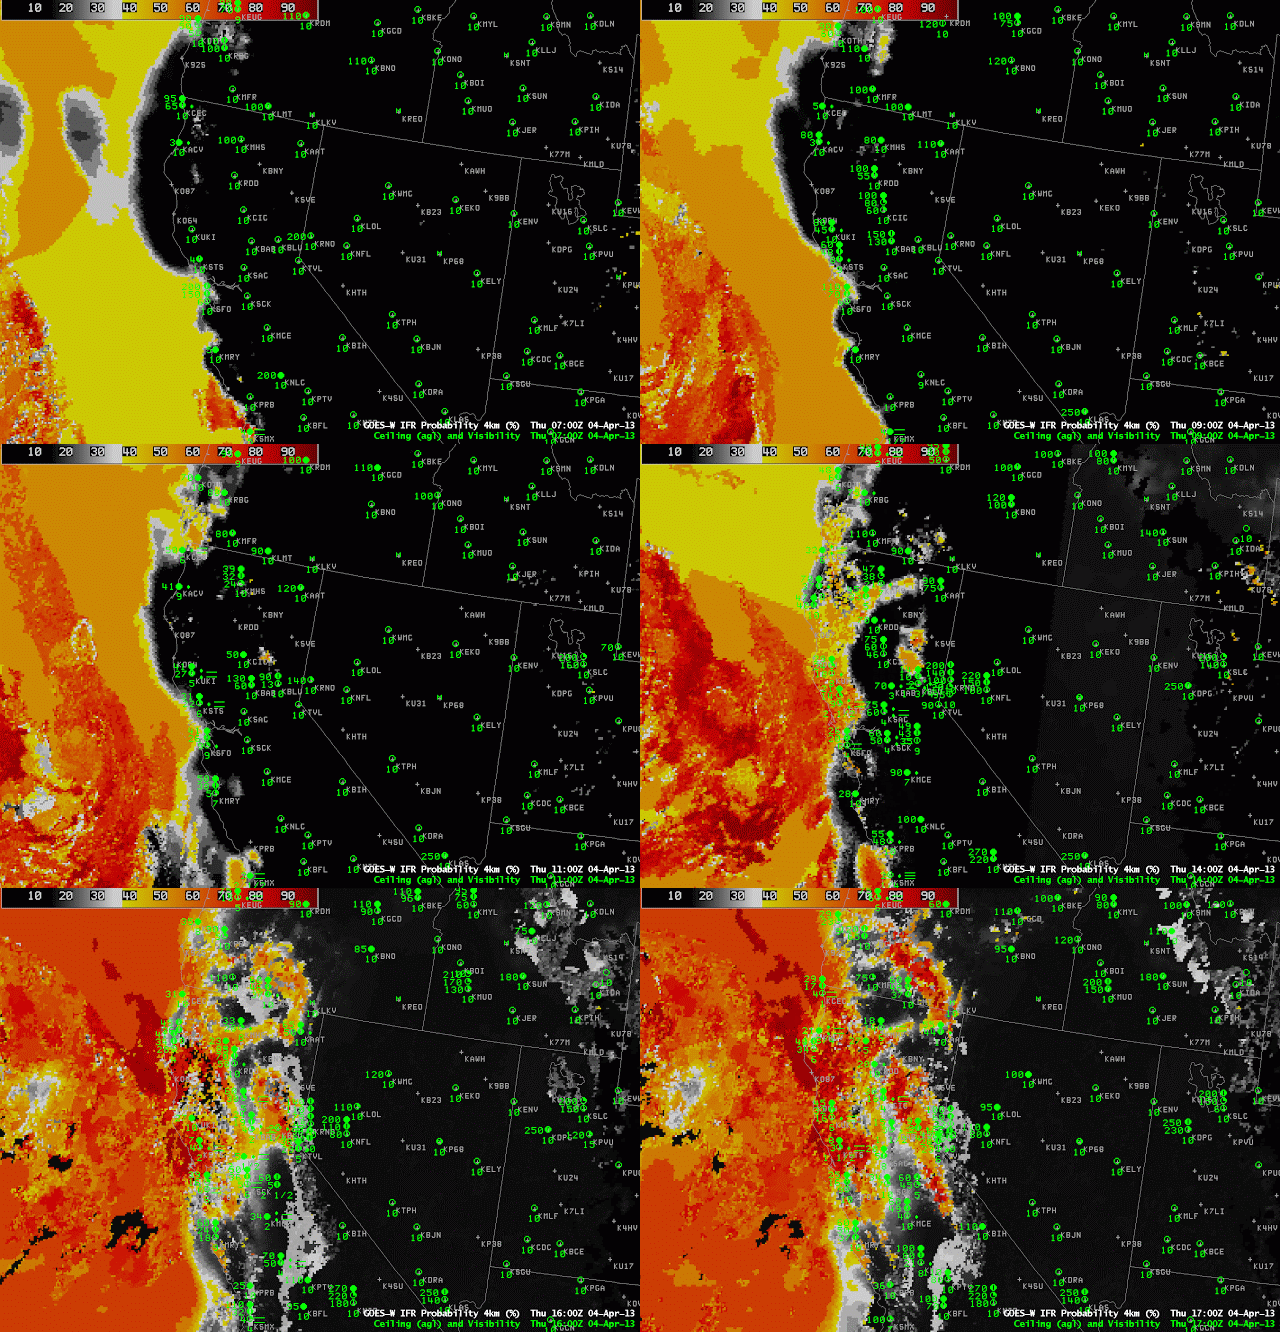
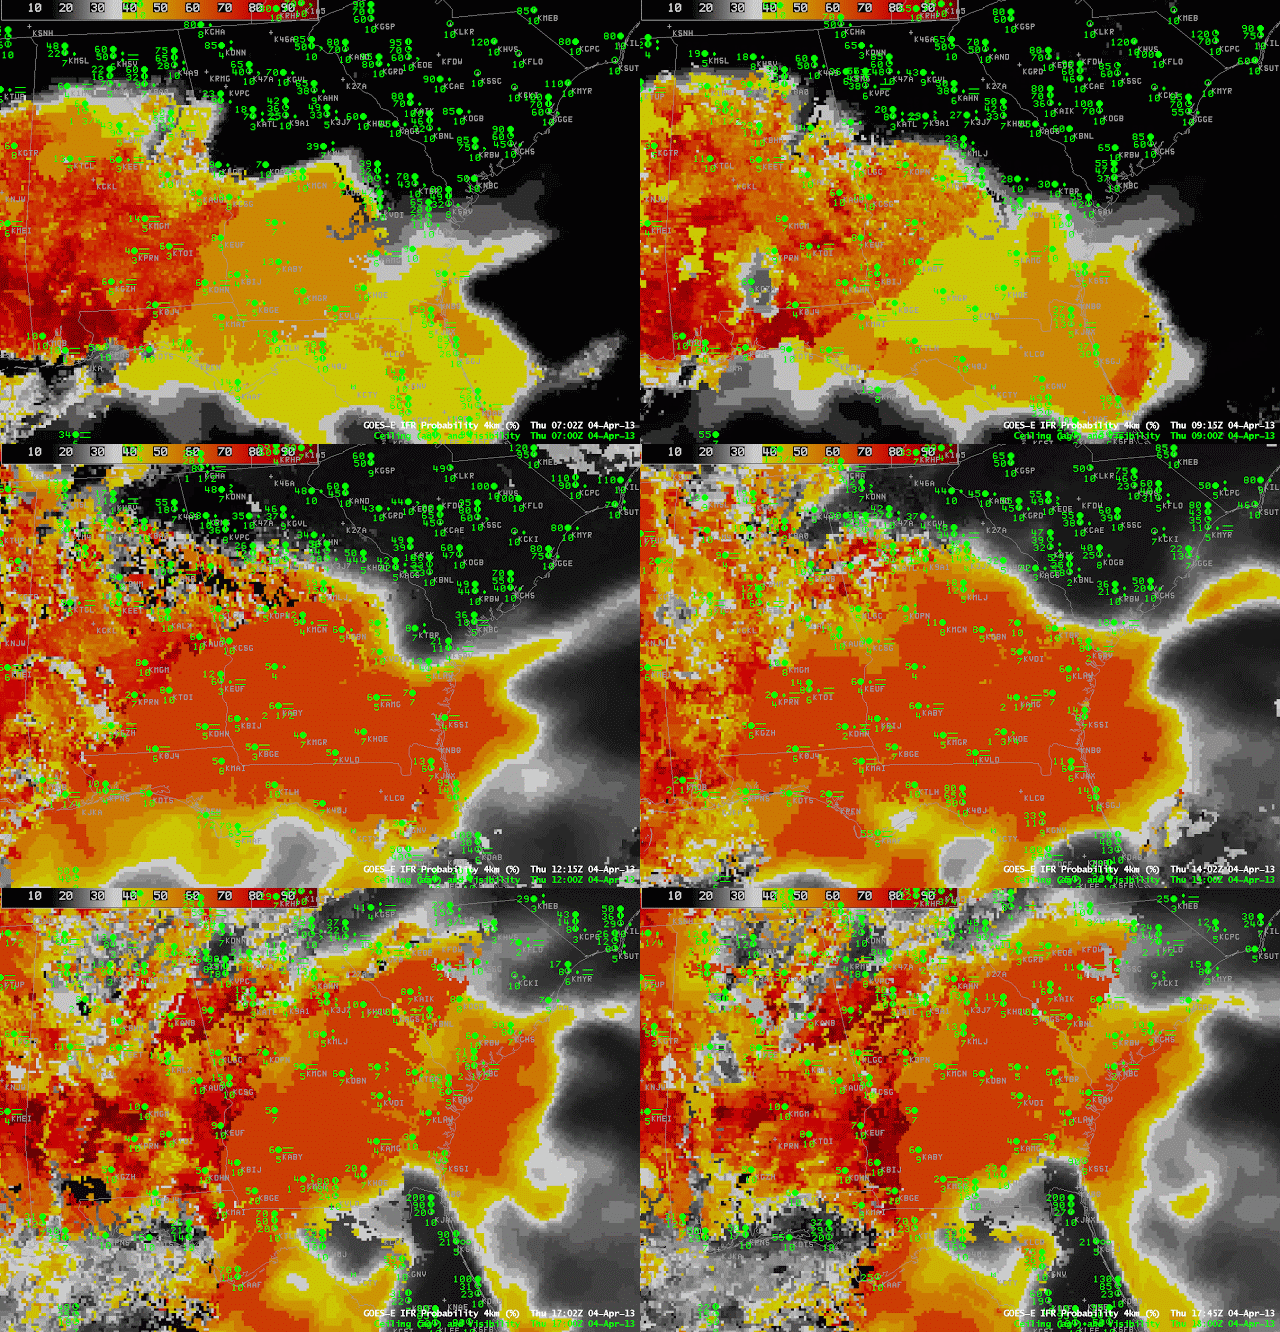
Two different systems — one approaching California, and one in the Gulf of Mexico — provide examples of how the GOES-R Fog/Low Stratus algorithm give information about visibilities and ceilings in regions where high clouds obscure the satellite view of low levels.

GOES-R IFR Probabilities computed from GOES-West, hourly, from 0700 through 1700 UTC 4 April 2013

The first case, off the West Coast, starts with a deck of high clouds over the coast associated with a landfalling cyclone.  IFR Probabilities over the Pacific near the California coast are initially derived solely from Rapid Refresh model data.  Consequently, IFR probabilities are not high.  As the cirrus shield pushes inland, low clouds become visible to the satellite, and when both satellite and model predictors are used to compute IFR Probabilities, higher probabilities are a result.  In addition, small-scale variability that is inherent in a satellite image (and perhaps not so inherent in model output) changes the character of the IFR Probability field from a flat field at the start to a more pixelated field later in the animation.  As the low clouds push onshore, associated moisture and precipitation helps to generate near-IFR and IFR conditions in regions where the IFR Probabilities are depicted to be high.

The second case, below, over the deep South, shows a region of fog/low clouds moving over Georgia as mostly model-based IFR Probabilities also move over the state.  Strong convection over the Gulf of Mexico produced abundant high-level cloudiness;  thus, IFR Probabilities could only be computed using Rapid Refresh Data over Georgia  — but the computed IFR Probabilities both outline the region of lowest ceilings/visibilities and match their slow spread to the north and east into South Carolina.  The IFR Probability field over Mississippi has a more pixelated look to it, and shows higher values, because satellite data are also used to diagnose the IFR Probability:  IFR Probabilities are highest only where both predictors (model and satellite) are used.

GOES-R IFR Probabilities computed from GOES-East, hourly, from 0702 UTC through 1745 UTC, 4 April 2013

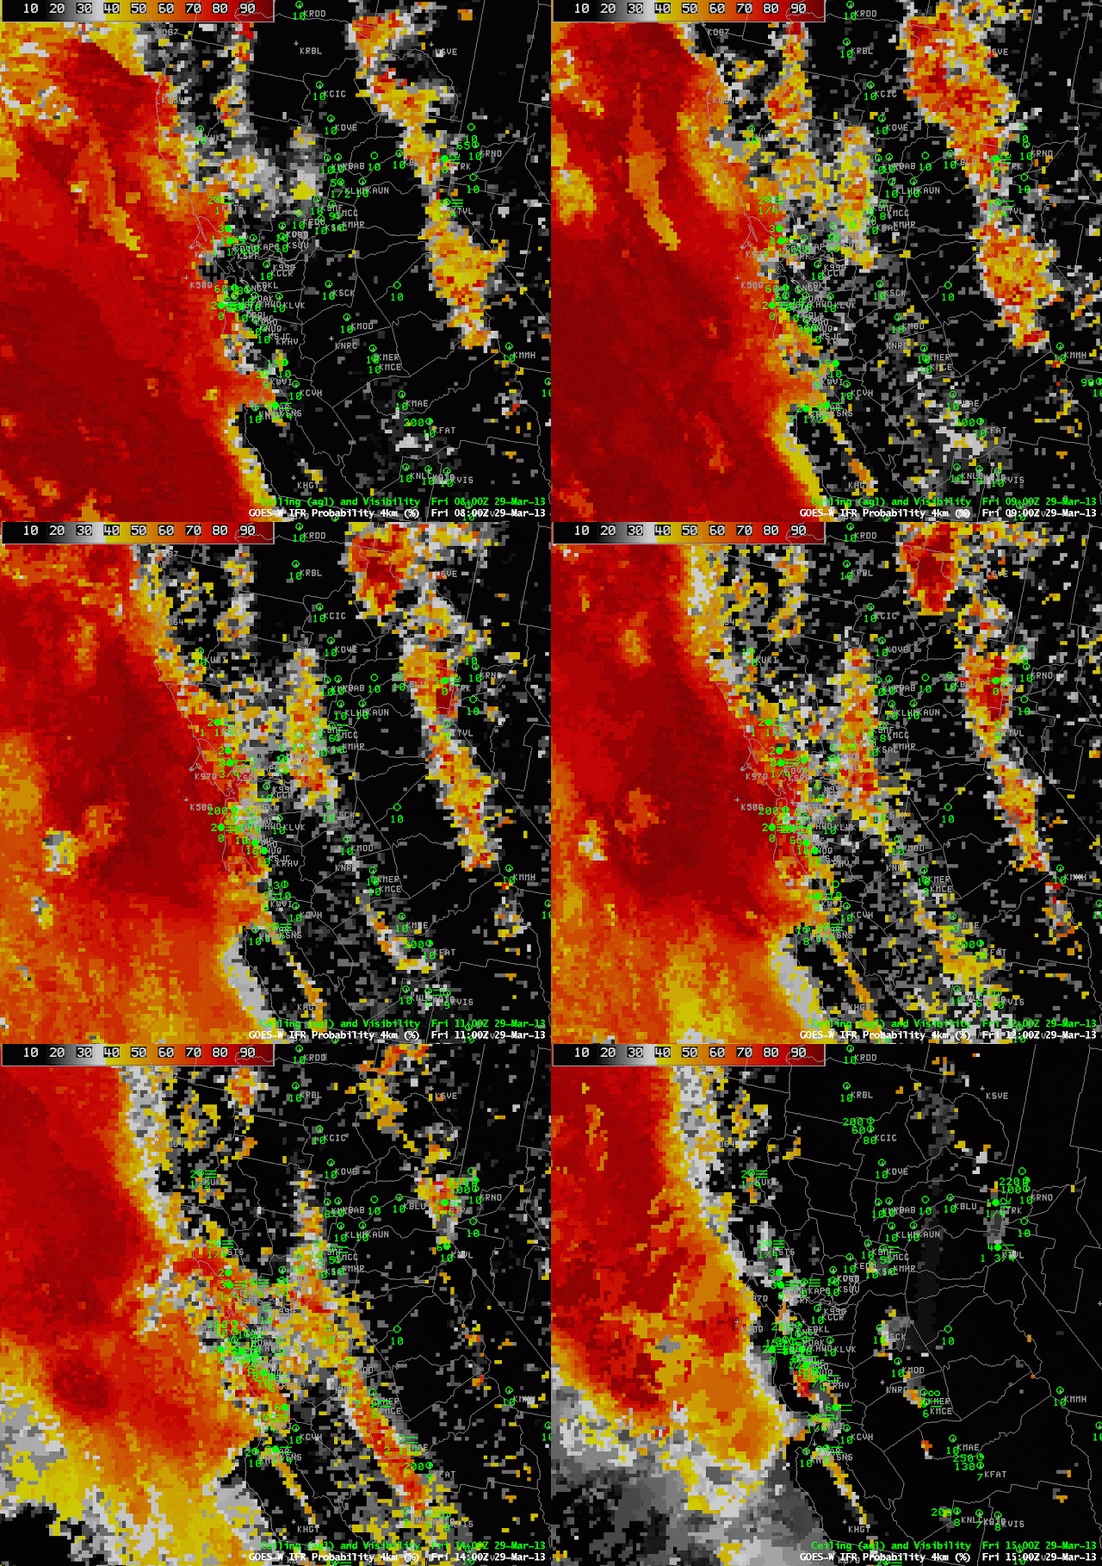
Fog/Low Stratus over San Francisco Bay

GOES-R IFR Probabilities computed from GOES-West, hourly from 0800 through 1500 UTC on 29 March 2013

The animation above shows the evolution of fog/low stratus as it moves inland from the Pacific Ocean into San Francisco Bay, and surroundings, on March 29th.  A chief forecast difficulty would be:  Will low ceilings impact San Francisco International Airport?  The TAF issued at 1212 UTC mentioned IFR conditions:

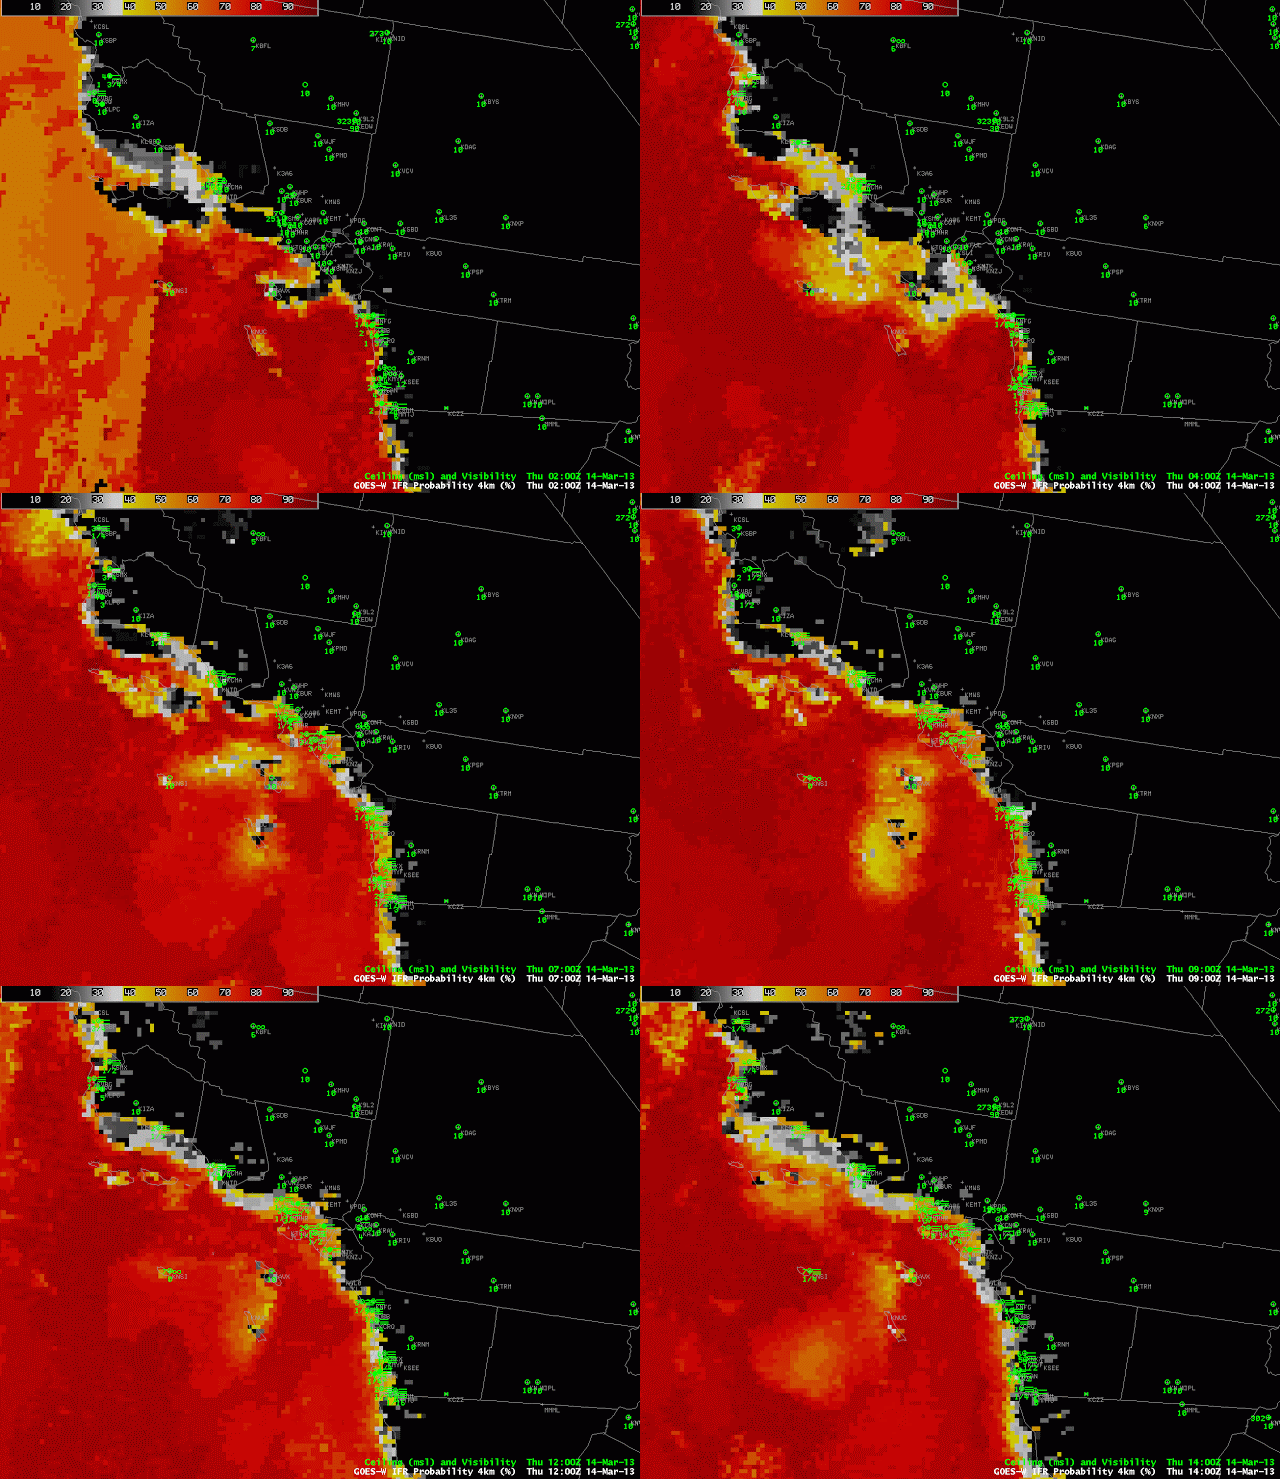
Coastal Stratus over southern California

Hourly imagery of GOES-R IFR Probability computed from GOES-West, from 0200 UTC through 1400 UTC 14 March 2013

Hourly imagery of GOES-R IFR Probability from the overnight/early morning of 14 March 2013 shows the typical advance inland of stratus along coastal southern California.  Several aspects of this loop bear mention.  In the 0200 UTC, the division between daytime predictors (to the left) and nighttime predictors (to the right) is evident extending mostly north-south over the Ocean.  Visibilities at Los Angeles International Airport (LAX) drop to IFR conditions as the diagnosed IFR probabilities push inland.  Note also the good relationship between high probabilities and low visibilities along the coast north of San Diego.

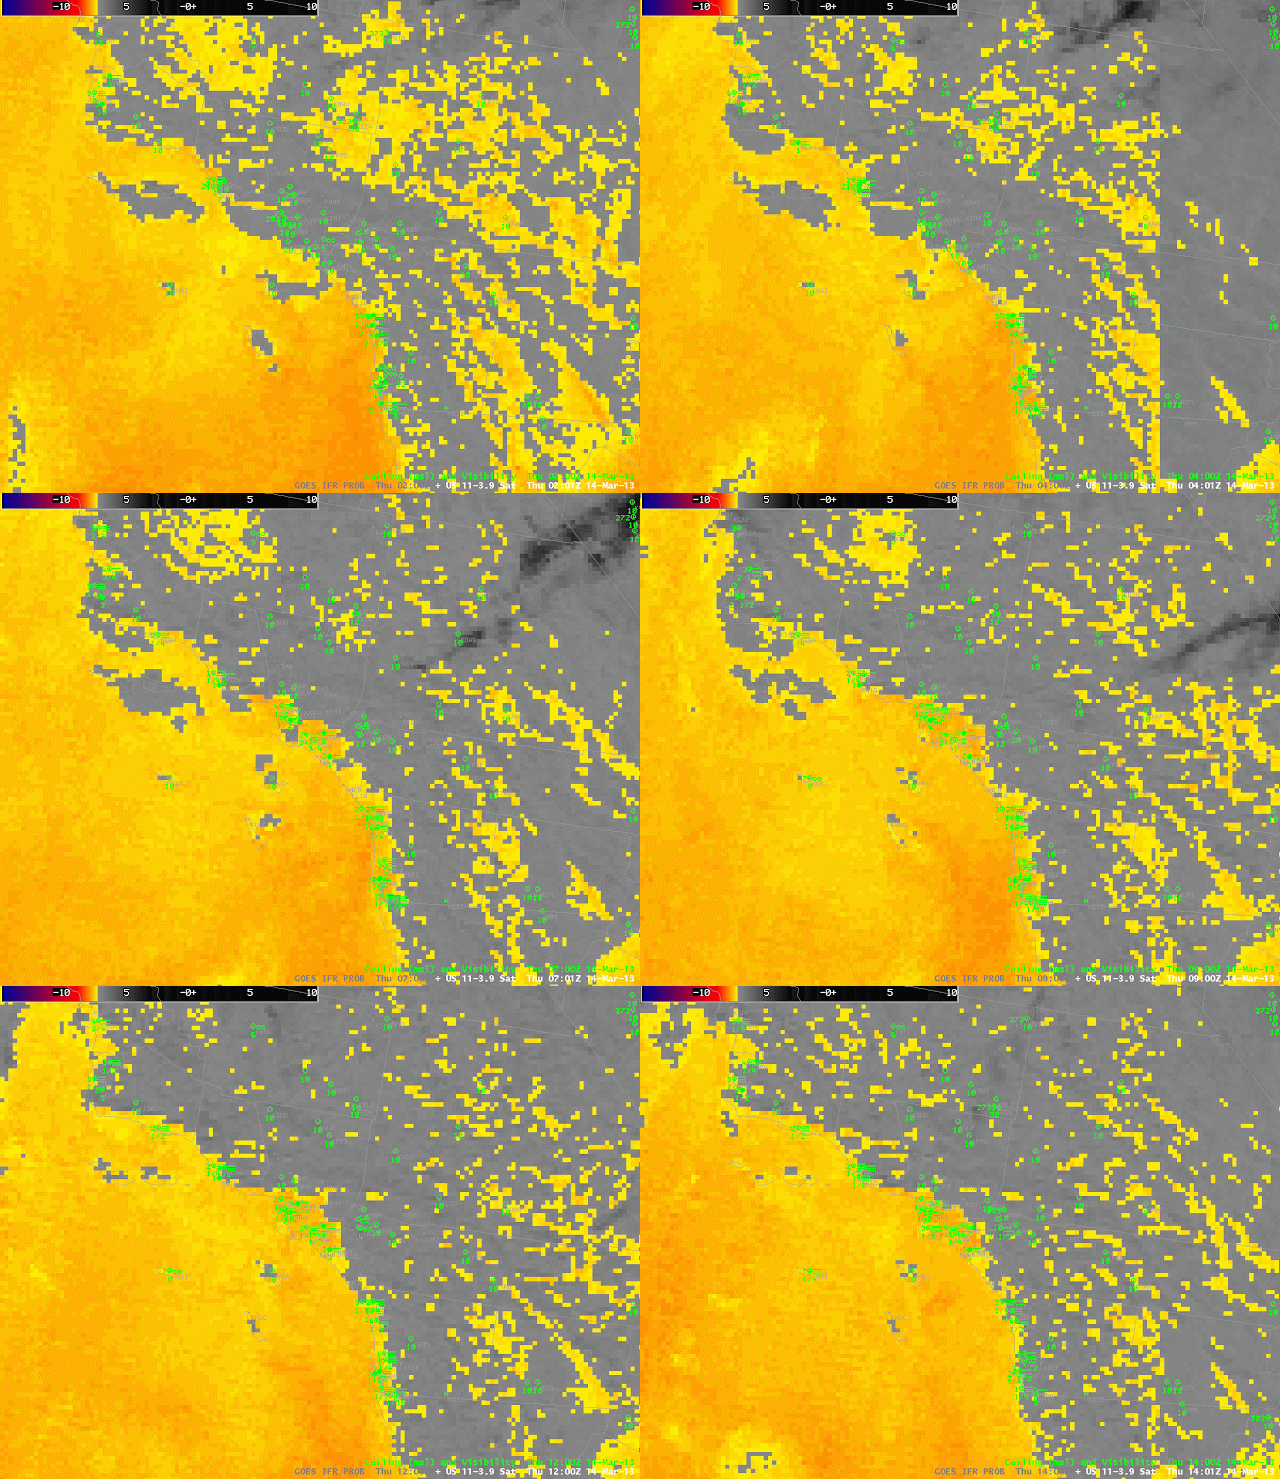
There is a push inland of higher probabilities at 1000 UTC in the loop above that is not well reflected in the observations.  This occurs because of stray light contamination in the brightness temperature difference channel that is obvious in the animation below.  Note also how the many ‘false positives’ in the brightness temperature difference product over land in Southern California, differences that are attributable to emissivity differences in the surface, not to the presence of liquid water clouds, are effectively screened out in the GOES-R IFR Probability product.

Traditional Brightness Temperature Difference product (10.7 µm – 3.9 µm) from GOES-West (mostly).  Note that the ‘seam’ between GOES-East data and GOES-West data is present in the eastern part of the imagery.  Hourly data from 0200 through 1400 UTC on 14 March 2013.

Fog near San Francisco

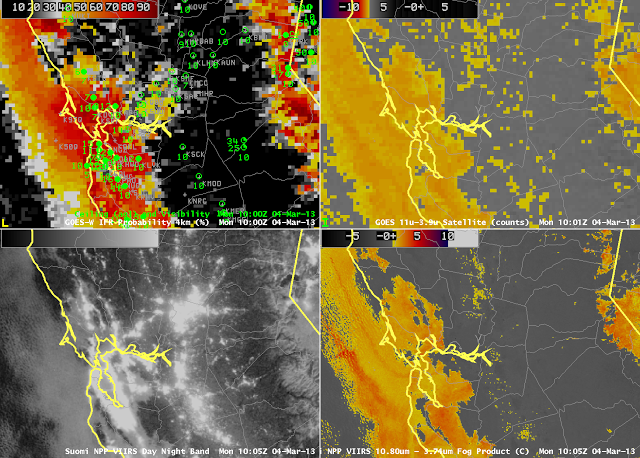
GOES-R IFR Probabilities computed from GOES-West (Upper Left), GOES-West Brightness Temperature Difference (10.7 µm – 3.9 µm) (Upper Right), Suomi/NPP VIIRS Day/Night Band (Lower Left), Suomi/NPP VIIRS Brightness Temperature Difference (10.8 µm- 3.74 µm) (Lower Right), all images near 1000 UTC on March 4 2013.

A high-impact fog event on March 1st led to a Group Stop at SFO International.  The synoptic conditions that supported fog development on 1 March (Images from 1 March are shown at the bottom of this blog post) persisted through the weekend along the West Coast, and fog was again observed on Monday morning, 4 March and the four images above show results from fog detection schemes for that date.  The GOES-R Fog/Low Stratus IFR Probability field shows that the highest probability of IFR conditions is occurring where IFR and near-IFR conditions are observed.  Note the benefits of the high-resolution Suomi/NPP VIIRS data.  Sharp edges to the low cloud field are ably captured in central Santa Clara County.  There are also benefits to using the near infrared and infrared channels to detect regions of low clouds in urban areas, where bright lights can dazzle the Day/Night band so that small breaks in the clouds, as detected just south and west of southern San Francisco Bay, cannot be discerned in the visible.  Compare the differences in the 1-km data from VIIRS to the nominal 4-km resolution of present GOES in the imagery above.  Note also that the brightness temperature difference helps distinguish between snow and clouds over the Sierra Nevada.

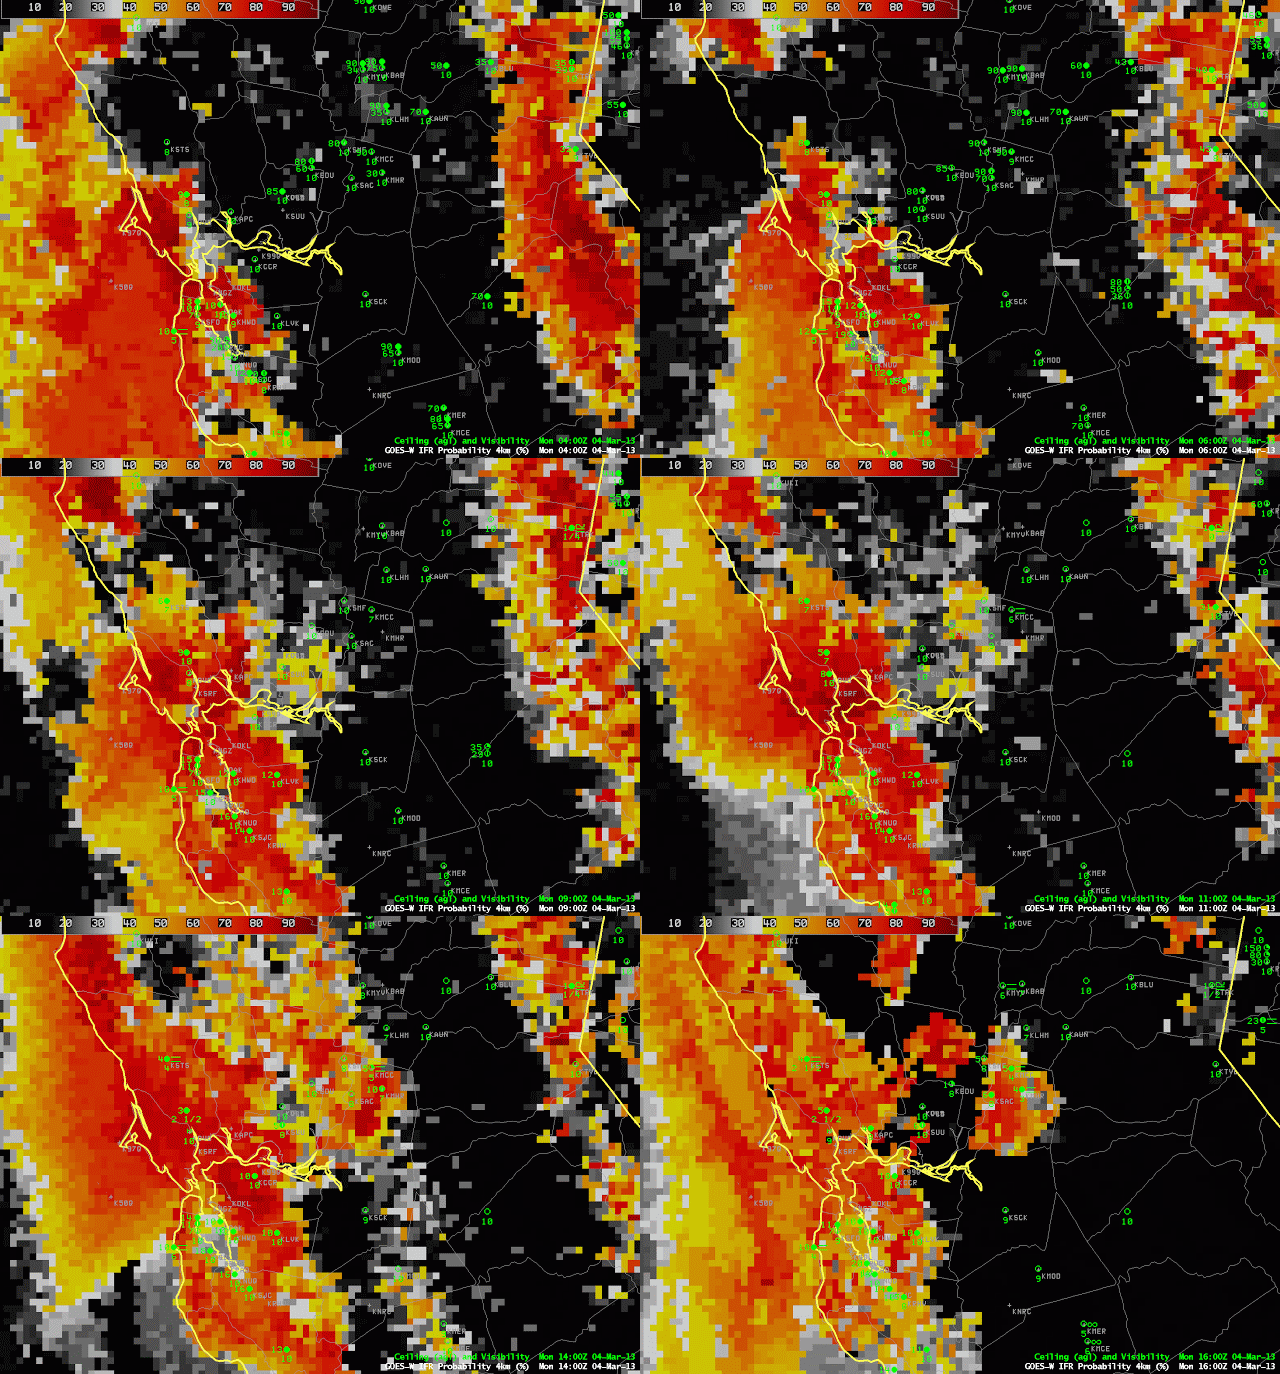
GOES-R IFR Probabilities computed from GOES-West, hourly, from 0400 UTC to 1600 UTC on 4 March 2013

The animation, above, of GOES-R IFR Probabilities helps describe and define the region of evolving IFR conditions early on March 4th.

Figures provided by Warren Blier, WFO MTR.

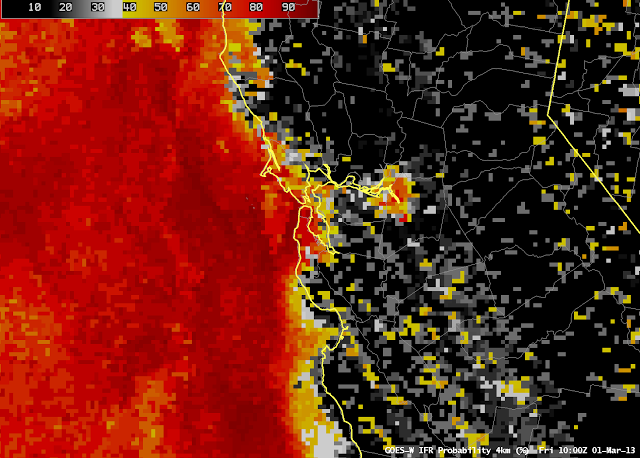
Warren Blier from NWS in MTR sent along an email about the event on March 1st.  The screen capture above shows MODIS-based GOES-R IFR probabilities (on the right) compared with the GOES-West ‘traditional’ unenhanced  brightness temperature difference.  The higher spatial resolution of MODIS and of VIIRS really does pick up the details.  The image below is the 1000 UTC image created using GOES-West data, and the comparison between the MODIS image above and the GOES image below shows the power of MODIS resolution.

GOES-R IFR Probabilities computed using GOES-West data, 1000 UTC on 1 March 2013

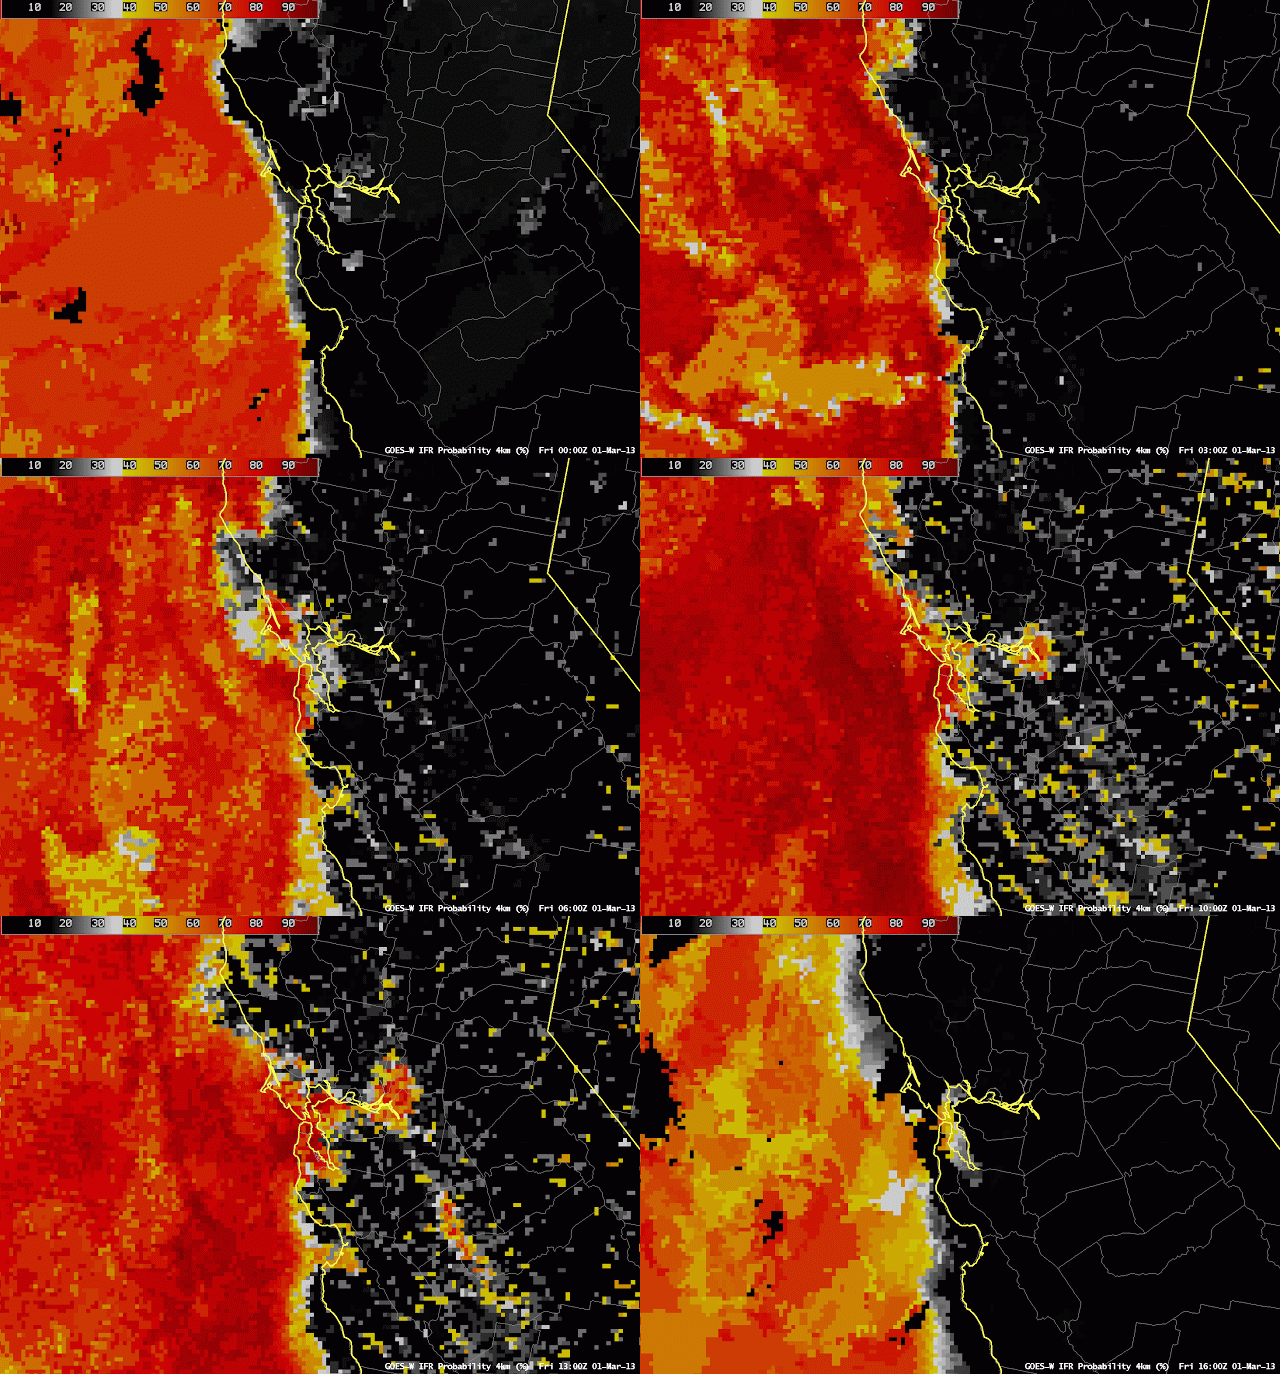
An animation of GOES-R IFR probabilities from 0000 through 1600 UTC on 1 March shows the highest IFR probabilities increasing near SFO after 0900/1000 UTC on the first.

Hourly imagery of IFR probabilities computed from GOES-West, 0000 through 1600 UTC on March 1st