 |
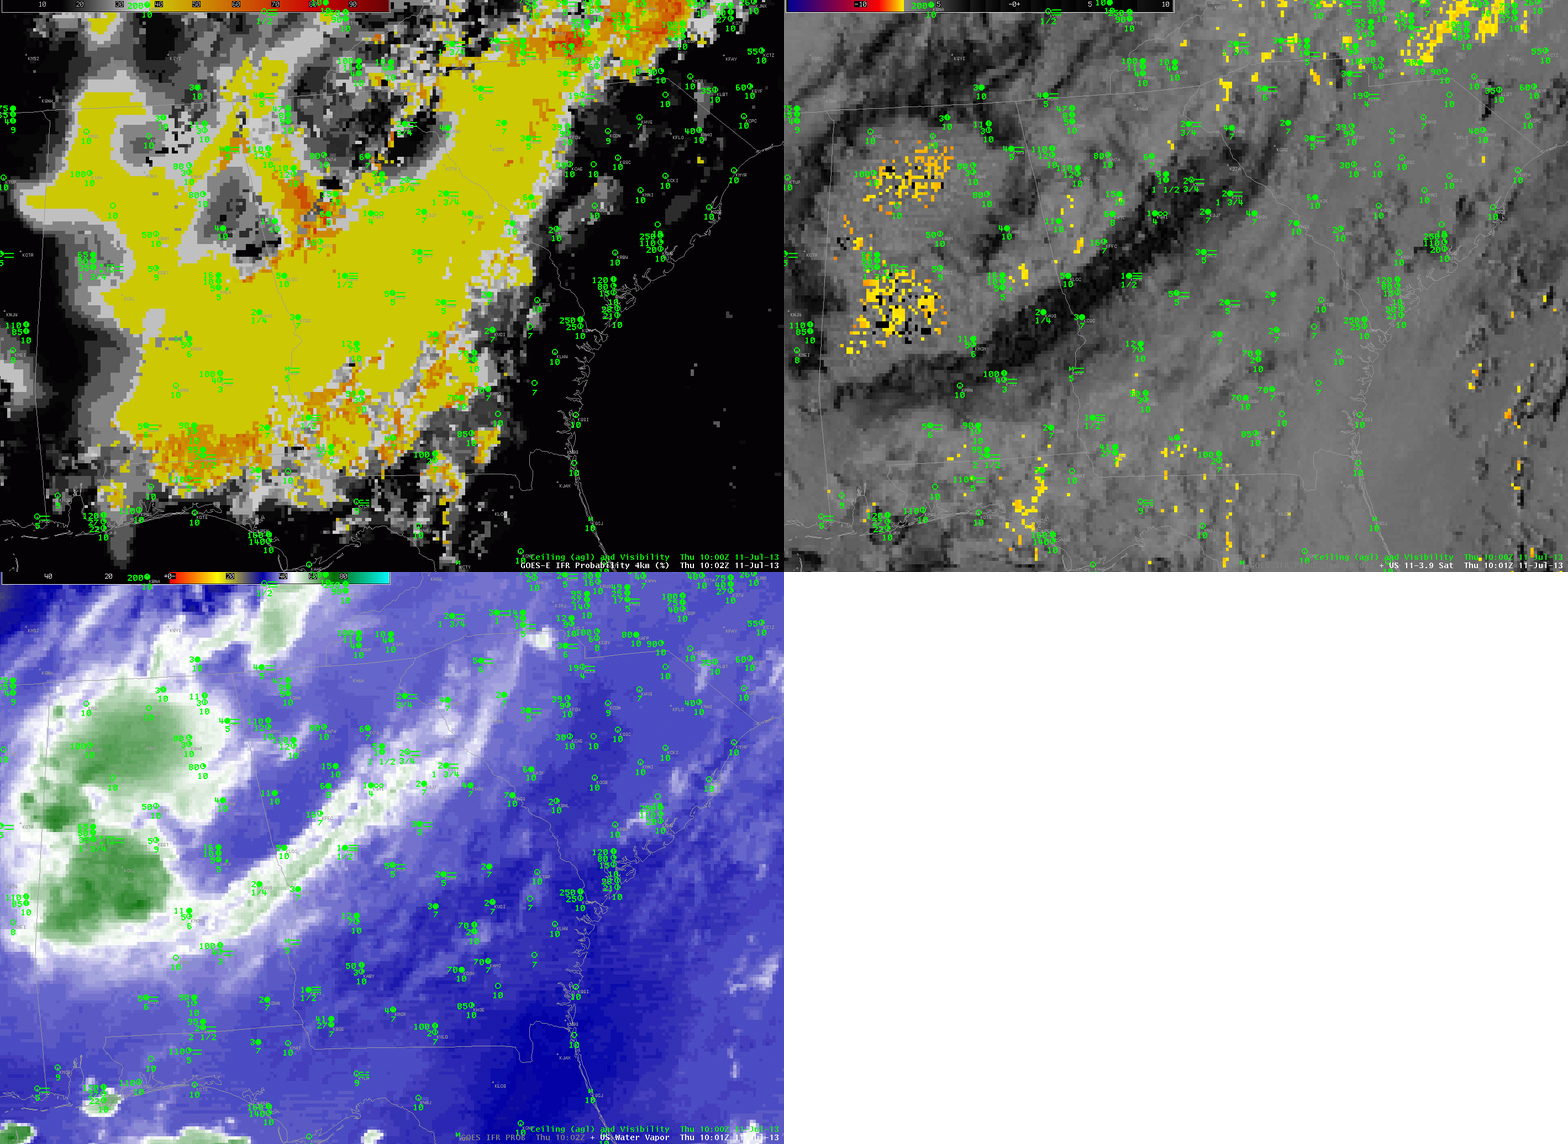
| Animation of GOES-East Water Vapor Imagery (6.7 µm), Brightness Temperature Difference Product (10.7 µm – 3.9 µm) and GOES-R IFR Probability computed with GOES-East data, 1000 UTC on 11 July 2013 |
The satellite animation, above, shows ample evidence of multi-layered clouds over Georgia and surrounding states, in a region where ceilings and visibilities approached/exceeded IFR conditions. The traditional method of determining regions of fog/low stratus — the brightness temperature difference between the 10.7 µm and 3.9 µm channels — gives no information here because low clouds are screened by higher ice-phase clouds.
GOES-R IFR Probability fields merge information from GOES Imager data and the Rapid Refresh Model. Even if GOES Imager data gives little information, GOES-R IFR Probability fields will give valuable information because they are also use information from the Rapid Refresh model. Because the IFR Probability fields don’t include satellite data, probabilities are lower. The large region of yellow — IFR Probabilities around 40% — sits over many stations that are reporting IFR conditions. Note how IFR Probabilities are higher over North Carolina where satellite data are being used in the computation of the field — but there are fewer reports there of IFR conditions (despite the higher probability). Temper the interpretation of the IFR Probabilities with knowledge of what is being used to compute them.
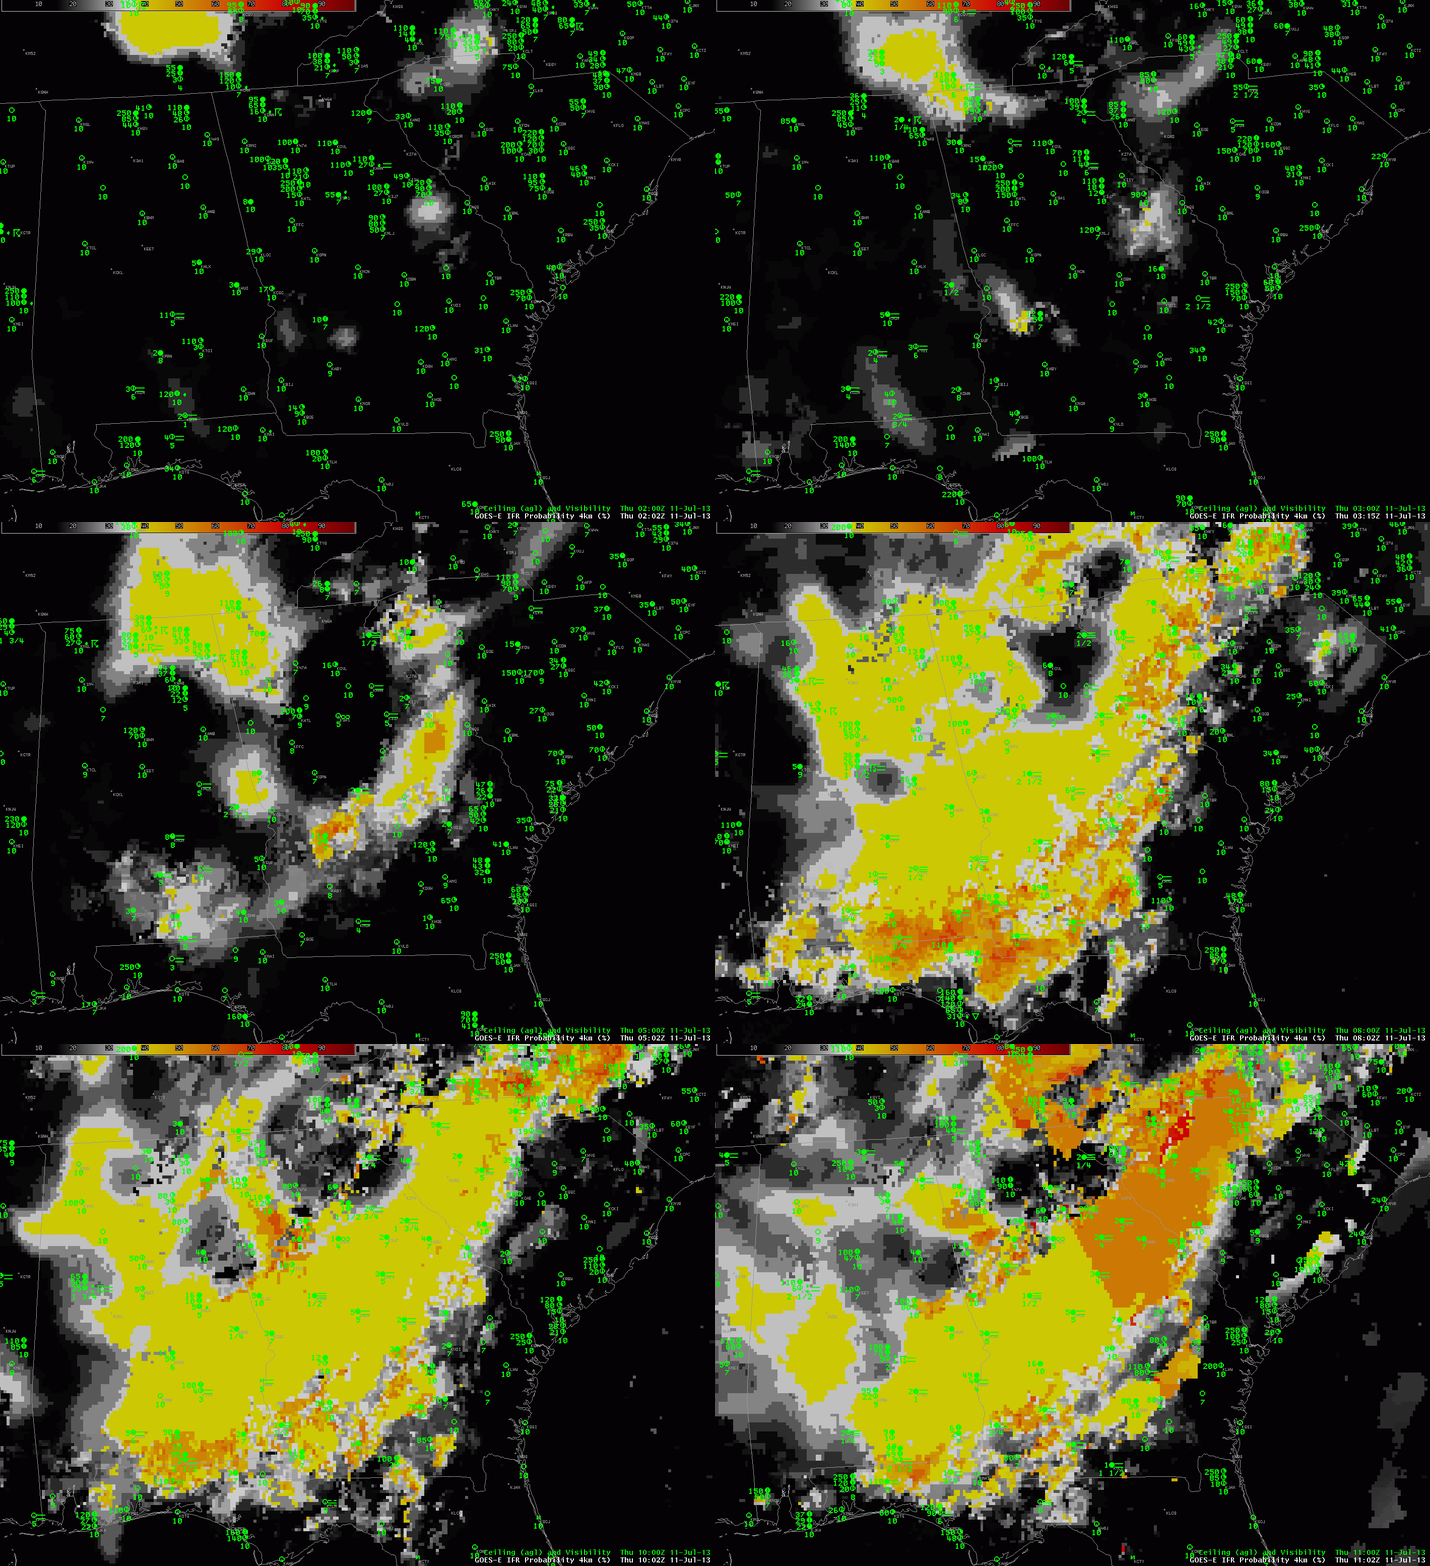
The evolution of IFR Probability fields can give a Head’s Up to deteriorating conditions in the atmosphere. Note in the hourly animation below how probabilities initially do increase over regions that subsequently have IFR or near-IFR conditions. At the end of the animation, there is an obvious boundary between different probabilities over northeast Georgia (Orange values around 55%) and western Georgia (values around 40%). That southeast-to-northwest boundary shows where nighttime predictors are being used (to the west) vs. daytime predictors (to the east) in the computation of IFR Probabilities.
 |
| GOES-R IFR Probabilities (hourly) from 0200 through 1100 UTC, 11 July 2013 |
