 |
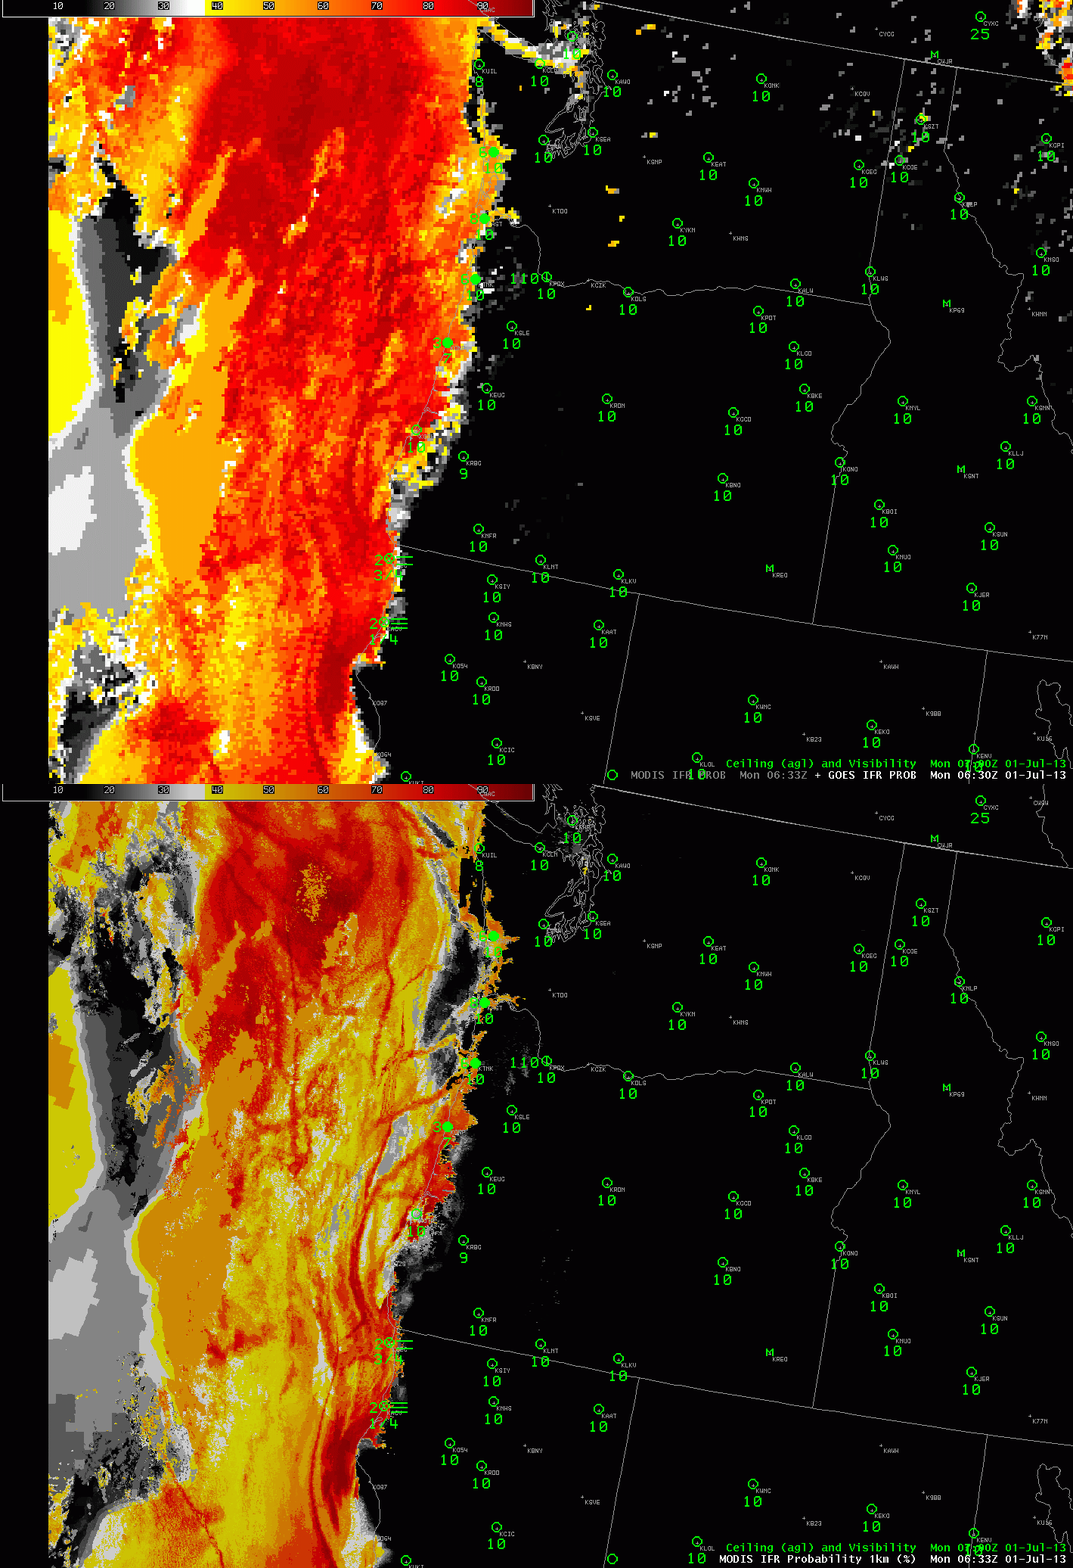
| Toggle between MODIS-based and GOES-West-based IFR Probabilities, ~0630 UTC 01 July 2013 |
The high-resolution MODIS data likely gives a more accurate interpretation of visibility obstructions near the surface because it better resolves the sharp edges to fog/low stratus that can occur along the west coast of the United States, as exemplified by this scene centered on Oregon. Look at North Bend, OR, for example. In a hole in the MODIS field, but with relatively high probability in the GOES field. The MODIS field also highlights ship fields in the stratus deck off the coast.
MODIS data is useful for high spatial resolution, but the temporal resolution at one point is not good. The swath width on Suomi-NPP is wide enough, however, that sometimes two sequential polar passes will overlap over the northern United States, giving a 90-minute time-step with high-resolution data.
 |
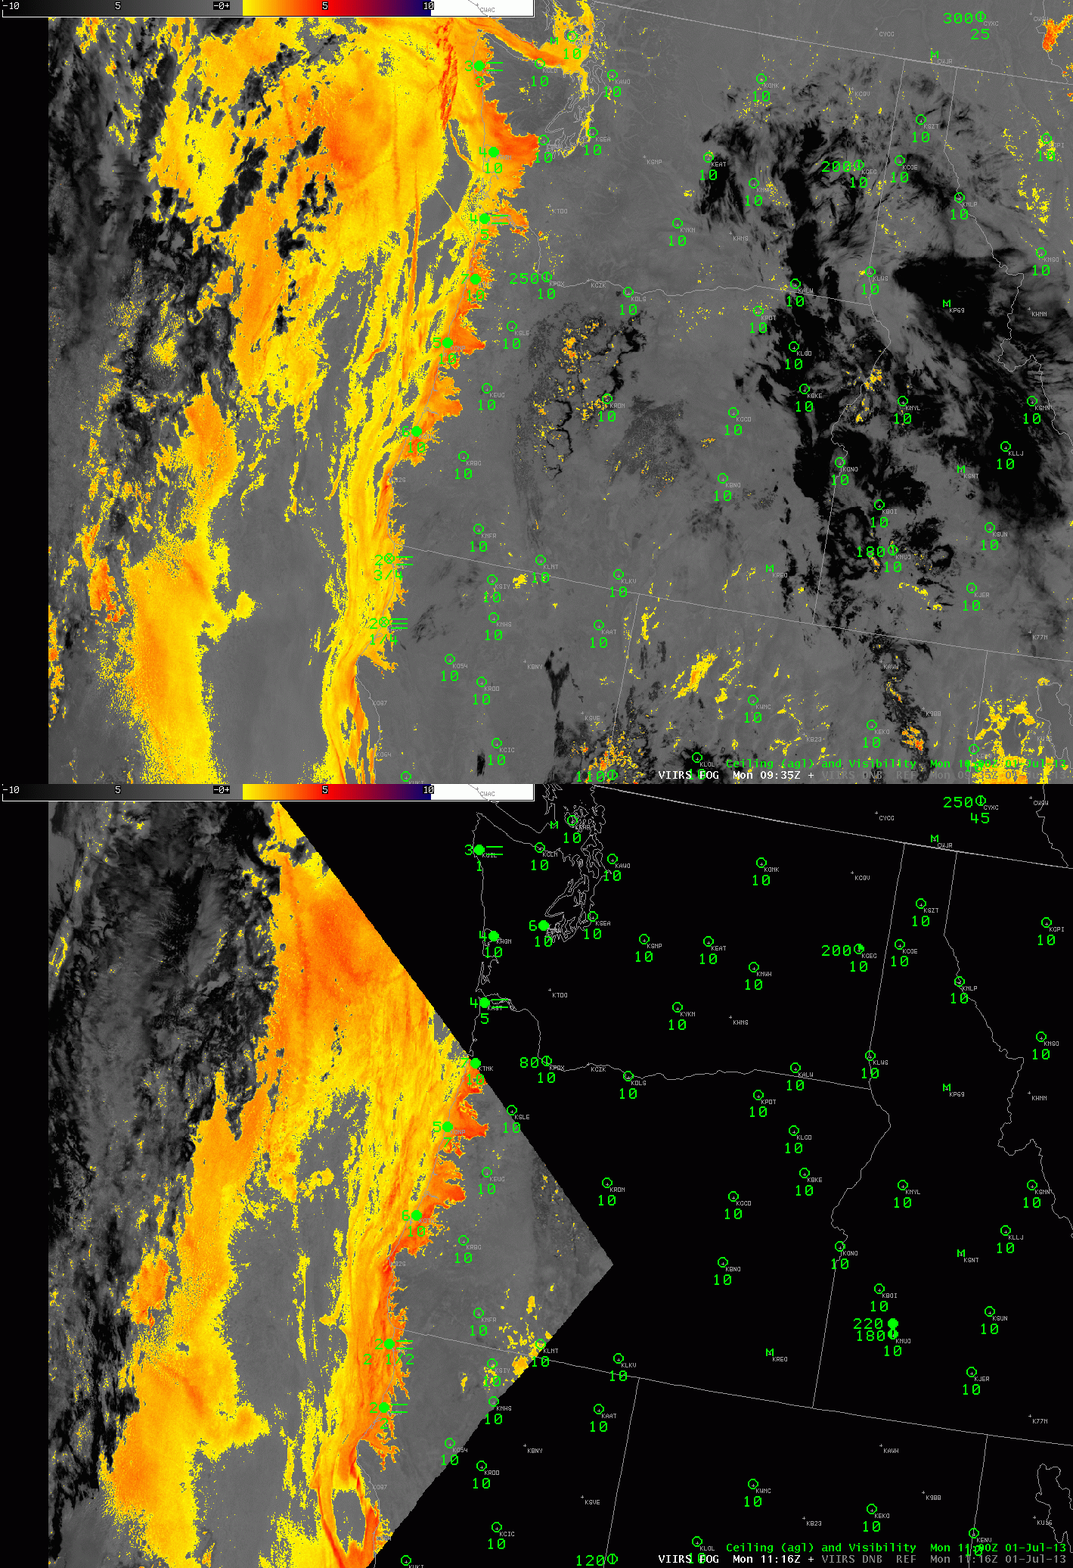
| Brightness Temperature Difference, 11 – 3.74 from VIIRS data on Suomi/NPP. |
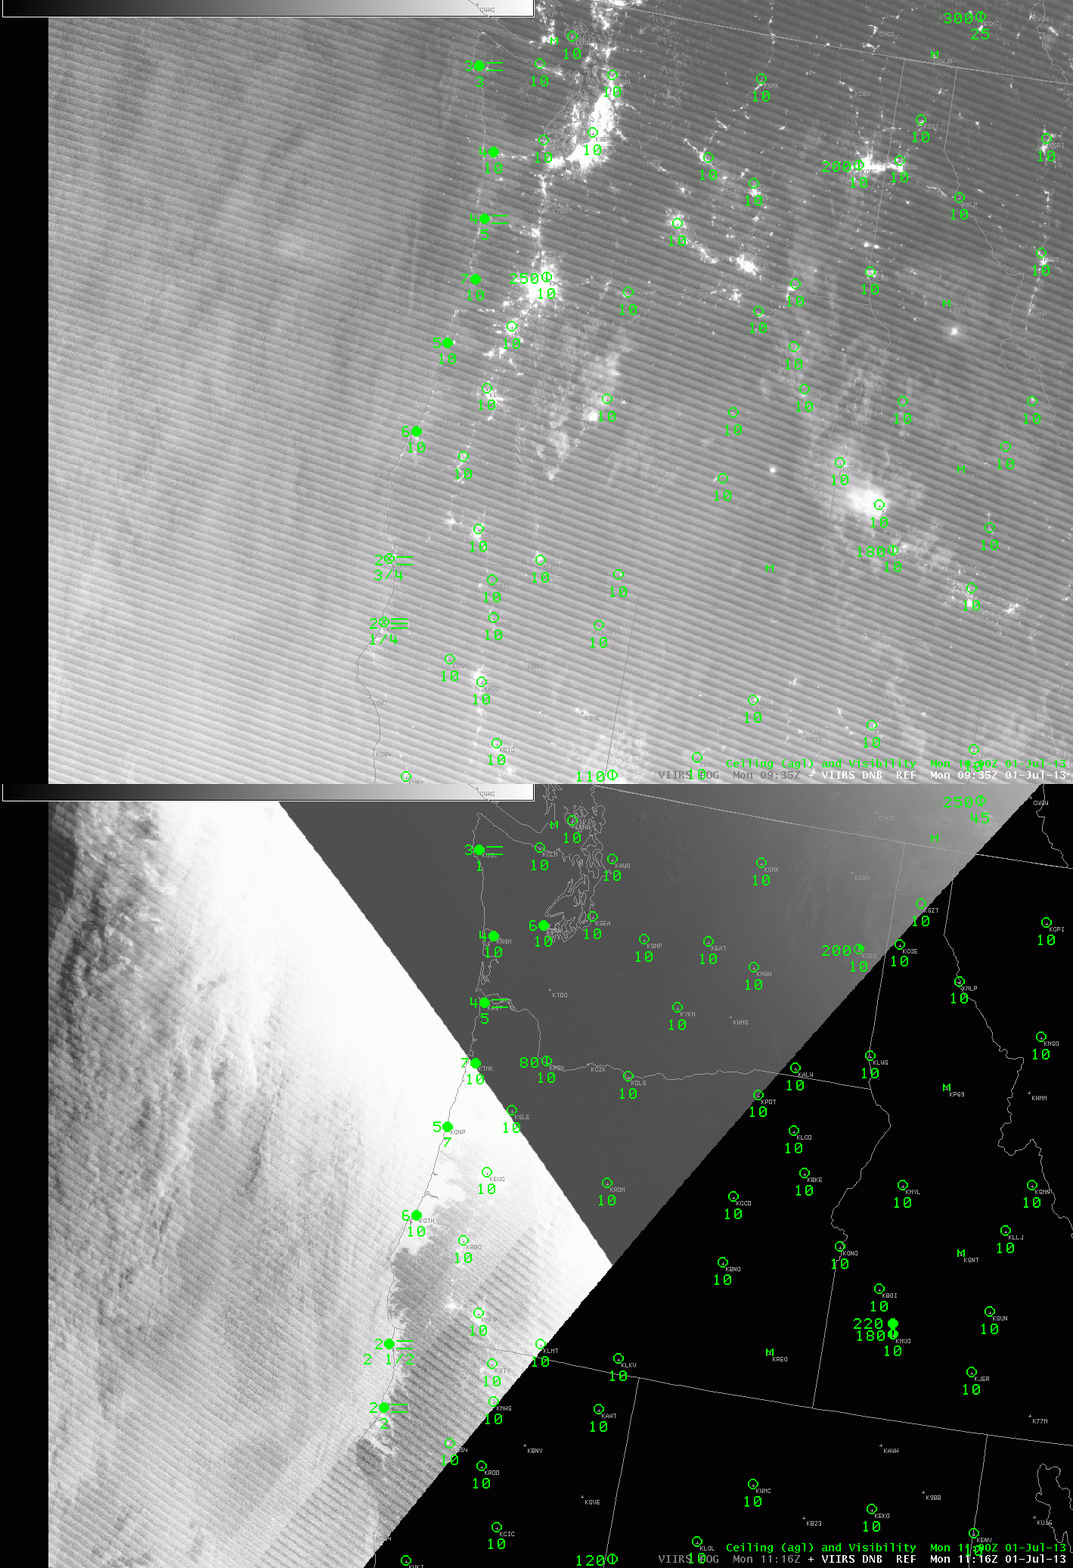
The animation above shows how the low clouds, as detected using the Brightness Temperature Difference between 3.74 and 11 channels from VIIRS, are moving inland btween 0935 and 1116 UTC on 1 July. The brightness temperature difference also shows a general increase offshore, so the likelihood of any breaks in the low clouds is decreasing. The Day/Night band imagery shows a similar change in low clouds along the coast, although the view is somewhat obscured because this region is in the stray light zone (that is, the satellite is illuminated by the sun even though it is over a region where it is still night).
 |
| Day/Night band imagery along the west coast, 0935 and 1116 UTC on 1 July |
 |
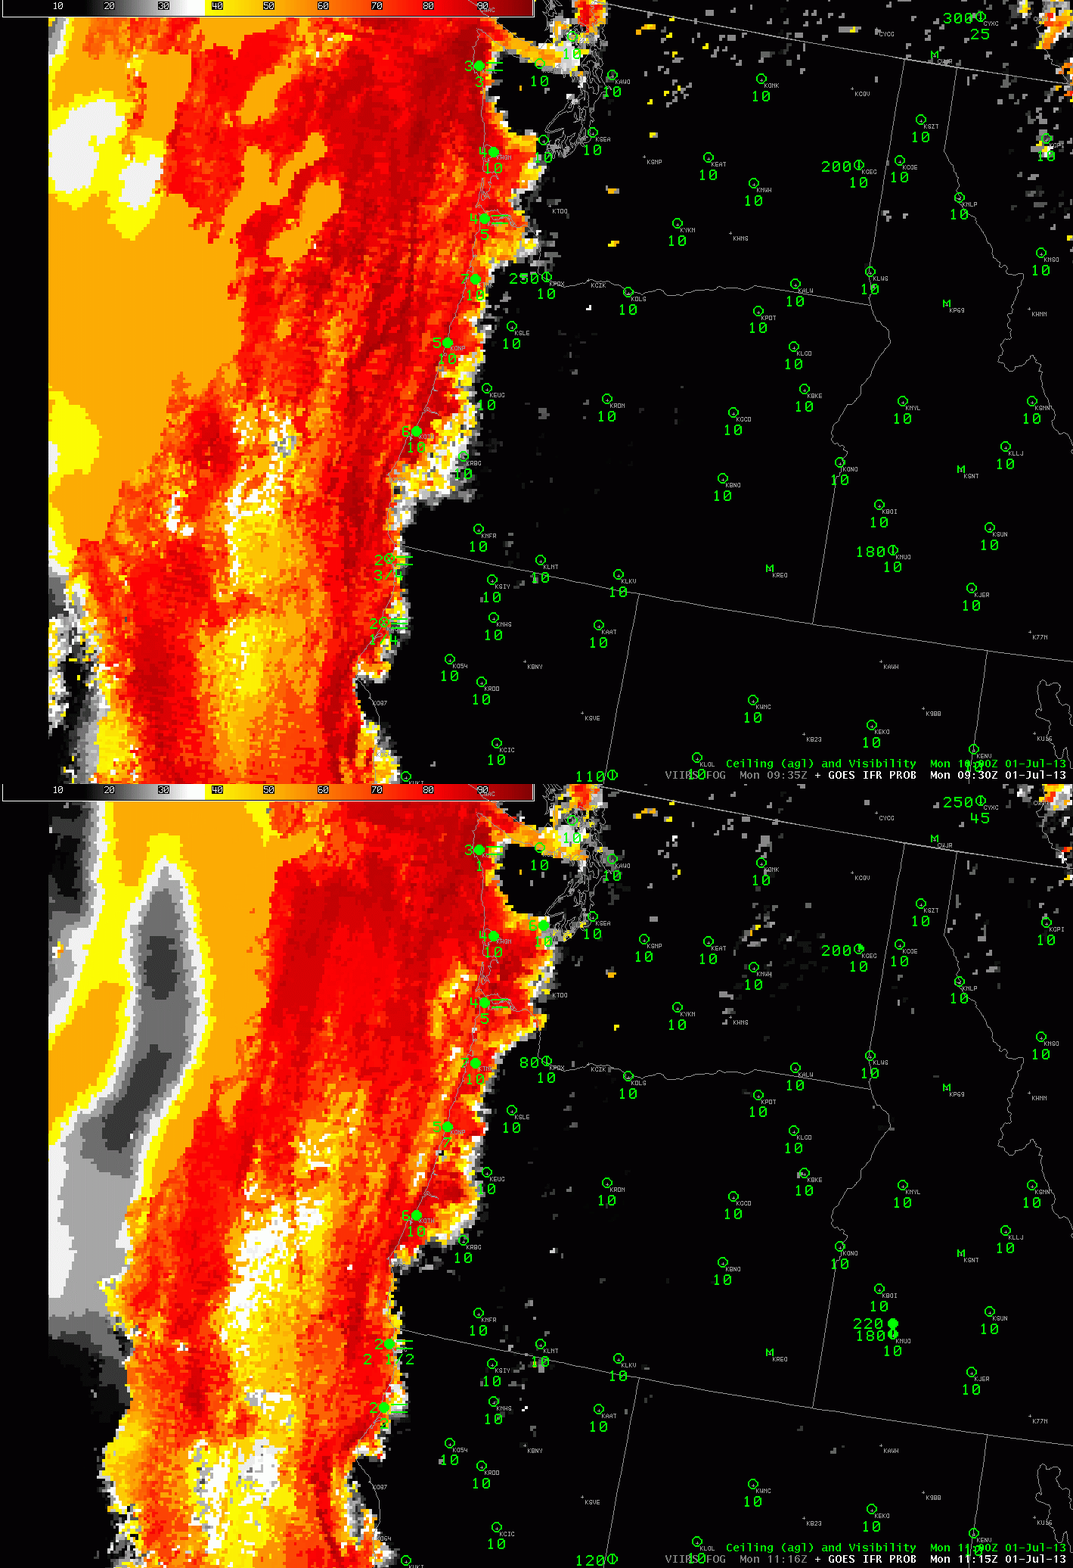
| GOES-R IFR probabilities, 0930 and 1115 UTC, 1 July 2013 |
GOES-R Probabilities computed from the GOES-West imager also show an expansion in the region where IFR probabilities are highest. Thus, the expansion in low clouds detected by the VIIRS instruments on Suomi/NPP likely corresponds an increase in the area with lowered visibilities.
