 |
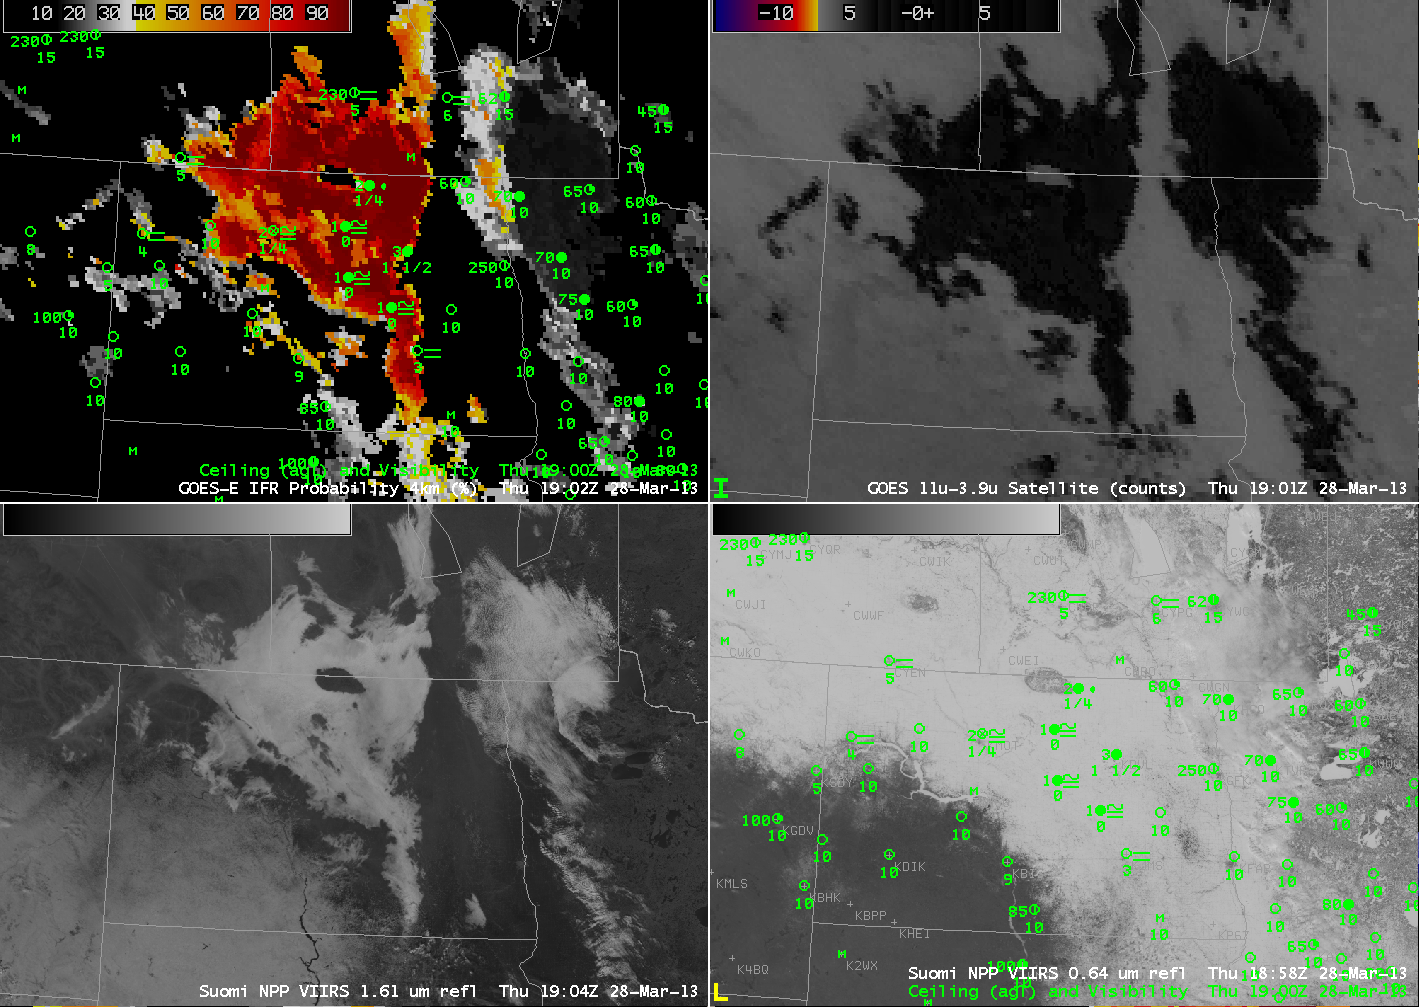
| GOES-R IFR Probabilities computed from GOES-East (Upper Left), GOES Brightness Temperature Difference (10.7 µm- 3.9 µm ) (Upper Right), Suomi/NPP 1.61 µm Reflectivity (Lower Left), Suomi/NPP Visible Imagery (0.64 µm) (Lower Right) |
Snow cover in Spring promotes the development of advection fogs when relatively moist air moves over the snowpack and is cooled to its dewpoint, saturating. But snowcover is also white when viewed from Satellite, and its presence makes the detection of fog areas difficult. There are several products that can be used to distinguish between white snow and white clouds, and products that can be used to refine further the difference between stratus decks and fogbanks.
In the imagery above, Suomi/NPP 1-km resolution visible (0.64 µm) data in the bottom right figure show a large region of both clouds and snow over the North Dakota and surrounding US States and Canadian Provinces. It is very difficult to find the cloud edges that are there. The 1.61 µm imagery from Suomi/NPP is very helpful in screening out imagery of snow on the ground. Water clouds are far more effective at reflecting radiation at wavelengths around 1.61 µm than snow or ice (snow and ice both strongly absorb radiation at that wavelength). Thus, in the bottom left figure, the 1.61 µm reflectivity detected by Suomi/NPP, areas of snow appear dark and areas of water-based clouds are white. This tells you where water clouds exist, but nothing about how high above the surface those water clouds are. The brightness temperature difference product from GOES (10.7 µm – 3.9 µm) also highlights in dark regions of water-based clouds, but as with the 1.61 µm reflectivity does not give information about cloud bases.
The GOES-R Fog/Low Stratus IFR Probability neatly distinguished between the stratus deck over western Minnesota (that is not accompanied by IFR conditions at the surface) from the cloudy region over central and northern North Dakota that is accompanied by IFR conditions at the surface, as shown in the plotted observations. (Thanks to Chad Gravelle for noticing this case today!)