 |
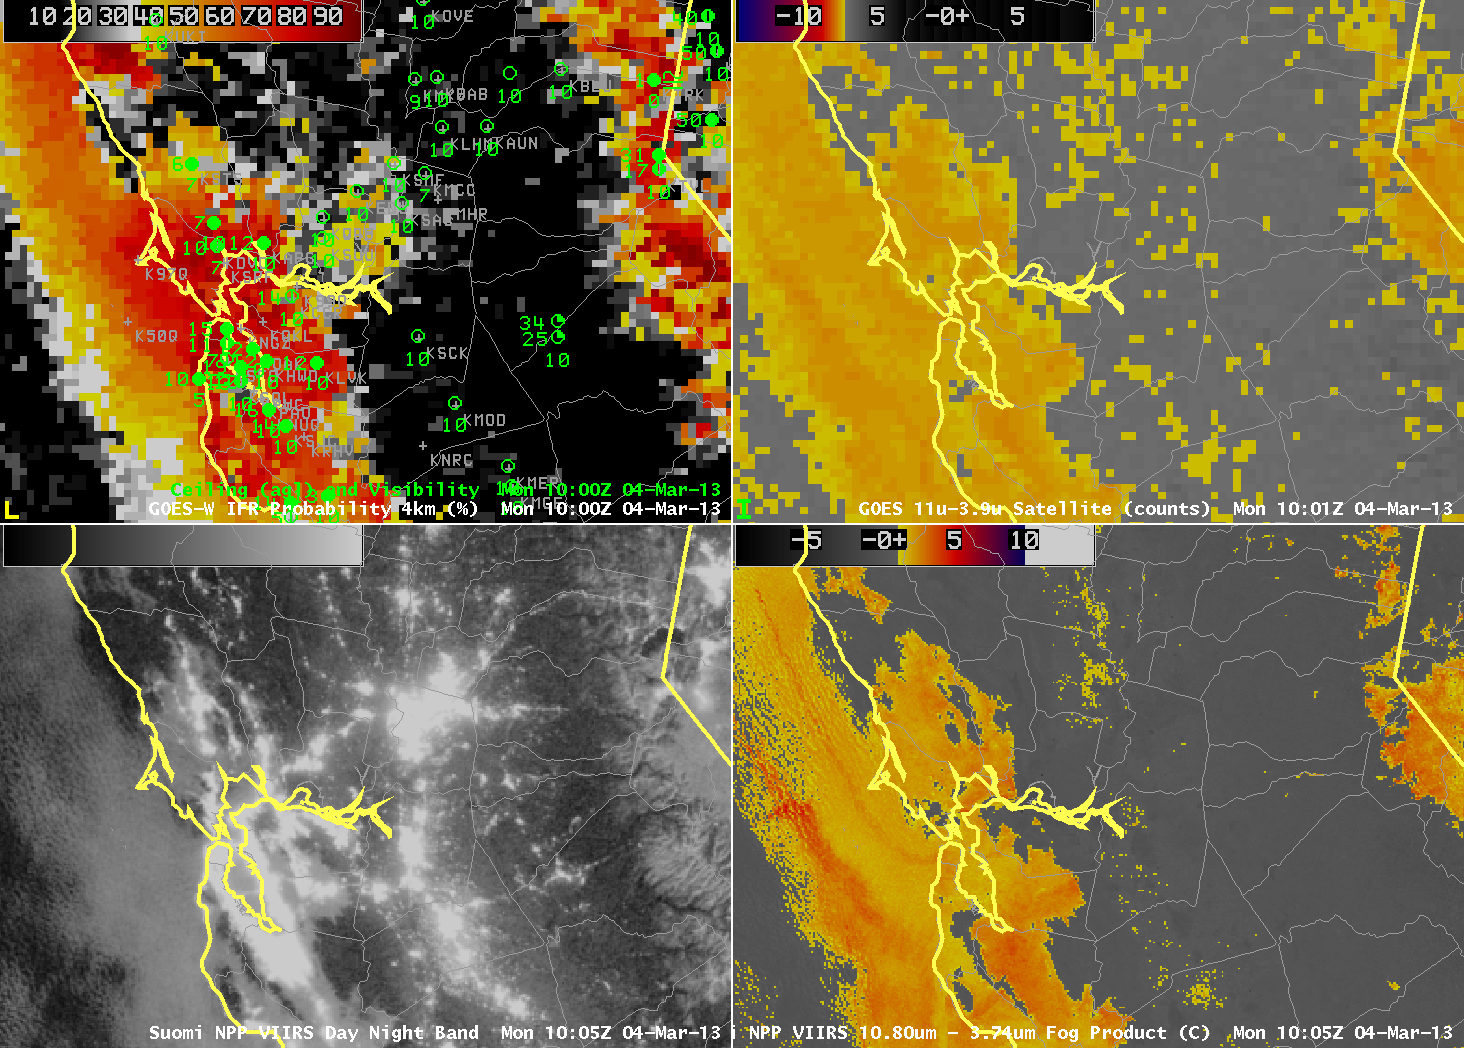
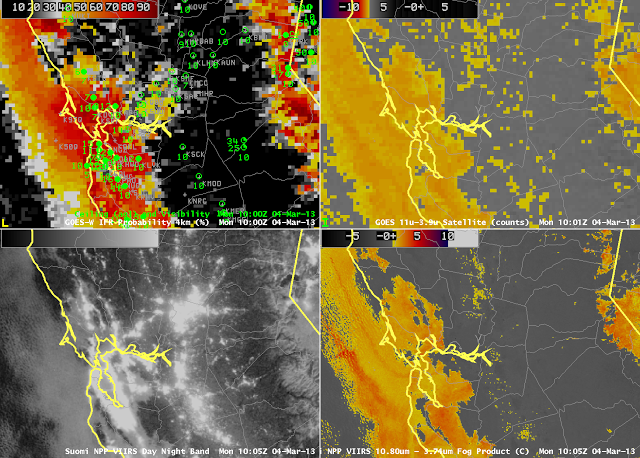
| GOES-R IFR Probabilities computed from GOES-West (Upper Left), GOES-West Brightness Temperature Difference (10.7 µm – 3.9 µm) (Upper Right), Suomi/NPP VIIRS Day/Night Band (Lower Left), Suomi/NPP VIIRS Brightness Temperature Difference (10.8 µm- 3.74 µm) (Lower Right), all images near 1000 UTC on March 4 2013. |
A high-impact fog event on March 1st led to a Group Stop at SFO International. The synoptic conditions that supported fog development on 1 March (Images from 1 March are shown at the bottom of this blog post) persisted through the weekend along the West Coast, and fog was again observed on Monday morning, 4 March and the four images above show results from fog detection schemes for that date. The GOES-R Fog/Low Stratus IFR Probability field shows that the highest probability of IFR conditions is occurring where IFR and near-IFR conditions are observed. Note the benefits of the high-resolution Suomi/NPP VIIRS data. Sharp edges to the low cloud field are ably captured in central Santa Clara County. There are also benefits to using the near infrared and infrared channels to detect regions of low clouds in urban areas, where bright lights can dazzle the Day/Night band so that small breaks in the clouds, as detected just south and west of southern San Francisco Bay, cannot be discerned in the visible. Compare the differences in the 1-km data from VIIRS to the nominal 4-km resolution of present GOES in the imagery above. Note also that the brightness temperature difference helps distinguish between snow and clouds over the Sierra Nevada.
 |
| GOES-R IFR Probabilities computed from GOES-West, hourly, from 0400 UTC to 1600 UTC on 4 March 2013 |
The animation, above, of GOES-R IFR Probabilities helps describe and define the region of evolving IFR conditions early on March 4th.
 |
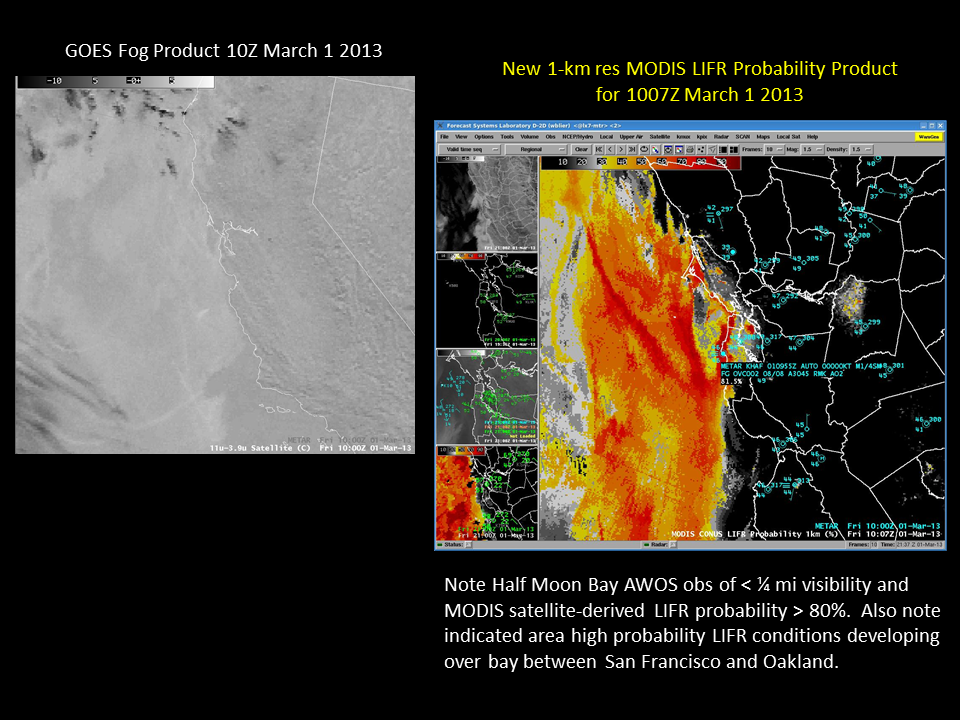
| Figures provided by Warren Blier, WFO MTR. |
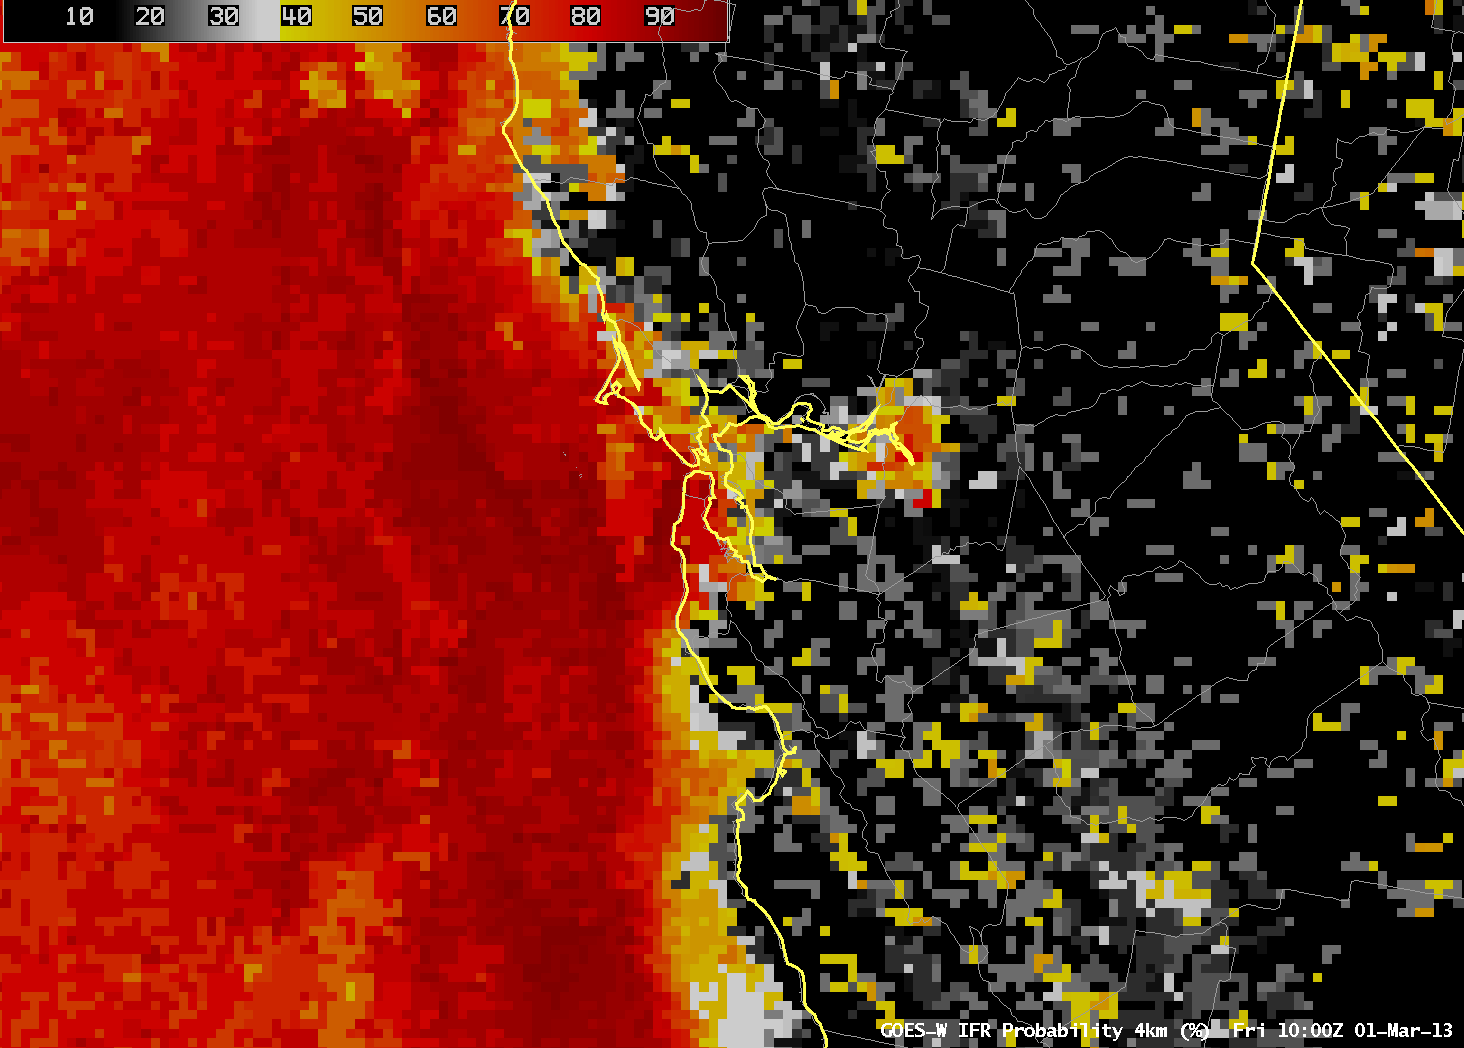
Warren Blier from NWS in MTR sent along an email about the event on March 1st. The screen capture above shows MODIS-based GOES-R IFR probabilities (on the right) compared with the GOES-West ‘traditional’ unenhanced brightness temperature difference. The higher spatial resolution of MODIS and of VIIRS really does pick up the details. The image below is the 1000 UTC image created using GOES-West data, and the comparison between the MODIS image above and the GOES image below shows the power of MODIS resolution.
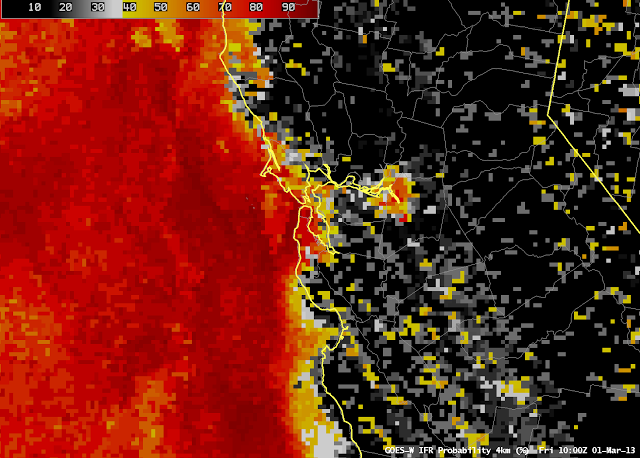 |
| GOES-R IFR Probabilities computed using GOES-West data, 1000 UTC on 1 March 2013 |
|
An animation of GOES-R IFR probabilities from 0000 through 1600 UTC on 1 March shows the highest IFR probabilities increasing near SFO after 0900/1000 UTC on the first.
 |
| Hourly imagery of IFR probabilities computed from GOES-West, 0000 through 1600 UTC on March 1st |