Category Archives: Texas

Widespread IFR Conditions over the Plains

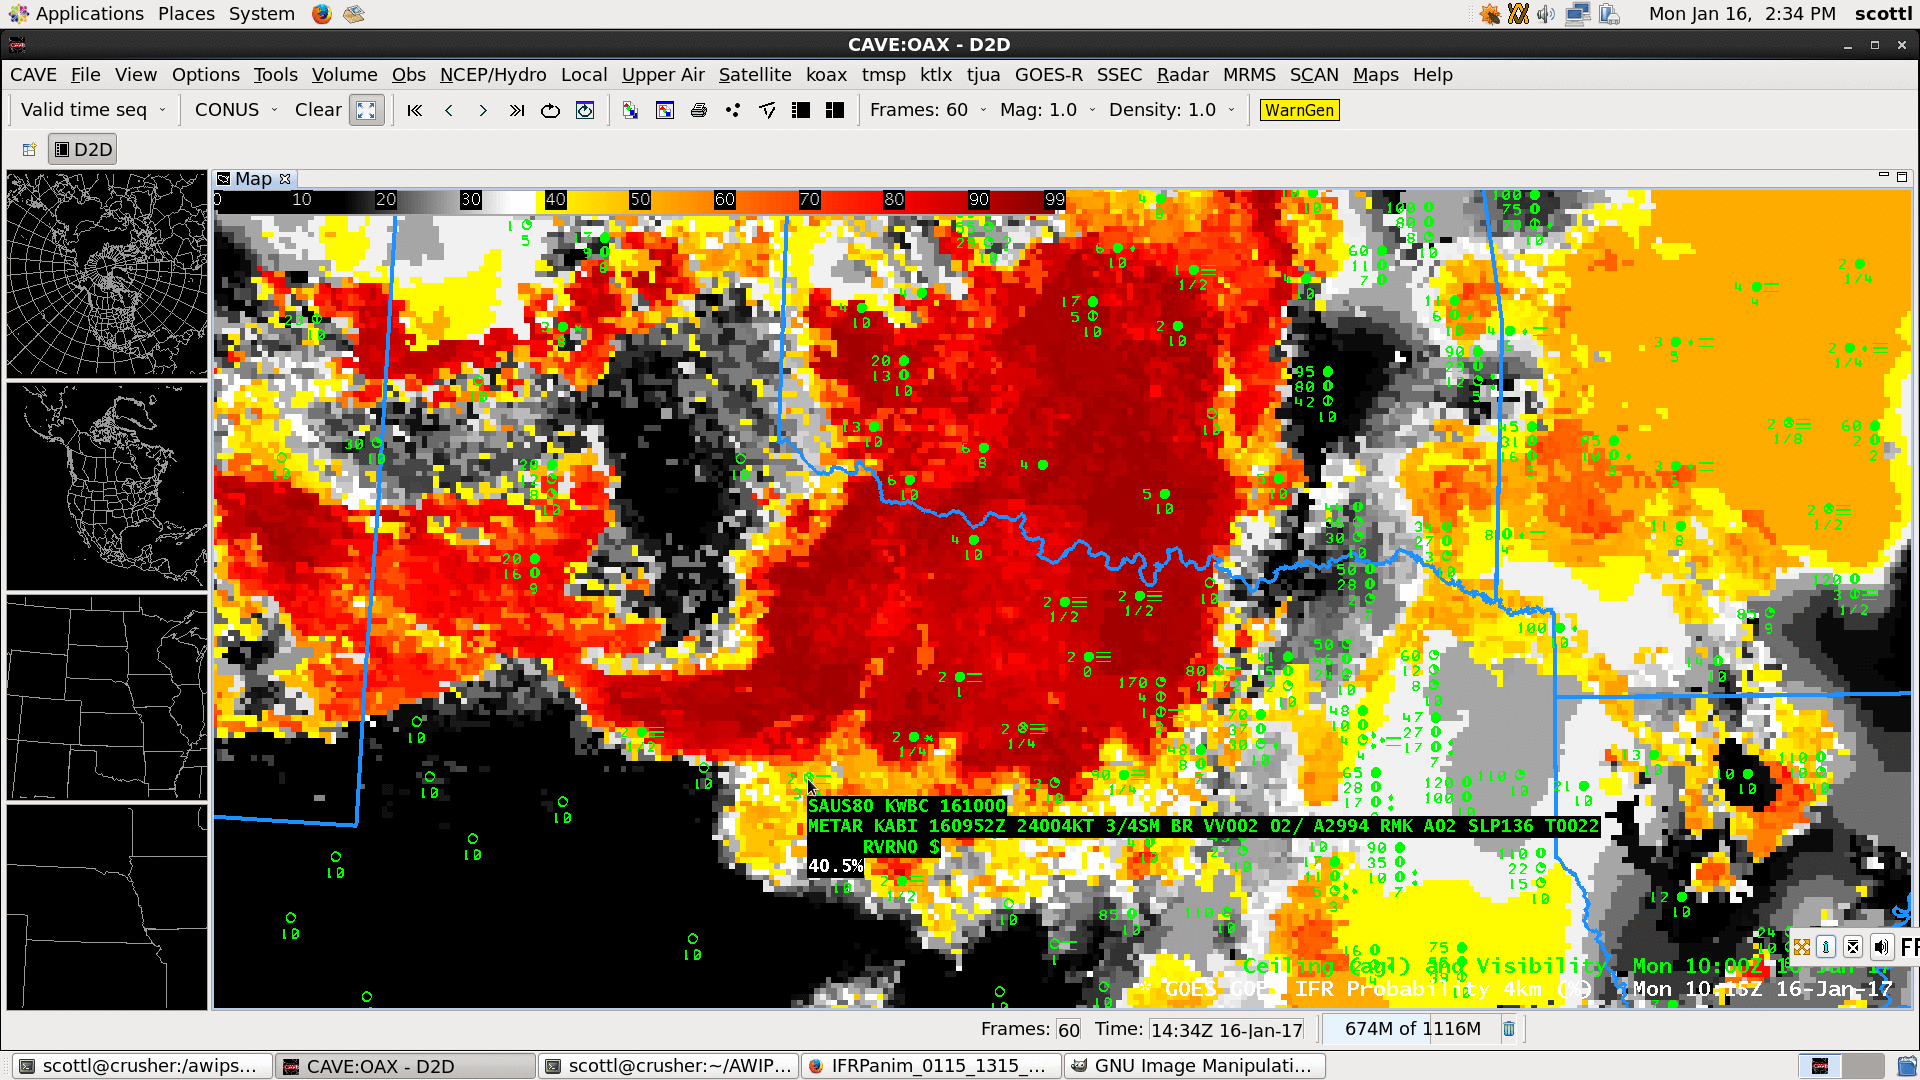
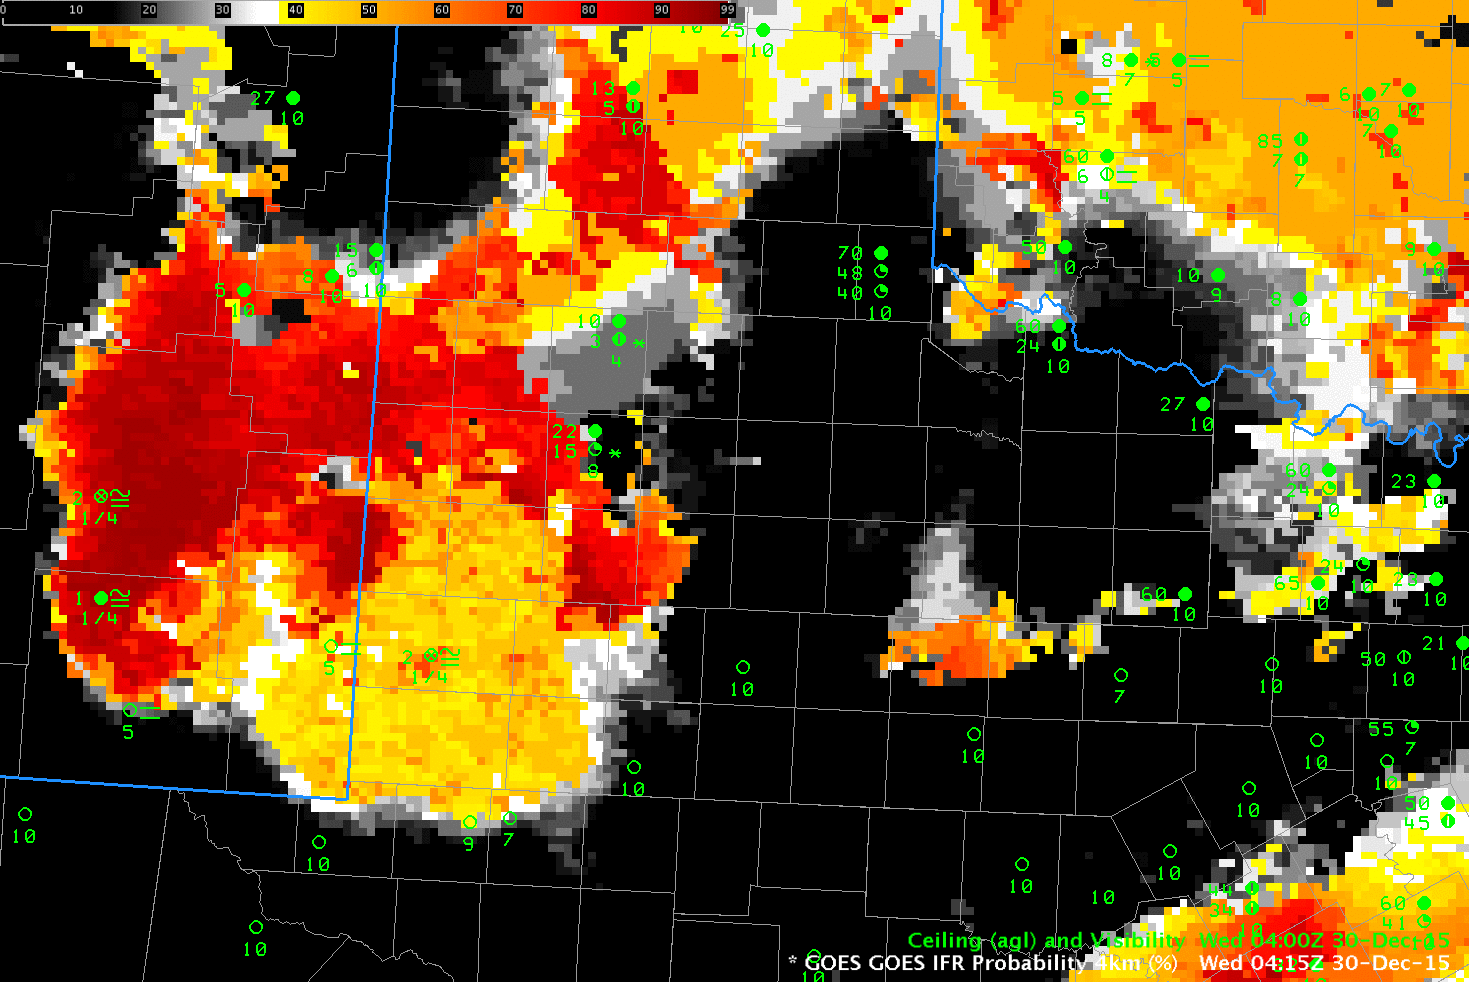
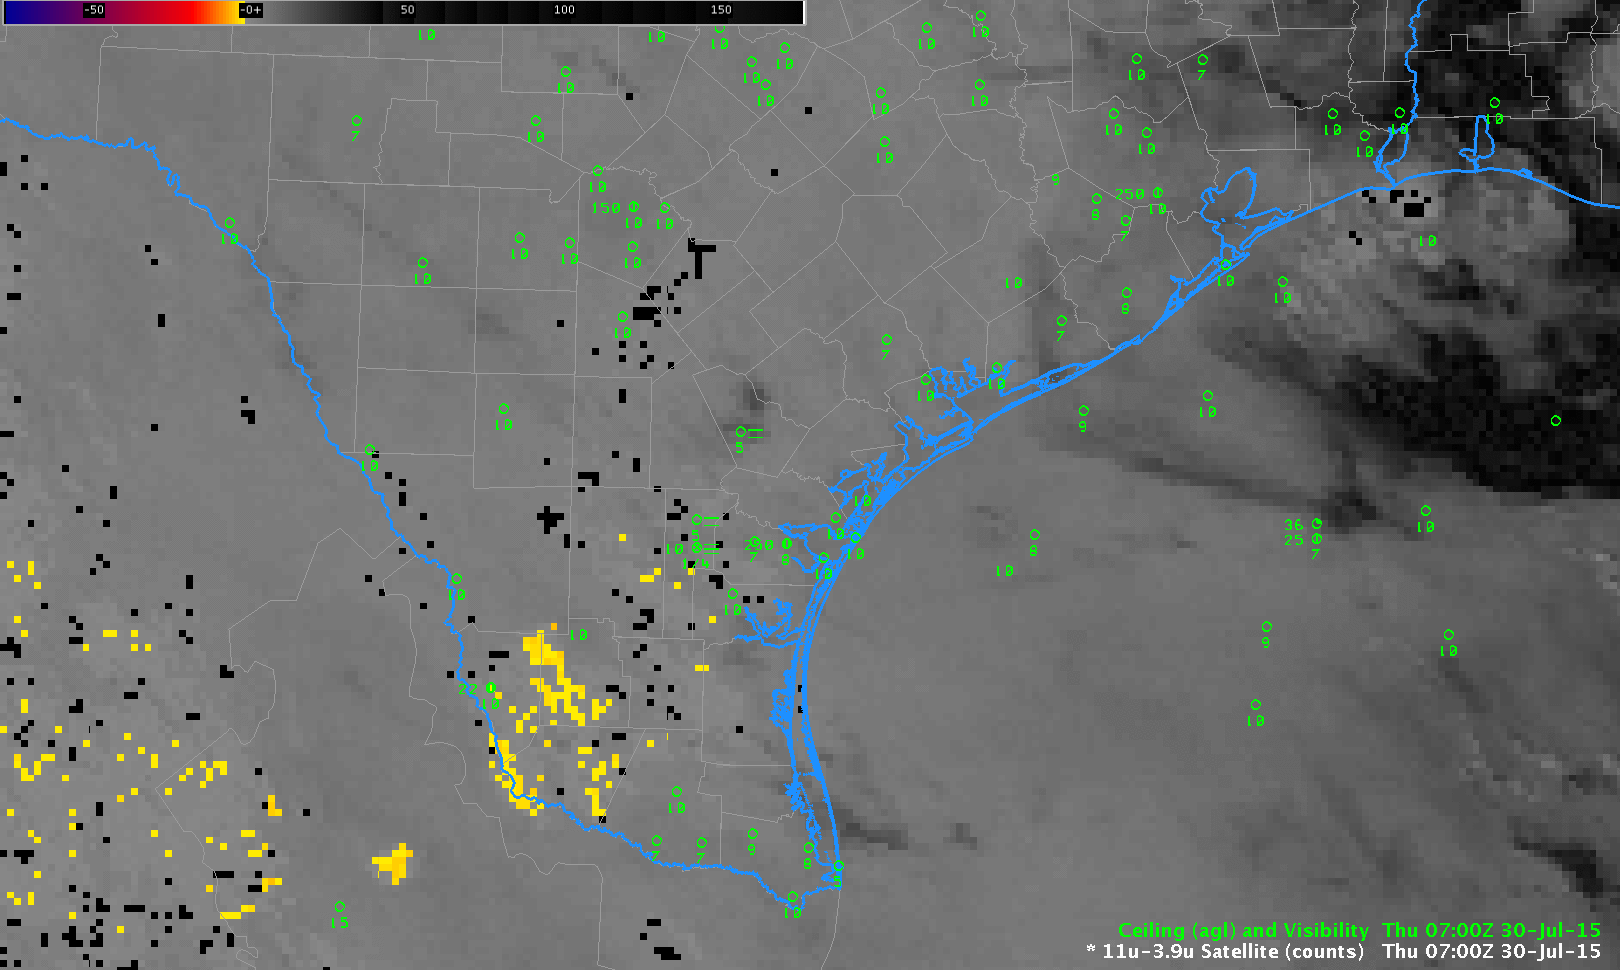
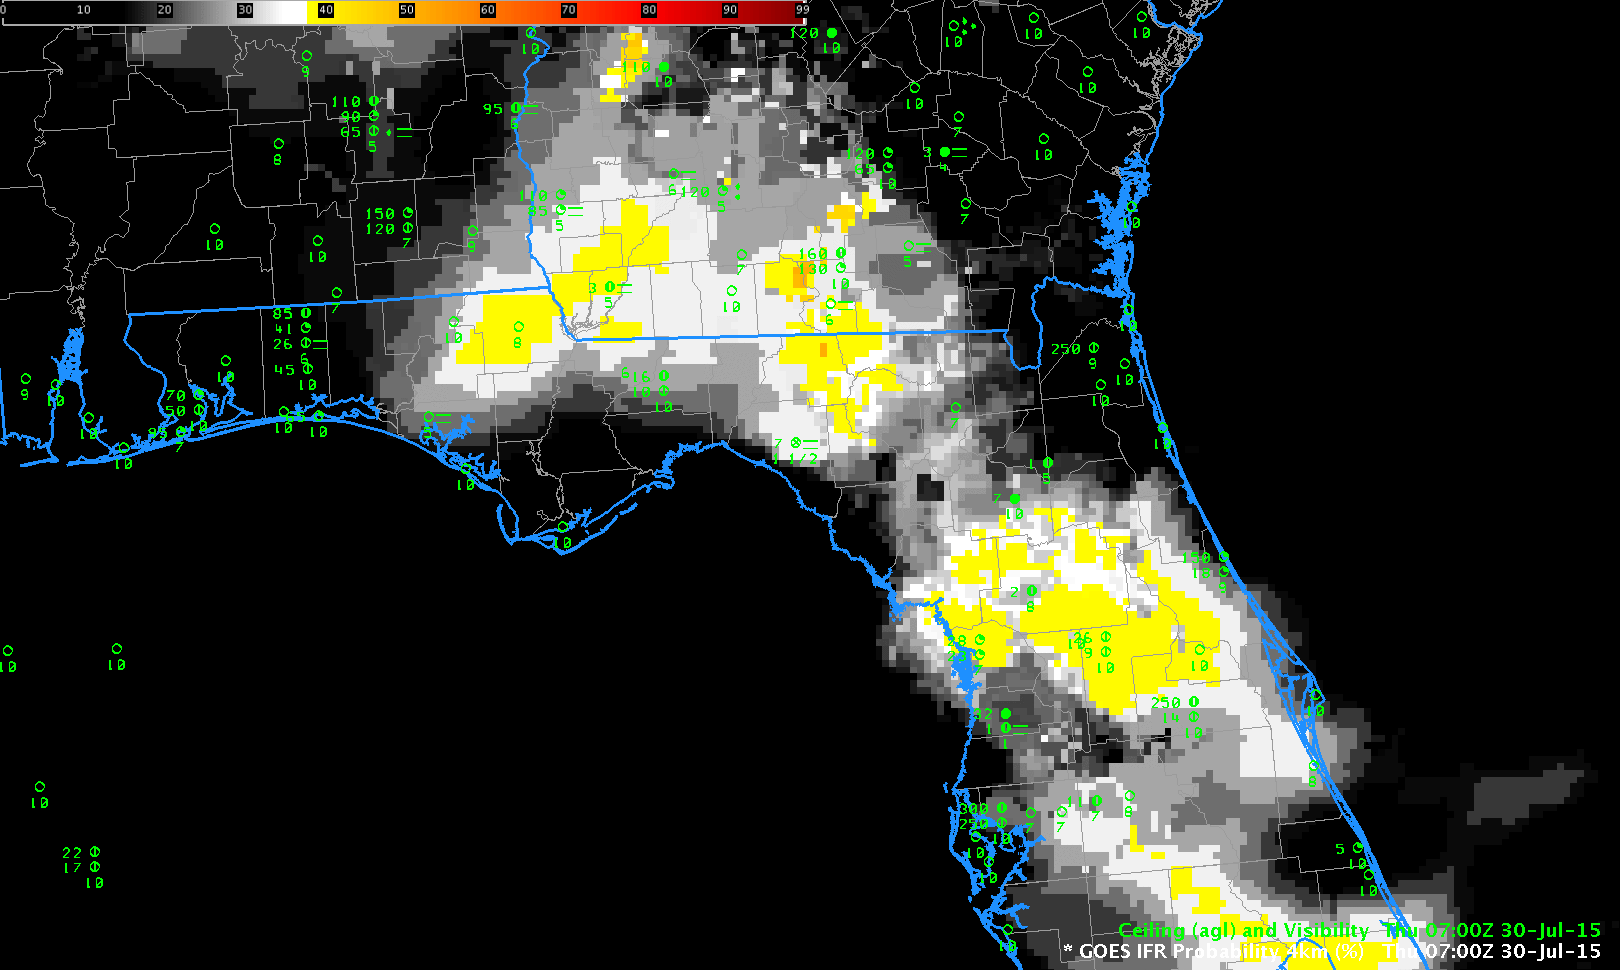
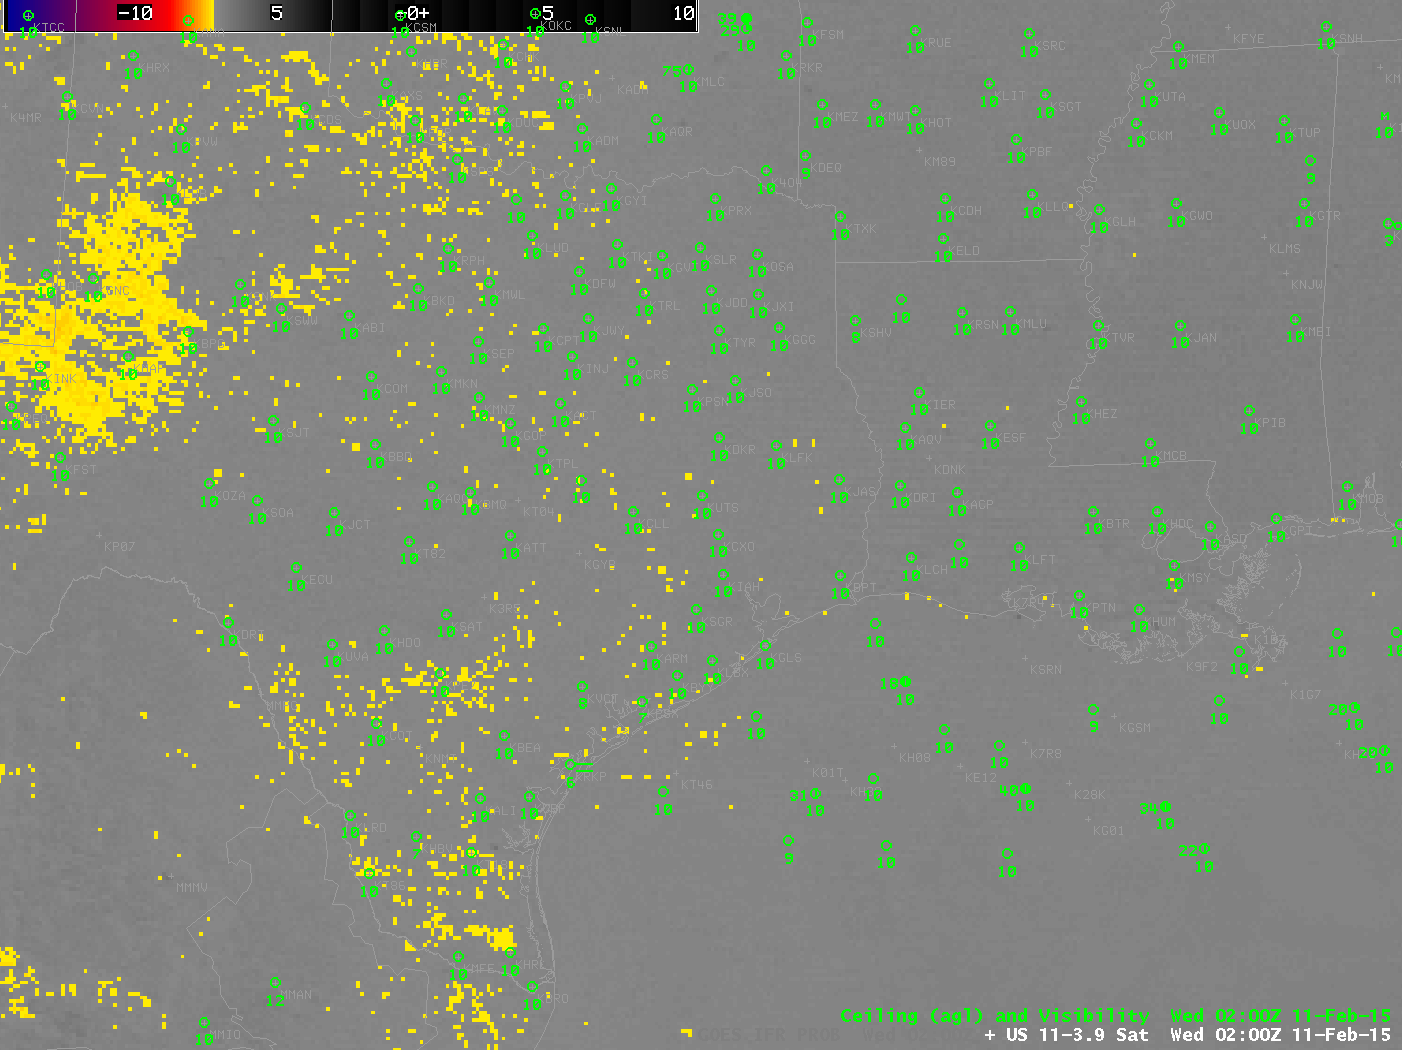
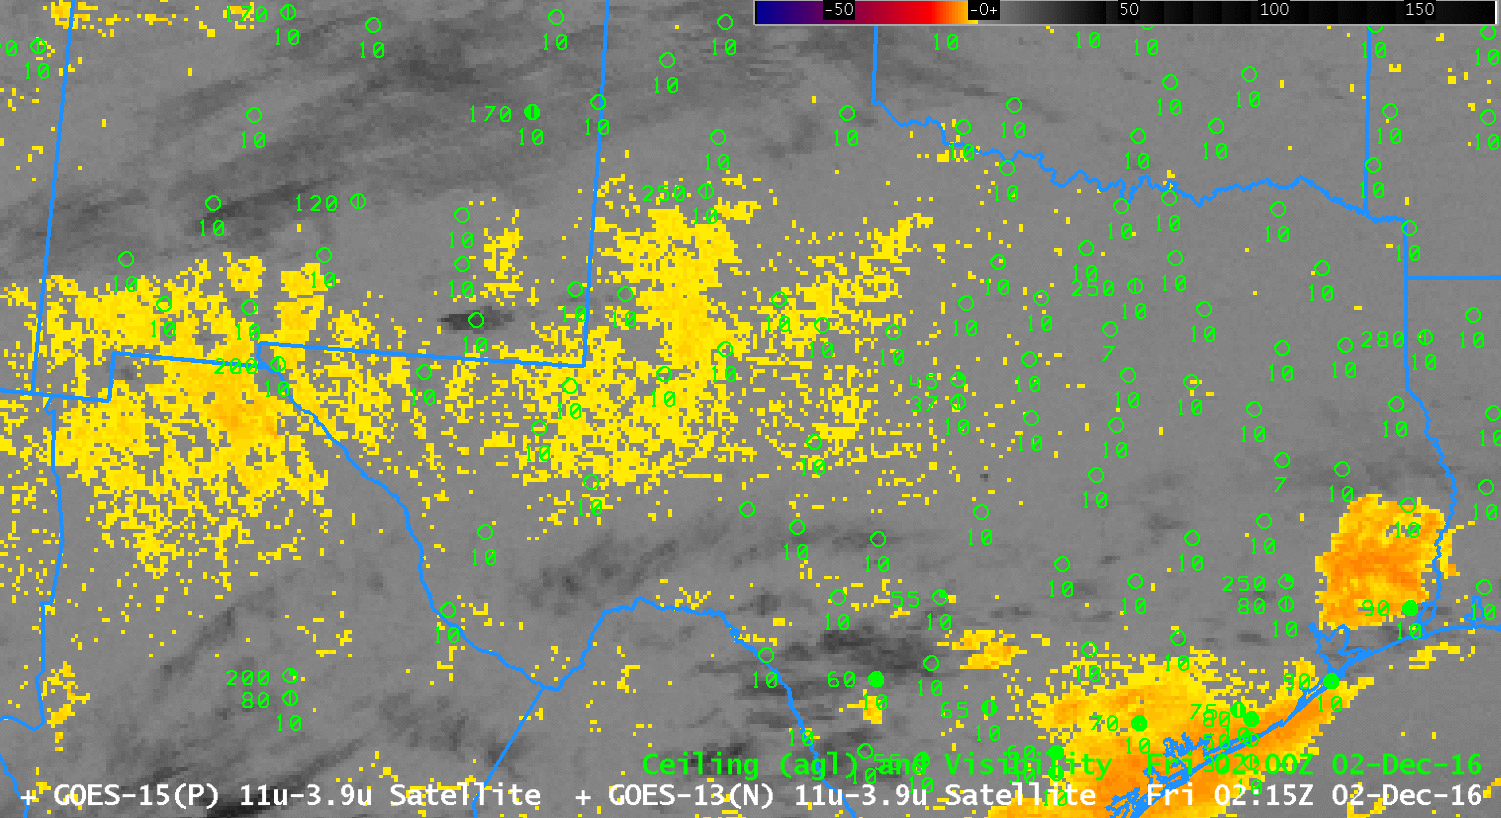
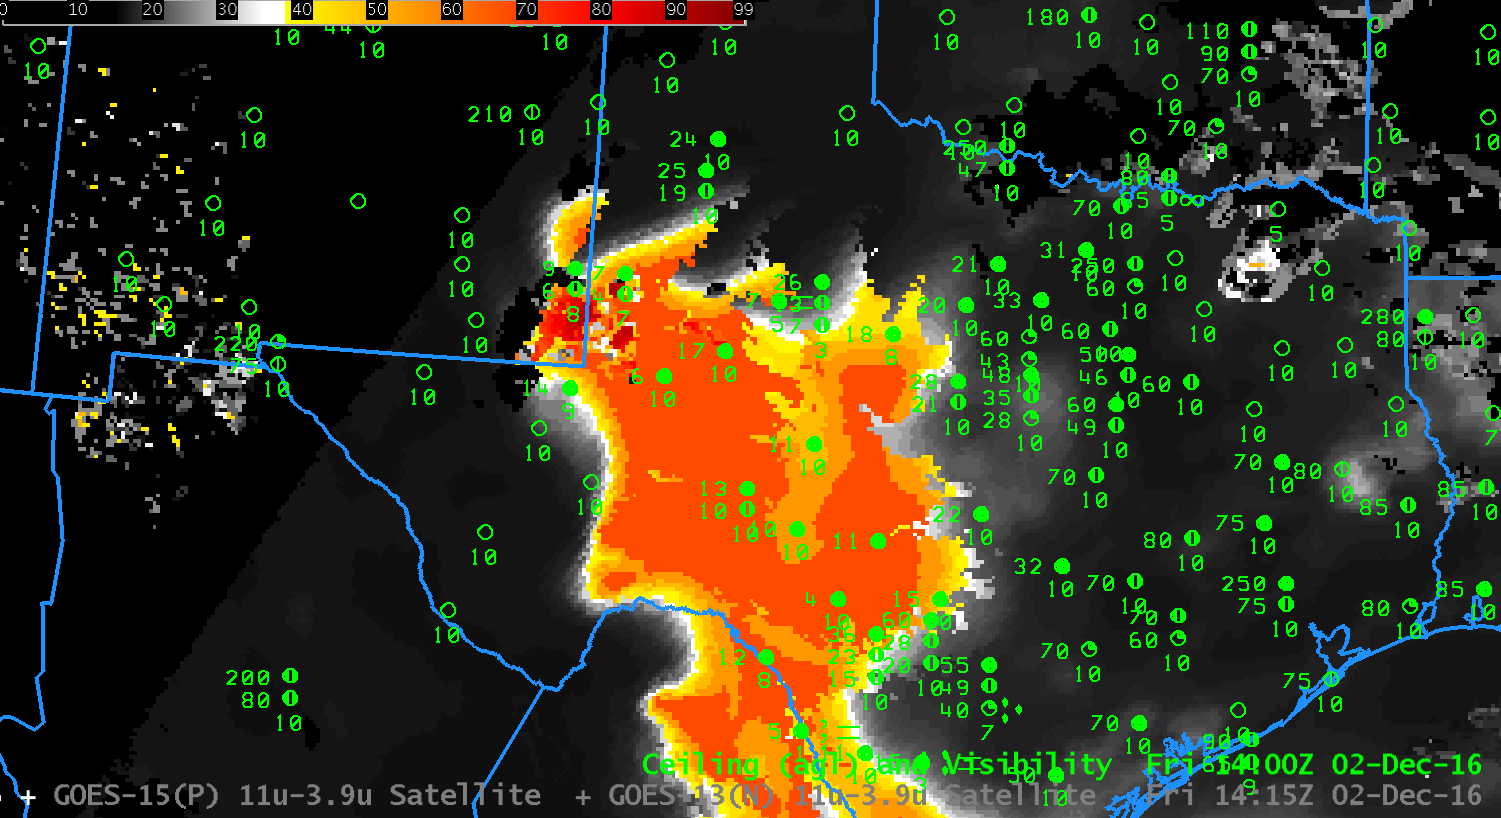
GOES-R IFR Probability Fields, hourly from 0115-1315 UTC (Click to enlarge)

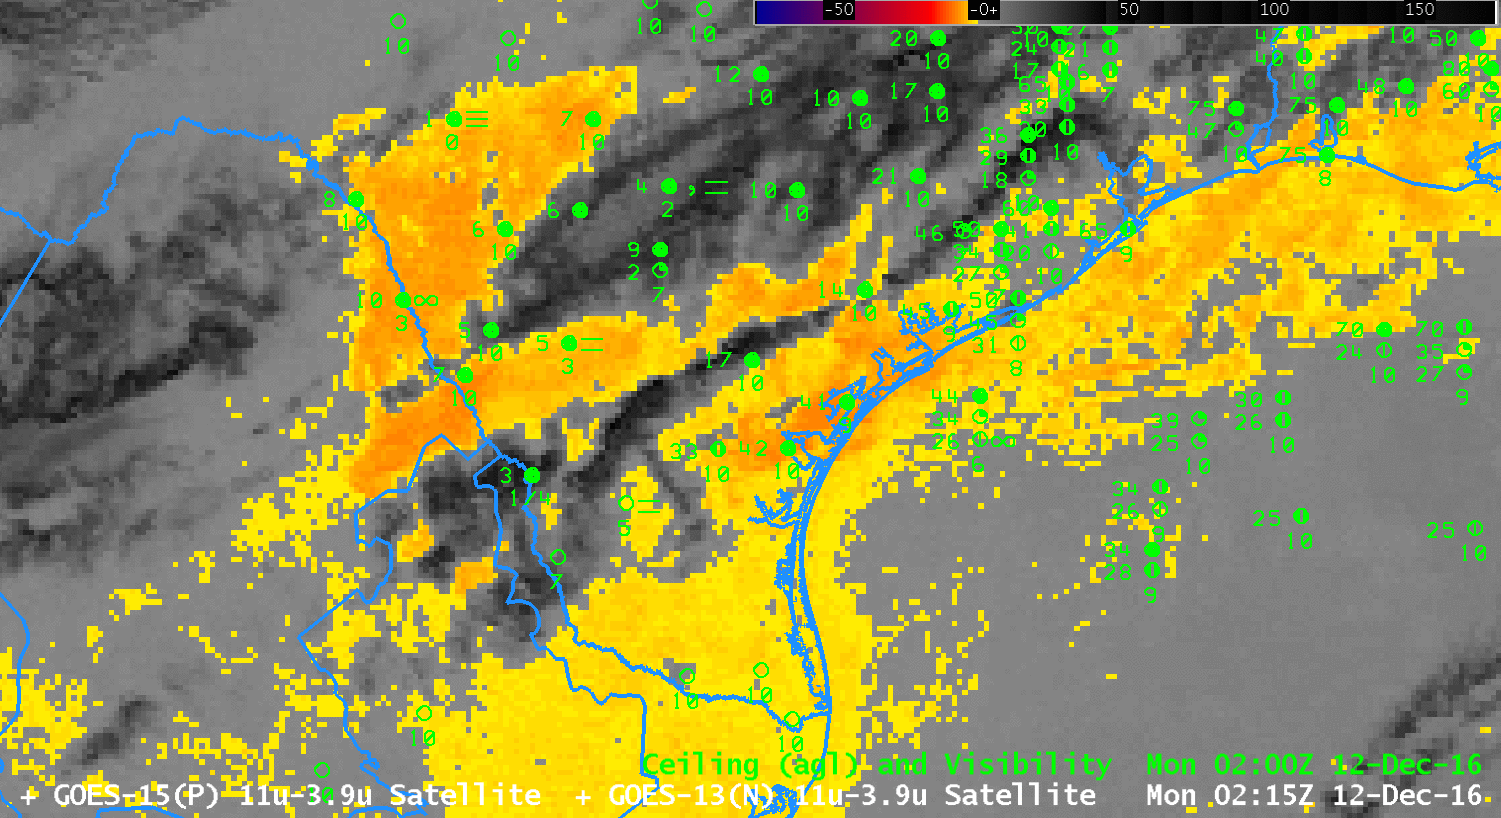
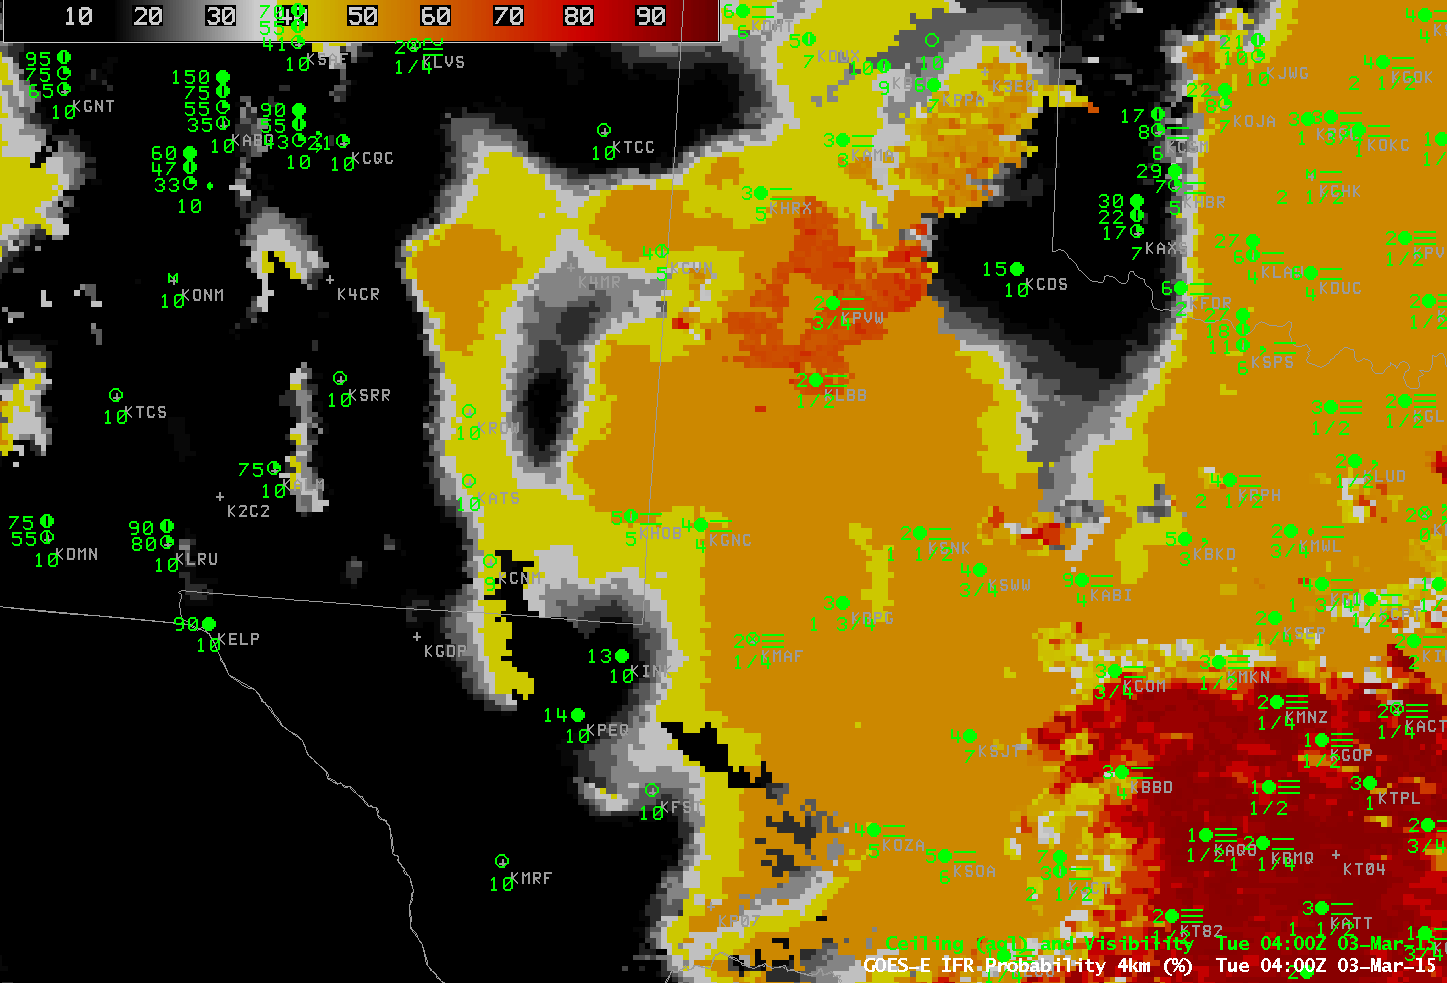
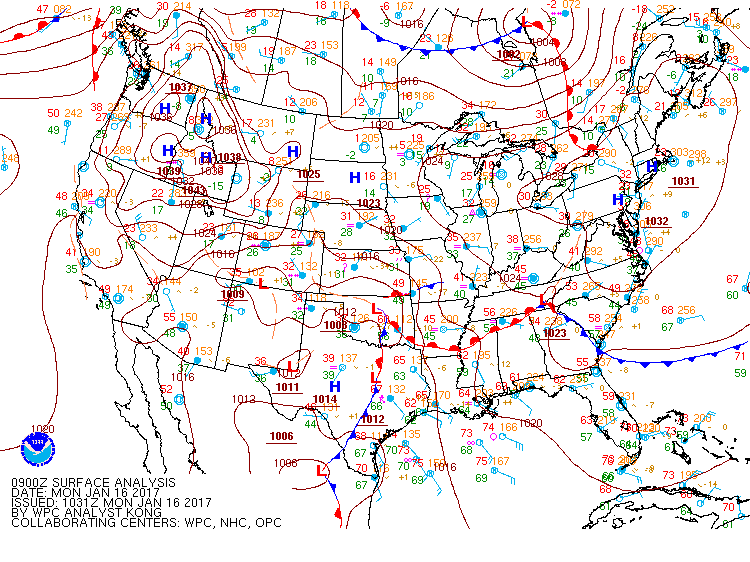
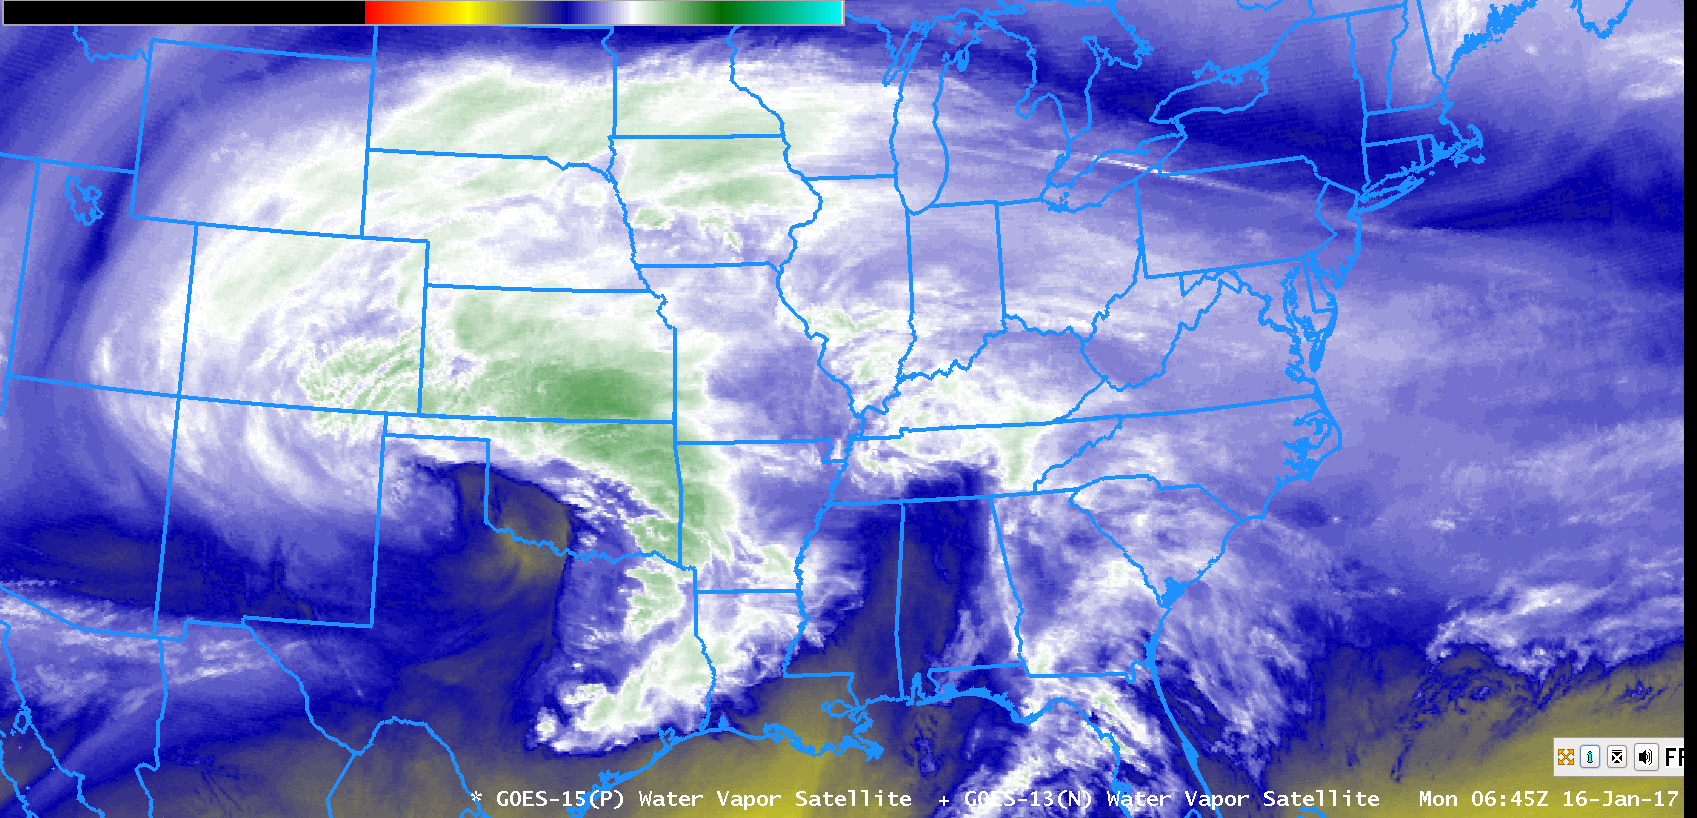
A cyclone over the southern Plains, in addition to causing severe weather over Texas on 15 January also generated widespread IFR Conditions over the southern Plains, as shown below in screengrabs from the Aviation Weather Center and from the National Weather Service. An overnight Water Vapor image (here) testifies to the ubiquitous presence of high clouds over the Plains; in such cases with widespread high clouds, low-cloud detection by satellite is a big problem. A strength of the GOES-R IFR Probability field is that it is a fused data product, incorporating both satellite information (not particularly useful for much of the overnight hours on 15-16 January) and Rapid Refresh model data that can be used to discern conditions near the surface. When the Rapid Refresh model suggests saturation is occurring near the surface (in, say, the lowest 1000 feet of the model atmosphere), IFR Probabilities will be large. They won’t be as large as they might be if both satellite and model data suggest low clouds are present, but useful information emerges in the IFR Probability fields, above, where the Rapid Refresh is predicting low-level saturation. IFR Probabilities are large over much of the southern Plains where IFR conditions are observed. This is the region where the color enhancement is orange.

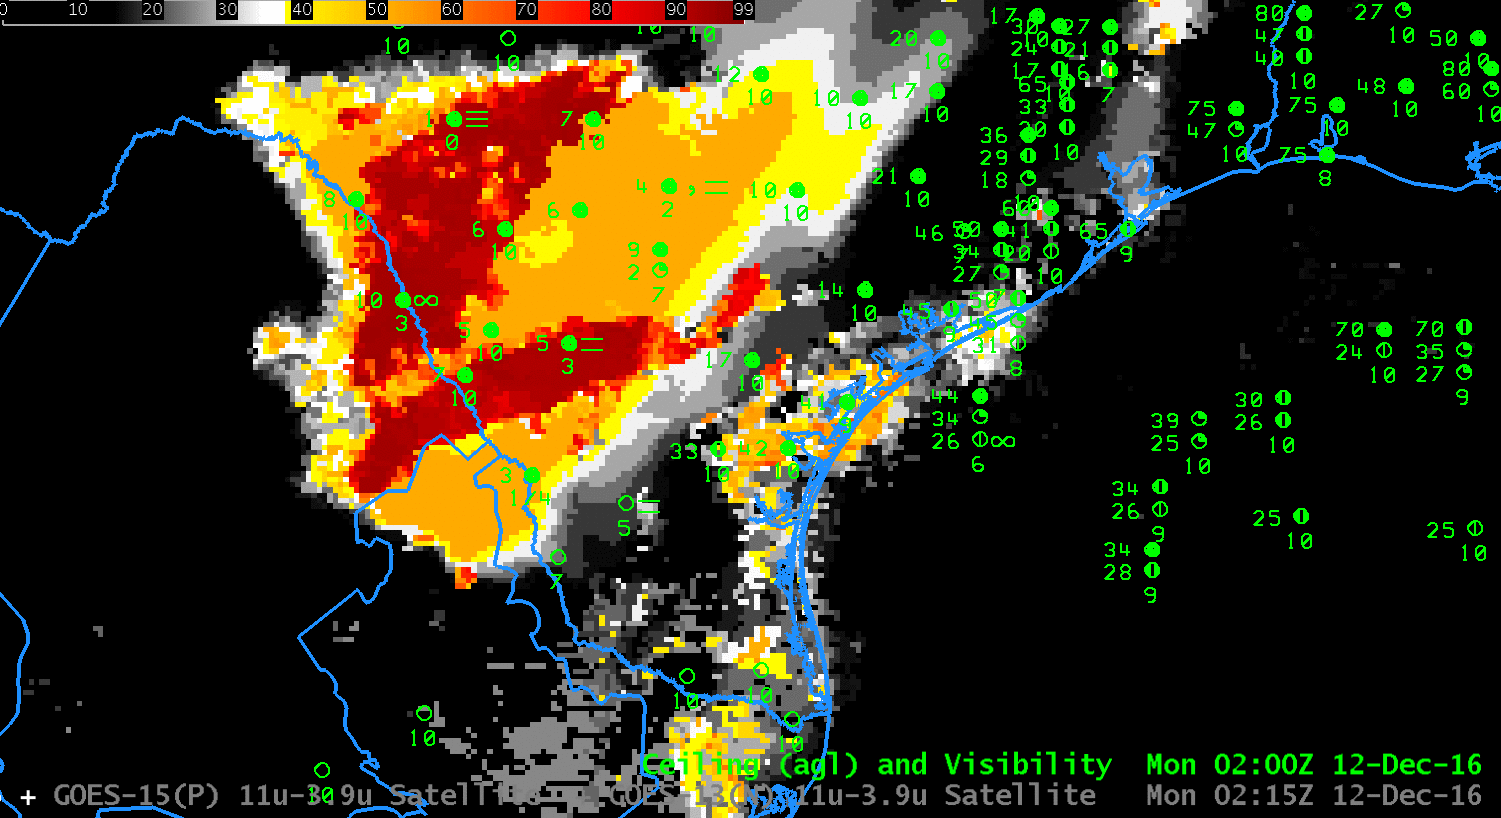
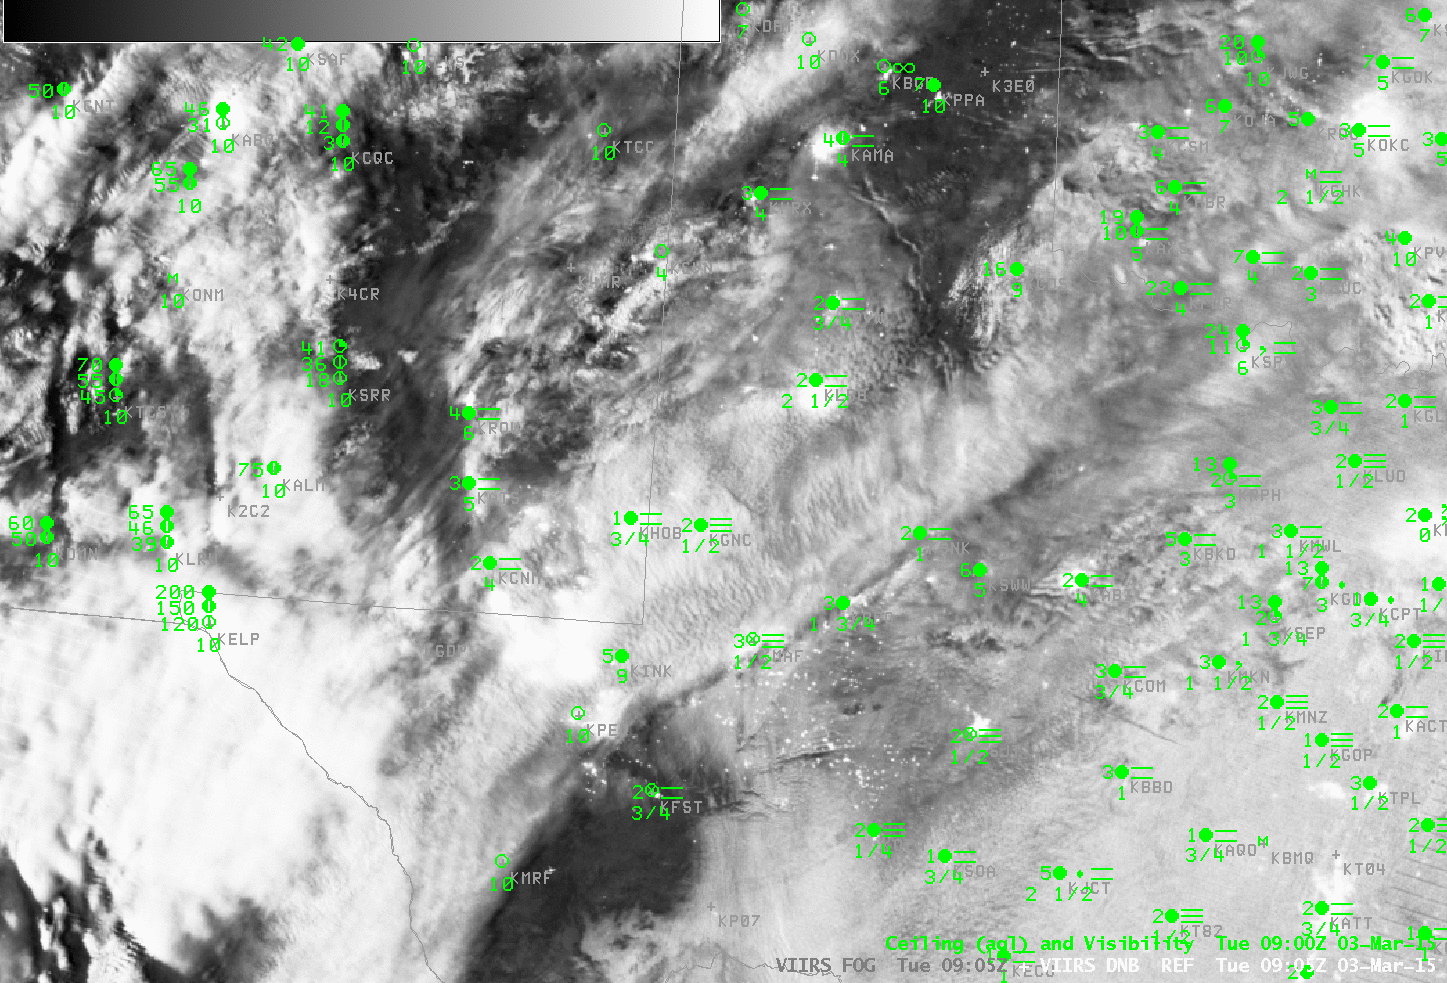
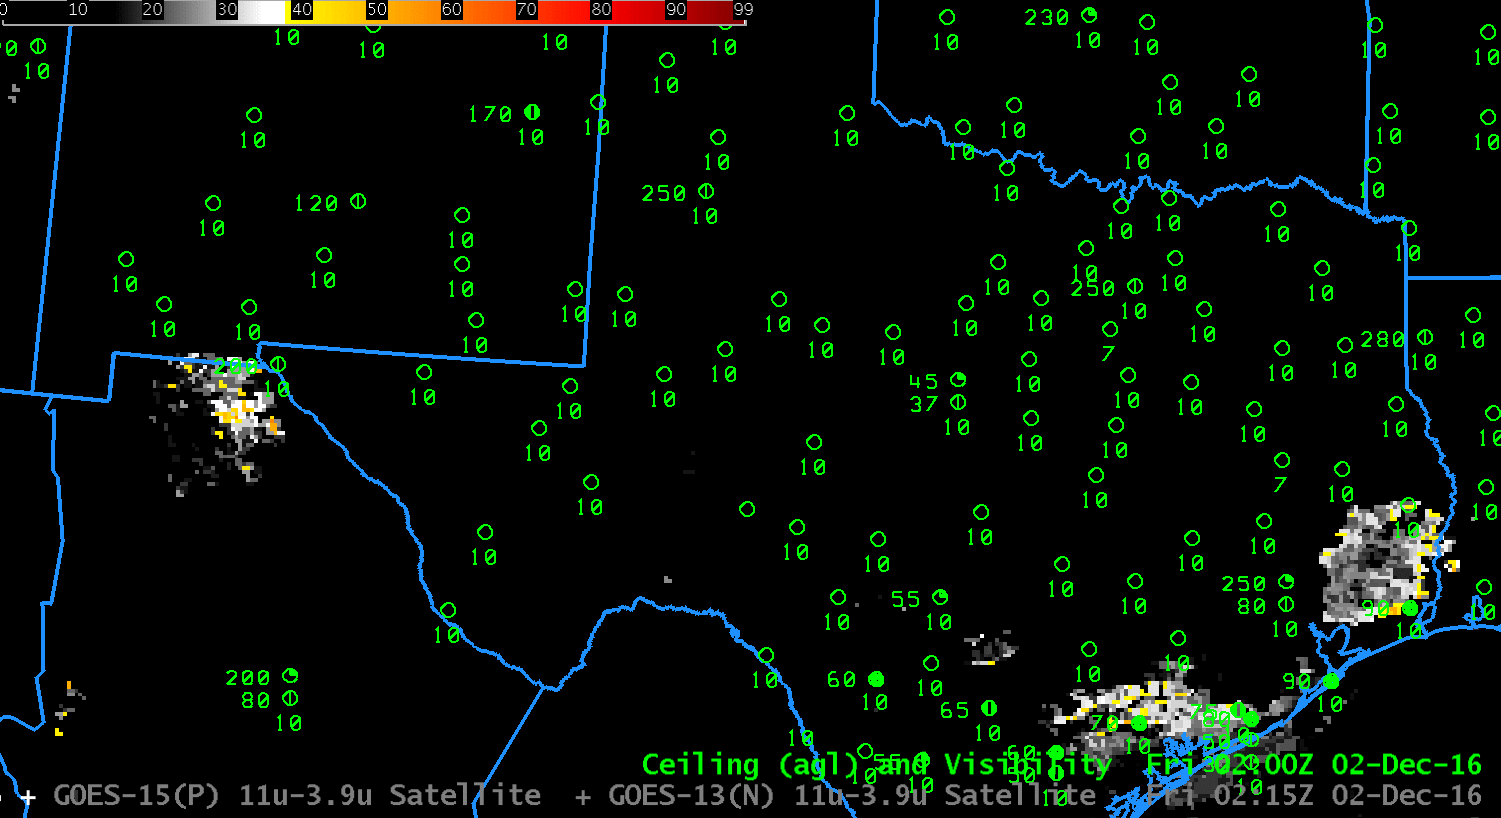
The low pressure system develops such that high clouds diminish over Texas and Oklahoma. When that happens, the IFR Probability fields change in two ways. First, values increase because satellite data and model data can be used as predictors. When only model data can be used, IFR Probability fields will have smaller values. Secondly, the character of the IFR Probability field takes on a more pixelated appearance because the satellite data values will vary from pixel to pixel. In contrast, when only model data can drive the IFR Probability field (for example, over Kansas at the beginning of the animation), the IFR Probability fields vary quite slowly from pixel to pixel in part because of model smoothing.

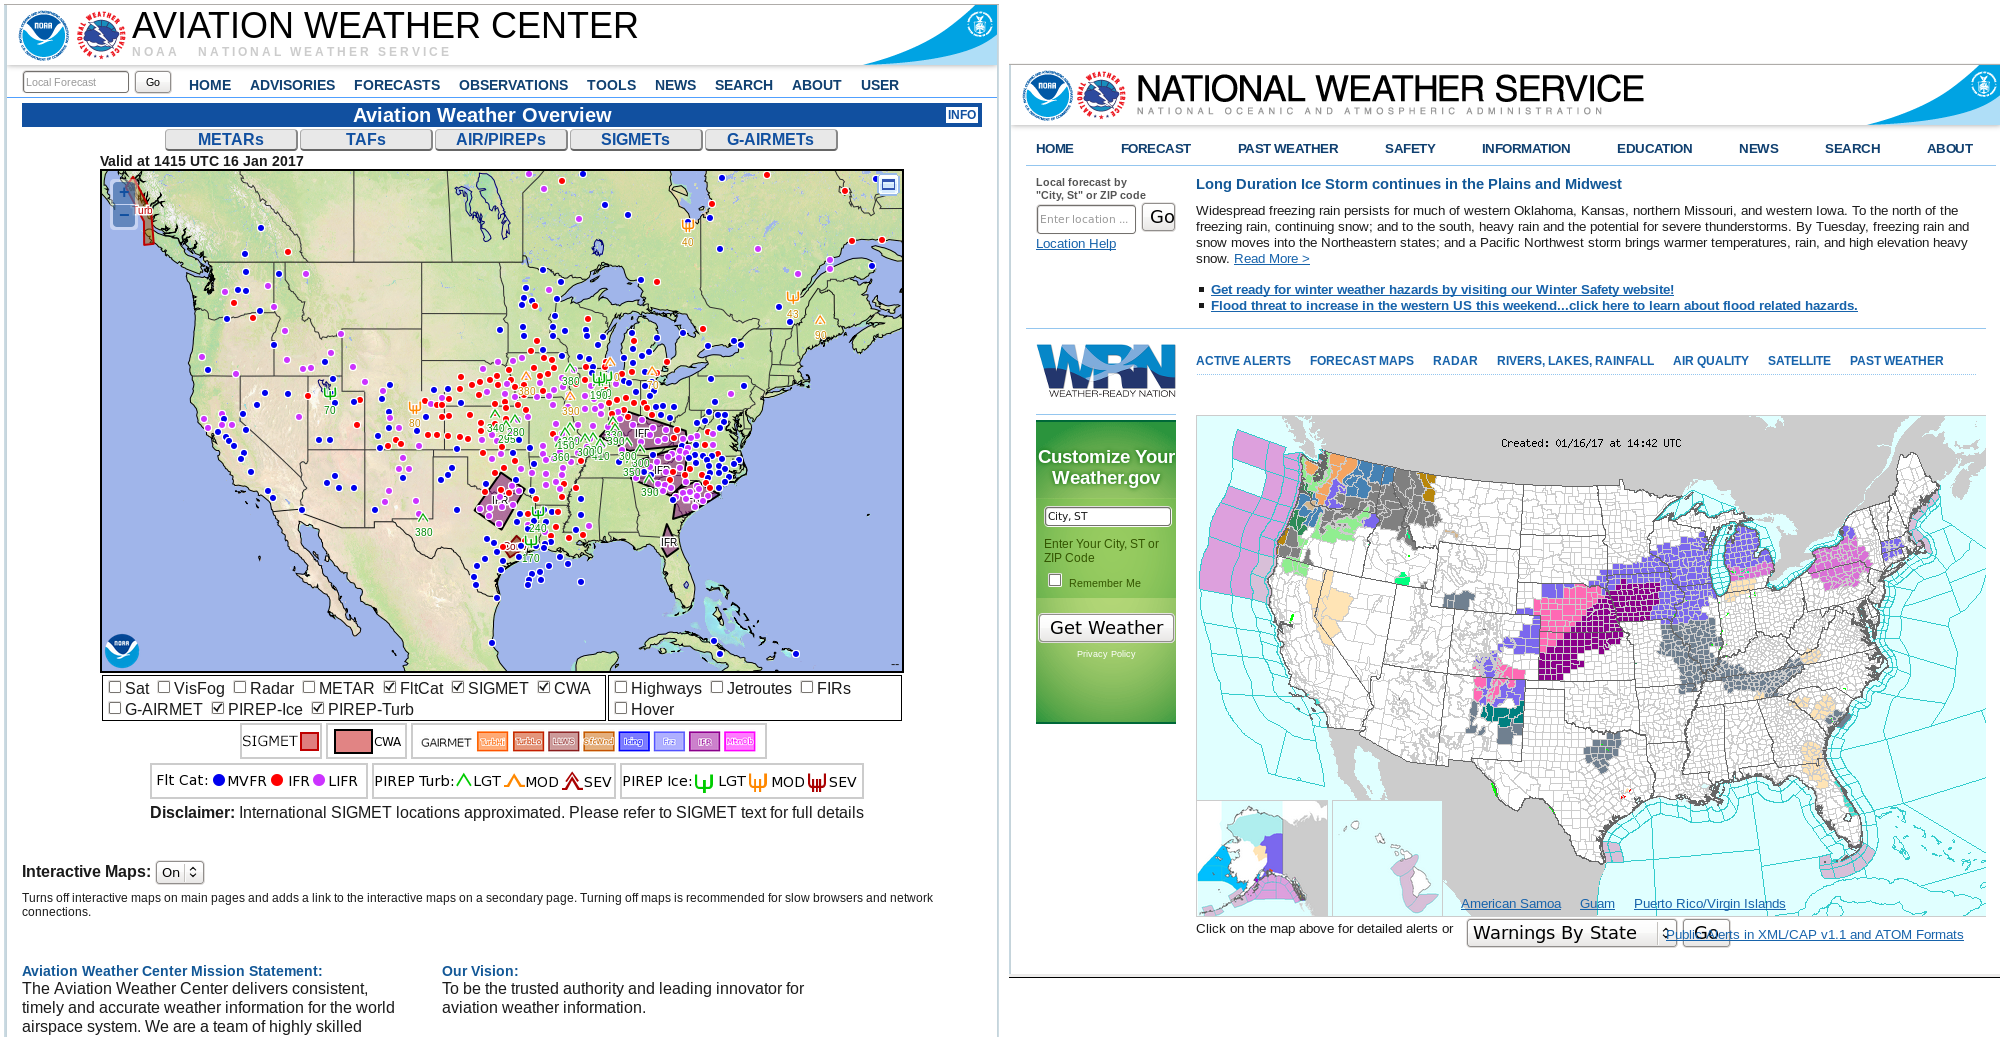
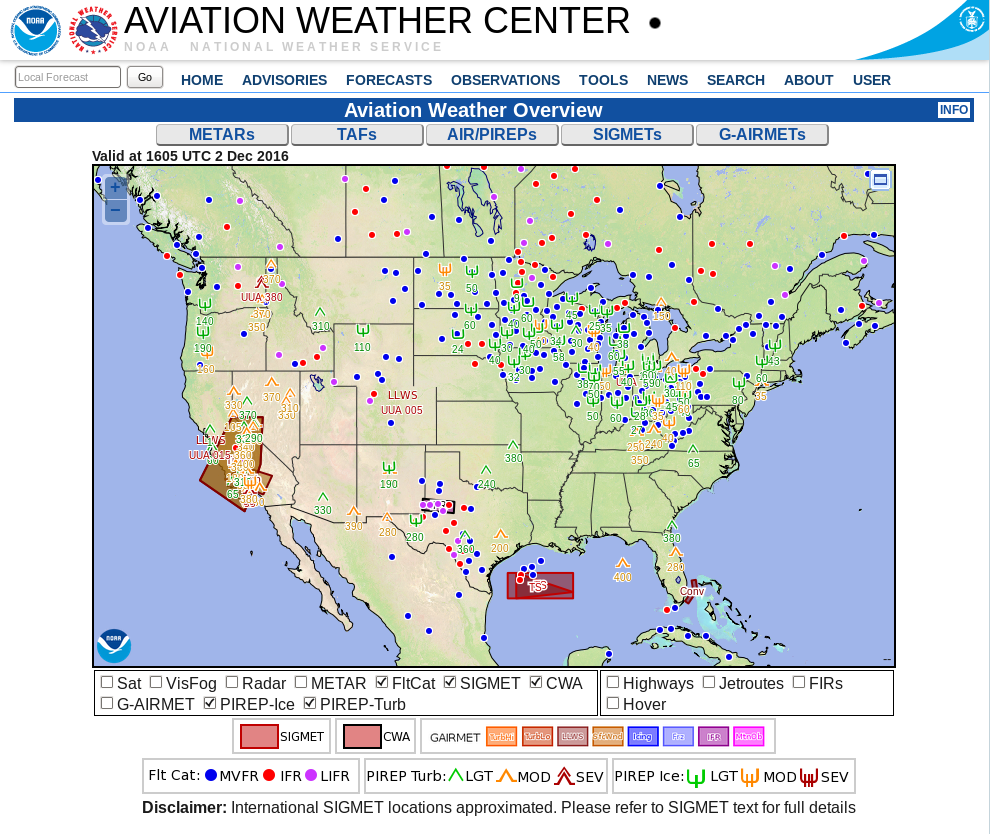
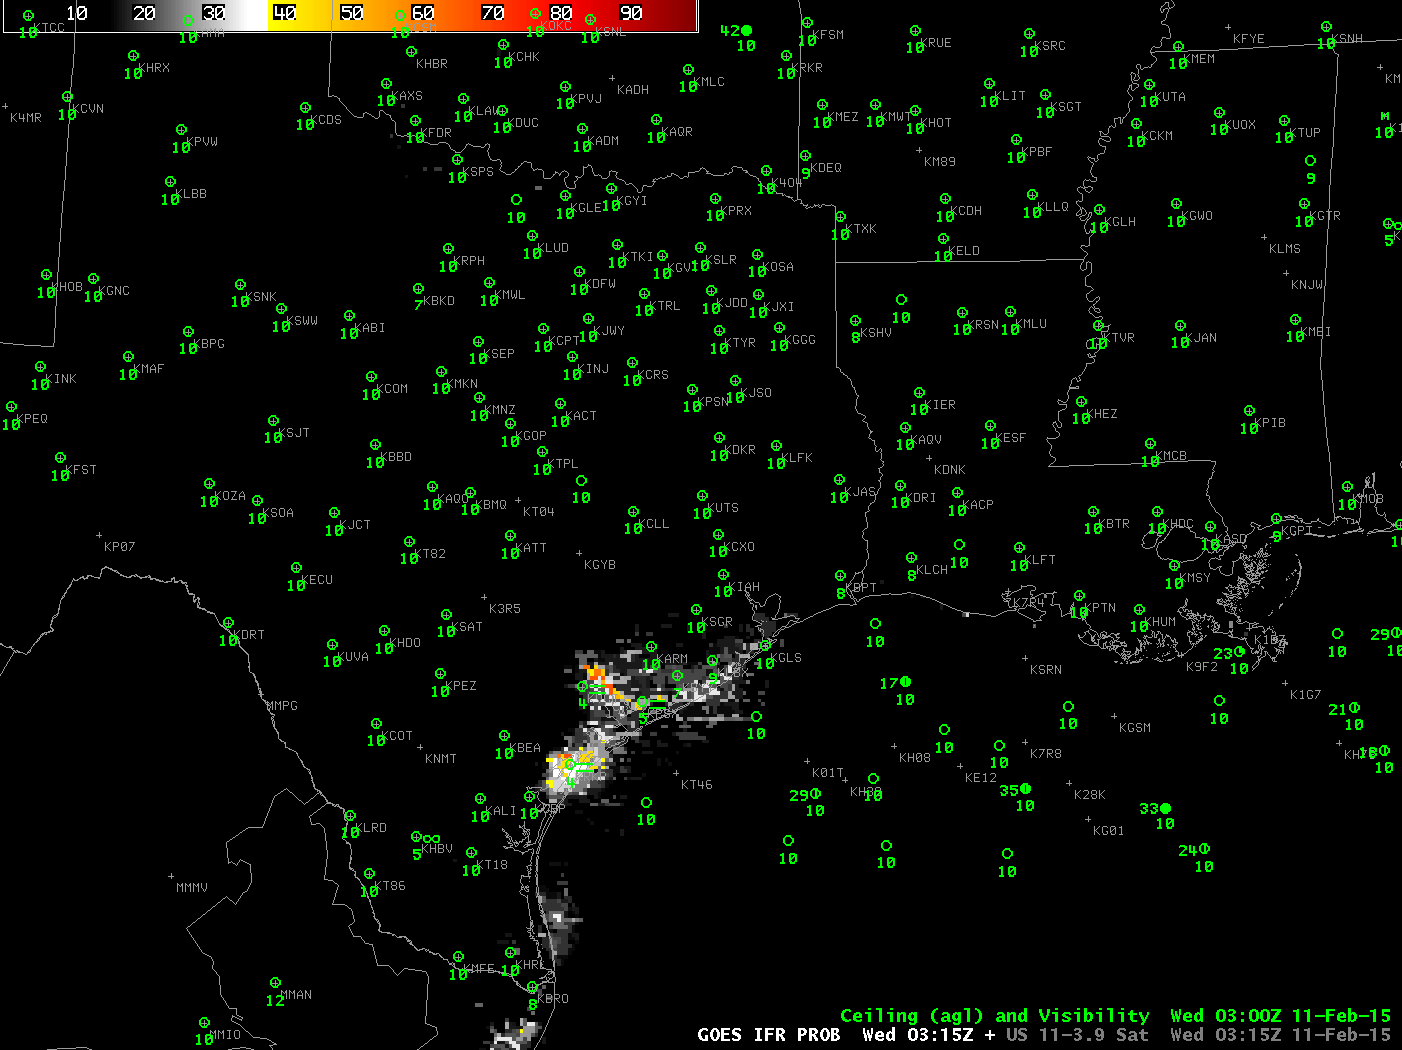
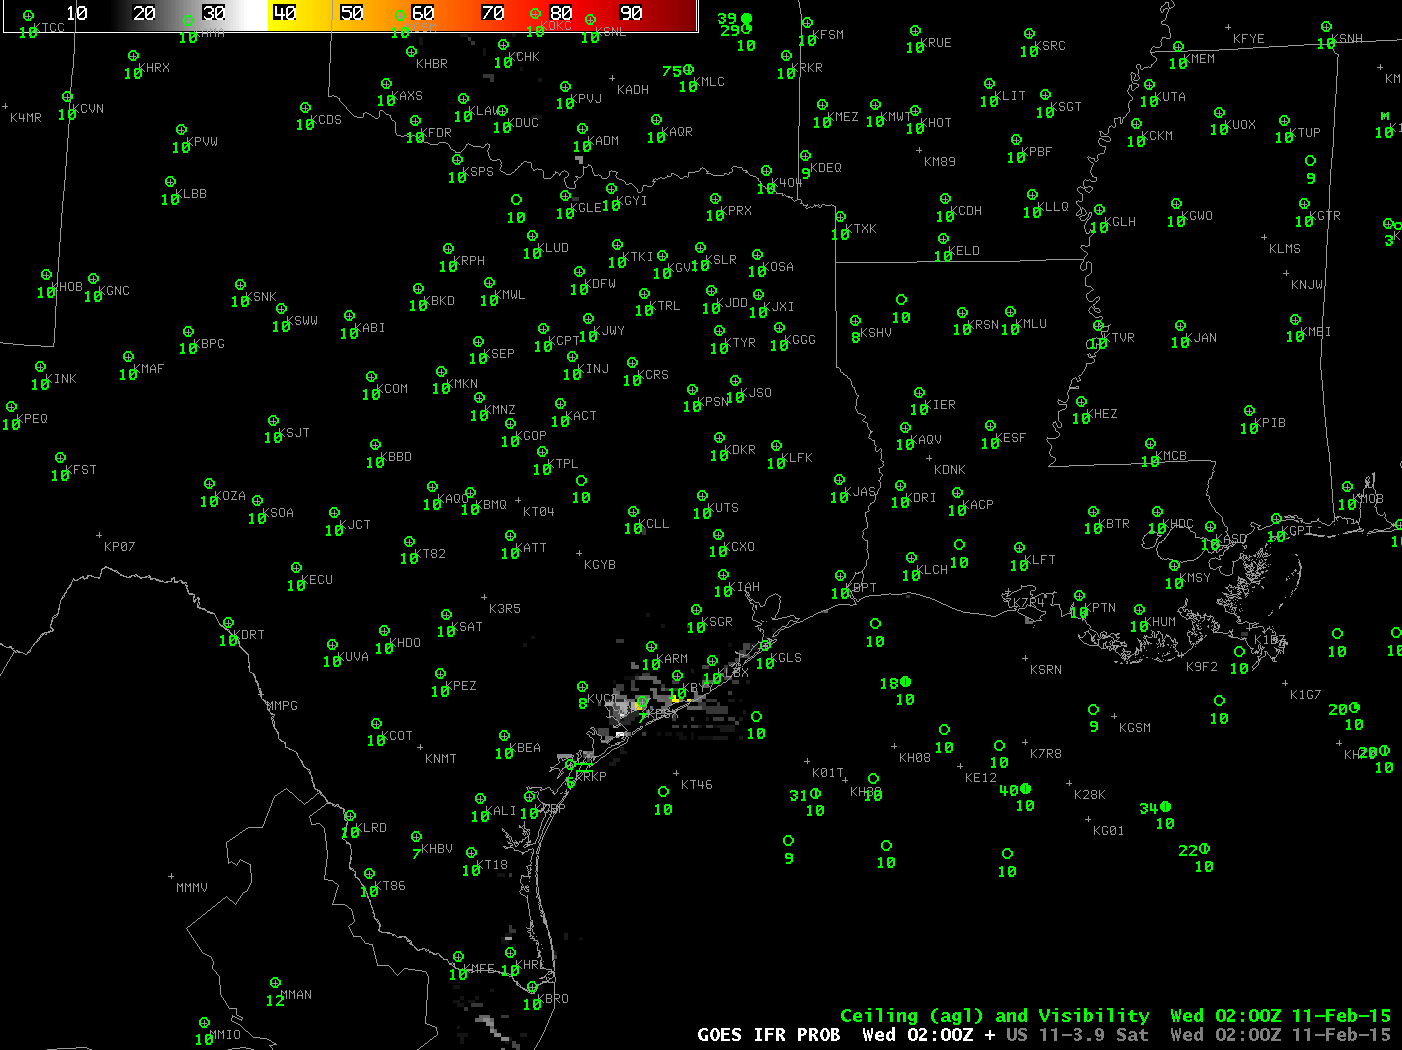
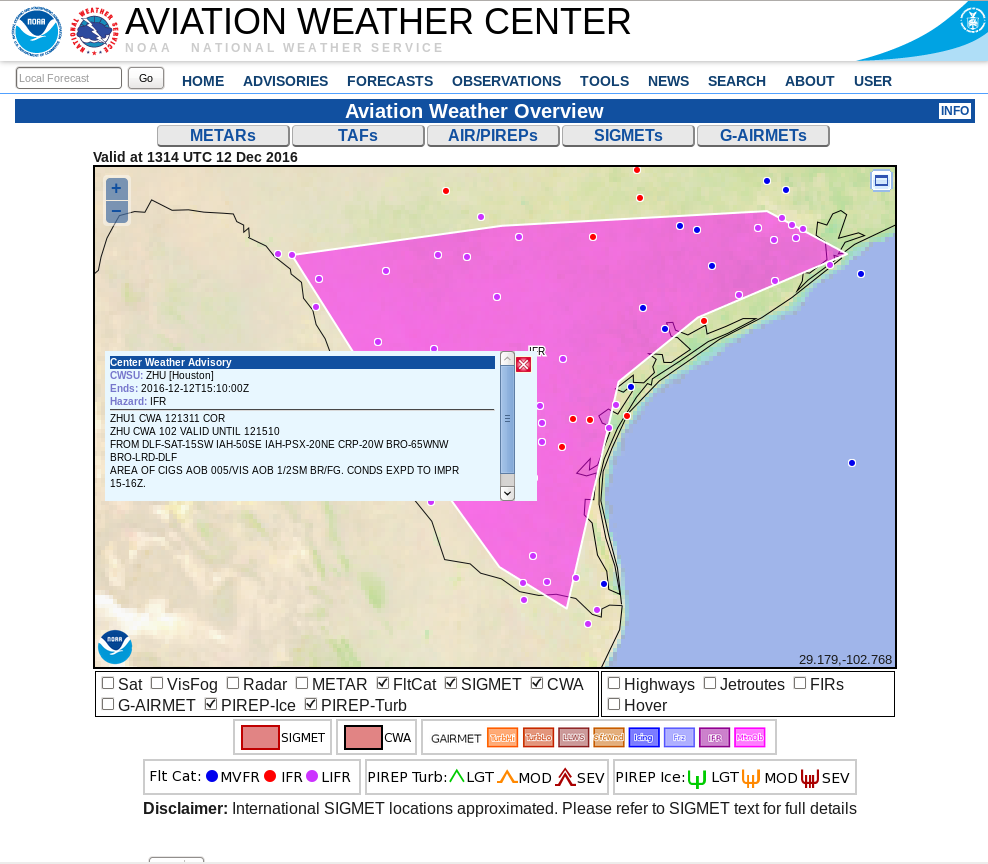
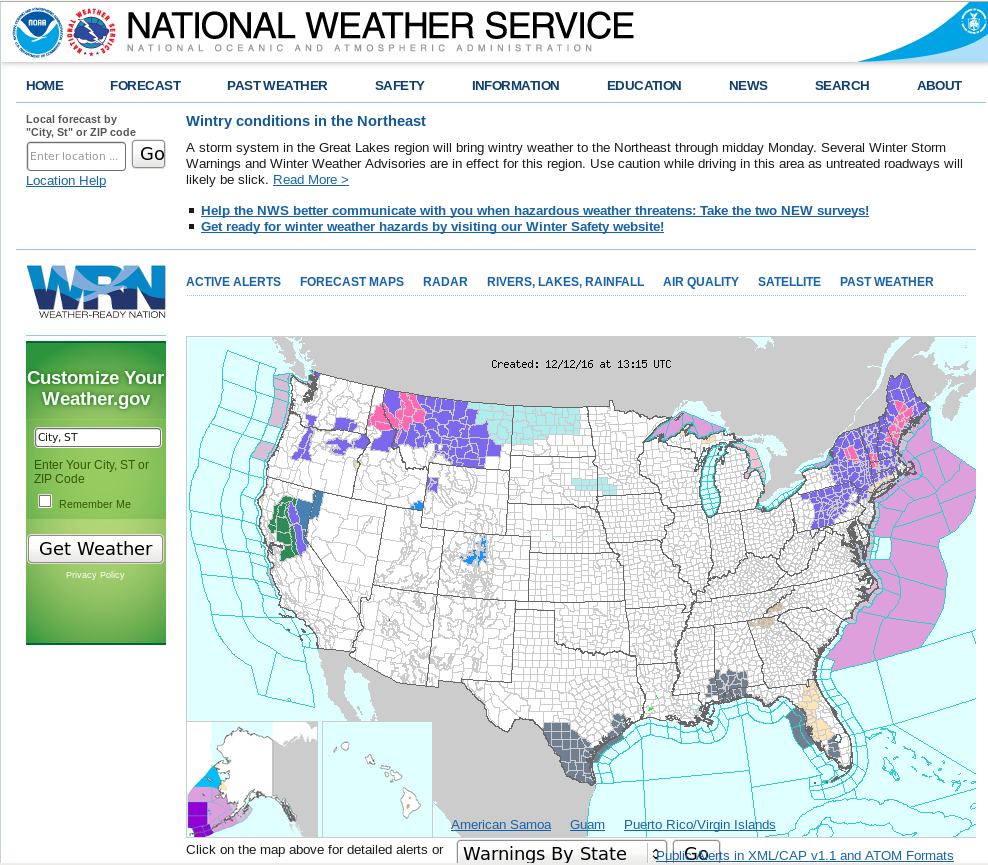
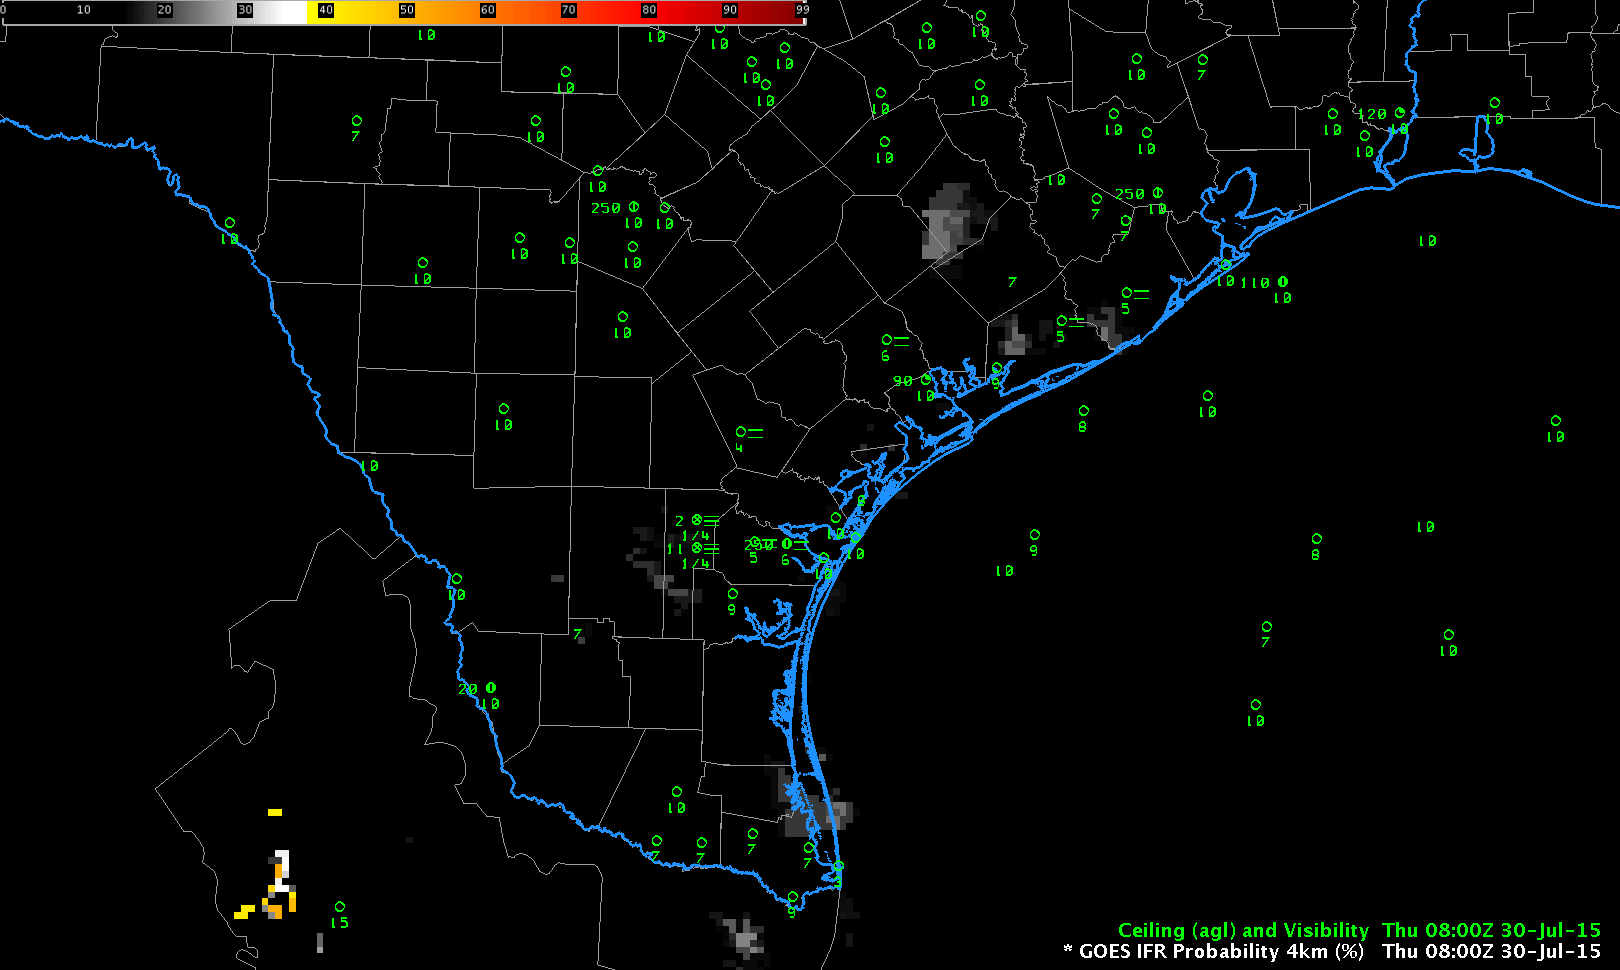
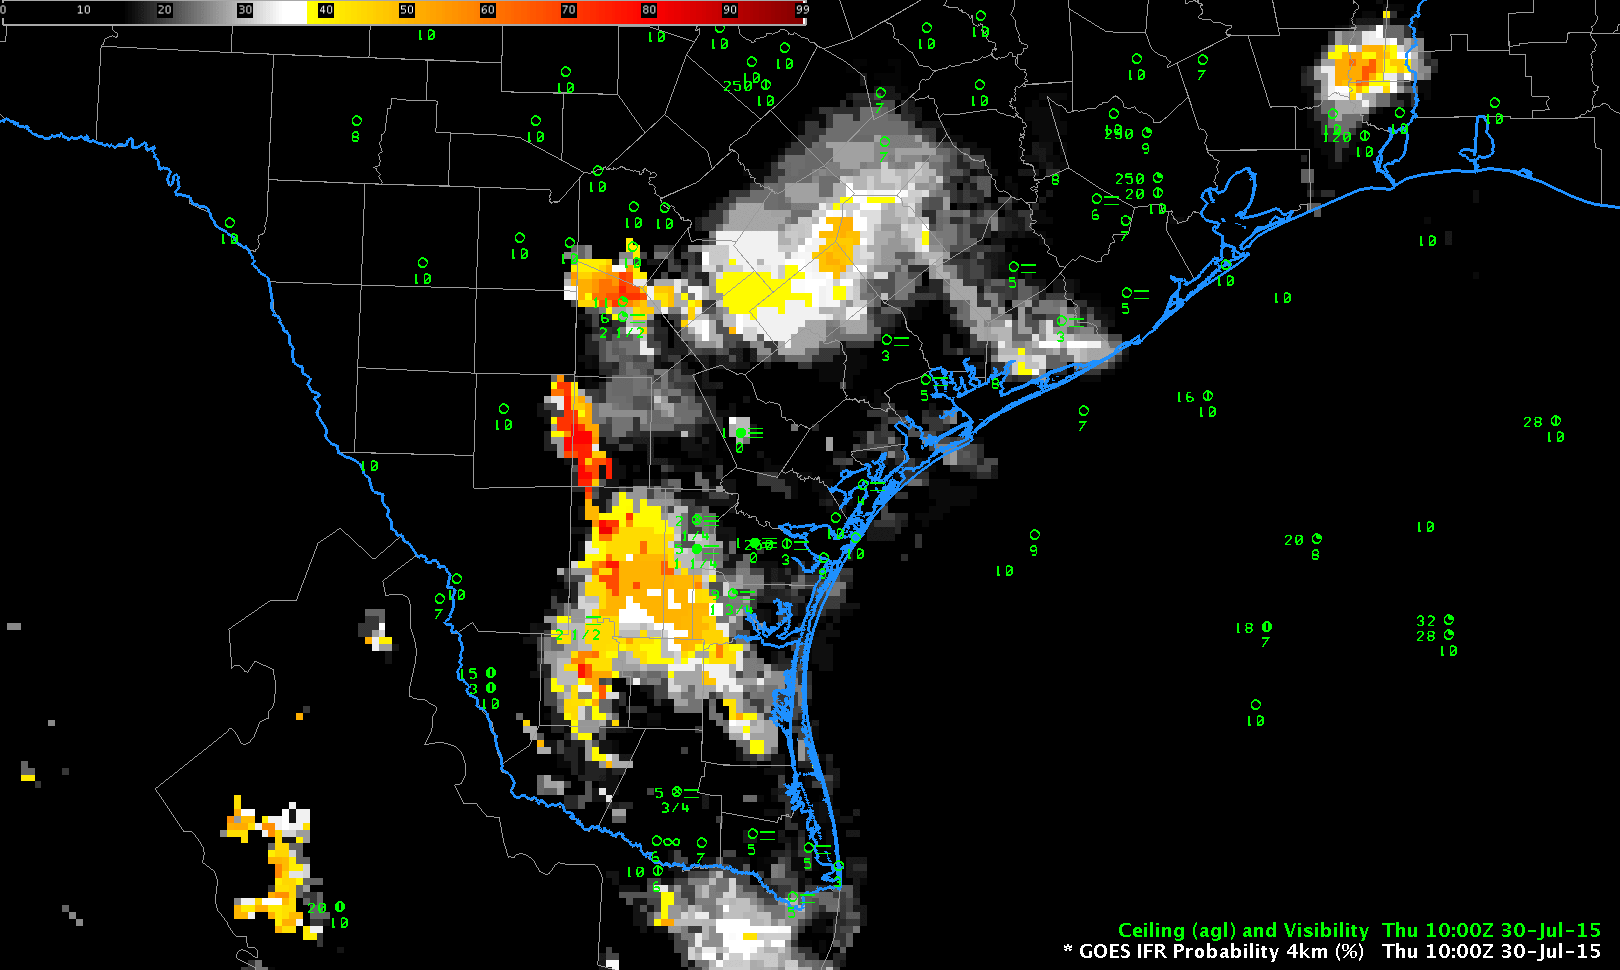
Screen Capture from Aviation Weather Center (left, showing widespread IFR Conditions) and from Weather.Gov (right, showing Dense Fog Advisories in grey) (Click to enlarge)

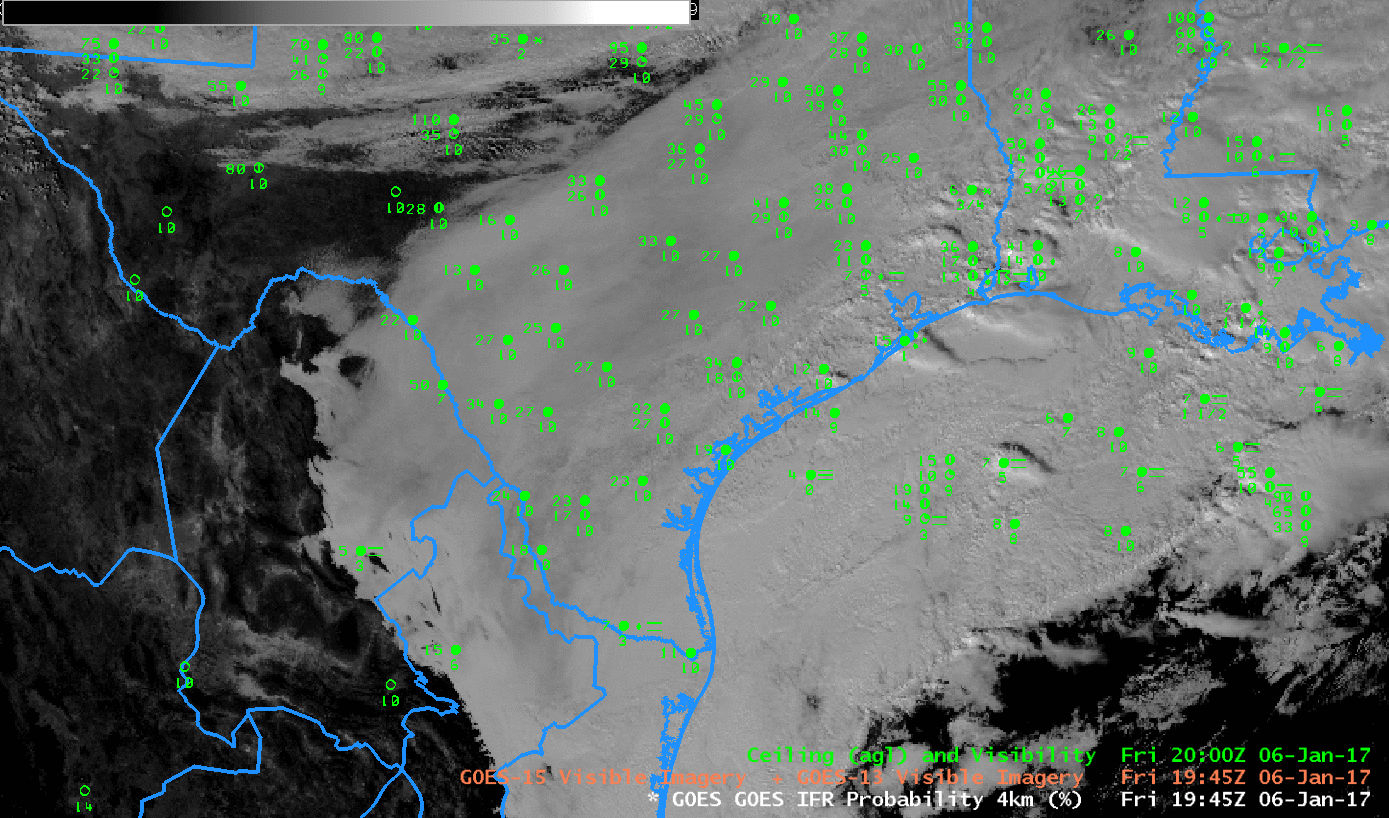
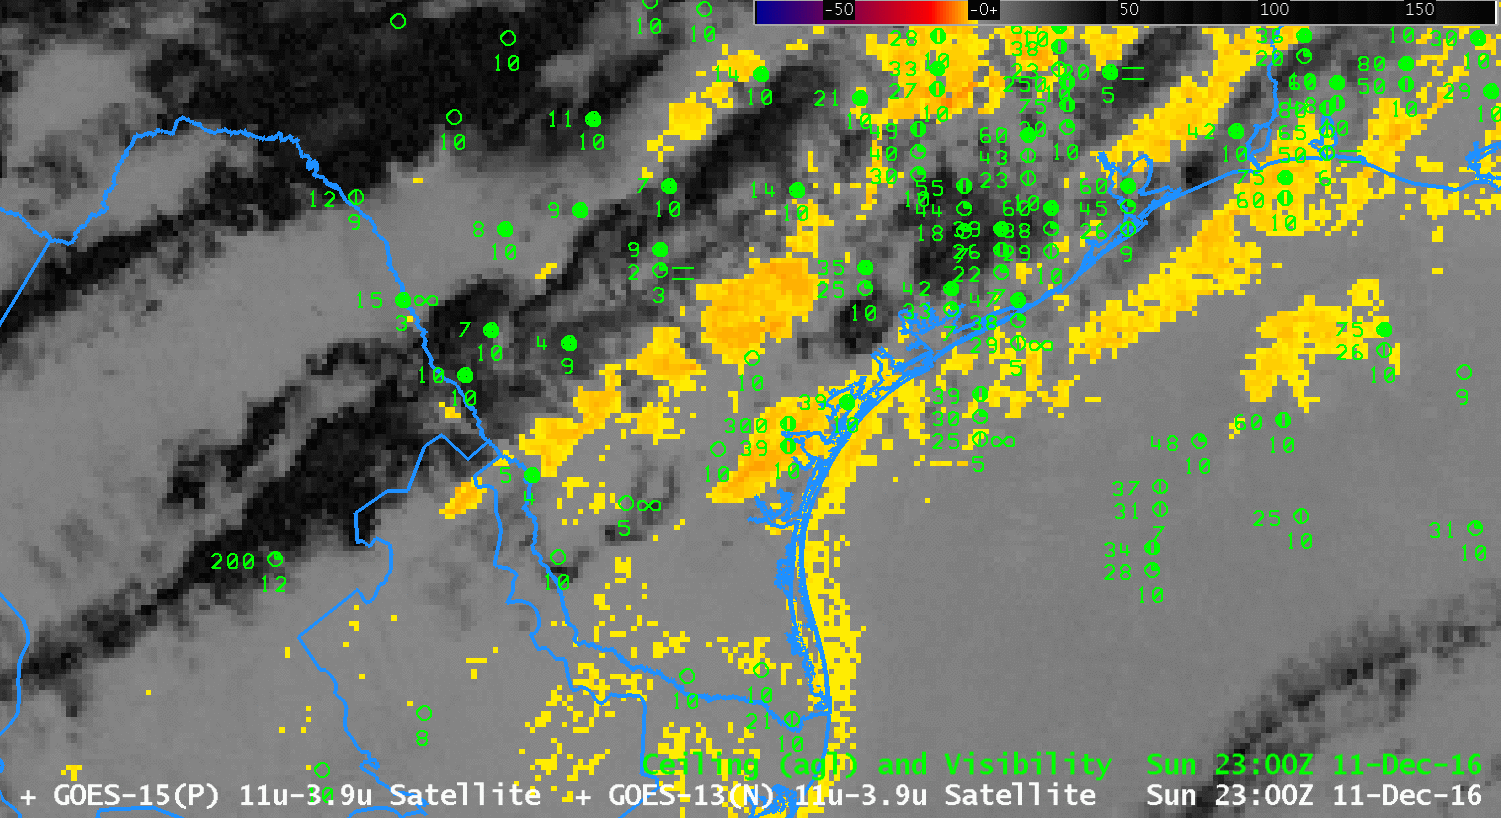
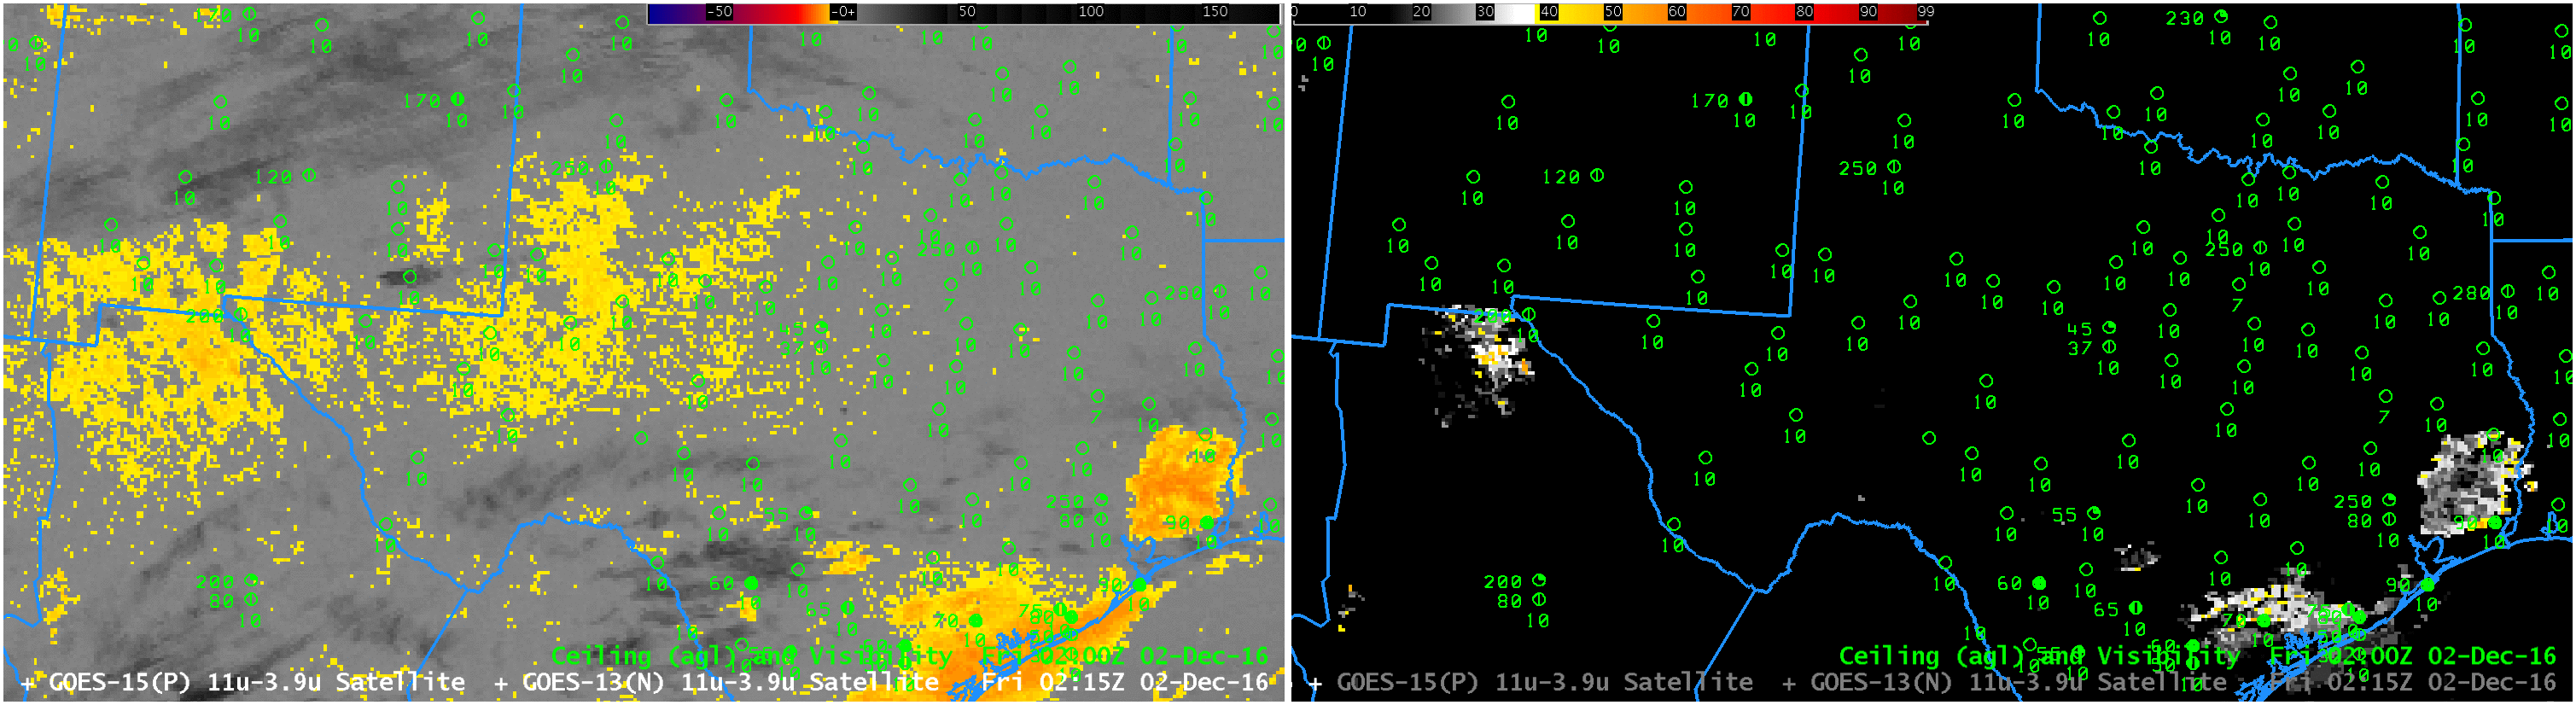
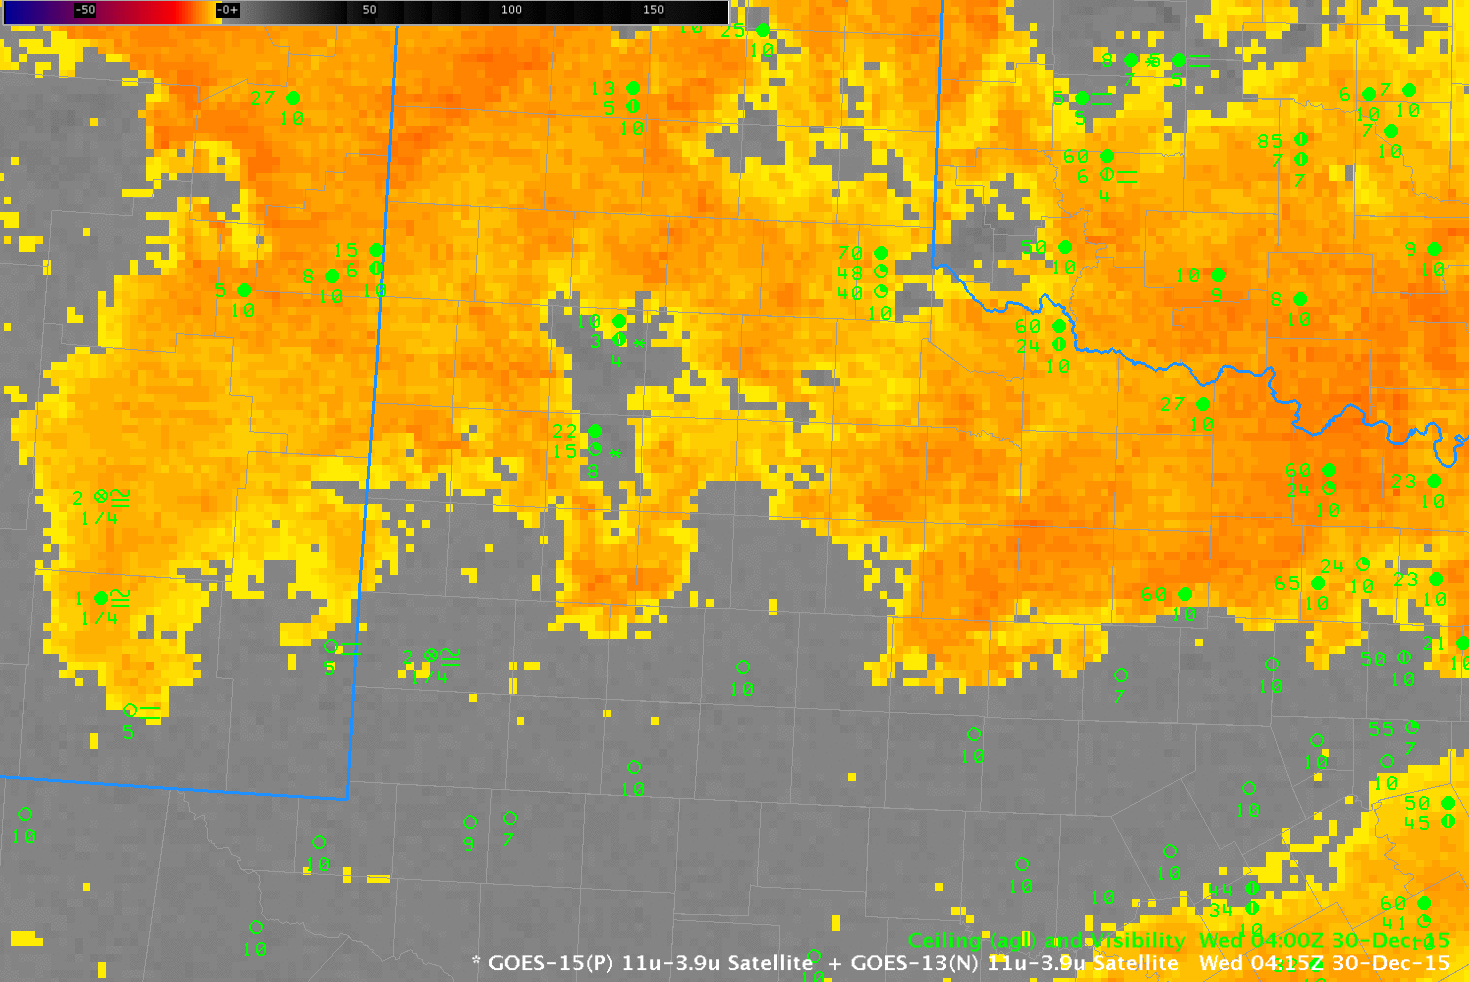
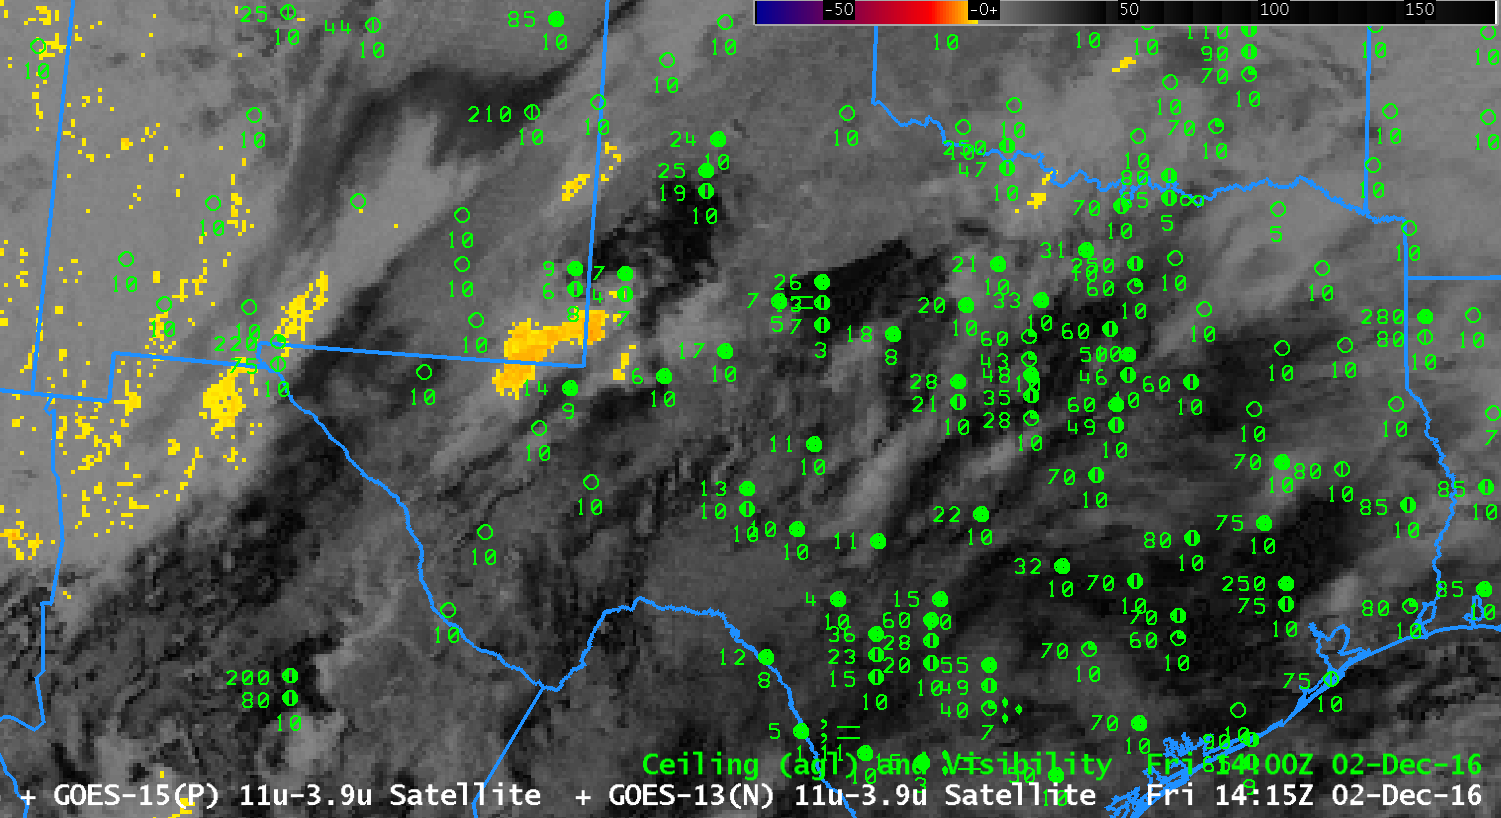
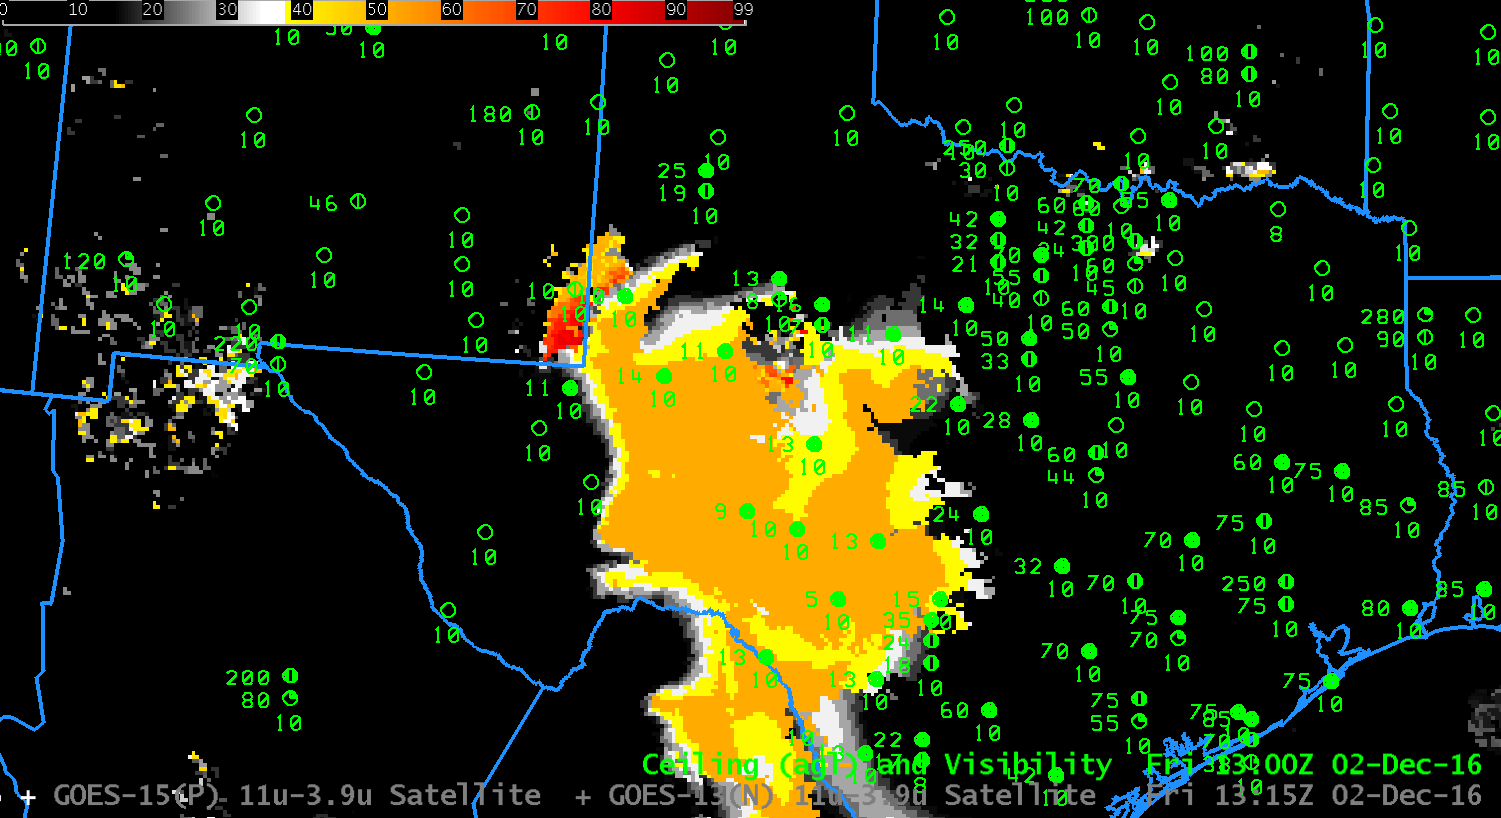
The toggle below includes sampling over Abilene, TX (KABI), a station at the edge of the IFR Probability field. IFR Probabilities are relatively constant at ~40% for the two hours shown, but station conditions change from IFR to VFR. IFR Probabilities at Abilene become quite small by 1315 UTC, at the end of the animation above.

GOES-R IFR Probability at 1015 and 1215 UTC on 16 January 2017. Station conditions at KABI are indicated by the sample probe (Click to enlarge)

Stratus over Texas

GOES-13 Visible (0.64 µm) Imagery, 1945 UTC on 6 January 2017 and surface observations of ceilings and visibilities (click to enlarge)

Visible imagery over Texas shows an extensive stratus deck blanketing the southern and eastern portions of the state.  Can you tell at a glance — without looking at the observations — if the stratus is extending to the surface?  The animation below shows how GOES-R IFR Probabilities describe the scene, with highest IFR Probabilities offshore (where dense fog is observed over the warm water).  Higher Probabilities also hug the high terrain of eastern Mexico, where IFR conditions are also reported (at Monclova, ID MMMV, where a 500-foot ceiling and 3-mile visibility is reported).  The toggle below cycles through the visible and GOES-R IFR Probability fields and also includes terrain.

GOES-R IFR Probability provides useful situational awareness information during the daytime as well as at night.

GOES-13 Visible (0.64 µm) Imagery, 1945 UTC on 6 January 2017 and surface observations of ceilings and visibilities, and with surface analysis superimposed, as well as GOES-R IFR Probabilities (1945 UTC) and Terrain (click to enlarge)

Fog over South Texas

Toggle between Brightness Temperature Difference (3.9µm – 10.7µm) and GOES-R IFR Probability fields, 2300 UTC on 11 December 2016 (Click to enlarge)

Dense Fog developed over south Texas during the early morning of 12 December 2016 (IFR Sigmet from this website shown here ; Advisories from the weather.gov website shown here). The toggle above shows in the brightness temperature difference field a signature of high clouds — and where those high clouds exist, IFR Probability fields rely on Rapid Refresh Model data to diagnose where IFR conditions might be occurring, or where IFR conditions might develop. The animation of Brightness Temperature Difference fields from 0215 through 1115 UTC, below, shows that the high clouds over south Texas diminished with time: by 0815 UTC only low stratus is present over south Texas.  But is that stratus also hugging the ground — that is, is it fog?  From the satellite’s perspective, the top of a stratus deck and the top of a fog bank can look very similar.

GOES-13 Brightness Temperature Difference (3.9µm – 10.7µm), 0215 through 1115 UTC on 12 December (Click to enlarge)

GOES-R IFR Probability fields give a more complete estimate about the presence of fog/low stratus because Rapid Refresh data and satellite data are used to diagnose the probability of IFR conditions. If the Rapid Refresh model shows low-level saturation, then the presence of stratus clouds also likely indicates the presence of fog; conversely, if the Rapid Refresh Model does not show low-level saturation, then the presence of stratus cloud need not indicate the presence of fog. IFR Probability fields below, from 0215 through 1115 UTC, start off regions with uniform values where only Rapid Refresh data are used in the algorithm — where high clouds block the satellite view of low clouds/fog. As the high clouds dissipate, the field acquires larger values because there is higher confidence of the presence of clouds (in part because satellite data can be used to observe them). In addition, these larger values have pixel-sized variability because of variability in the satellite observations.

IFR conditions are observed latest over far south Texas — this is also where IFR Probabilities are slowest to reach large values.

IFR Conditions over the High Plains of west Texas

goes_btd_ifr_0215_1415_02dec2016anim

GOES-13 Brightness Temperature Difference (3.9 µm – 10.7 µm, left) and GOES-R IFR Probability Fields (Right), hourly from 0215 through 1415 UTC on 2 December 2016 (Click to enlarge)

Near-IFR and and IFR Conditions developed over the High Plains of Texas on 2 December 2016, and a SIGMET for IFR conditions was issued as shown below.

The animation above shows plentiful cirrus (in the brightness temperature difference enhancement used in the imagery on the left, above, cirrus clouds are dark) over south Texas, with occasional breaks.  This makes continual monitoring via satellite of the developing stratus/fog field problematic:  the satellite cannot monitor what it is blocked from being observed by intervening cloud layers — in this case cirrus.  (Click here for a brightness temperature difference only animationClick here for an IFR Probability only animation)  Because IFR Probability fields include model-based data about saturation in the lower troposphere, in the form of Rapid Refresh model output, a useful and coherent signal can be generated underneath cirrus clouds.  The GOES-R IFR Probability signal can be better used for situational awareness and anticipation of the development of the IFR conditions shown below.

In the animation above, note the change between 1315 and 1415 UTC fields — in the Brightness Temperature Difference fields (1315 UTC ; 1415 UTC), this change arises because of increasing amounts of reflected solar 3.9 µm radiation:  this causes a sign change in the brightness temperature difference.  For IFR Probability fields (1315 UTC ; 1415 UTC), the change occurs because the Predictors used at night (1315 UTC) and during the day (1415 UTC) are different.

awc_1600utc_2december2016

1605 UTC screen capture from Aviation Weather Center. Note IFR Sigmet over west Texas (Click to enlarge)

Persistent fog and freezing fog over New Mexico and Texas

GOES_R_IFR_30Dec2015anim_0415_1745

GOES-R IFR Probability fields, 0415-1745 UTC on 30 December 2015 (Click to enlarge)

Fog with sub-freezing temperatures developed over New Mexico and west Texas early on the 30th of December, and persisted into mid-day. How well did conventional (and newer) algorithms designed to detect fog perform? The GOES-R IFR Probability fields, above, hourly from 0415 UTC through 1745 UTC on 30 December, show highest IFR Probabilities initially along the Pecos River in New Mexico. Airports at both Artesia and Roswell reported IFR conditions continuously during the period shown. IFR Conditions developed over Texas west of a line from about Breckenridge (in Stephens County) to Vernon Texas (in Wilbarger County). The southern extent of the ice fog was near a Midland (in Midland County) to Coleman (in Coleman County) line. High IFR Probabilities were common over Texas where the Fog/Freezing Fog was occurring.

The Brightness Temperature Difference field for the same times are shown below. The Brightness Temperature Difference field captures the presence of water-based clouds along the Pecos River in New Mexico — both at night (orange enhancement) and during the day (black enhancement). The Brightness Temperature Difference field tells you something about the top of the cloud only, however; it cannot give information about the cloud base. (In contrast, the GOES-R IFR Probability product, because it fuses satellite data with surface information derived from Rapid Refresh Model output, a distinction between mid-level stratus and low fog is possible). In addition, there are regions in the brightness temperature difference field where no strong signal occurs even though fog is present (Hobbs, NM in Lea County and Seminole TX in Gaines County, for example).

BTD_30Dec2015anim_0415_1745

GOES-13 Brightness Temperature Difference Fields (10.7 µm – 3.9 µm), 0415-1745 UTC on 30 December 2015 (Click to enlarge)

High Cirrus over west Texas and Fog on the Ground

GOES13BTD_IFRProb_1100_30Nov2015toggle

GOES-based GOES-R IFR Probabilities and GOES-13 Brightness Temperature Differences (10.7 µm – 3.9 µm), 1100 UTC on 30 November 2015 (Click to enlarge)

Extratropical cyclones are accompanied most time with multiple clouds levels. In the example above, a cirrus shield accompanies a subtropical jet over the southern boundary of the United States. That cirrus prevents the satellite from seeing any low clouds that may be present. To detect/diagnose low clouds and fog in such regions, other data sets must be used. For GOES-R IFR Probability fields (shown in the toggle above), that other data set is low-level saturation in the Rapid Refresh model. If the model suggests saturation is present, IFR Probability fields will show a strong signal even where cirrus shields prevent the satellite from viewing water-based clouds near the surface. That is the case above. IFR conditions are widespread in the scene above are are diagnosed quite well by the IFR Probability fields.

Dense Fog over the Deep South

TEXAS_GOESIFR_0700_1300_30July2015anim

GOES-R IFR Probability Fields, hourly from 0700 through 1300 UTC, 30 July 2015 (Click to enlarge)

Dense Fog Advisories were issued over inland south Texas on the morning of Thursday 30 July (below). GOES-R IFR Probabilities of this event, above, capture the development of IFR conditions after 0700 UTC (2 AM CDT). Values are quite small until about 0900 UTC, as IFR conditions develop around Alice, TX and Orange Grove Naval Air Station (in Jim Wells County) and then expand. Comparing the GOES-R IFR Probability fields, above, and the GOES-13 Brightness Temperature Difference fields, below, suggest that the model component in the IFR Probability fields showed low-level saturation occurring a bit farther north than the initial strongest pixel returns in the Brightness Temperature Difference fields. For example, compare this toggle of GOES-R IFR Probability and GOES-13 Brightness Temperature Difference fields at 0800 UTC: Larger values of GOES-R IFR Probability (albeit still small — around 20%) are shifted north of the strongest enhancements in the 0800 Brightness Temperature Difference fields, which stronger enhancements are mostly near the Rio Grande). The toggle for 1000 UTC is here.

TEXAS_GOESBTD_0700_1300_30July2015anim

GOES-13 Brightness Temperature Difference (10.7µm – 3.9µm) Fields, hourly from 0700 through 1300 UTC, 30 July 2015 (Click to enlarge)

URGENT – WEATHER MESSAGE
NATIONAL WEATHER SERVICE BROWNSVILLE TX
612 AM CDT THU JUL 30 2015

…AREAS OF DENSE FOG CONTINUE TO DEVELOP ACROSS NORTHERN
RANCHLANDS THIS MORNING…

.CLEAR SKIES AND CALM WINDS CONTINUE TO ALLOW AREAS OF DENSE FOG
TO DEVELOP ACROSS NORTHERN PORTIONS OF DEEP SOUTH TEXAS THIS
MORNING. VISIBILITIES WILL BE REDUCED TO A QUARTER OF A MILE IN
AREAS OF DENSE FOG.

TXZ249-250-301400-
/O.NEW.KBRO.FG.Y.0016.150730T1112Z-150730T1400Z/
JIM HOGG-BROOKS-
INCLUDING THE CITIES OF…HEBBRONVILLE…FALFURRIAS
612 AM CDT THU JUL 30 2015

…DENSE FOG ADVISORY IN EFFECT UNTIL 9 AM CDT THIS MORNING…

THE NATIONAL WEATHER SERVICE IN BROWNSVILLE HAS ISSUED A DENSE
FOG ADVISORY…WHICH IS IN EFFECT UNTIL 9 AM CDT THIS MORNING.

* VISIBILITY…VISIBILITIES WILL BE REDUCED TO A QUARTER OF A
MILE.

* IMPACTS…DRIVING WILL BE DIFFICULT ON STREETS AND ROADS
ESPECIALLY IN RURAL AREAS.

PRECAUTIONARY/PREPAREDNESS ACTIONS…

MOTORISTS SHOULD SLOW DOWN…USE LOW BEAM HEADLIGHTS…AND
MAINTAIN A SAFE DISTANCE BETWEEN VEHICLES.

&&

$$

CASTILLO

URGENT – WEATHER MESSAGE
NATIONAL WEATHER SERVICE CORPUS CHRISTI TX
757 AM CDT THU JUL 30 2015

…DENSE FOG THIS MORNING OVER EASTERN PORTIONS OF THE RIO GRANDE
PLAINS…

.THE COMBINATION OF NEAR SURFACE MOISTURE…DRY AIR ALOFT…AND
LIGHT WIND…HAS RESULTED IN AREAS OF DENSE FOG OVER THE SOUTHERN
COASTAL BEND AND OVER EASTERN PORTIONS OF THE RIO GRANDE PLAINS
EARLY THIS MORNING. HOWEVER…CONDITIONS WILL IMPROVE BY MID
MORNING AS TEMPERATURES INCREASE SUFFICIENT TO RESULT IN
UNSATURATED CONDITIONS NEAR THE SURFACE.

TXZ230>232-240-241-301500-
/O.EXT.KCRP.FG.Y.0018.000000T0000Z-150730T1500Z/
MCMULLEN-LIVE OAK-BEE-DUVAL-JIM WELLS-
INCLUDING THE CITIES OF…CALLIHAM…CROSS…LOMA ALTA…TILDEN…
GEORGE WEST…THREE RIVERS…BEEVILLE…FREER…BENAVIDES…
SAN DIEGO…ALICE…ORANGE GROVE
757 AM CDT THU JUL 30 2015

…DENSE FOG ADVISORY NOW IN EFFECT UNTIL 10 AM CDT THIS
MORNING…

* VISIBILITY…ONE-QUARTER MILE OR LESS

* IMPACTS…DENSE FOG WILL RENDER DRIVING HAZARDOUS.

PRECAUTIONARY/PREPAREDNESS ACTIONS…

A DENSE FOG ADVISORY MEANS VISIBILITIES WILL FREQUENTLY BE
REDUCED TO LESS THAN ONE QUARTER MILE. IF DRIVING…SLOW DOWN…
USE LOW-BEAM HEADLIGHTS…AND LEAVE PLENTY OF DISTANCE AHEAD OF
YOU.

&&

$$

PZ

South Texas had favorable geometry today that allowed for successive Suomi NPP overpasses to provide information. The Day Night Band imagery, below, and the Brightness Temperature Difference fields, below the Day Night Band, suggest few clouds are detected at 0727 UTC or at 0906 UTC.

SNPP_DNB_0727_0906_30July2015toggle

Suomi NPP VIIRS Day Night Band Visible Imagery (0.70µm) at 0727 and 0906 UTC 30 July 2015 (Click to enlarge)

SNPP_BTD_0727_0906_30July2015toggle

Suomi NPP VIIRS Brightness Temperature Difference (11.45µm – 3.74µm) fields at 0727 and 0906 UTC 30 July 2015 (Click to enlarge)


=============================================================================

FLA_GOESIFR_0700_1300_30July2015anim

GOES-R IFR Probability Fields, hourly from 0700 through 1300 UTC, 30 July 2015 (Click to enlarge)

Northeast Florida also had reduced ceilings and visibilities on the morning of 30 July 2015. The animation above of GOES-R IFR Probabilities from 0700-1300 UTC (above) shows enhanced values in most of the inland northern Florida panhandle. The flat nature of the field suggests that higher clouds are preventing satellite detection of low clouds: predictors based on model fields only are being used to compute IFR Probabilities (that is, satellite predictors are not being used). The Brightness Temperature Difference animation for this event is below.

FLA_GOESBTD_0700_1300_30July2015anim

GOES-13 Brightness Temperature Difference (10.7µm – 3.9µm) Fields, hourly from 0700 through 1300 UTC, 30 July 2015 (Click to enlarge)

Cirrus and IFR Conditions over south Texas

GOES13_BTD_25March2015-01_14z

GOES-13 Brightness Temperature Difference (10.7µm – 3.9µm) Fields, 0100-1400 UTC on 25 March 2015, along with surface observations of ceiling and visibility (Click to enlarge)

GOES-13 Brightness Temperature Difference Fields, above, demonstrate how high and middle clouds can complicate or prevent the detection of low clouds from satellite. The beginning of the animation shows signatures of cirrus streaking across the northern part of the domain. There are also signals of low clouds/fog over south Texas that diminish by ~0300 UTC before reappearing. No fog is reported during the early part of the animation. In the latter half of the animation, cirrus moves in to the southern part of the domain from the southwest (cirrus appears black in the enhancement used), interfering with the detection of low clouds and fog over south Texas. At 1400 UTC, the end of the animation, reflected 3.9µm radiation originating from the rising sun has flipped the sign of the brightness temperature difference field.

GOES13_IFRPROB_25March2015_01_14z

GOES-13-based IFR Probability Fields, 0100-1400 UTC on 25 March 2015, along with surface observations of ceiling and visibility (Click to enlarge)

The GOES-R IFR Probability fields, above, show little signal until after 0500 UTC when the satellite and model data both start to suggest the presence of fog/low stratus.  When the cirrus impinges on the southern part of the domain, becoming noticeable at 1000 UTC, IFR Probability values drop because satellite predictors cannot be used in the algorithm — only model data is driving the field over south Texas.  The model data strongly suggests fog is present however (and IFR and near-IFR conditions are reported).  Using the fused product allows a forecaster to have a consistent signal as the high clouds move in.  IFR conditions persist — and IFR Probabilities remain high — after sunrise over portions of south Texas.

Fog over the High Plains of Texas

GOES_IFR_PROB_20150303_0400_1000

GOES-R IFR Probability Fields, hourly from 0400 through 1000 UTC on 3 March 2015 (Click to enlarge)

Persistent fog has shrouded the High Plains of Texas for the past couple days.  GOES-R IFR Probability fields, above, from 0400 to 1000 UTC on 3 March, show the widespread nature of the fog.  There are regions in the animation (north and west of San Angelo at the start of the loop and north and west of Midland at the end of the loop) where the character of the IFR Probability field (a uniform value with a flat field and orange color) suggests high clouds are present and that fog detection with the product is relying on Rapid Refresh model output.  That the GOES-R IFR Probability fields align well with observations of IFR or near-IFR conditions is testimony to the accuracy of the Rapid Refresh Model. In the southern part of the domain, where GOES-R IFR Probability values are larger (the field is red), satellite data are also used in the computation of the IFR Probability field. Because satellite predictors can also be used there, confidence that fog/low stratus exists is greater, and the IFR Probability field values are larger. Note that the IFR Probability field there is also pixelated, reflecting the small pixel size (nominally 4 km) of the GOES Imager.

VIIRS_DNB_FOG_20150303_0905

Suomi NPP Brightness Temperature Difference Field (11.35 µm – 3.74 µm) and Day Night Band (0.70 µm) at 0905 UTC on 3 March 2015 (Click to enlarge)

Suomi NPP and Aqua both overflew the region around 0900 UTC on 3 March, and the high-resolution snapshots from Suomi NPP (above) and MODIS (below) show scenes that agree with the GOES Imagery. The Brightness Temperature Difference Fields show middle and high clouds over the Texas Panhandle. The Day Night band shows clouds over most of Texas — but it is difficult to distinguish high clouds and low clouds from the imagery. Shadows can be used to infer differences in cloud height — but that requires a knowledge of where the Moon sits in the sky relative to Texas at this time: to the east, or to the west?

The MODIS-based GOES-R IFR Probability field at ~0900 UTC, below, again shows how model data is helpful in filling in regions where high clouds or mid-level clouds obscure the satellite-view of low clouds/stratus.

MODIS_FOG_IFR_PROB_20150303_0855

MODIS-based GOES-R IFR Probability and Aqua Brightness Temperature Difference Fields (11 µm – 3.9 µm) at 0855 UTC, 03 March 2015 (Click to enlarge)

Fog Development on the Texas Gulf Coast

GOES_IFR_BTD_20150211_0200

GOES-R IFR Probabilities and GOES-East Brightness Temperature Difference fields (10.7µm – 3.9µm) at 0200 UTC on 11 February 2015 (Click to enlarge)

GOES_IFR_BTD_20150211_0315

GOES-R IFR Probabilities and GOES-East Brightness Temperature Difference fields (10.7µm – 3.9µm) at 0315 UTC on 11 February 2015 (Click to enlarge)

Dense fog developed along the Texas Gulf Coast late on 10 February and early on 11 February. GOES-R IFR Probabilities gave an advance warning of the fog development, as shown above. Toggles between the GOES-R IFR Probability and the Brightness Temperature Difference Product (a heritage method of fog detection) show a IFR Probability signal at 0200 UTC; that signal steadily increased until 0315 UTC when a signal started to become apparent in the Brightness Temperature Difference Field. In this case, IFR Probabilities gave extra lead time to alert the forecaster to the development of fog. (This has happened before) Note also how the IFR Probability fields screen out false positive signals of fog over West Texas.

Hourly animations for GOES-R IFR Probability and GOES-13 Brightness Temperature Difference fields are below. The IFR Probability fields neatly overlap regions with IFR or near-IFR conditions. Note the impact of the high clouds that move over coastal south Texas after 1200 UTC; the brightness temperature difference field and the GOES-R IFR Probability fields both are affected.

GOES_IFR_PROB_20150211_02_13

GOES-R IFR Probability hourly from 0200 through 1300 UTC 11 February 2015 (Click to enlarge)

US_11-3.9_Sat_20150211_02_13

GOES-13 Brightness Temperature Difference (10.7µm – 3.9µm) hourly from 0200 through 1300 UTC 11 February 2015 (Click to enlarge)