Category Archives: Texas

Fog in the Pecos River valley of New Mexico

GOES_IFR_PROB_20150206_0700_1300

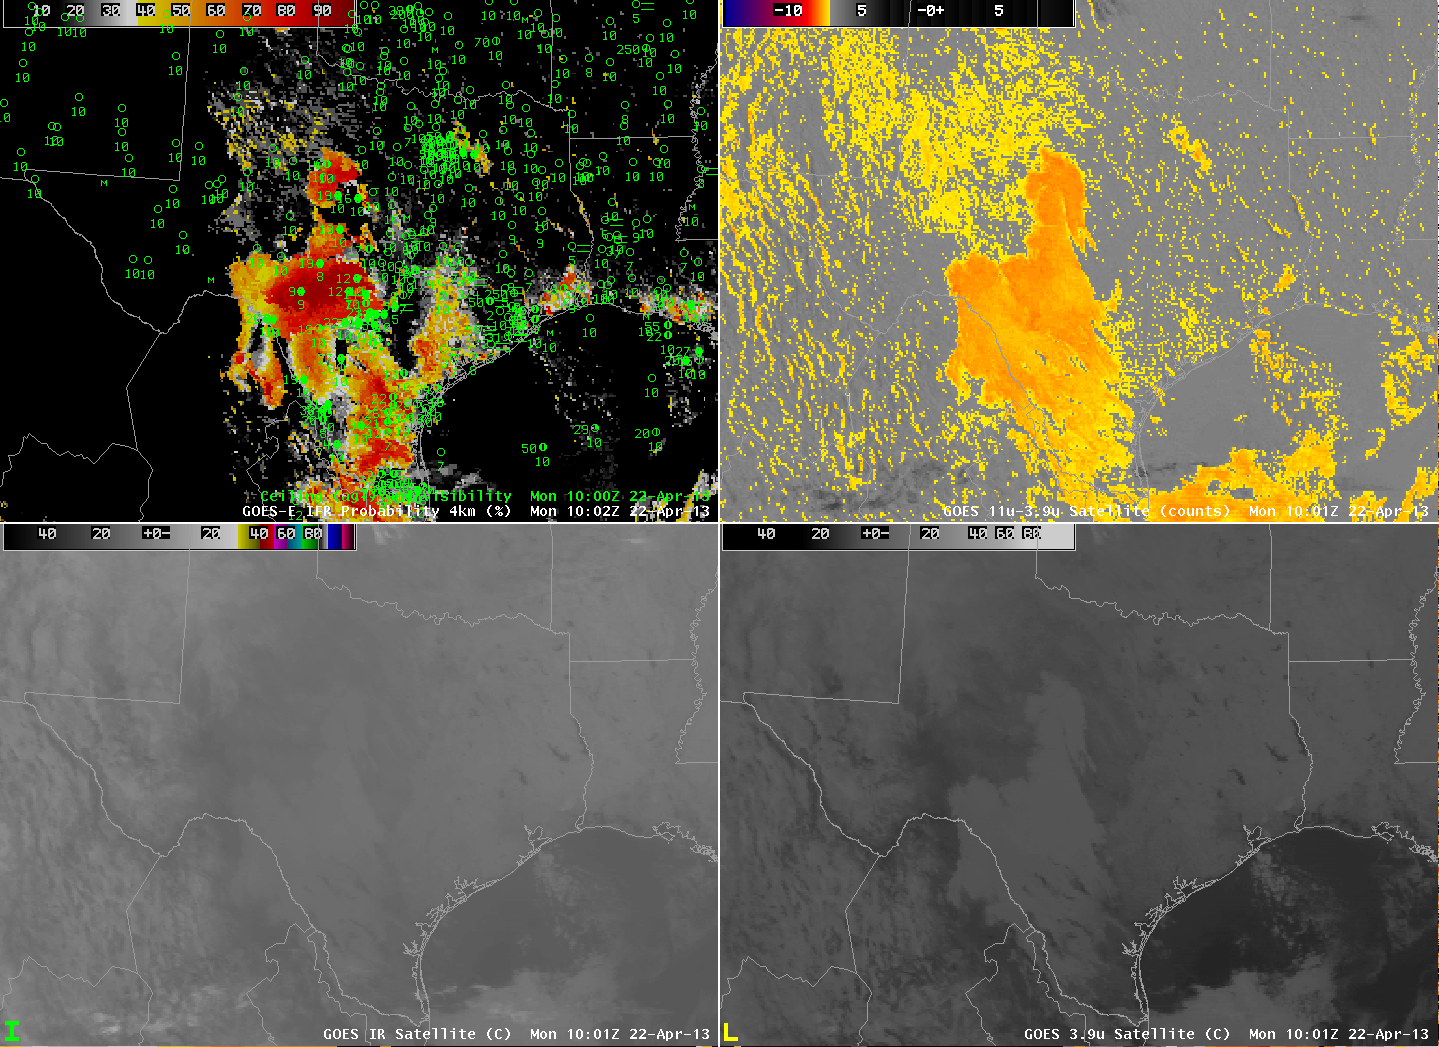
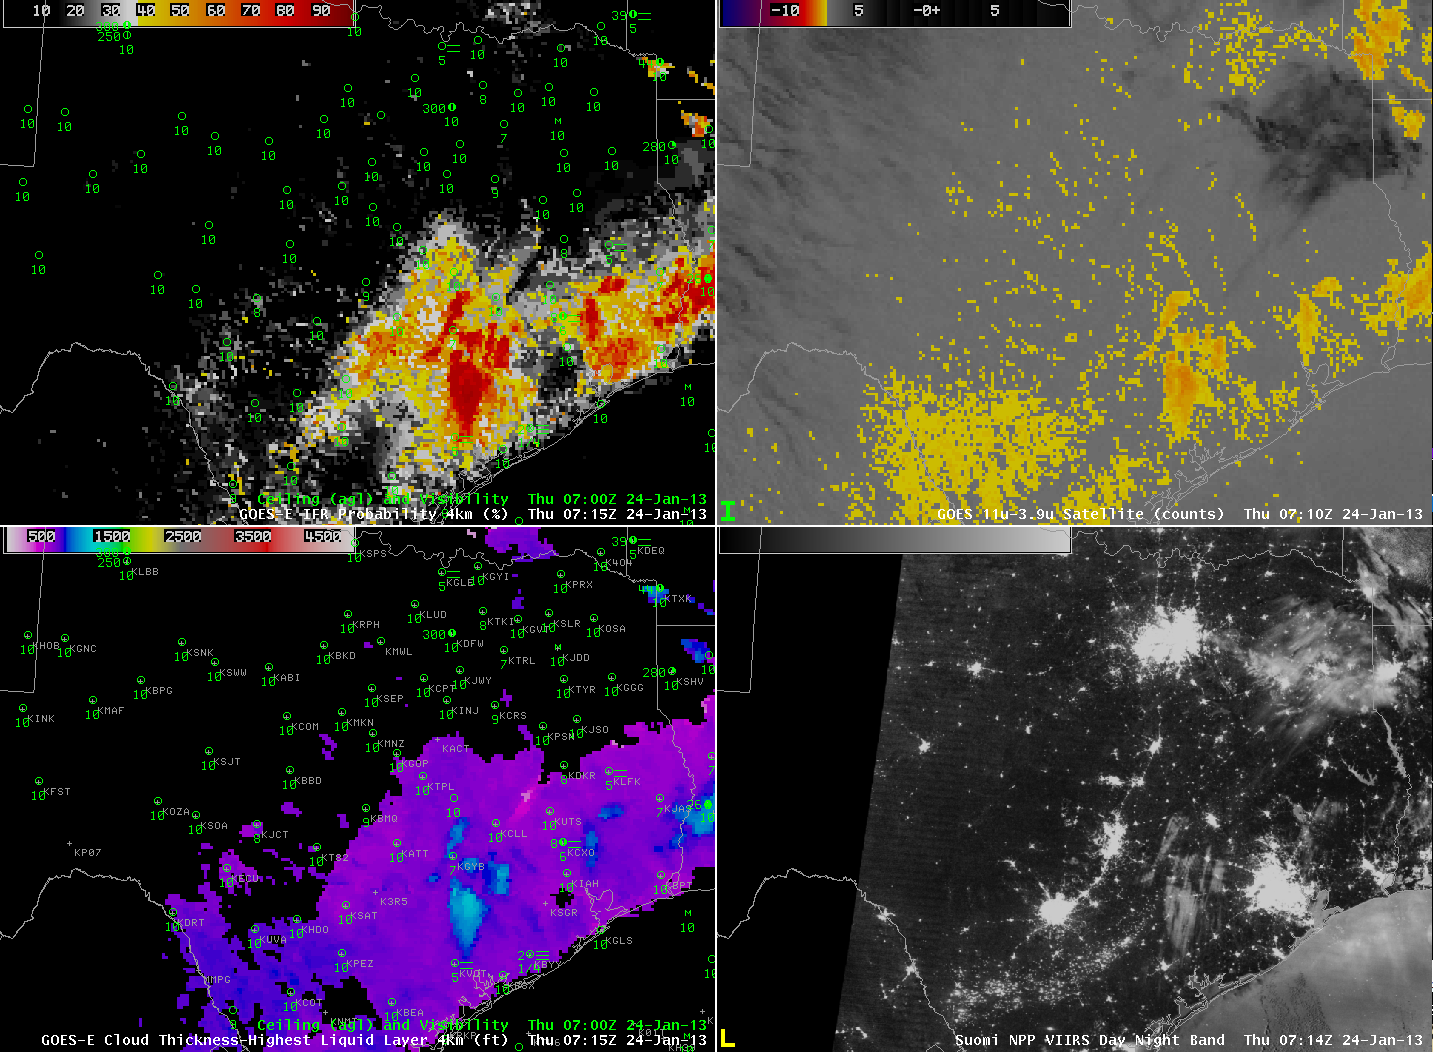
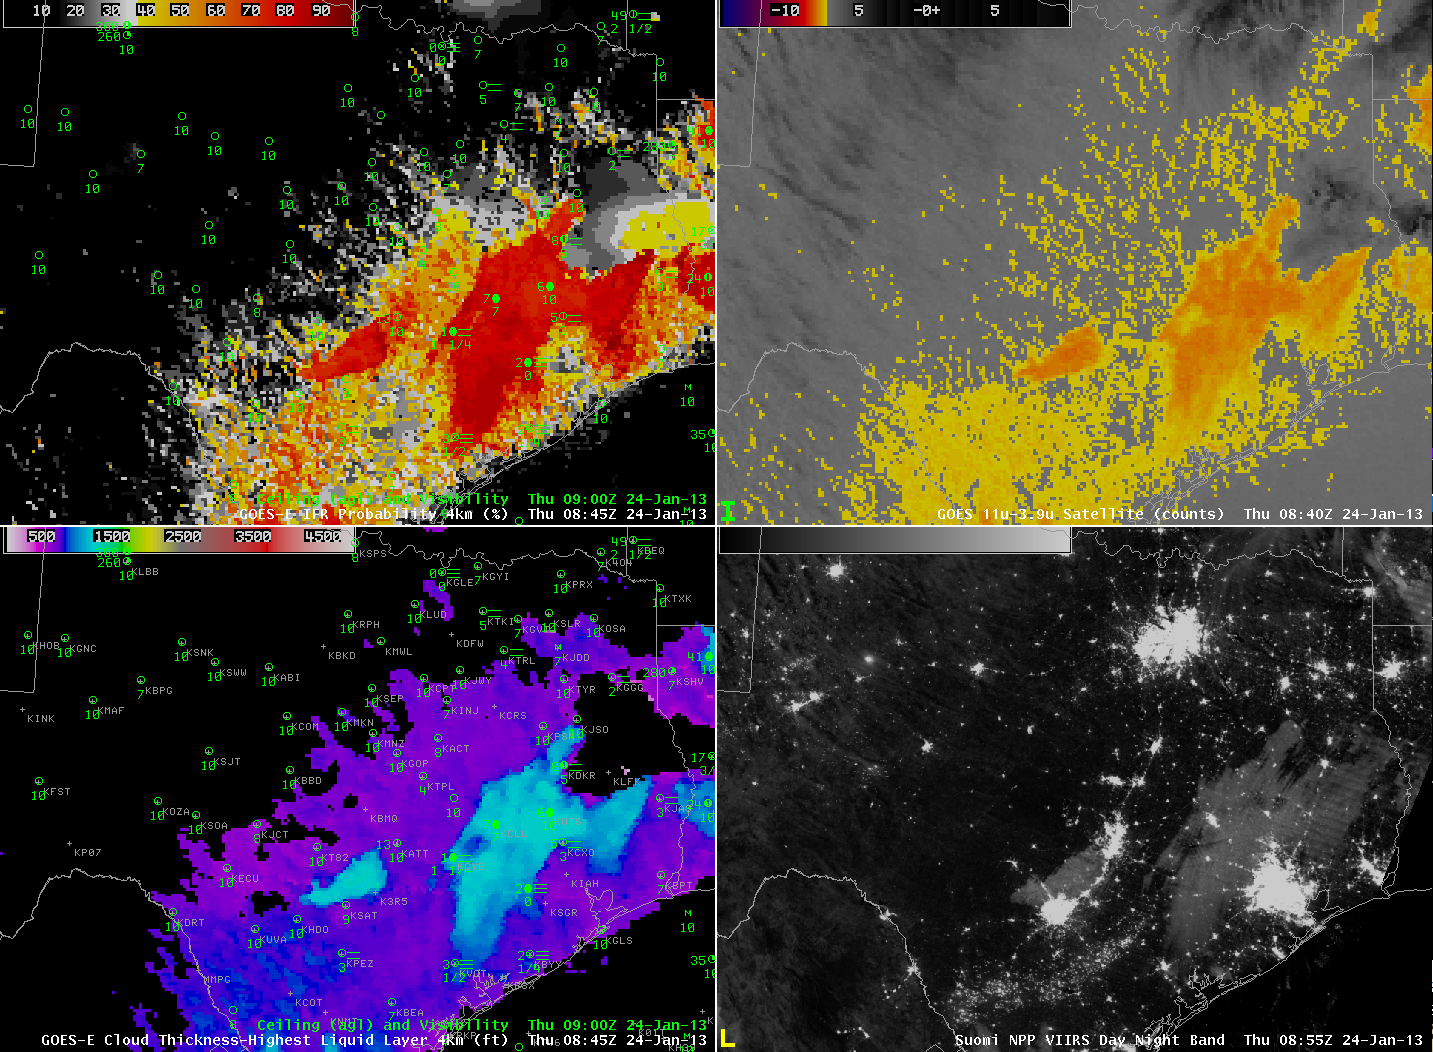
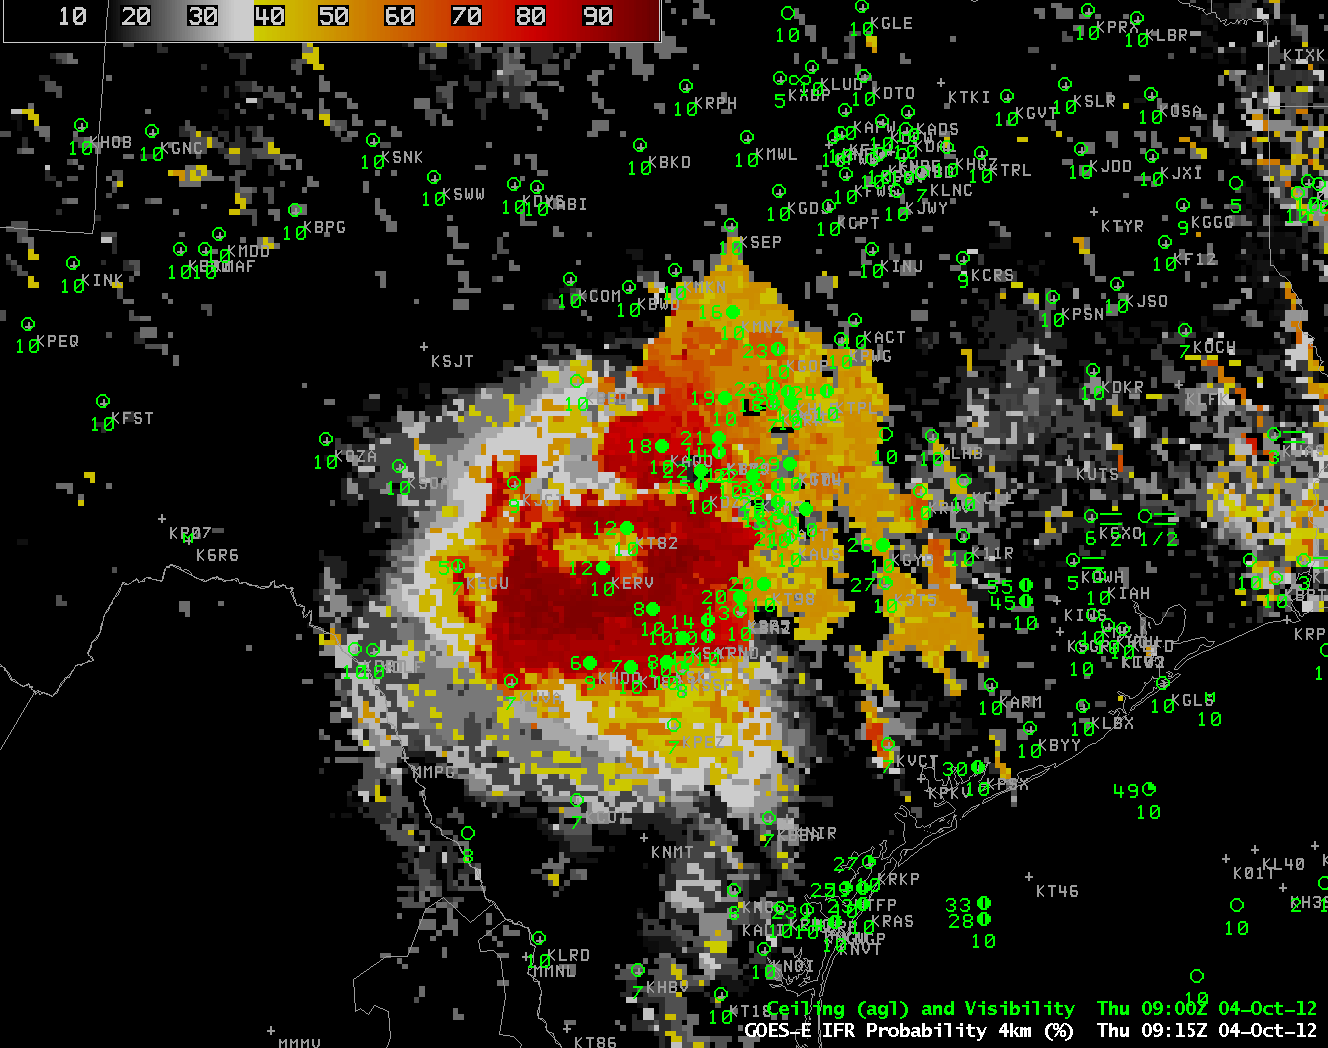
GOES-R IFR Probabilities computed from GOES-13 and Rapid Refresh Data, 0700-1300 UTC, 6 February 2015 (Click to enlarge)

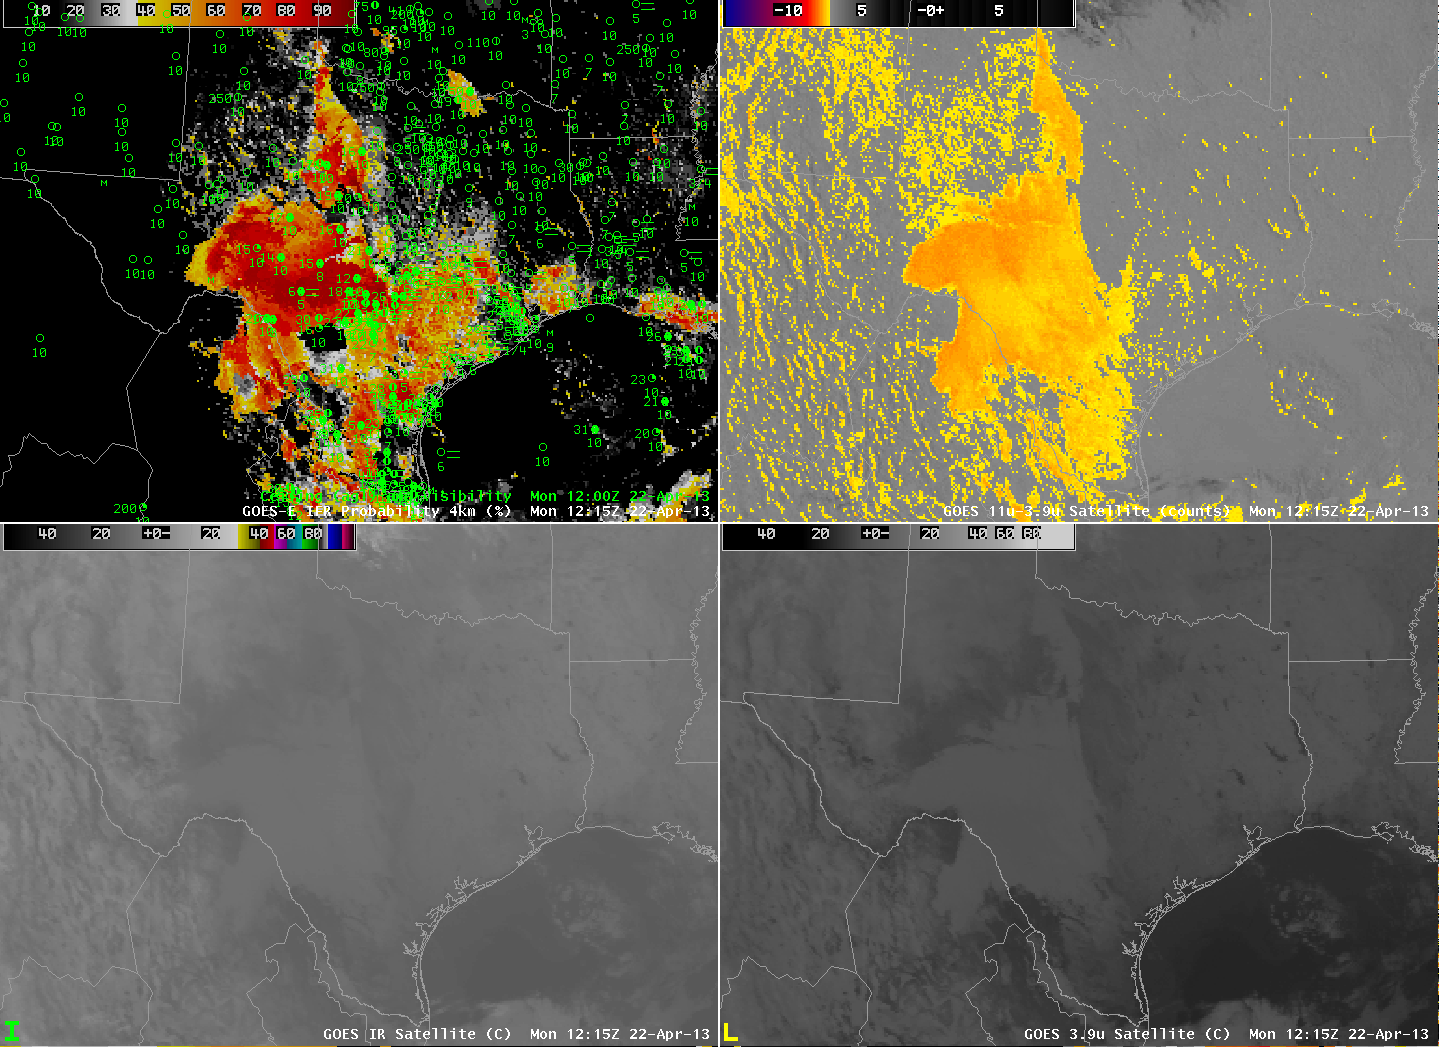
Fog developed over the Pecos River valley in southeastern New Mexico early on the morning of 6 February. This small-scale feature was captured well by the GOES-R IFR Probability fields, shown above. Probabilities increased quickly between 0745 and 0800 UTC. In contrast, the brightness temperature difference product, below, showed little signal until around 1000 UTC. GOES-R IFR Probability fields responded more quickly to the possible development of fog and in this case could have alerted any forecaster to its imminent formation. IFR conditions were present at Carlsbad (KCNM), Artesia (KATS) and Roswell (KROW) by 1100 UTC.

US_11-3.9_Sat_20150206_0700_1300

GOES-13 Brightness Temperature Difference fields, 0700 through 1300 UTC, 6 February 2015 (Click to enlarge)

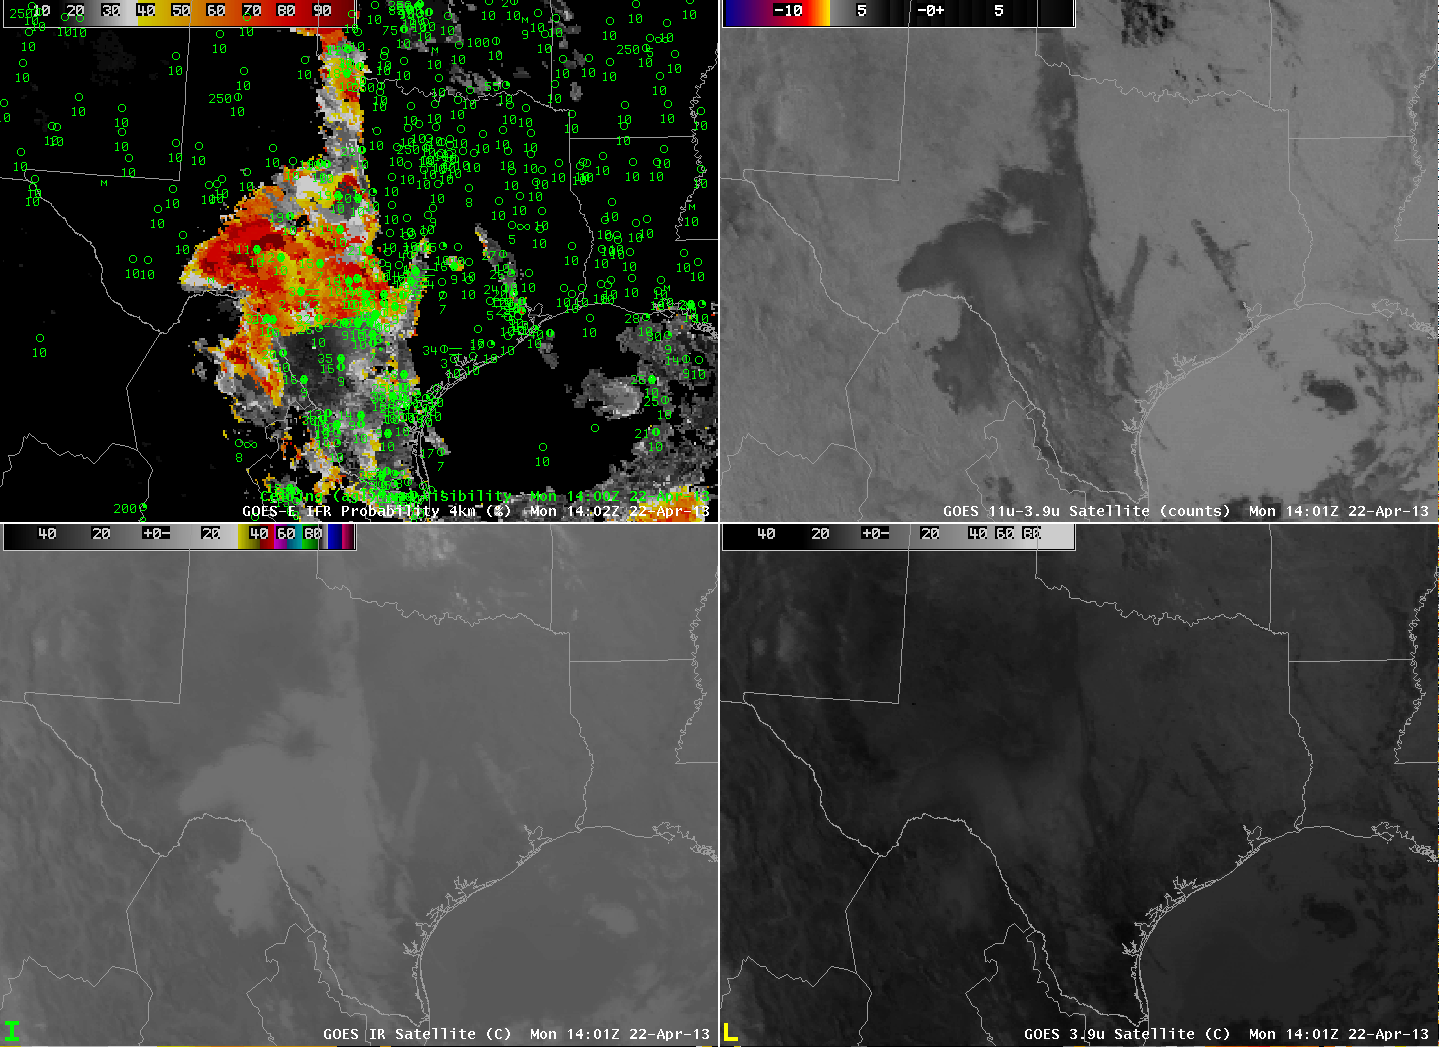
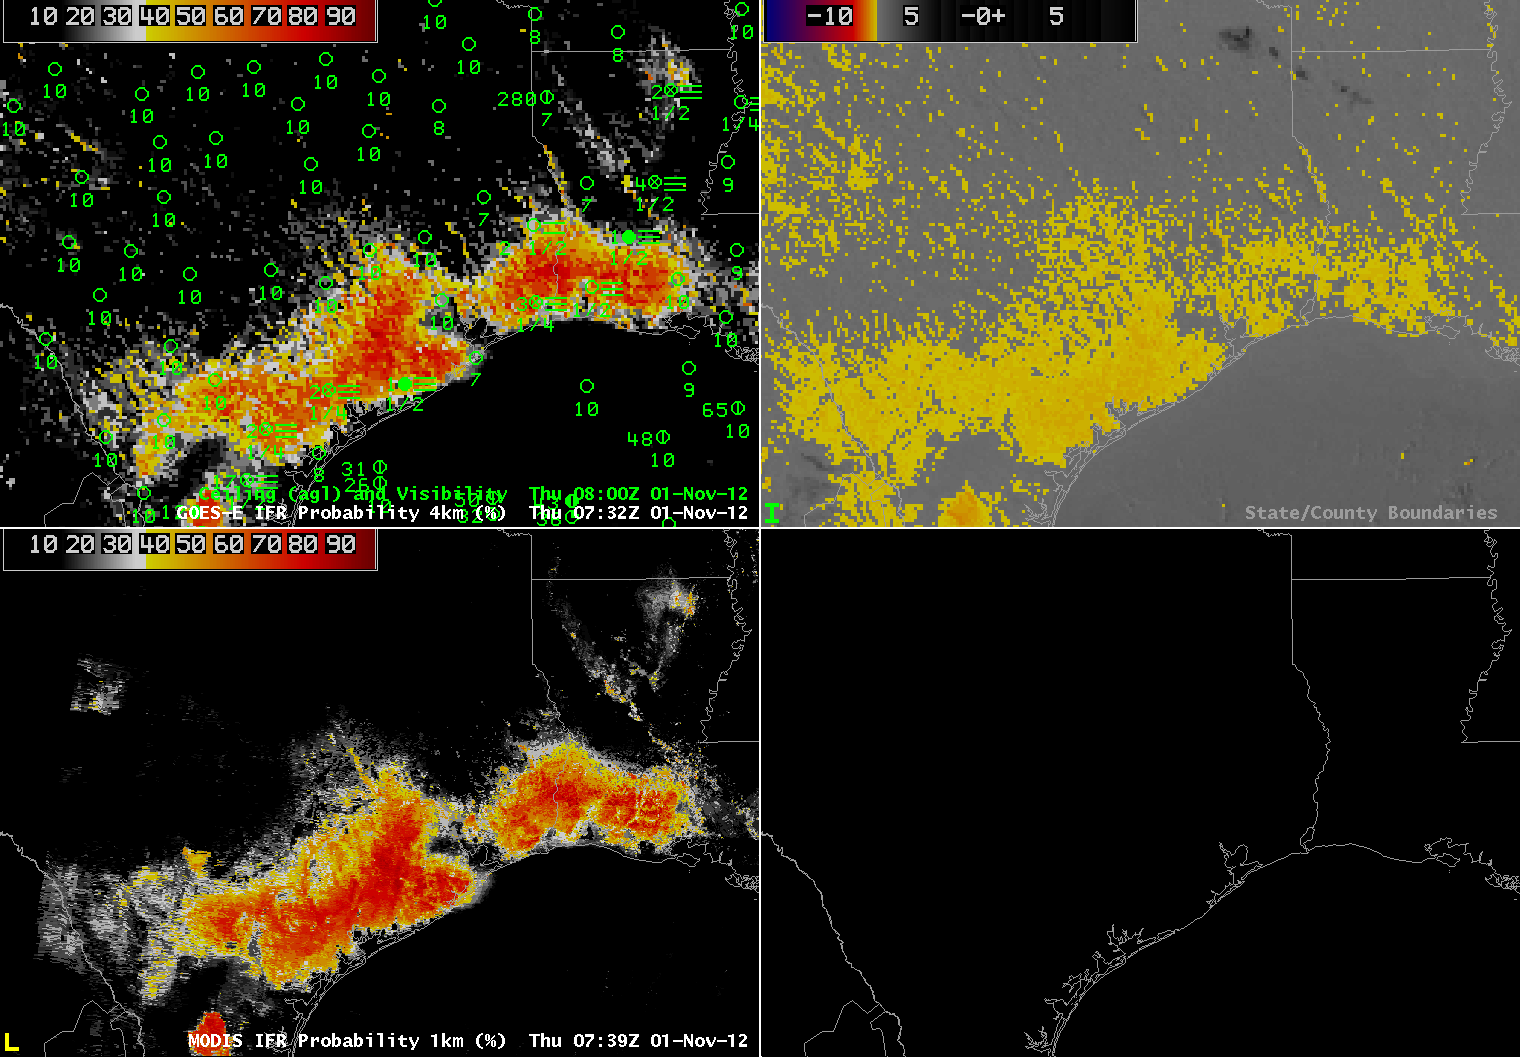
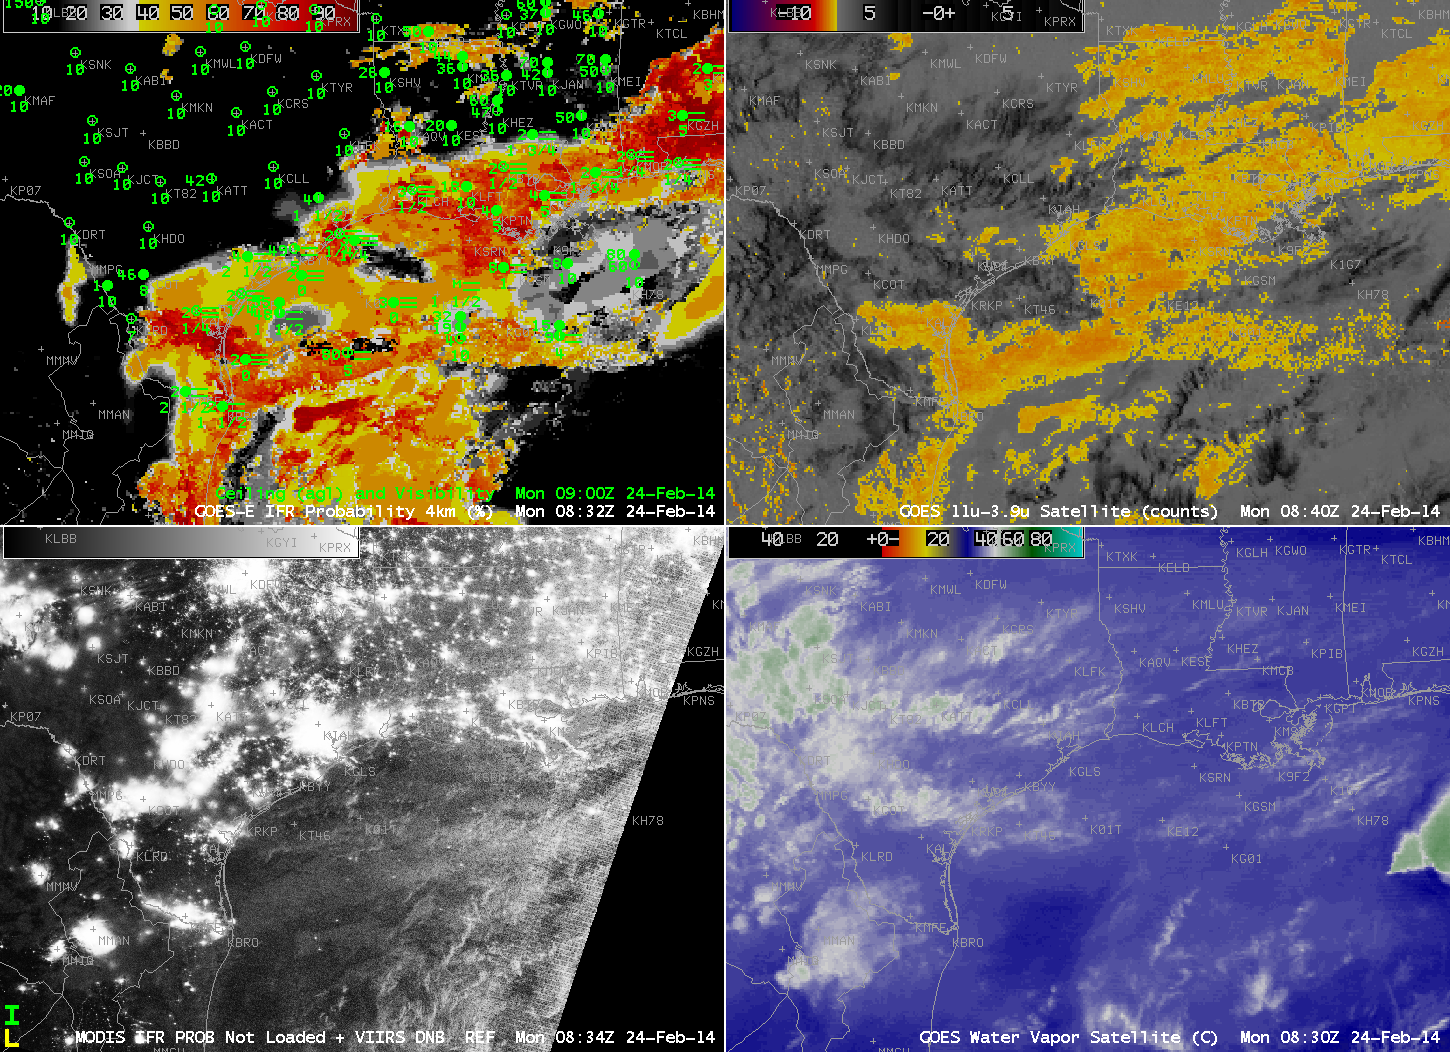
MODIS data from Terra and Aqua, and VIIRS data from Suomi NPP give occasional snapshots (at high resolution) of conditions. Terra (just before 0500 UTC) and Aqua (around 0900 UTC) data were used to compute IFR Probabilities, and the high resolution data, below, is consistent with the development of fog over night. The 0900 UTC image especially suggests the possibility of fog.

MODIS_IFR_PROB_20150206_0448_0901

MODIS IFR Probability from Terra (0448 UTC) and Aqua (0901) UTC on 6 February 2015 (Click to enlarge)

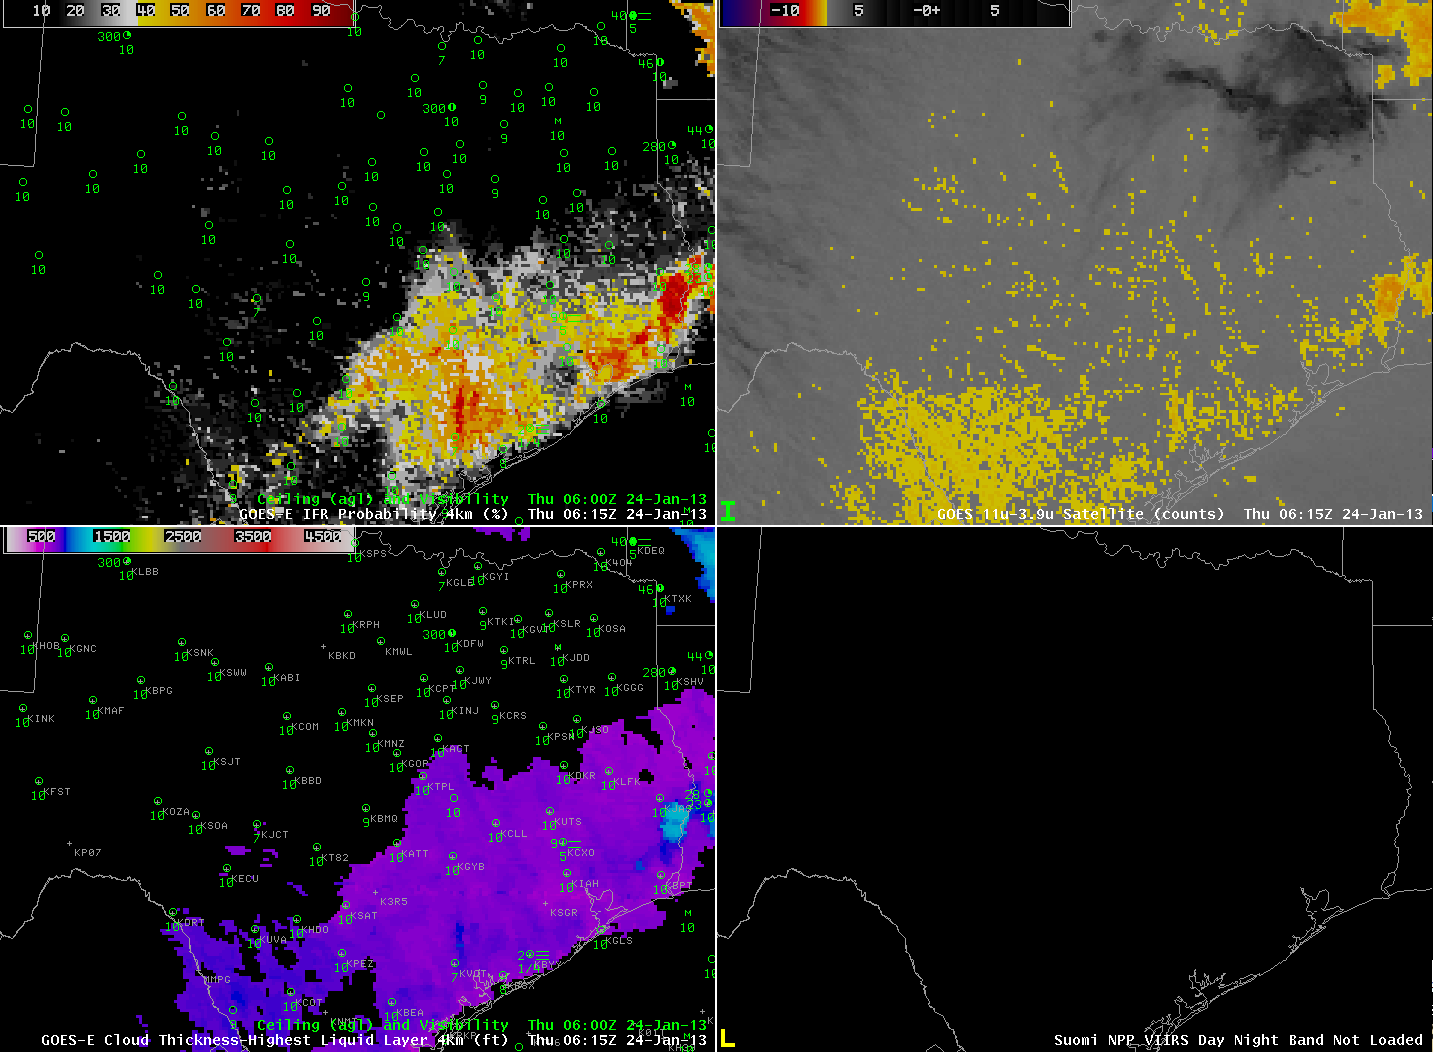
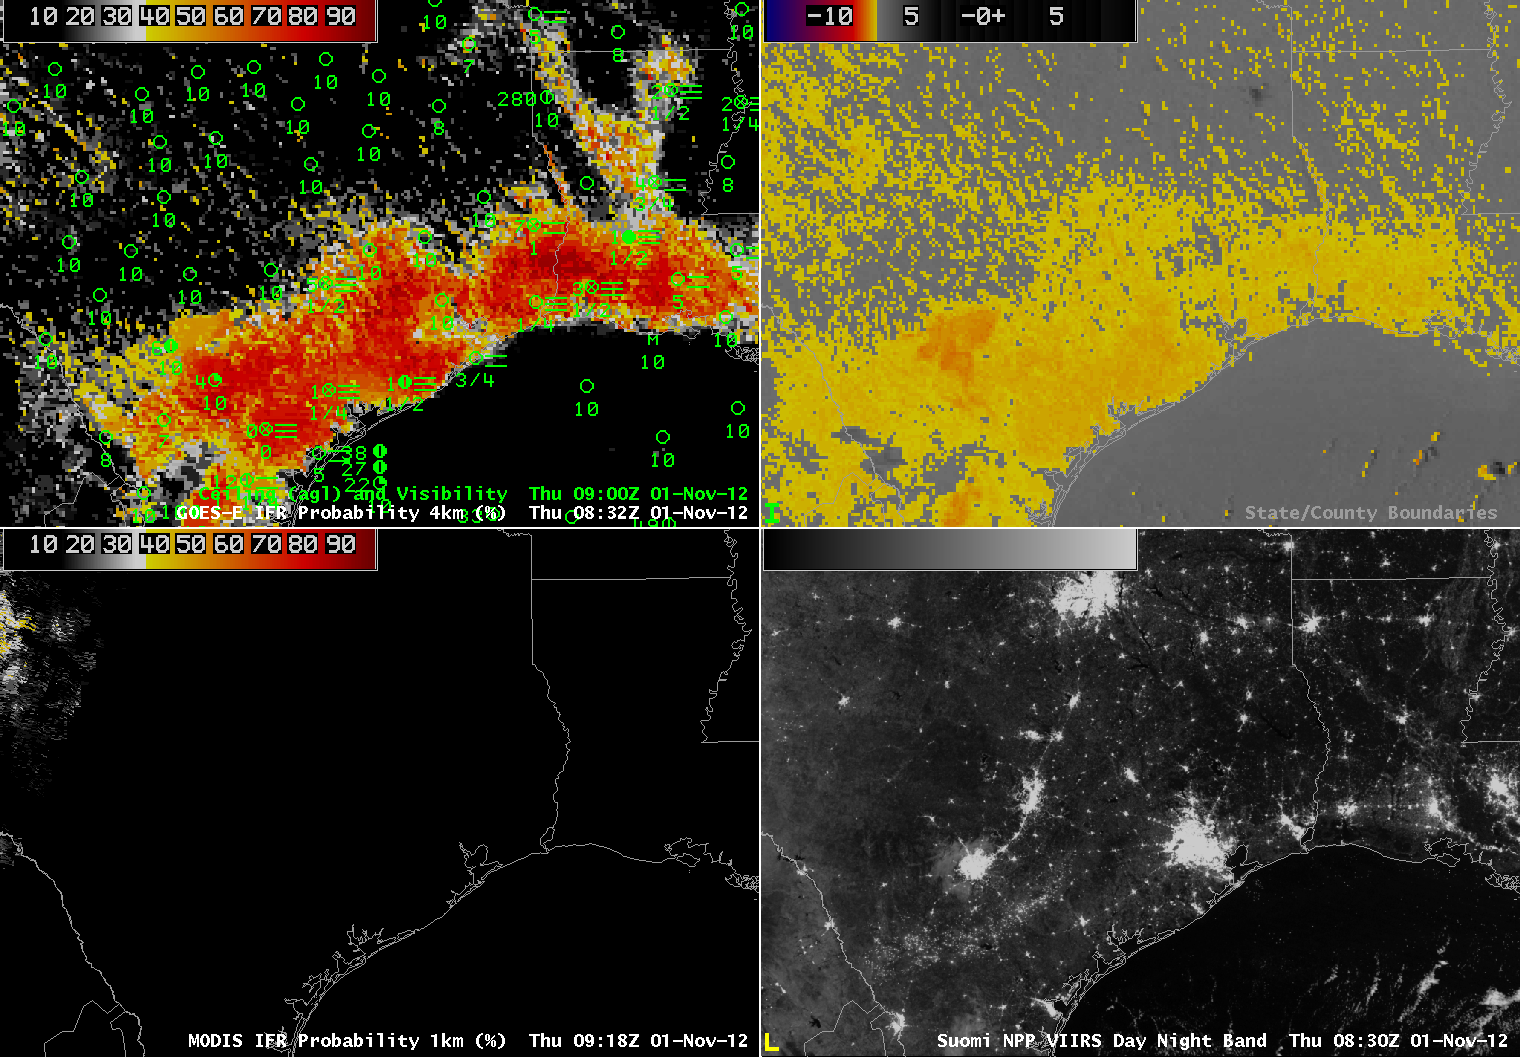
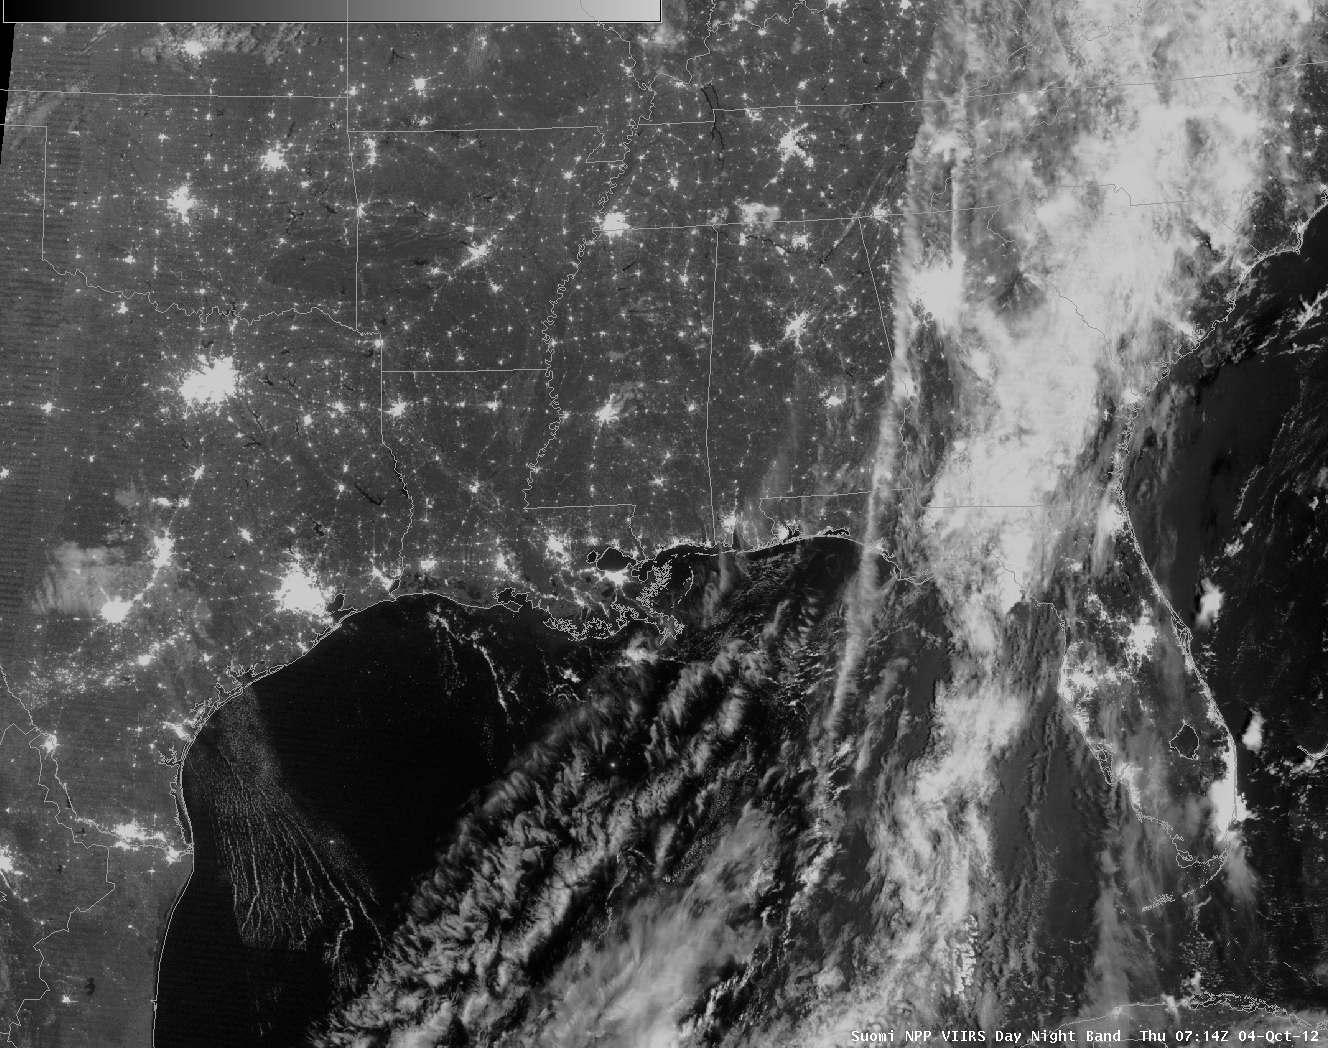
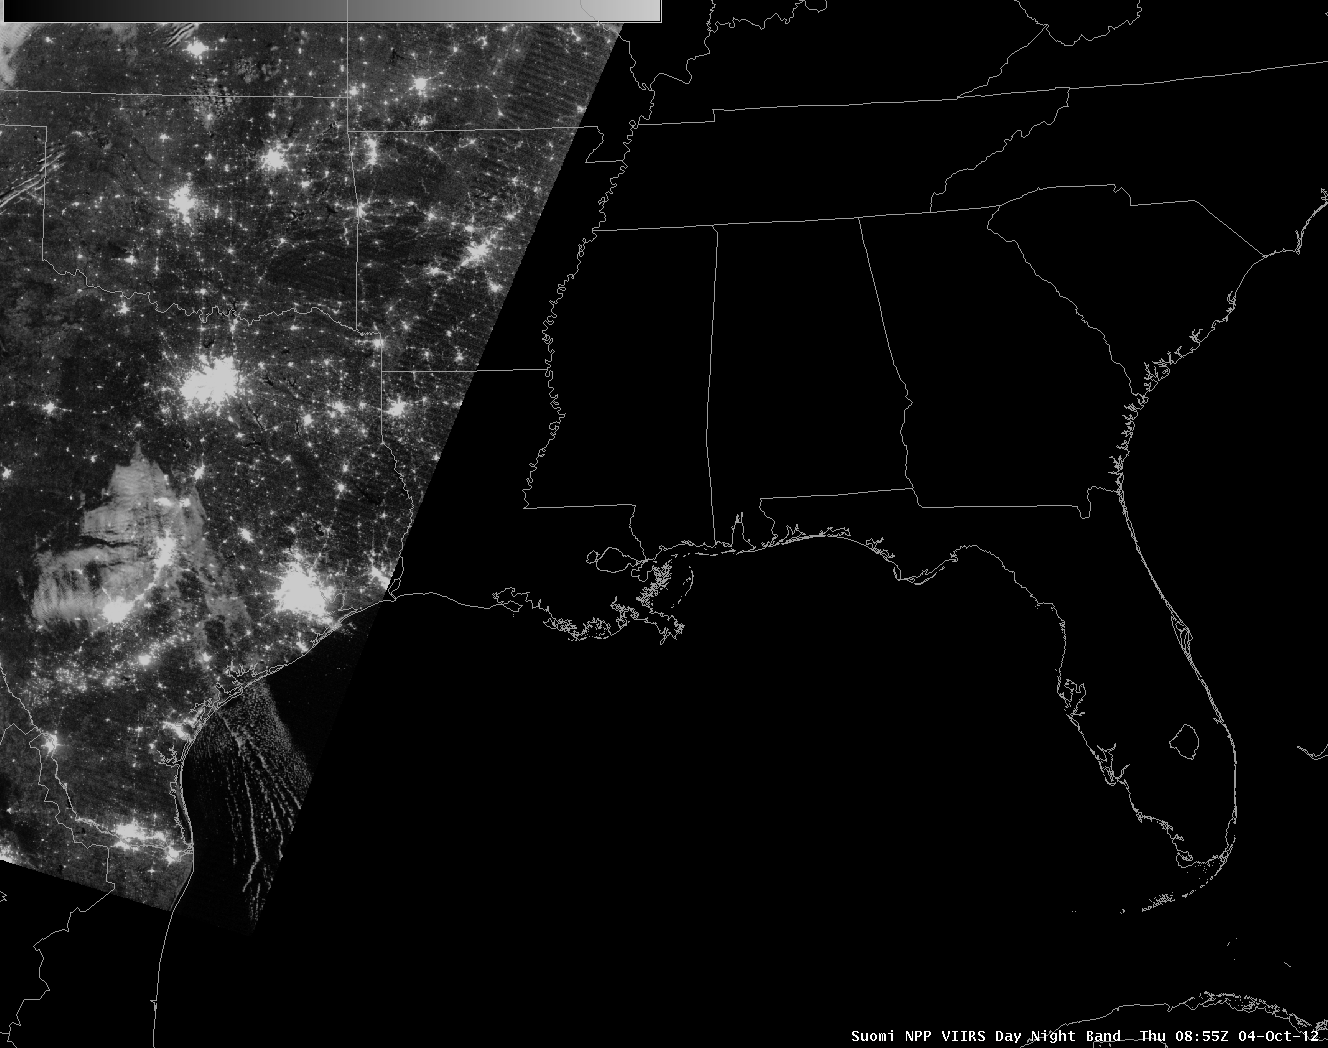
Suomi NPP data are not yet used to compute IFR Probabilities. The toggle, below, of the Day Night Band and the Brightness Temperature Difference at 0835 UTC does not show convincing evidence of fog at that time. The Day Night Band is very crisp because of the near Full Moon that provided ample lunar illumination.

VIIRS_DNB_FOG_20150206_0835

Suomi NPP Day Night Band and Brightness Temperature Difference, 0835 UTC, 6 February 2015 (Click to enlarge)

The imagery above all suggest that the presence of model data — from the Rapid Refresh — enhanced the satellite data as far as suggesting IFR conditions.

South Texas Fog and low stratus

GOES_IFR_PROB_20150204anim

GOES-R IFR Probabilities, half-hourly from 0045 UTC to 1215 UTC on 4 February 2015, along wtih surface reports of ceilings and visibilities (Click to enlarge)

Fog developed over south Texas during the morning of 4 February. How did the GOES-R IFR Probability Products perform for this example, and what can be learned from them? There are at least two distinct regions in the animation above. Over much of southeast Texas, the IFR Probability field suggests multiple cloud layers are present. IFR Probabilities are smaller here because satellite-based cloud information cannot be used in the algorithm in regions where high/mid-level clouds preclude a satellite’s view of low stratus and fog. It is important to interpret the IFR Probability fields with knowledge of the cloud levels that are present. Towards the middle of the loop, fog develops in/around Midland over the high Plains. IFR Probabilities are large there because satellite data are used as a predictor because high clouds are not impeding the satellite’s view of the developing region of fog/stratus. Brightness Temperature Difference Fields from GOES, below, show the difficulty in using that field to detect fog/low stratus in regions where multiple cloud layers exist. There are many stations underneath high clouds that have undetectable (via satellite) IFR conditions.

US_11-3.9_Sat_20150204_0140_1215

GOES-13 Brightness Temperature Difference (10.7µm – 3.9µm), 0245 – 1215 UTC 4 February 2015 (Click to enlarge)


MODIS_GOES_IFRPROB_20150204_0915

Toggle between GOES-based and MODIS-based IFR Probabilities at 0915 UTC on 4 February 2015 (Click to enlarge)

MODIS data from Aqua can also be used to compute IFR Probabilities, as shown above. In general, there is very good agreement between GOES and MODIS-based fields, but there are some very interesting differences along the limb of the MODIS scan in central TX where GOES data shows smaller values of IFR Probabilities than is shown in the MODIS fields — for example at San Angelo (KSJT), Kirksville (KCOM) and Brady (KBBD). This occurs in a region where limited observations show near-IFR conditions. The higher values along the limb of the MODIS scan are likely due to limb brightening that arises because the radiation being detected comes from a path that traverses more of the (colder) upper atmosphere. The affect is wavelength-dependent, and thus will show up in a brightness temperature difference field as a stronger signal, and that stronger signal will influence the IFR Probability fields. In short: interpret MODIS IFR Probability fields along the edge of the MODIS swath with this knowledge of limb effects.

VIIRS_FOG_20150204_0279_0910

Brightness Temperature Difference (11.35 µm – 3.74 µm) from Suomi NPP at 0729 and 0910 UTC (Click to enlarge)

Suomi NPP also viewed the evolving fog/stratus field over Texas, and two brightness temperature difference fields, from sequential overpasses, are shown above. Brightness Temperature Difference fields can only give information about the top of the cloud, not the cloud base, and the cloud base is the important piece of information needed for fog detection. There are regions under the high clouds, for example, with IFR conditions. The eye is drawn by the enhancement to regions of low clouds/stratus, but important visibility restrictions are occurring elsewhere as well. The high resolution imagery of Suomi NPP does show compelling structures in the cloud fields, however. Note also the presence of limb brightening: Compare the brightness temperature fields west of Midland during the two times.

The Day Night Band from the morning of 4 February — near Full Moon — showed excellent structure in the cloud features, all made visible by ample lunar illumination as shown below. It is difficult, however, to use cloud-top information from the Day Night band to infer the presence of IFR conditions.

VIIRS_DNB__REF_20150204_0729_0910

Day Night Band (0/70 µm) from Suomi NPP at 0729 and 0910 UTC (Click to enlarge)

Sharp edge to Fog/Low Stratus over east Texas

US_11-3.9_Sat_20141229_2_14anim

Brightness Temperature Difference Fields (10.7µm – 3.9µm) and surface observations of ceilings and visibilities, Hourly from 0200 through ~1400 UTC [Click to enlarge].

Traditional method of fog/low stratus detection revealed a sharp edge to clouds over east Texas during the morning of 29 December 2014. The animation above reveals several difficulties inherent in using brightness temperature difference fields in diagnosing fog/low stratus. Where multiple cloud layers are present — such as along the coast at 0500-0600 UTC — the brightness temperature difference product cannot view the low clouds. At sunrise, increasing amounts of solar 3.9µm radiation causes the brightness temperature difference product to flip sign. The signal for low clouds is still there, however.

GOES_IFR_PROB_20141229_2_14anim

GOES-R IFR Probabilities and surface observations of ceilings and visibilities, Hourly from 0200 through ~1400 UTC [Click to enlarge]

The animation of GOES-R IFR Probabilities, above, created from GOES-13 data and Rapid Refresh Model data, shows high IFR Probabilities over east Texas where low ceilings and reduced visibilities prevailed, including metropolitan Houston. The algorithm suggests the likelihood of fog/low stratus underneath the cirrus debris that is over the coast around 0500-0600 UTC as well, because the Rapid Refresh model output in that region strongly suggests low-level saturation. In addition, the fields show only minor changes through sunrise (the effect of the terminator is present in the final image in the loop).

MODIS data from either Terra or Aqua can be used to produce IFR Probabilities. The data below is from 0442 UTC. Polar orbiter data is infrequent, however, so temporal monitoring of the fog/low clouds is more easily achieved using GOES data.  MODIS data, like the GOES data above, shows the effects of cirrus clouds on Brightness Temperature Difference fields and on IFR Probabilities.  Cloud predictors of low clouds/fog from satellite cannot be used in regions of cirrus, so IFR Probabilities are smaller in regions where multiple cloud layers exist, which regions are where only Rapid Refresh Data can be used as predictors.

MODIS_IFR_PROB_BTD_20141229_0442

0442 UTC MODIS-based brightness temperature difference and IFR Probability fields (Click to enlarge)


Brightness Temperature Difference fields can also be created from Suomi/NPP data and the orbital geometry on 29 December meant that eastern Texas was viewed on two sequential overpasses.  IFR Probabilities are not quite yet computed using Suomi NPP data, but the brightness temperature difference fields can be used to show where water-based clouds exist. They show a very sharp western edge to the clouds.

VIIRS_FOG_20141229_0723_0904

Brightness Temperature Difference Fields (11.35µm – 3.74µm) from Suomi NPP at 0723 and 0904 UTC on 29 December 2014 (Click to enlarge)

The Day Night Band on Suomi NPP produces visible imagery at night. When lunar illumination is strong, it can provide compelling imagery. On 29 December 2014, however, the moon set around 0600 UTC, so no lunar illumination was available, and fog/low clouds are very difficult to discern in the toggle below between the Day Night Band and the brightness temperature difference field at 0723 UTC.

VIIRS_FOG_DNB_20141229_0723

Day Night Band and Brightness Temperature Difference Fields (11.35µm – 3.74µm) from Suomi NPP at 0723 on 29 December 2014 (Click to enlarge)


Sea fog over the western Gulf of Mexico

The National Weather Service in Houston/Galveston has issued Dense Fog advisories for Sea Fog in the easterly flow south of a cold front draped across the northern Gulf:

MARINE WEATHER STATEMENT
NATIONAL WEATHER SERVICE HOUSTON/GALVESTON TX
602 PM CST SUN FEB 23 2014

GMZ330-335-350-355-370-375-260000-
MATAGORDA BAY-GALVESTON BAY-
WATERS FROM FREEPORT TO THE MATAGORDA SHIP CHANNEL OUT 20 NM-
WATERS FROM HIGH ISLAND TO FREEPORT OUT 20 NM-
WATERS FROM FREEPORT TO THE MATAGORDA SHIP CHANNEL 20 NM TO 60 NM-
WATERS FROM HIGH ISLAND TO FREEPORT 20 TO 60 NM-
602 PM CST SUN FEB 23 2014

…DENSE SEA FOG POSSIBLE ACROSS THE AREA FOR THE NEXT SEVERAL DAYS…

AREAS OF SEA FOG…SOME DENSE WITH VISIBILITIES OF 1 NM OR LESS…WILL
CONTINUE TO BE POSSIBLE IN AND AROUND THE GALVESTON AND MATAGORDA BAY
AREAS ALONG WITH THE UPPER TEXAS COASTAL WATERS OUT TO APPROXIMATELY
20 NM. DENSE FOG ADVISORIES MIGHT BE NEEDED.

LITTLE CHANGE IN THIS PATTERN IS EXPECTED UNTIL THE PASSAGE OF THE NEXT
COLD FRONT SOME TIME AROUND LATE TUESDAY NIGHT OR EARLY WEDNESDAY
MORNING.

MARINERS SHOULD BE PREPARED FOR SUDDEN CHANGES IN VISIBILITY OVER SHORT
DISTANCES. REDUCE YOUR SPEED AND KEEP A LOOKOUT FOR OTHER VESSELS…BUOYS
AND BREAKWATERS. KEEP YOUR NAVIGATION LIGHTS ON. INEXPERIENCED MARINERS…
ESPECIALLY THOSE OPERATING SMALLER CRAFT OR NOT EQUIPPED WITH RADAR…SHOULD
CONSIDER SEEKING SAFE HARBOR.

$$

How does the GOES-R IFR Probability field handle this event?

GOES_IFR_PROB_20140224loop

GOES-Based GOES-R IFR Probabilities (Upper Left), GOES-East Brightness Temperature Difference Fields (10.7 µm – 3.9 µm) (Upper Right), Suomi/NPP Day/Night band and MODIS-based IFR Probability fields (Lower Left), GOES-East Water Vapor Imagery (6.7 µm)(Lower Right), hourly from 0400 UTC through 1600 UTC 14 February 2014 (click image to enlarge)

IFR Probabilities are correctly limited to coastal regions of east Texas, with high values off shore. The brightness temperature difference field has difficulty identifying regions of low clouds over the Gulf of Mexico because of southwesterly flow aloft that contains mid- and high-level cloudiness. The relatively flat field over the Gulf — large values, but little variability — correspond to regions where high clouds exist. These high clouds prevent satellite predictors from being used in the IFR Probability algorithm because the brightness temperature difference does not observe low clouds, so only the Rapid Refresh model output is used to compute the IFR Probability. Therefore the IFR Probability fields are a bit flatter. Where there are breaks in the high clouds, the brightness temperature difference field can be used in the IFR Probability algorithm, and the computed IFR Probability is larger. In addition, the character of the probability field is more pixelated like a satellite image.

The bottom left image in the 4-panel composite above includes both the Day/Night band from Suomi/NPP (an image that — because of scant lunar illumination — gives little distinct information about the clouds present) and a MODIS-based IFR Probability field. For selected still imagery of ~0830 UTC Suomi/NPP click here; click here for ~0730 UTC MODIS-based IFR probability.

IFR Probability Fields are an early-alert for Developing Fog

GOES_IFR_PROB_20140214loop

GOES-R IFR Probabilities from 0400 through 1400 UTC on 14 February 2014 (click image to enlarge)

Fog and Low clouds resulted in IFR conditions along a long swath of the western Gulf Coast today. IFR Probability fields warned of the development of these conditions long before a strong signal appeared in the traditional brightness temperature difference fields. The animation above, of hourly GOES-R IFR Probability fields (and surface observations of ceiling and visibility). There are indications by 0615 and 0702 that fog/low stratus is developing, and those indications are matched by some observations of IFR conditions. By 0915 UTC, widespread IFR conditions are present from southwest Louisiana southwestward through coastal Texas.

GOESMODIS_IFR_20140214_0845

GOES-R IFR Probabilities, MODIS IFR Probabilities, and MODIS Brightness Temperature Difference fields, all from ~0845 UTC 14 February 2014 (click image to enlarge)

MODIS data can be used to generate IFR Probabilities as well, as shown above. The MODIS-based and GOES-based fields both generally overlap regions with developing IFR conditions. The MODIS-based Brightness temperature difference product (called MODIS FOG in the image annotation) shows little signal in central Louisiana/east Texas (near Lufkin, for example) or southwest of Houston, two places where near-IFR conditions are developing (and where the IFR Probability fields have a signal).

VIIRS_DNB_FOG_20140214toggle

GOES-R IFR Probabilities, MODIS IFR Probabilities, and MODIS Brightness Temperature Difference fields, all from ~0845 UTC 14 February 2014 (click image to enlarge)

Suomi/NPP data (Brightness Temperature Difference fields, and the Day/Night band) from the same hour (0822 UTC) as the MODIS data similarly underpredicts the areal extend of the developing IFR conditions.

GOES_IFR_PROB_20140214_4panelloop

GOES-Based GOES-R IFR Probabilities (Upper Left), GOES-East Brightness Temperature Difference Fields (Upper Right), GOES-R Cloud Thickness (Lower Left), GOES-East Visible Imagery (Lower Right), hourly from 0400 UTC through 1600 UTC 14 February 2014 (click image to enlarge)

The animation above shows hourly views of GOES-R IFR Probability and GOES-East Brightness Temperature Difference fields. There is little discernible signal in the brightness temperature difference field until about 0915 UTC (several hours after the IFR Probability field has been suggesting fog development). Thus the GOES-R IFR Probability field is giving better lead time is diagnosing where visibility restrictions might occur/be occurring. In addition, the GOES-R Cloud Thickness product shows that the thickest fog/stratus field just before sunrise is just east of Austin/San Antonio, and that is the last region to clear out after sunrise.

The presence of high clouds has an effect on both the IFR Probability fields and the brightness temperature difference field. When high clouds are present (in the brightness temperature difference enhancement used, high clouds are dark), IFR Probabilities drop in value and the field becomes flatter because satellite data cannot be used in the computation of the IFR Probability Field.

Stratus and Fog over Texas

GOES-R IFR Probabilities (Upper Left) computed with GOES-East data, GOES-East Brightness Temperature Difference (10.7µm – 3.9µm) (Upper Right), Toggle between MODIS-based IFR Probabilities and Suomi-NPP Day-Night band imagery (Lower Left), Suomi-NPP Brightness Temperature Difference (Bottom Right) (10.8 µm- 3.74µm), all imagery around 0800 UTC

Stratiform clouds developed overnight in return flow from the Gulf of Mexico.  Some of the stratus was elevated, and some was closer to the surface creating IFR conditions.  The GOES imagery above captures the area of low clouds that are also visible in the Day/Night band — but the MODIS IFR Probability field suggests a difference in the stratus field near San Antonio.  Probabilities are far higher north of San Antonio’s latitude than south.  Surface observations suggest that IFR conditions are more likely where the MODIS-based IFR probabilities are highest.  (This demarcation line in the IFR Probability is far more noticeable in MODIS than in GOES).

Note that the GOES Brightness Temperature Difference field has a positive signal that is near the north-south oriented lakes in eastern Texas and western Louisiana, and that signal is absent from the VIIRS Brightness Temperature Difference field.  There is a misalignment between the 3.9 and 10.7 µm channels on GOES-13 (as discussed here) that has a maximum near 0900 UTC and that results in a false signal of low clouds.  This co-registration error can propagate into the IFR Probability field in regions where the Rapid Refresh is suggesting near-saturation at lower levels.

GOES-R IFR Probabilities (Upper Left) and surface observations of ceilings and visibility, GOES-East Brightness Temperature Difference (10.7  – 3.9) (Upper Right), Brightness Temperature at 10.7 (Lower Left) and 3.9 (Lower Right) at 1000 UTC (top image), 1215 UTC (middle image) and 1402 UTC (bottom image).

The demarcation between regions with IFR conditions and MVFR/VFR conditions becomes more distinct in the GOES-based IFR probability fields at 1000, 1200 and 1400 UTC, as shown above.  At all three times, the IFR probability field more accurately portrays the region of clouds that is most likely affecting aviation by displaying IFR conditions.

Radiation Fog over Texas, Day 2

GOES-R IFR Probabilities computed from GOES-East and the Rapid Refresh Model (Upper Left), GOES-East Brightness Temperature Difference (10.7 µm – 3.9 µm) (Upper Right), GOES-R Cloud Thickness computed from GOES-East (Lower Left), Suomi/NPP VIIRS Day/Night Band (Lower Right), 0615 UTC on 24 January 2013

Clear skies and light winds again allowed for the development of radiation fog over southeast Texas.  How did the development, and the detection of fog, differ for this event from the event 1 night previous (as discussed here).  The 0615 UTC imagery, above, shows a separation between where the Brightness Temperature Difference (the heritage fog detection product) and where the GOES-R IFR probabilities are suggesting fog is present.  The Heritage Fog Product is focused on the Rio Grande Valley whereas the GOES-R IFR Probability is focused (correctly, as it turns out) on southeast Texas.  Note also that the Brightness Temperature Difference product has a signal representative of higher clouds (the dark region) over northeast Texas.

As above, but at ~0715 UTC

 At 0715 UTC, IFR probabilities are increasing over southeast Texas between Houston and San Antonio.  Suomi/NPP Day/Night band imagery at that time shows evidence of clouds in the region of highest IFR probabilities.  The traditional brightness temperature difference product continues to highlight a region near the Rio Grande Valley.

As above, but at ~0845 UTC

At 0845 UTC, IFR probabilities continue to increase over southeast Texas in the region surrounding Houston and a region near San Antonio.  The Day/Night band detects the cloudiness present in those regions.  High clouds persist over northeast Texas.

As above, but at 1315 UTC

Shortly before sunrise, fog is widespread over southeast Texas.  IFR probabilities are highest where both model and satellite predictors can be used.  Over northeast Texas, where cirrus clouds are present and where the brightness temperature difference product can therefore not provide guidance, the Rapid Refresh data are suggesting that fog is present (as observed), but IFR probabilities are lower because the satellite predictor is not used.

Radiation fog over Texas

Hourly GOES-R IFR Probabilities starting at 0345 UTC 23 January overlain with the following hour’s Ceilings/Visibilities

Light winds and clear skies over Texas promoted the development of Radiation Fog early in the morning on 23 January 2013.  The animation above shows hourly snapshots of GOES-R IFR Probabilities and observations of Ceilings/Visibilities.  IFR conditions develop first near the coast and then spread inland.  IFR probabilities neatly match the regions of observed IFR conditions.  GOES-R products also include Cloud Thickness, below, which can be used to estimate the time of Fog Dispersal.

As above but for GOES-R Cloud Thickness

The GOES-R Cloud Thickness product estimates the depth of the single-layer water cloud in non-twilight conditions, and it shows the steady deepening of the fog/low stratus overnight, with the thickest clouds occurring in the triangle between San Antonio, Fredericksburg and Austin.  The depth of the clouds just before twilight conditions can be used to estimate cloud dissipation.  The time of that image is 1315 UTC (Note that twilight conditions have already occurred in Louisiana at this time), and is shown below:

GOES-R Cloud Thickness, 1315 UTC on 23 January 2013

 Maximum values of Cloud Thickness in central Texas are 1200-1300 feet, and according to this chart, that suggests a dissipation time of more than 4 hours, or sometime after 1715 UTC.  The visible image from 1745 UTC on 23 January, below, shows a small patch of stratiform clouds remaining where the thickest radiation fog had been.

GOES-13 Visible imagery, 1745 UTC on 23 January 2013

The animation below includes the traditional fog product, the brightness temperature difference between 10.7 µm and 3.9 µm.  The GOES-R product refines the satellite estimate of fog/low stratus by using data from the Rapid Refresh Model.

GOES-R IFR Probabilities (Upper Left), GOES-East Brightness Temperature Difference (10.7 µm – 3.9 µm) (Upper Right), GOES-R Cloud Thickness (Lower Left), GOES-East 10.7 µm imagery (Lower Right)

Fog on Texas and Louisiana Gulf Coasts

Fog was anticipated to develop over the coastal sections of Texas and Louisiana starting late on Oct 31 2012.  From the 0149 UTC 1 November Houston Forecast Discussion:    The 0921 UTC Forecast Discussion from Lake Charles (above) describes increasing fog possibilities — and the 0453 UTC AFD (below) mentions patchy fog.

For both WFOs, the GOES-R IFR Probability field shows a good picture of the evolving fog/low stratus as it develops.

000
FXUS64 KHGX 010149
AFDHGX

AREA FORECAST DISCUSSION
NATIONAL WEATHER SERVICE HOUSTON/GALVESTON TX
849 PM CDT WED OCT 31 2012

.DISCUSSION...
CURRENT FCST IS ON TRACK. ONLY TWEAKS TO GRIDS WERE TO MOVE UP
TIMING OF FOG FORMATION. WOULDN`T DOUBT IF A DENSE FOG ADVSY
MIGHT BE REQUIRED FOR SOME LOCATIONS...ESP SW. WILL KEEP AN EYE ON
TRENDS. DIFFUSE WIND SHIFT AND SLIGHTLY LOWER DEWPOINTS WILL
PROBABLY MOVE INTO NE ZONES LATER TONIGHT THEN STALL/WASHOUT.


000
FXUS64 KLCH 010921
AFDLCH

AREA FORECAST DISCUSSION
NATIONAL WEATHER SERVICE LAKE CHARLES LA
421 AM CDT THU NOV 1 2012

.DISCUSSION...TRAPPED LOW LEVEL MOISTURE AND CLEAR SKIES HAVE
ALLOWED AREAS OF FOG TO DEVELOP THIS MORNING ACROSS THE CWA. AT THIS
TIME PATCHY DENSE FOG HAS ALSO DEVELOPED IN CALCASIEU PARISH AND
JEFFERSON COUNTY. VISIBILITIES ARE SLOWLY DROPPING ELSEWHERE AND
IF CONDITIONS CONTINUE TO DETERIORATE A DENSE FOG ADV MAY BE NEEDED
THIS MORNING. 


The 0921 UTC Forecast Discussion from Lake Charles (above) describes increasing fog possibilities — and the 0453 UTC AFD (below) mentions patchy fog.


000
FXUS64 KLCH 010453
AFDLCH

AREA FORECAST DISCUSSION
NATIONAL WEATHER SERVICE LAKE CHARLES LA
1153 PM CDT WED OCT 31 2012

.DISCUSSION...
01/06Z TAF ISSUANCE.

&&

.AVIATION...
FEW CHANGES TO THE TAFS THIS EVENING WITH WINDS NEARLY CALM ACRS
THE AREA. T/TD SPREAD NARROWING AT BPT AND LCH AND COULD SEE SOME
PATCHY FOG DEVELOP AT THESE SITES WITHIN THE NEXT HOUR OR TWO.
CANNOT RULE OUT FOG AT OTHER TAF SITES...BUT EXPECT ONSET A LITTLE
LATER AS DEWPOINT DEPRESSIONS ARE SLIGHTLY LARGER. VFR CONDITIONS
EXPECTED TO PREVAIL WITH THE EXCEPTION OF PERIODIC MVFR OR BRIEF
IFR VISBYS BETWEEN NOW AND 14Z. LT WINDS WILL GRADUALLY BECOME
SWLY THURS AFTN. 24 

For both WFOs, the GOES-R IFR Probability field shows a good picture of the evolving fog/low stratus as it develops.  The every-hour loop below, starting at 0315 UTC, shows the steady increase in probabilities along the Louisiana and Texas Gulf Coasts.  Note the relatively low probabilities in and around Houston — an apparent break between IFR conditions to the north and east and those to the south.  The Houston airport observations did not fall to IFR criteria although those criteria were common to the north and south.  Also, the IFR probabilities downplay the brightness temperature difference signal over central Texas where IFR conditions do not occur.

GOES-R IFR Probabilities computed from GOES-East (upper left), Traditional Brightness temperature Difference product (10.7 µm – 3.9 µm) (upper right), GOES-R IFR Probabilities computed from MODIS (lower left), Suomi/NPP Day/Night Band (lower left)

The imagery below shows GOES-R and MODIS imagery at the same time (immediately below) and GOES-R and Suomi/NPP imagery at the same time (bottom).  Note that the fog that develops is not of sufficient thickness to block views of the city lights.

GOES-R IFR Probabilities computed from GOES-East (upper left), Traditional Brightness temperature Difference product (10.7 µm – 3.9 µm) (upper right), GOES-R IFR Probabilities computed from MODIS (lower left), Suomi/NPP Day/Night Band (lower left)
GOES-R IFR Probabilities computed from GOES-East (upper left), Traditional Brightness temperature Difference product (10.7 µm- 3.9 µm) (upper right), GOES-R IFR Probabilities computed from MODIS (lower left), Suomi/NPP Day/Night Band (lower left)


Day/Night band and fog detection

Day/Night band from VIIRS on Suomi/NPP from 0714 UTC on 4 October 2012

The day/night band imagery, above, shows fog/low clouds in the Hill Country west of San Antonio and Austin in south-central Texas.  Additionally, there are low clouds over the Gulf of Mexico, with cloud street structures that suggest a south-southeasterly wind bringing moisture inland from the Gulf.  The 0855 UTC day/night band image over the same domain, below, shows an expansion of the fog/low cloud signal.

Day/Night band from VIIRS on Suomi/NPP from 0855 UTC on 4 October 2012
Day/Night band from Suomi/NPP with observations overlain.

Observations suggest that the northern edge of the cloud streets over the extreme western Gulf of Mexico is the edge of a moisture gradient, and that that gradient extends inland to where the fog and low stratus are occurring.  How did the GOES-R IFR Probability field perform on this day?  The 0702 UTC (below) and 0915 UTC IFR probability fields show an increas in the areal extent of higher probabilities over the course of the night, consistent with the overnight cooling and the continued feed of moisture from the Gulf.  By 0900 UTC, IFR observations are common in and near the region where IFR probabilities are high.  This is a good example of how the Day/Night band and IFR Probabilities can be used in concert to understand the evolution of the fog/low stratus field over south Texas.