Category Archives: Southeast

Widespread fog and low clouds along the East Coast

US_Water_Vapor_20141223_2hrmovie

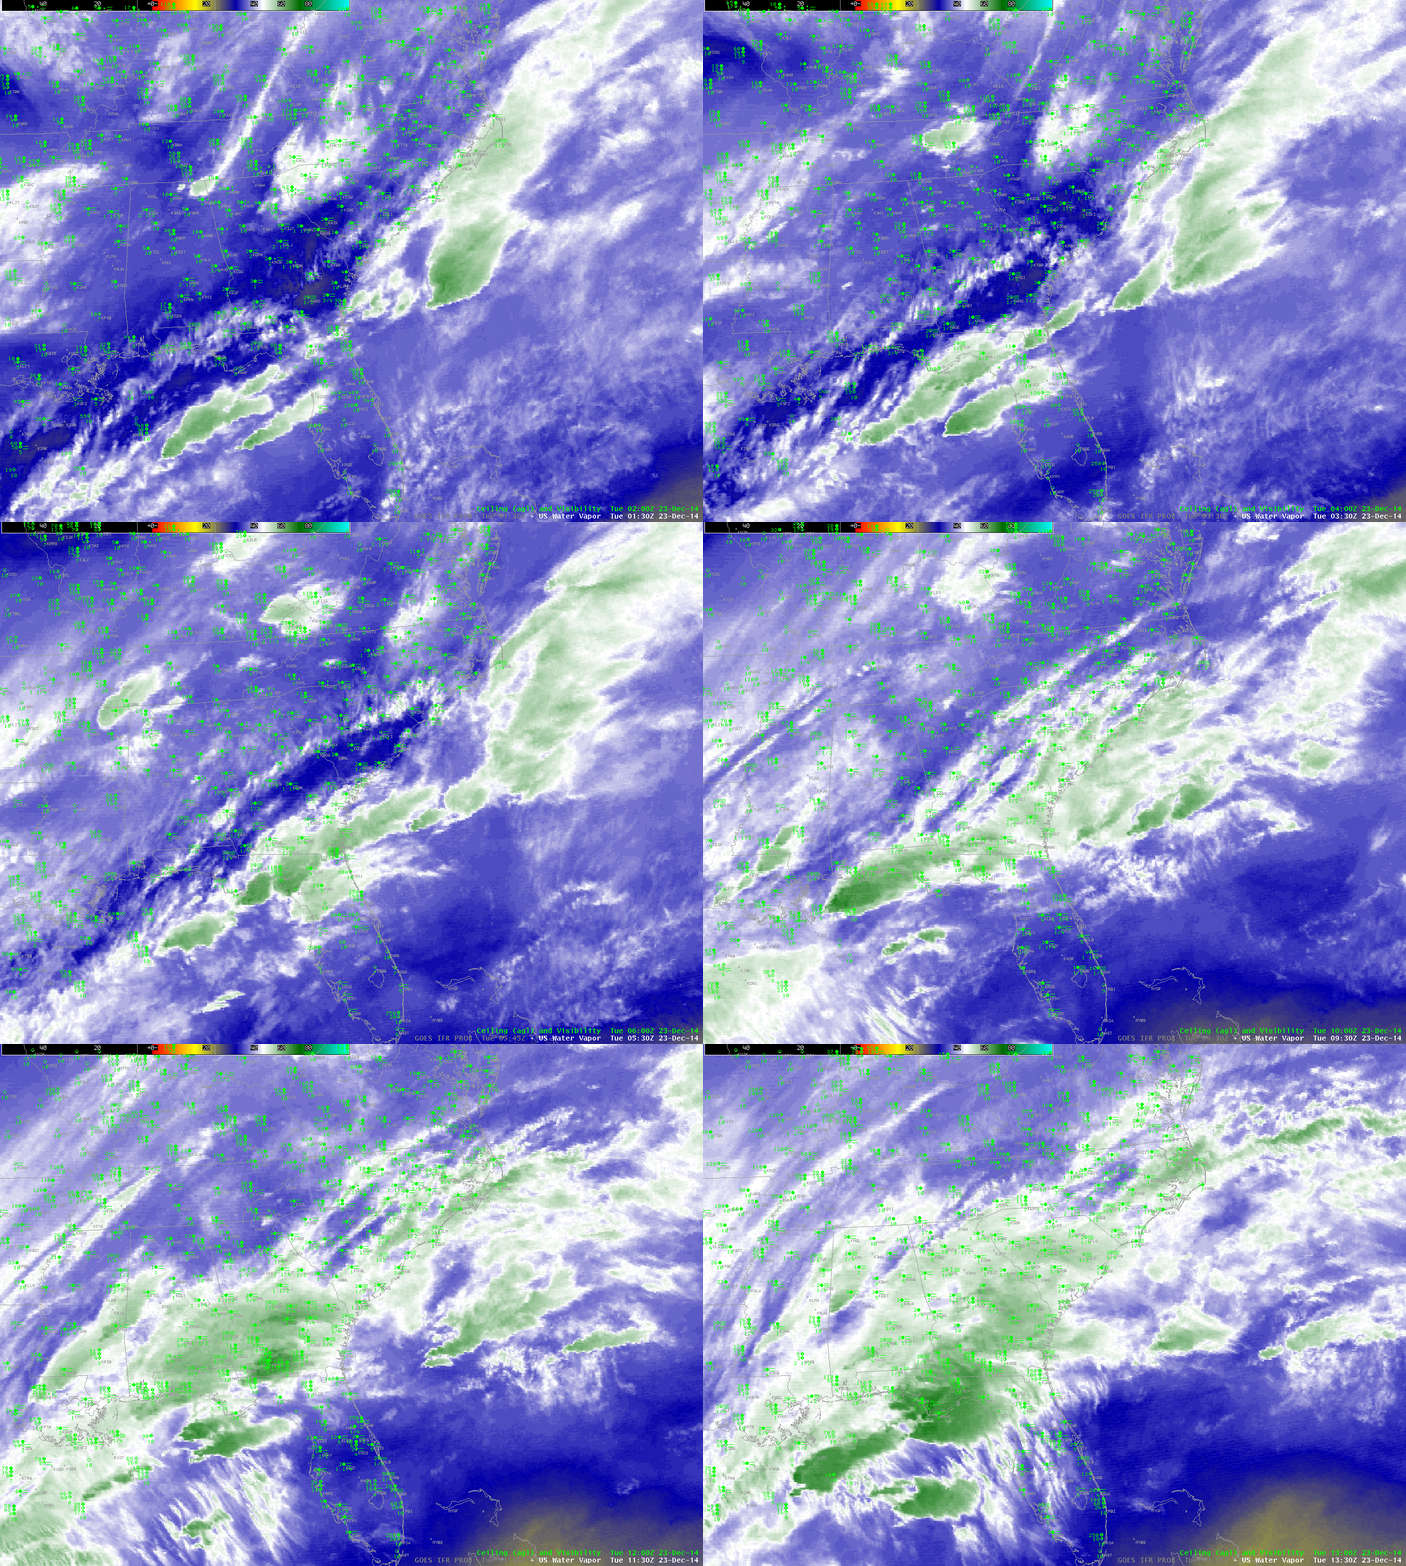
GOES-East Water Vapor imagery, every 2 hours, 0130 – 1330 UTC 23 December 2014 (Click to enlarge)

 A slow-moving storm system is producing widespread fog and low clouds on the east coast (and in the middle of the country as well). The water vapor animation above shows the cloud cover associated with the system. Water vapor imagery such as this suggests many different cloud layers, and in such cases the IFR Probability fields (below) rely on Rapid Refresh Data to provide information because Satellite signals of low clouds cannot occur in the presence of cirrus contamination. A simple Brightness Temperature Difference product would give little information about near-surface clouds over the Southeast.

GOES_IFR_PROB_20141223anim

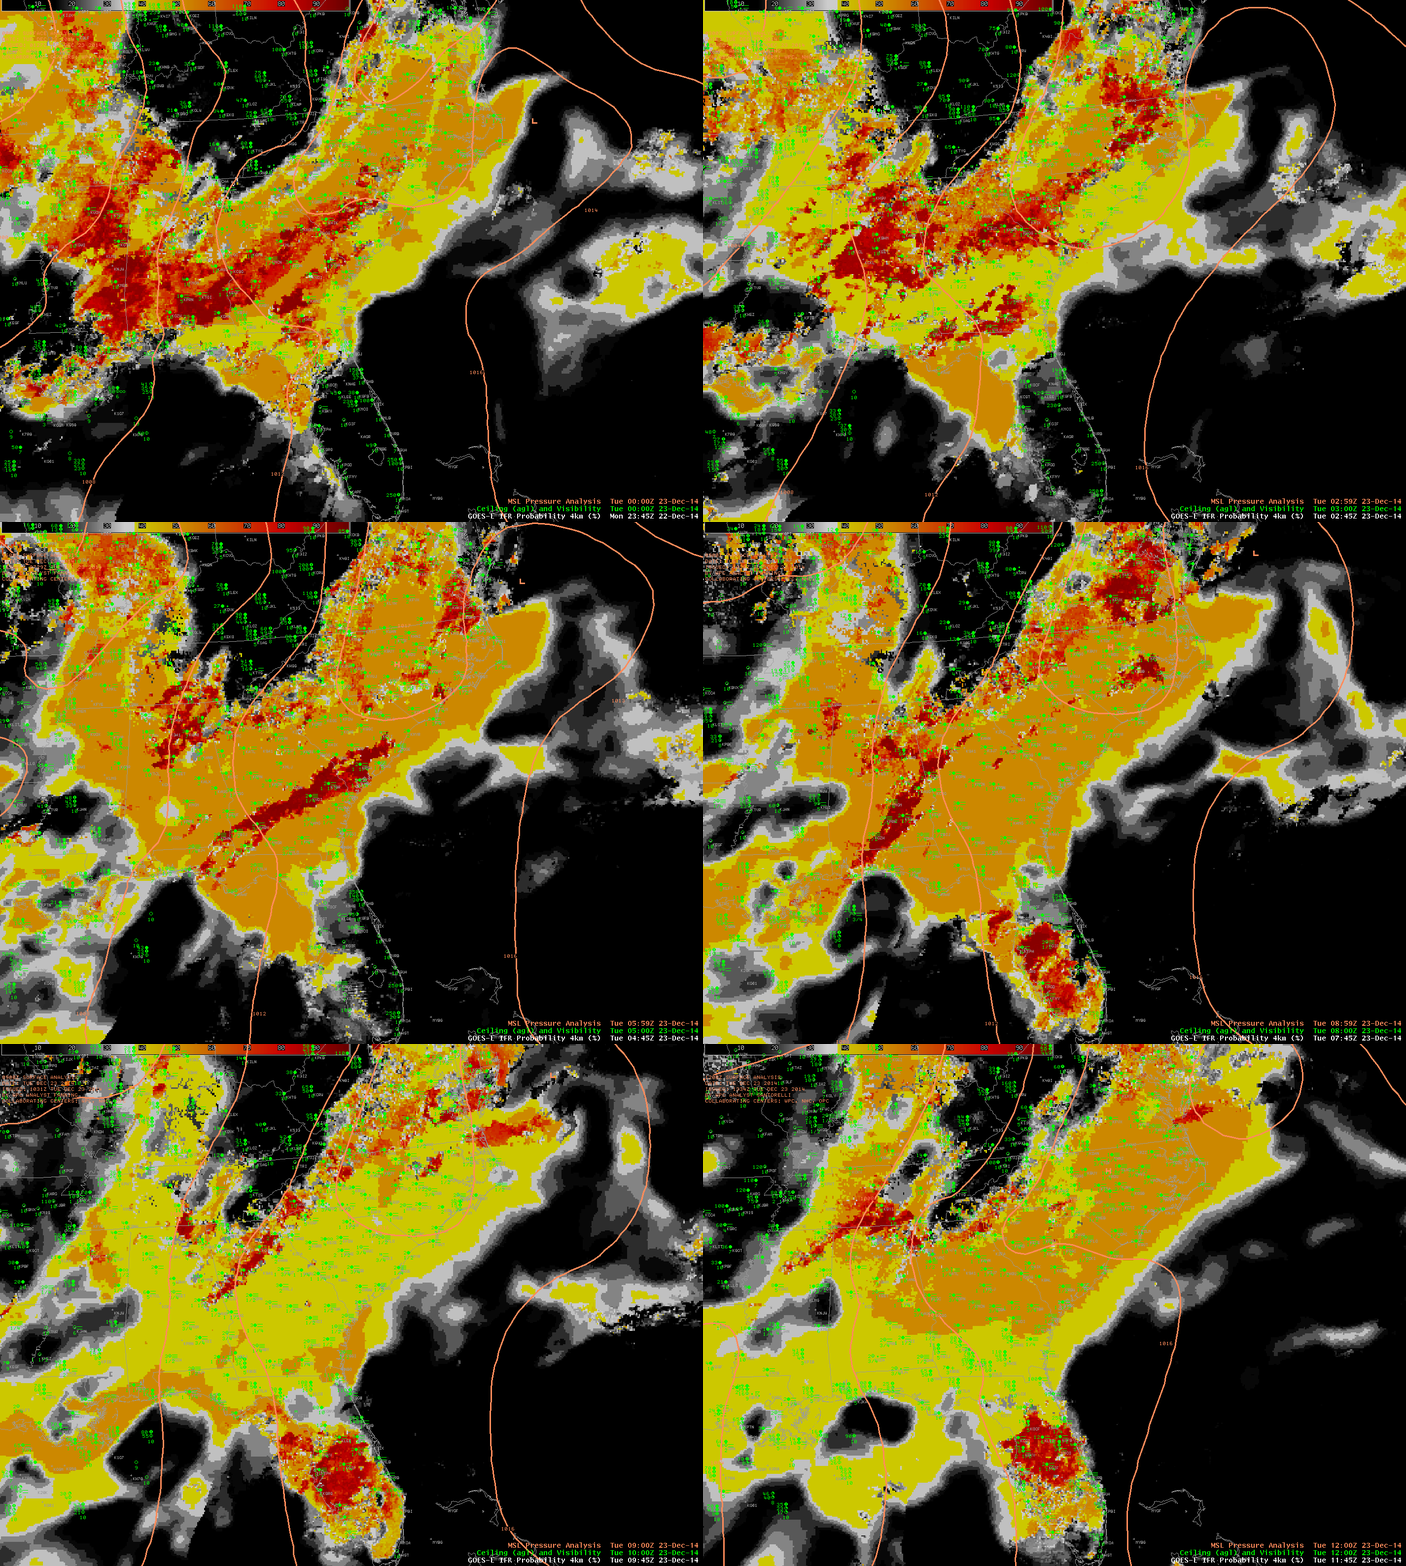
GOES-East-based GOES-R IFR Probabilities and surface-based observations of ceilings and visibilities, hourly from 0145 through 1245 UTC 23 December 2013 (Click to enlarge)

 IFR Probability fields show a flat nature that occurs when satellite data cannot be used as a Predictor because of the presence of high clouds/multiple cloud layers. The Probability values are suppressed; interpretation of those values should be colored by the knowledge of the presence or absence of high clouds. In the example above, when high clouds briefly separate over central South Carolina around 0600 UTC, a region of higher IFR probability is shown. The algorithm is more confident that fog/low stratus exists because Satellite Predictors can also be used in that region. What changes is the ability of the GOES-R IFR Probability algorithm to assess the probability of IFR conditions because more predictors can be included; in the region where the high clouds part, satellite information about the low clouds can be included, and IFR Probabilities increase as a result.

More fog over South Carolina

Dense fog redeveloped over South Carolina overnight on 3-4 December 2014, and as noted in the Forecast Discussion below, its character was just a bit different than on the previous night.

000
FXUS62 KCHS 040239
AFDCHS

AREA FORECAST DISCUSSION
NATIONAL WEATHER SERVICE CHARLESTON SC
939 PM EST WED DEC 3 2014

.SYNOPSIS…
UNDER A WEAKENING WEDGE OF HIGH PRESSURE…FOG WILL PERSIST TONIGHT.
ANOTHER AREA OF HIGH PRESSURE WILL BUILD FROM THE NORTH THURSDAY THROUGH
FRIDAY. A WARM FRONT WILL THEN LIFT ACROSS THE AREA ON SATURDAY…
BEFORE A COLD FRONT MOVES THROUGH SATURDAY NIGHT. AN INLAND WEDGE
OF HIGH PRESSURE WILL BECOME ESTABLISHED SUNDAY AND MONDAY…FOLLOWED
BY THE PASSAGE OF ANOTHER COLD FRONT MONDAY NIGHT. HIGH PRESSURE
WILL THEN PREVAIL INTO THE MIDDLE OF NEXT WEEK.

&&

.NEAR TERM /UNTIL 6 AM THURSDAY MORNING/…
WHILE THE SCENARIO IS QUITE DIFFERENT FOR FOG TONIGHT COMPARED TO
LAST NIGHT…DESPITE PLENTY OF CIRRIFORM CLOUDS /SOME OF WHICH ARE
OPAQUE/
…WE ARE STILL GETTING AREAS OF FOG TO FORM. SOME OF THE
FOG IS ALREADY DENSE…ESPECIALLY IN THE CHARLESTON QUAD COUNTY
AREA AND ALONG OUR COASTAL ZONES SOUTH INTO MCINTOSH. THIS IS A
MIX OF STRATUS BUILD-DOWN AND ADVECTIVE FOG FROM OFF THE ATLANTIC
.
SO WE LOOK FOR A FURTHER EXPANSION OF THE FOG INLAND TO THE WEST
OF I-95 THROUGH THE NIGHT. DENSE FOG ADVISORIES WILL THEREFORE
REMAIN IN EFFECT.

IFRProb_04Dec2014anim

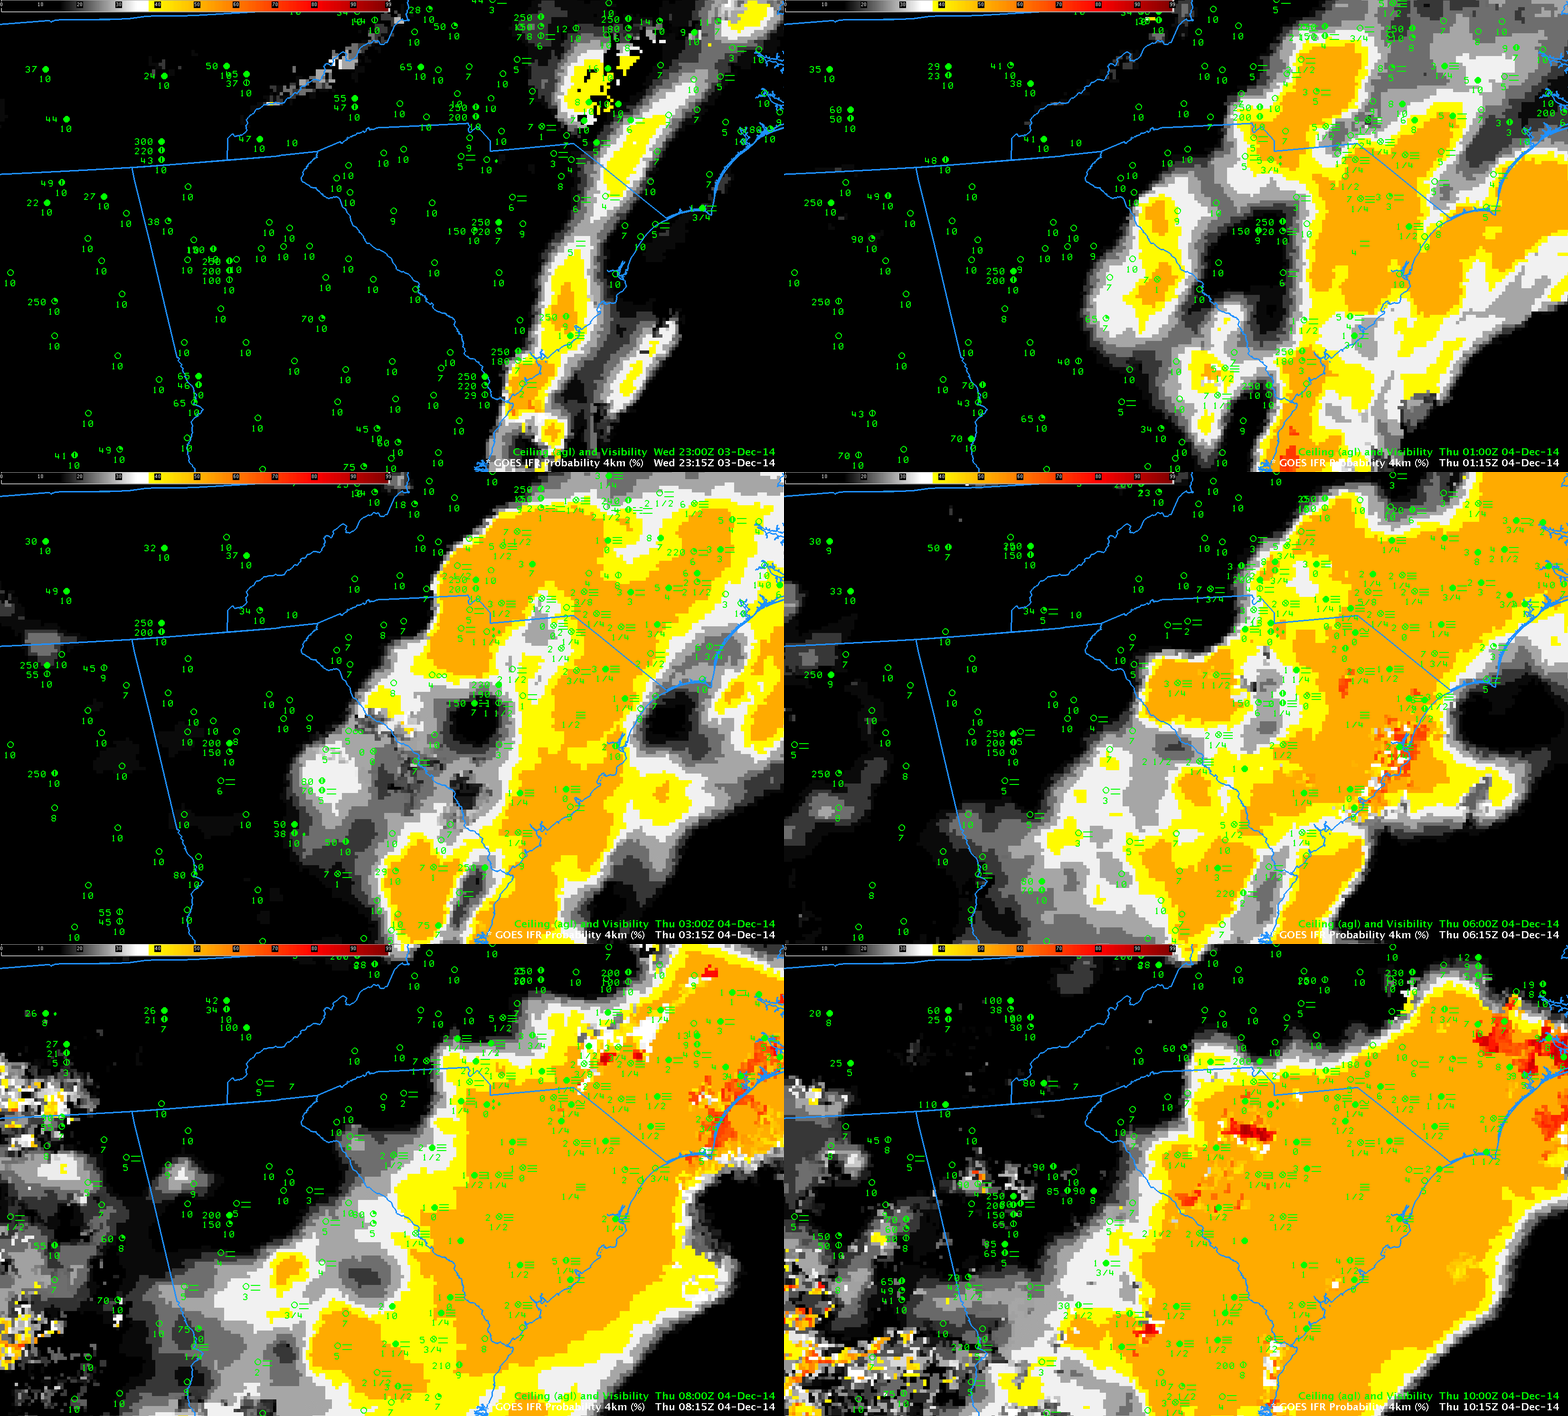
GOES-based GOES-R IFR Probabilities, hourly from 2315 UTC 3 December through 1015 UTC on 4 December as well as observations of ceilings (AGL) and visibilities (Click to enlarge)

GOES-R IFR Probabilities, above, (click here for an animation with a faster dwell rate) once again capably outlined the region of IFR conditions over South Carolina. Probabilities are lower when Satellite data cannot be used as a predictor, as when cirrus clouds prevent the satellite from viewing water-based clouds closer to the surface. In such cases when only Rapid Refresh model data can be used as Fog Predictors, the fields take on a flatter, less pixelated character as above. There are a few regions where breaks in the cirrus cloud allow Satellite predictors to be incorporated in the IFR Probability fields, for example along the South Carolina coast at 0600 UTC. When high clouds are present, interpret the magnitude of the IFR Probability in a different way than when high clouds are absent. An IFR Probability of 55% in a region of cirrus clouds has a different meaning than an IFR Probability of 55% in a region of only low clouds.

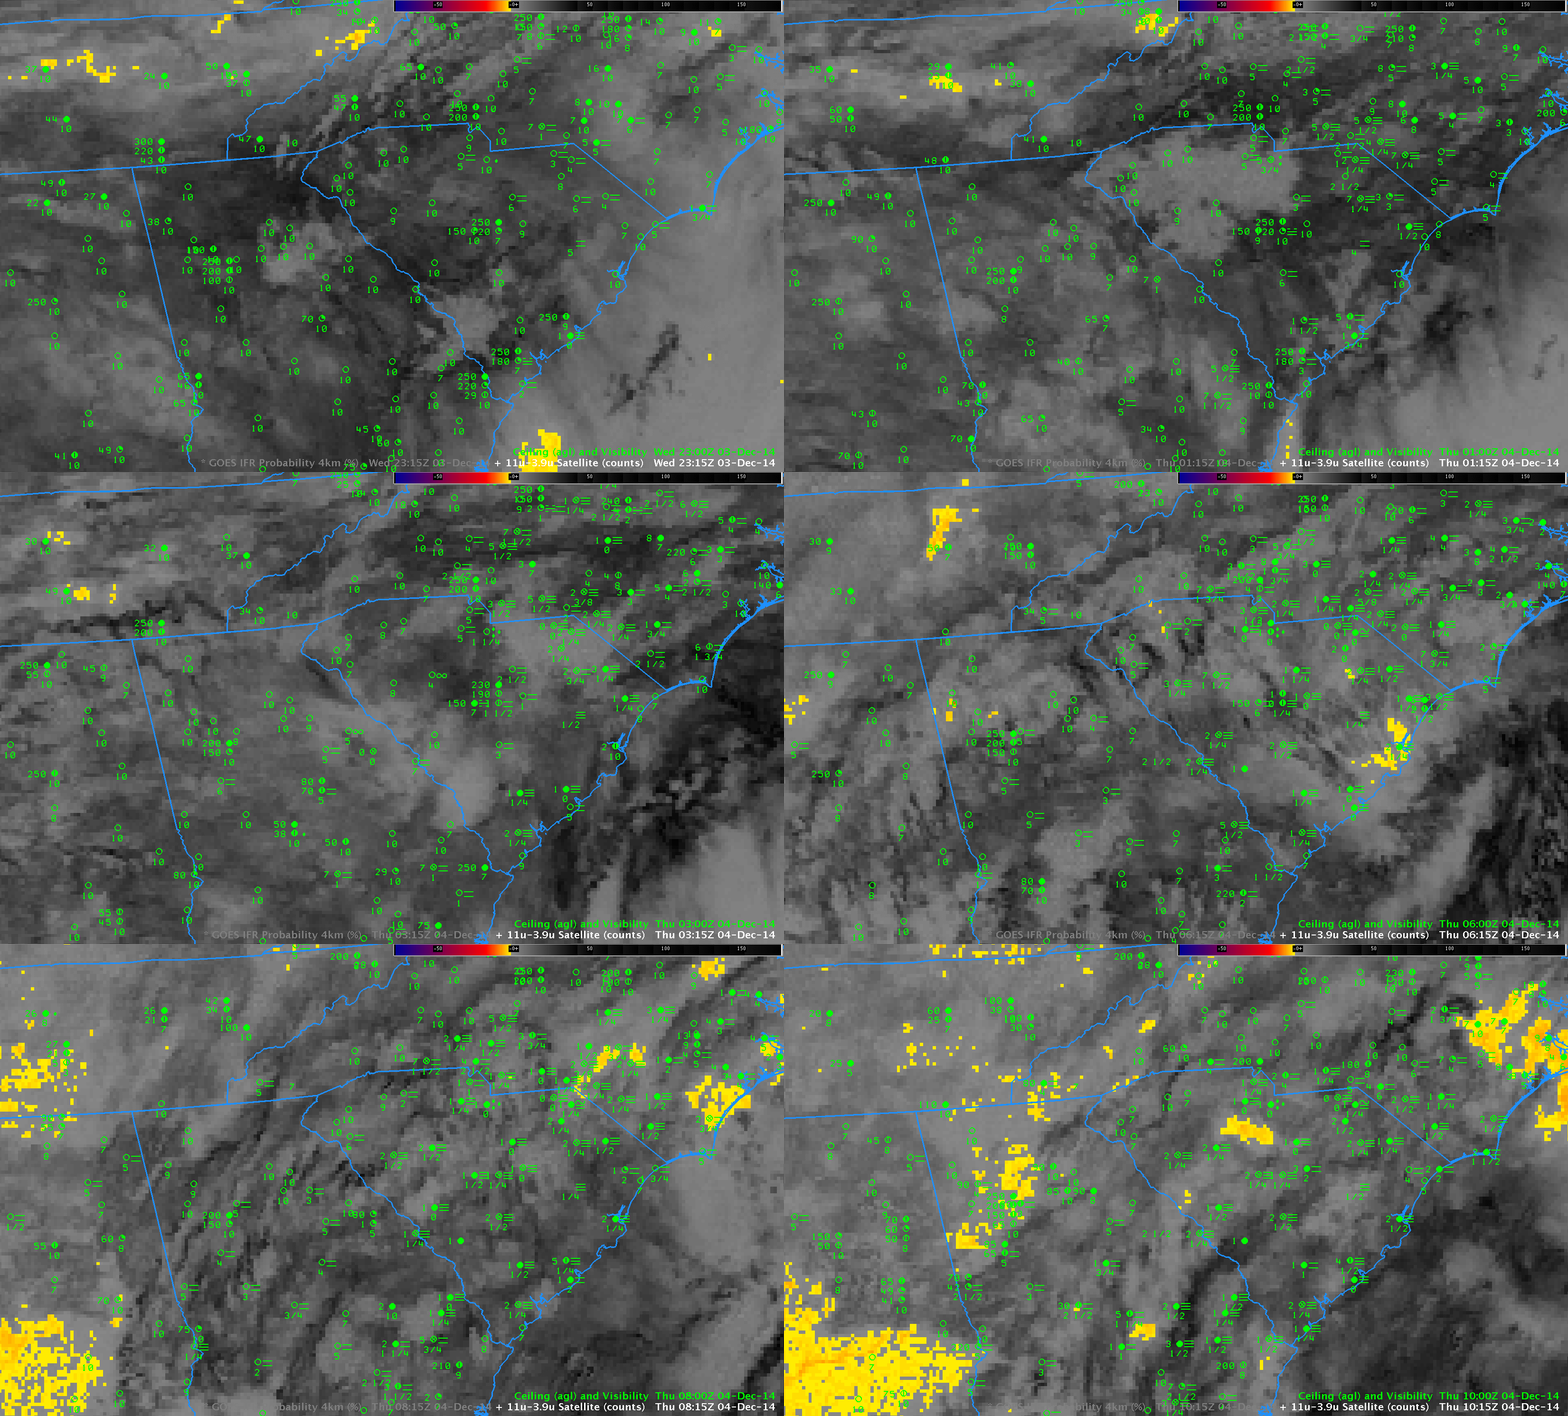
Because of Cirrus clouds, the brightness temperature difference fields gave almost no information about the presence of low clouds. See the animation below (a loop with a faster dwell rate is here).

BTD_GOES13_4DEC2014anim

GOES-13 Brightness Temperature Difference Fields (10.7µm – 3.9µm), hourly from 2315 UTC 3 December through 1015 UTC on 4 December, as well as observations of ceilings (AGL) and visibilities (Click to enlarge)

Fog over the Southeast under Cirrus Clouds

GOES13_BTD_IFR_29Oct2014_1015

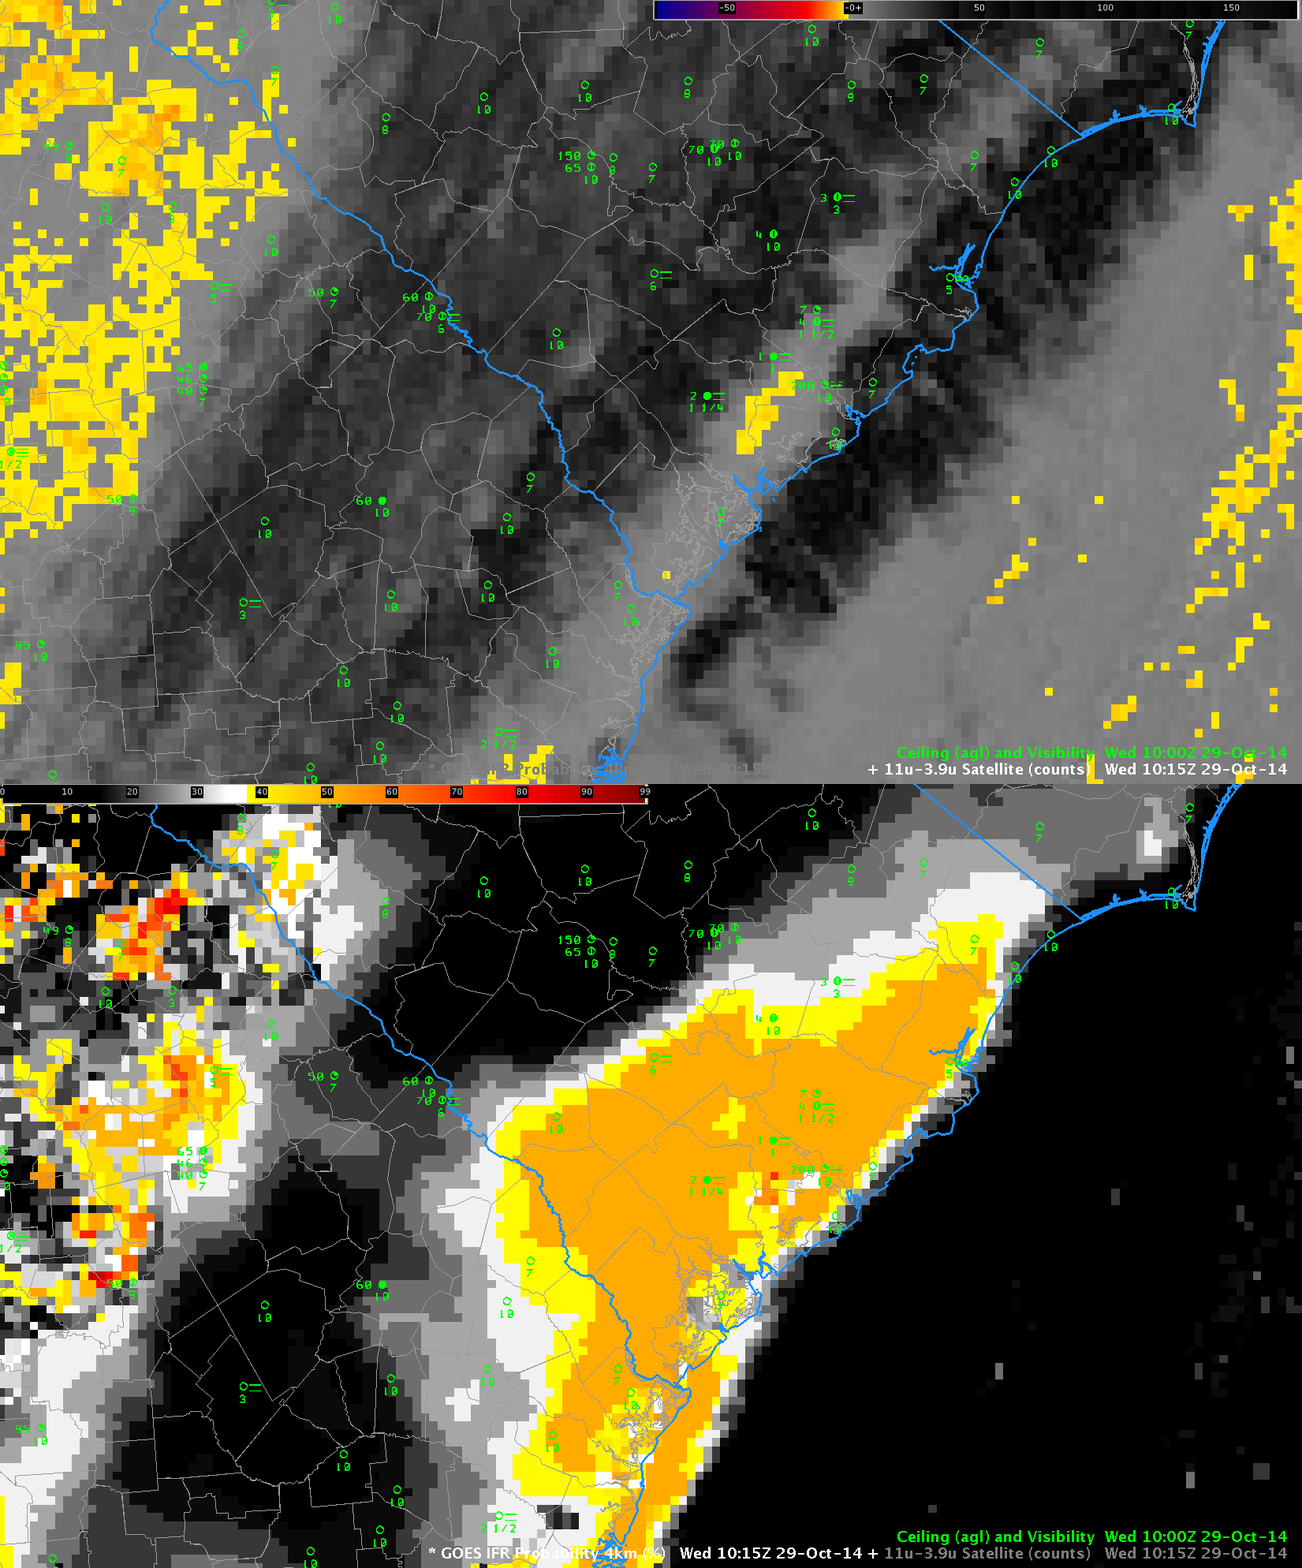
Toggle between GOES-13 Brightness Temperature Difference (10.7µm – 3.9µm) and GOES-based GOES-R IFR Probabilities at 1015 UTC 29 October, with ceilings and visibilities plotted (Click to enlarge)

On the morning of 28 October 2014, Fog developed over the southeast under clear skies. On the morning of 29 October, Fog developed under cirrus clouds. When cirrus clouds are present, the brightness temperature difference product gives no information on low clouds, and the GOES-R IFR Probability fields rely on model data only to provide information. The toggle above shows IFR Probability Fields that overlap the region of reduced ceilings/visibilities in coastal South Carolina. Because model data are the primary predictor used, the field is much smoother (less pixelated) than when satellite data can also be used as a predictor.

Fog Development, Detection and Dissipation in the Southeast

SE_IFR_28Oct2014_00_11anim

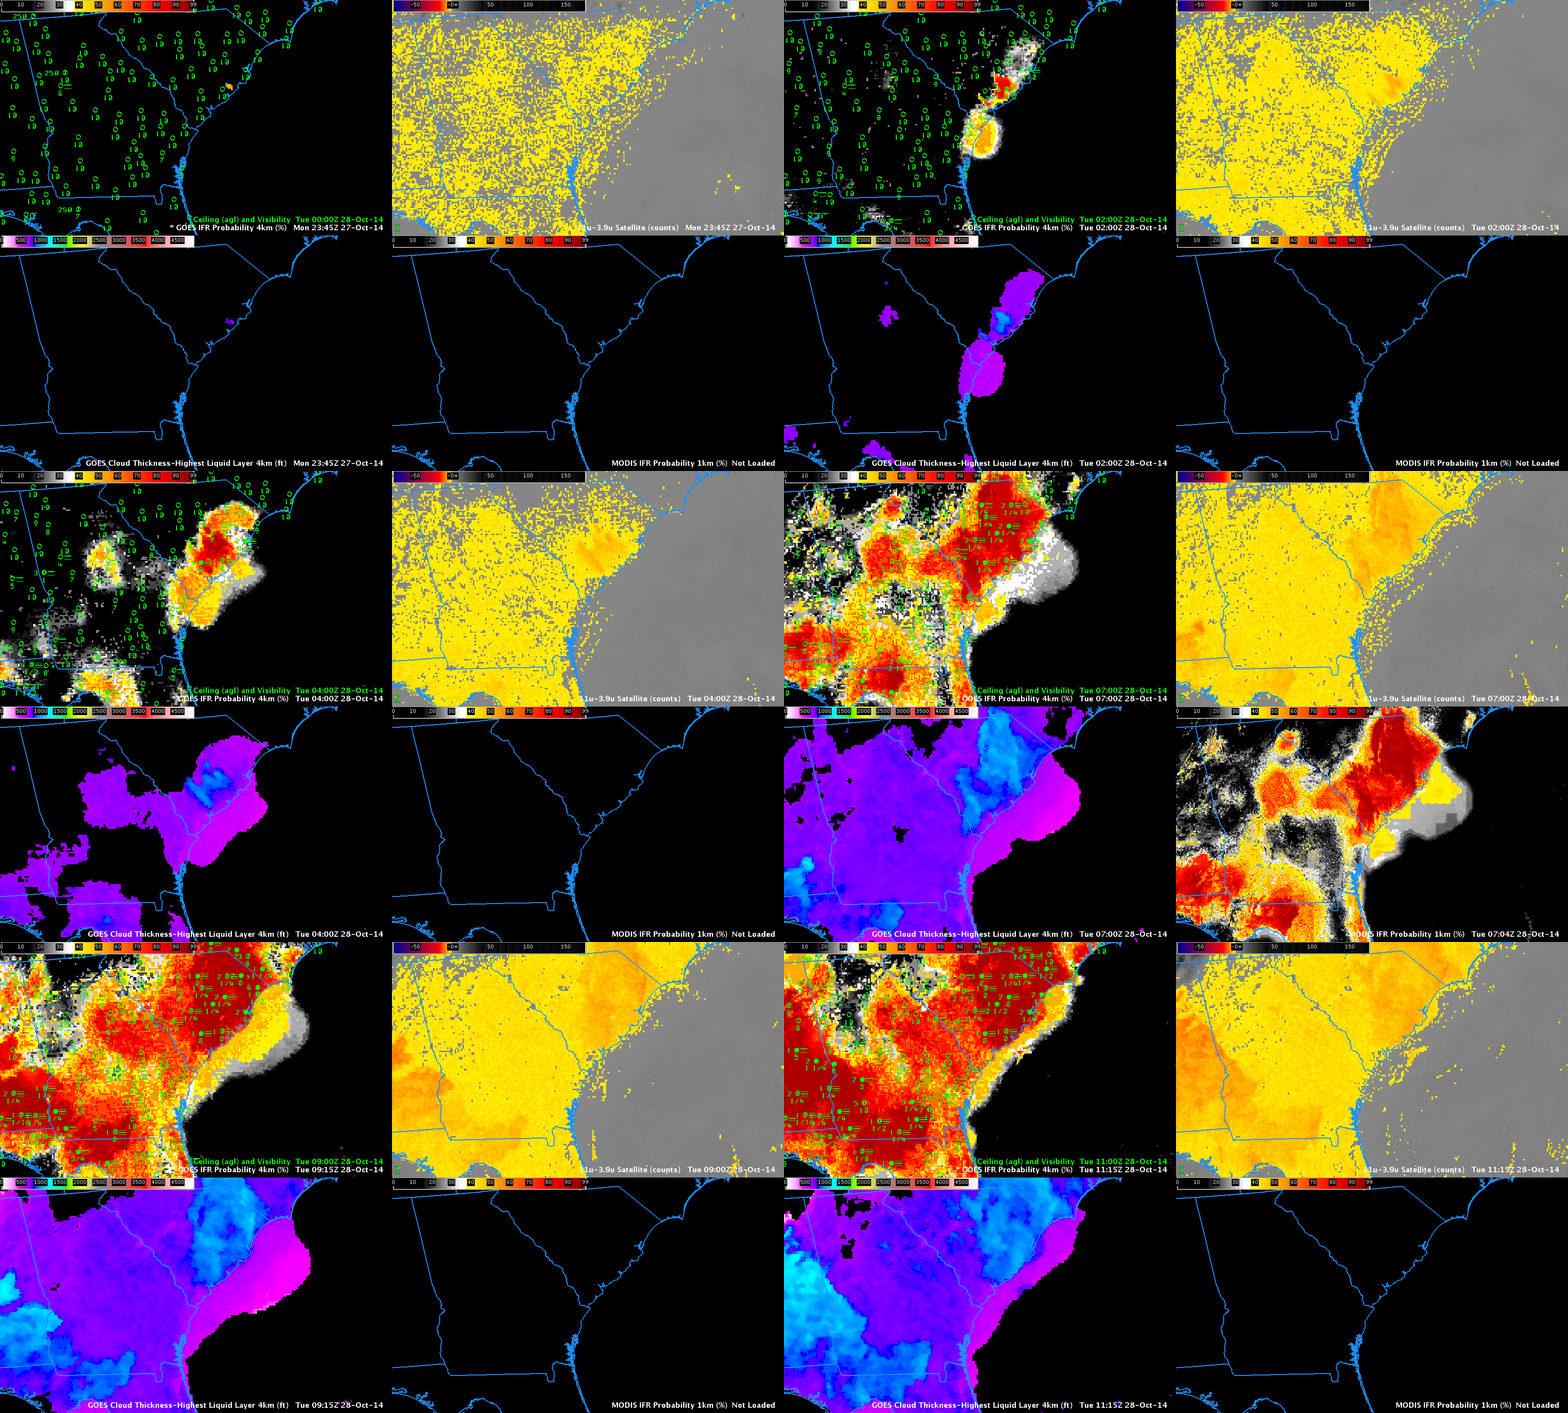
GOES-based GOES-R IFR Probability (Upper Left), GOES-East Brightness Temperature Difference (10.7µm – 3.9µm) (Upper Right), GOES-R Cloud Thickness (Lower Left), MODIS-based GOES-R IFR Probability (Lower Right) (Click to Enlarge)

Fog and low ceilings developed over the southeast United States during the morning hours of 28 October 2014. The animation above, showing data each hour, shows IFR Probabilities developing initially near Charleston South Carolina then overspreading much of South Carolina, Georgia and Mississippi. In contrast, the brightness temperature difference field has a positive signal over most of those states. IFR Probability correctly screens out regions where Brightness Temperature Difference suggests low clouds are present but where ceilings and visibilities do not meet IFR criteria. IFR Probabilities are highest where the brightness temperature difference signal has the largest value, however.

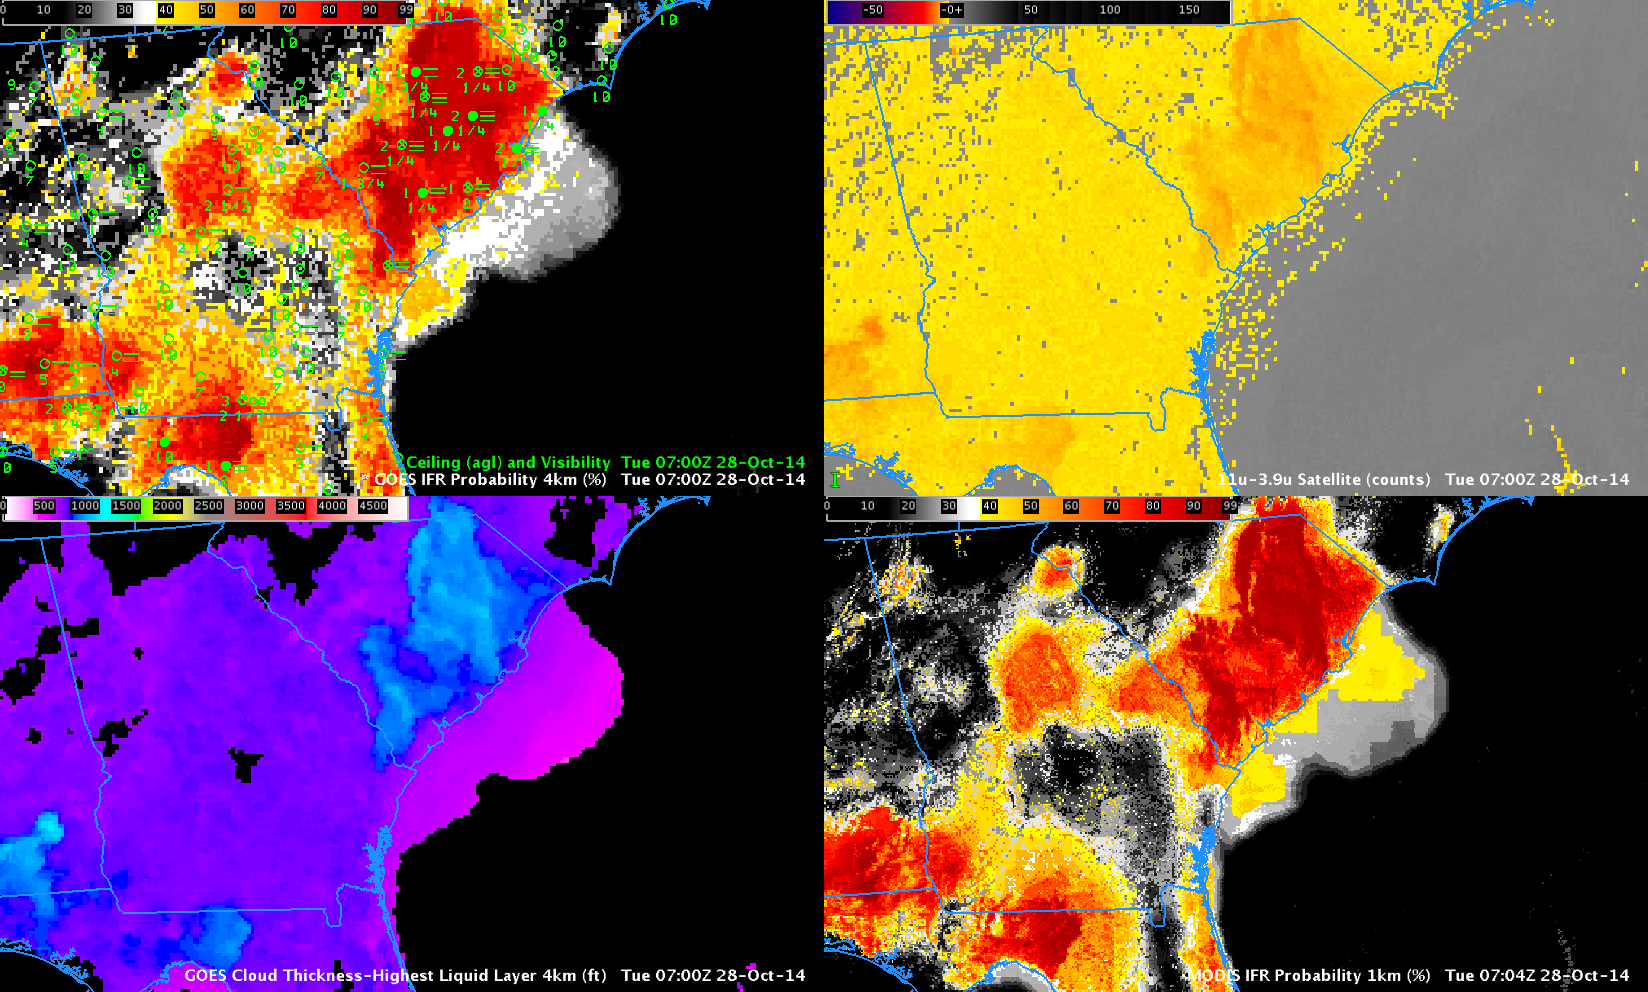
The animation includes one hour (0700 UTC) with a MODIS-based IFR Probability field, shown below. MODIS- and GOES-based fields show similar patterns, but edges are sharper in the higher-resolution data.

SE_IFR_28Oct2014-30

As above, but at 0700 UTC (Click to enlarge)

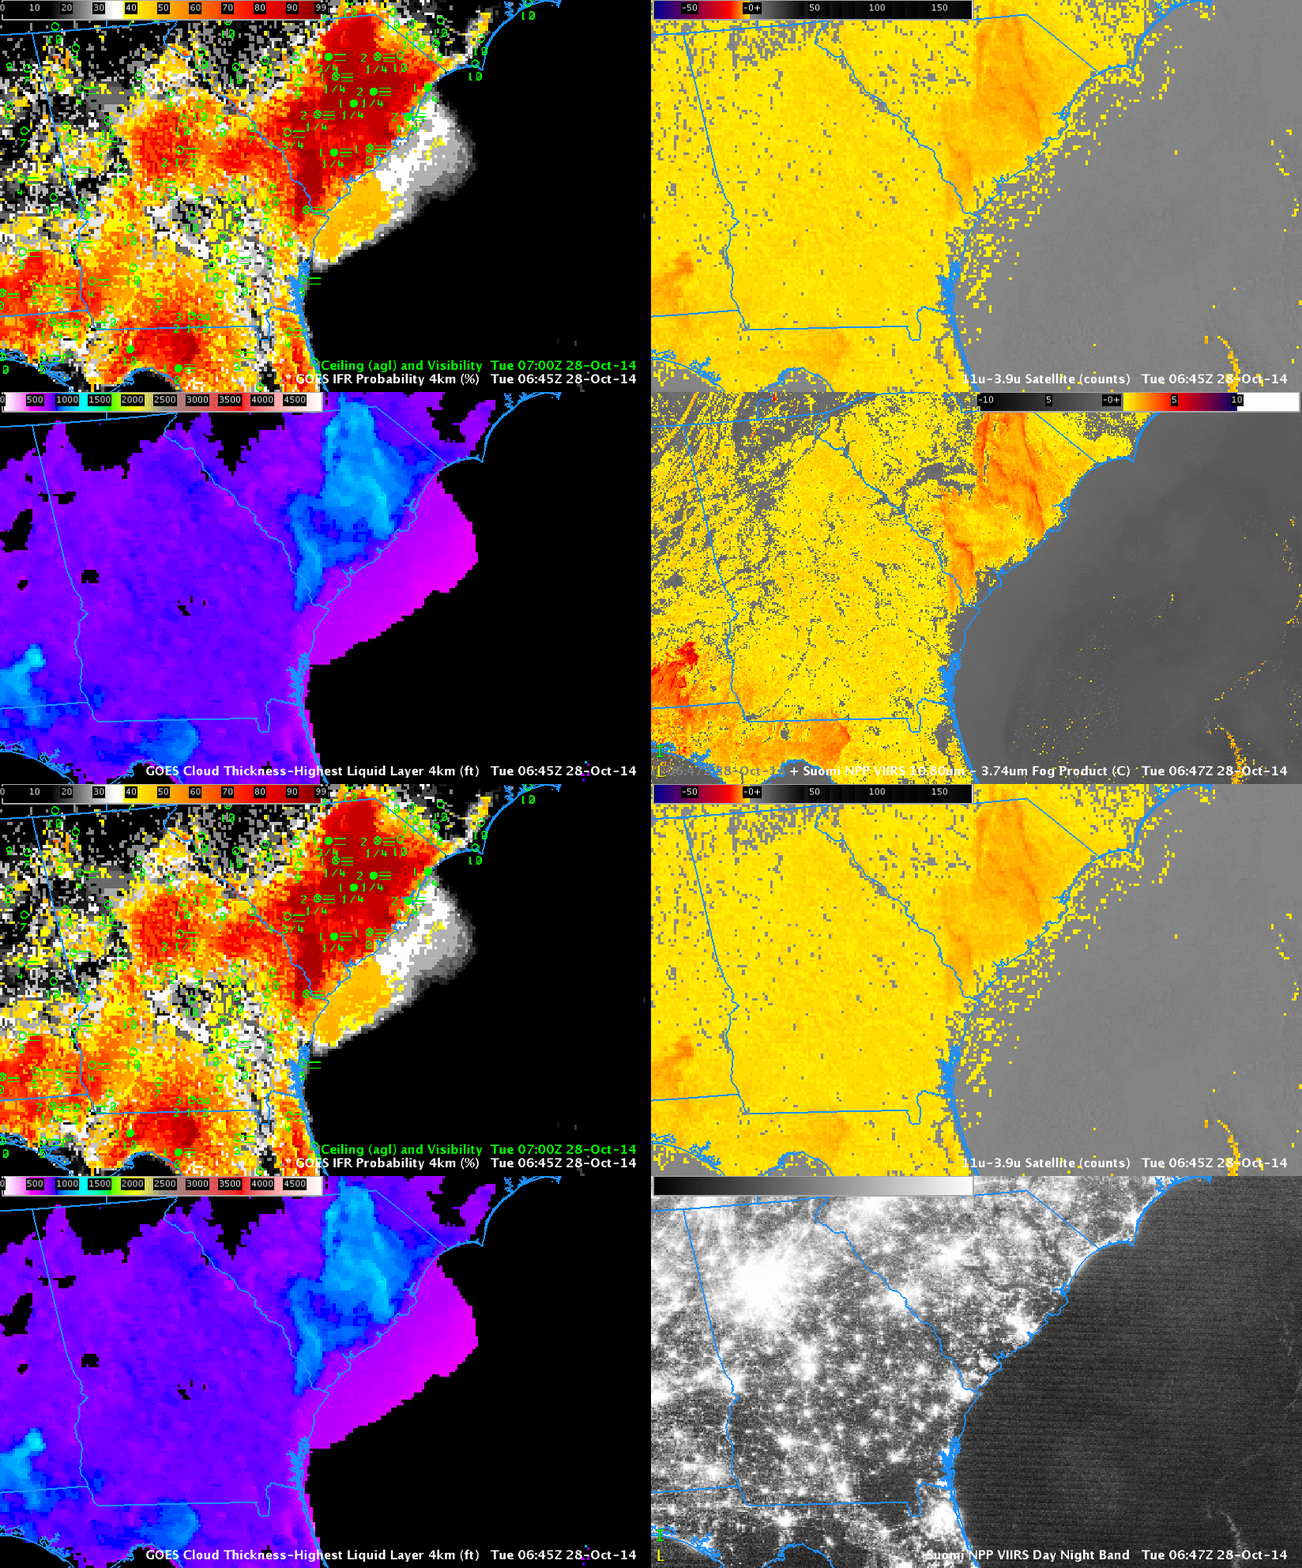
Suomi NPP overflew the southeast in the early morning as well. The toggle below of the Day Night Band and the Brightness Temperature Difference shows two things plainly: The near-New Moon has not yet risen and lunar illumination is missing; therefore, only Earth-glow and City Lights are providing light, and clouds are very difficult to detect. As with GOES data, the Suomi NPP Brightness Temperature Difference field overpredicts where low clouds and fog and creating IFR conditions.

SNPP_BTD_DNB_0647_28Oct2014

As above, but at 0647 UTC, with Suomi NPP Brightness Temperature Difference (11.45µm – 3.74µm) and Day Night Band imagery in the bottom right (Click to enlarge)

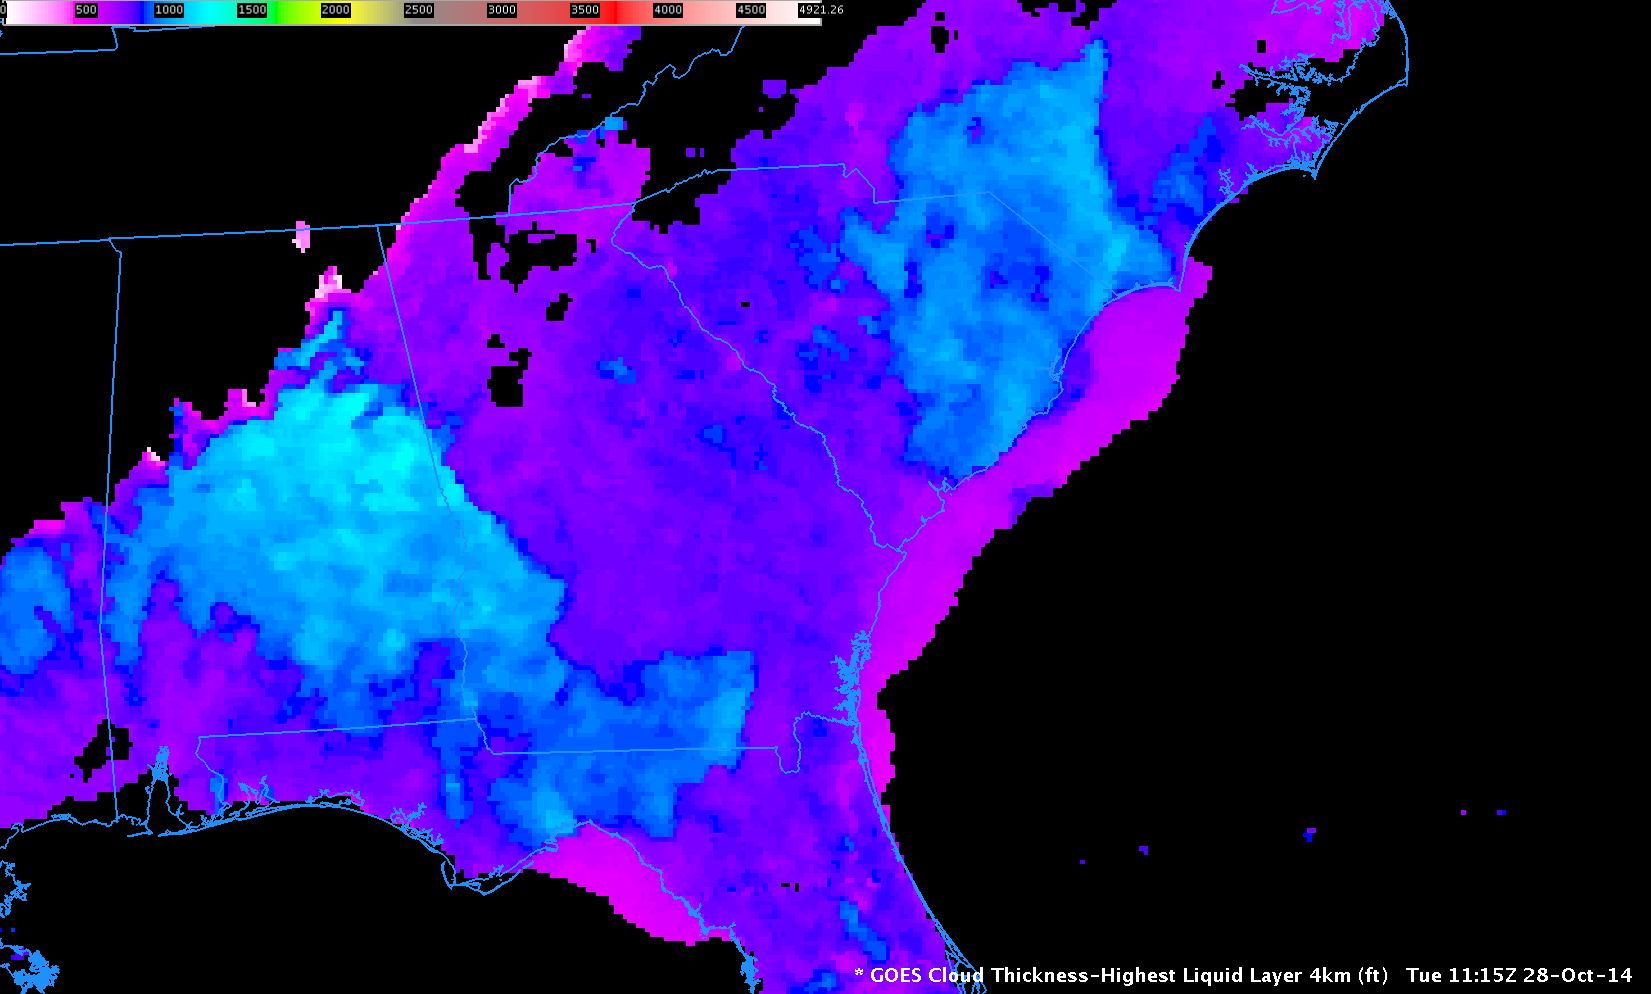
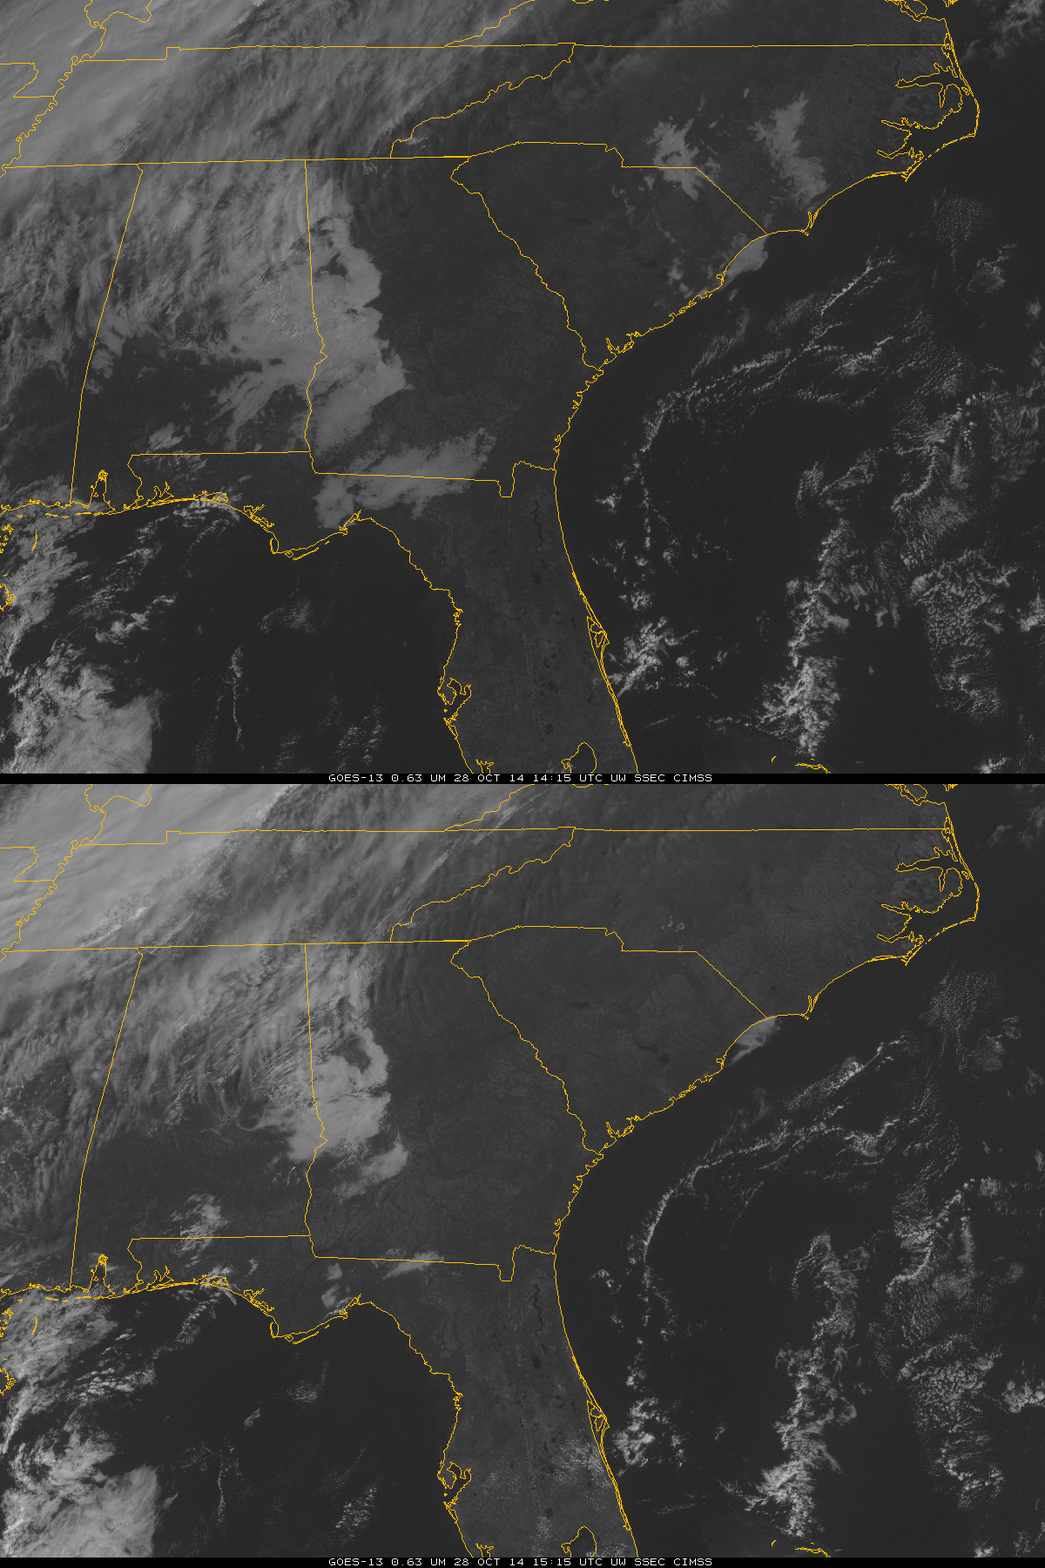
GOES-R Cloud Thickness Fields can be used to predict when fog will burn off (Using this scatterplot as a first guess). The image below is the last pre-sunrise GOES-R Cloud Thickness field over the Southeast. The Thickest clouds are over east-central Mississippi and central North Carolina, so that is where fog should linger the longest. The short animation, at bottom, showing the 1415 and 1515 UTC shows that to be the case. Note that fog/low clouds over Mississippi are moving eastward and lingering, perhaps because the high clouds above them are reducing insolation.

SE_CLDTHICKNESS_1115_28Oct2014

GOES-R Cloud Thickness, 1115 UTC on 28 October 2014 (Click to enlarge)

GOES13_VIS_28OCT2014_14_15

GOES-13 Visible Imagery, 1415 and 1515 UTC, 28 October 2014 (Click to enlarge)

Fog over northeast Florida and coastal Georgia and South Carolina

GOES_IFR_PROB_20140304loop

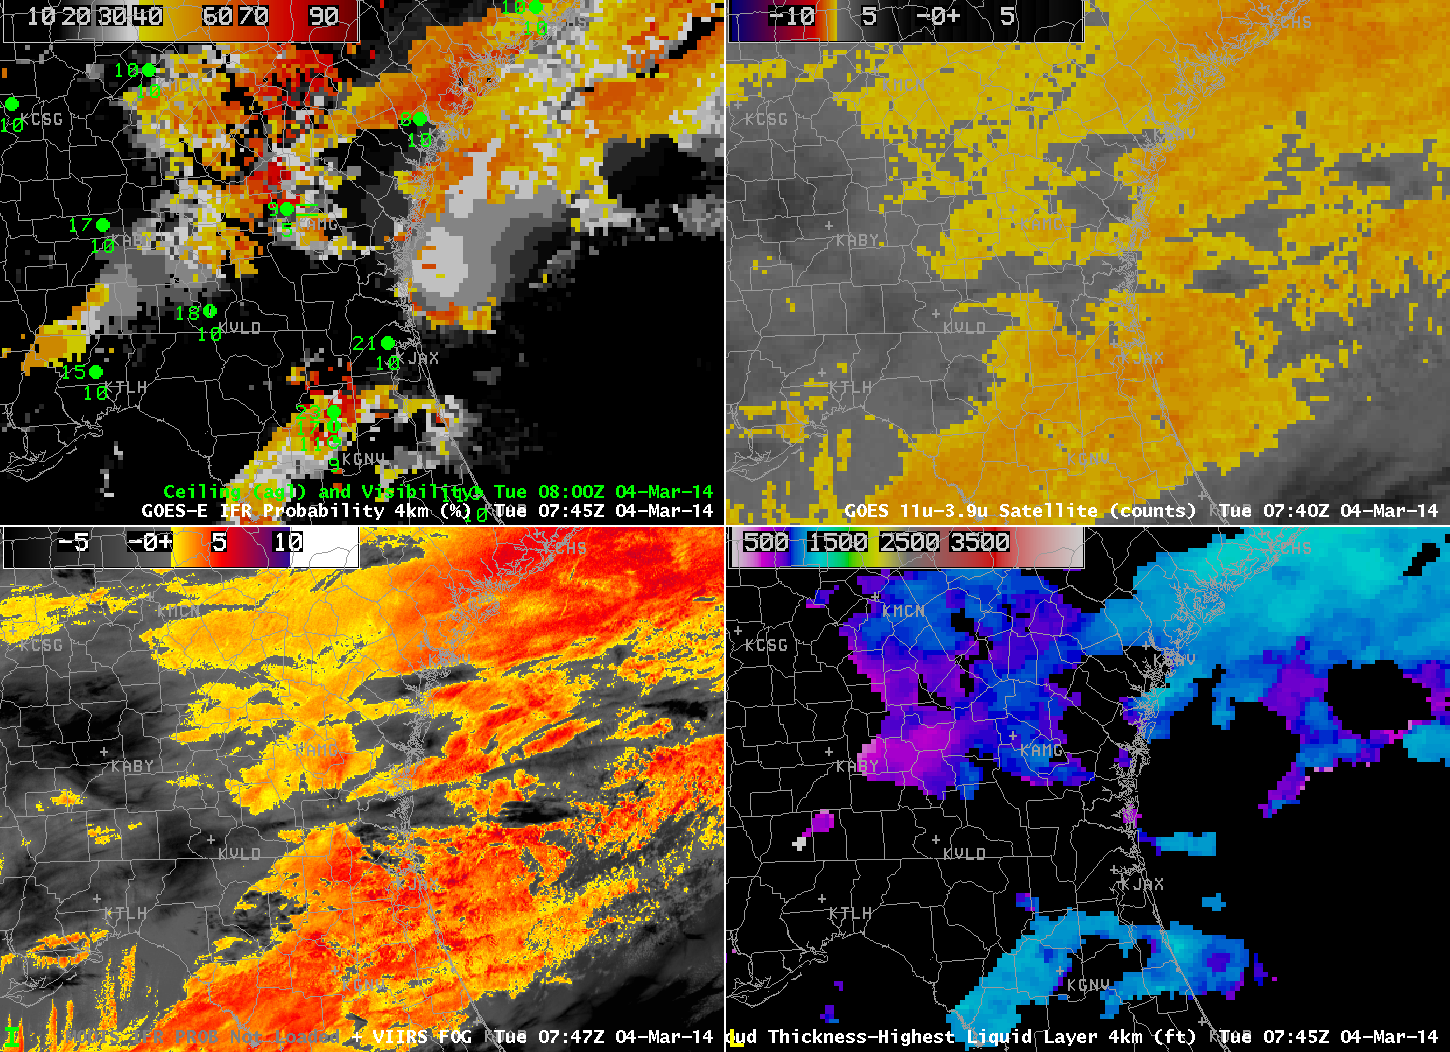
GOES-R IFR Probabilities computed from GOES-13 (Upper left); GOES-East Brightness Temperature Differences (10.7 µm – 3.9 µm) (Upper Right); MODIS-based IFR Probabilities or VIIRS-based Brightness Temperature Difference (11.35 µm – 3.74 µm) (Lower Left); GOES-R Cloud Thickness computed from GOES-East (Lower Right) (click to play animation)

Cold air has swept down the east coast into northern Florida, and the leading edge of that cold air, marked by a shift to northeasterly winds and low clouds, shows up well in the GOES-R IFR Probability fields, displayed above, because the airmass with the northeasterly winds also included low clouds/fog. Note in the animation how IFR conditions develop in Jacksonville as the higher IFR probabilities slide southward. Similarly, IFR conditions diminish over Savannah as IFR Probabilities drop.

This is a case for which the heritage method of detecting fog had difficulties because multiple cloud layers existed. For example, a stratus deck over central Florida shows up very well in the brightness temperature difference field from both GOES and VIIRS, but IFR conditions are not initially seen there (and GOES-R IFR Probabilities are small). The GOES-R Cloud Thickness is not computed in regions with multiple cloud layers, typically, because it shows the thickness of the highest water-based cloud layer. If any overlaying cloud layer at high levels contains ice, the field is not computed.

Fog and Stratus in the Southeast United States

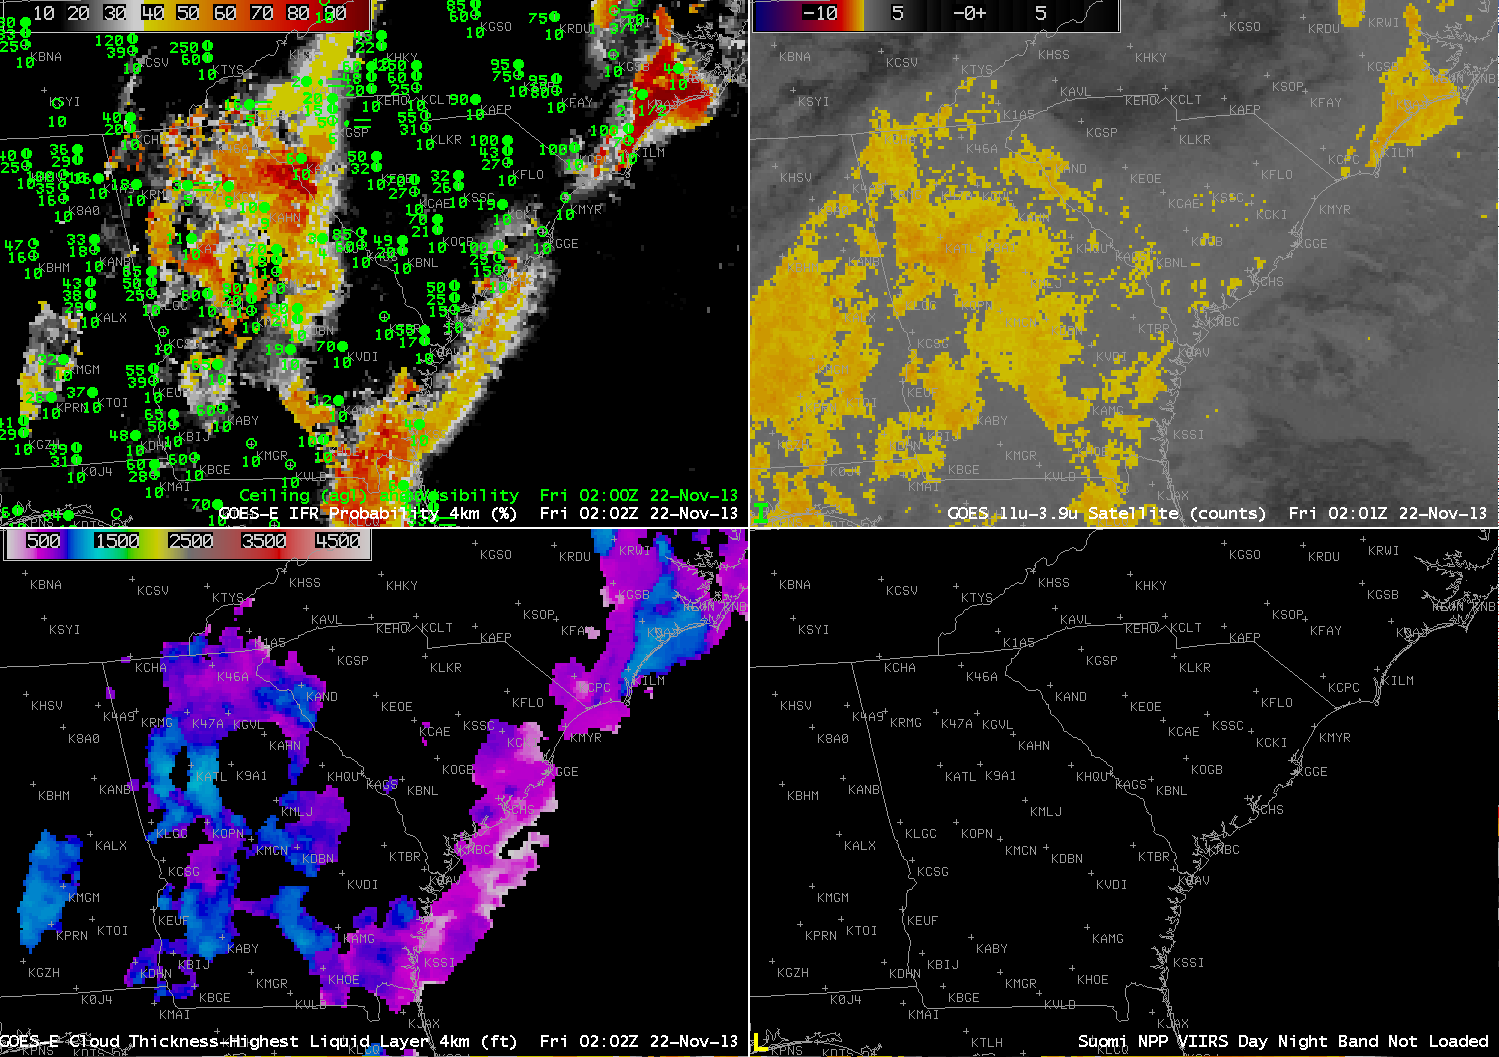
Fog and Stratus with IFR Conditions developed along the Southeast Coast of the United States on the morning of November 22. In some places, the GOES-IFR Probability fields gave a signal of the developing visibility obstructions more than an hour before the traditional brightness temperature difference signal. At 0202 UTC, below, the IFR Probability fields suggest a continuous region of enhanced probabilities of IFR conditions developing along the South Carolina coastline. Both IFR Probabilities and the brightness temperature difference fields agree that Fog/Low Stratus are already present over coastal North Carolina.
GOES_IFR_PROB_20131122_0202

GOES-R IFR Probabilities from GOES-13 (Upper Left), GOES-13 Brightness Temperature Difference Product (10.7 µm – 3.9 µm) (Upper Right), GOES-R Cloud Thickness from GOES-13 (Lower Left), Suomi/NPP Day/Night Band (Lower Right), at 0202 UTC 22 November 2013 (click image to enlarge)

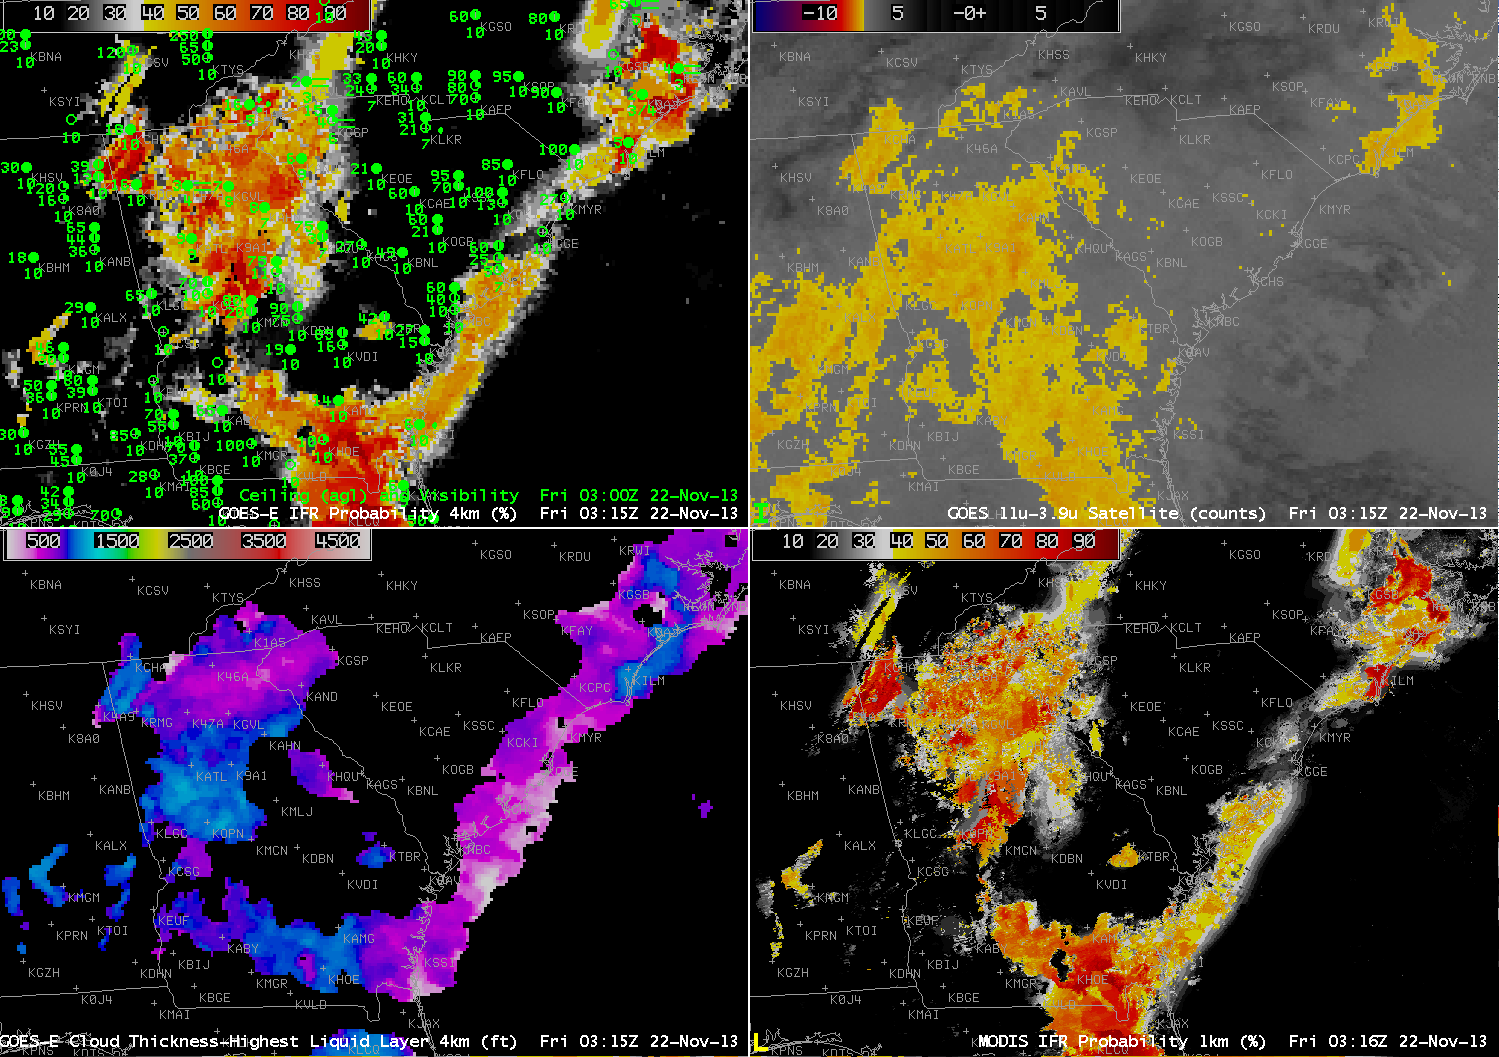
At 0315 UTC, IFR Probabilities continue to increase along the South Carolina coast. In contrast, Brightness Temperature difference fields are showing less of a signal suggestive of fog and low stratus. There was a Terra overpass at 0316 UTC that allowed MODIS data to be used in the GOES-R IFR Probability algorithm, and that field agrees well with the GOES-based field.
MODIS_IFR_PROB_20131122_0316

GOES-R IFR Probabilities from GOES-13 (Upper Left), GOES-13 Brightness Temperature Difference Product (10.7 µm – 3.9 µm) (Upper Right), GOES-R Cloud Thickness from GOES-13 (Lower Left), GOES-R IFR Probabilities computed from MODIS data (Lower Right), at ~0315 UTC 22 November 2013 (click image to enlarge)

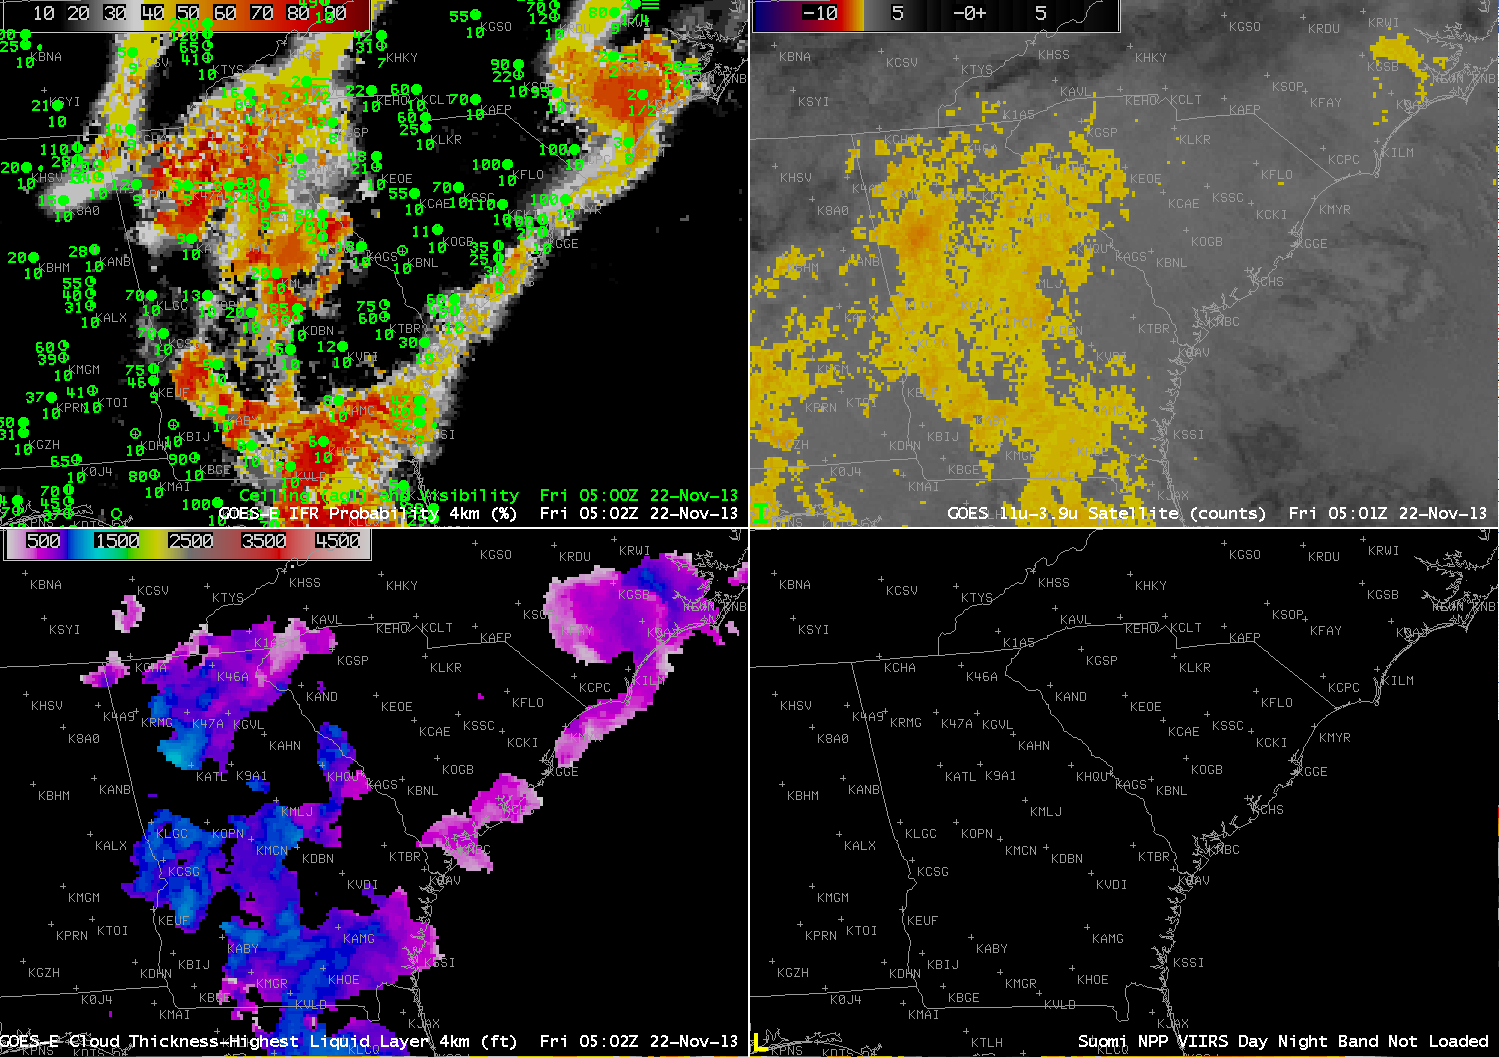
At 0502 UTC, GOES-R IFR Probabilities are still high in a narrow corridor along the coast, despite the lack of a distinct signal from GOES-East in the brightness temperature difference field.
GOES_IFR_PROB_20131122_0502

GOES-R IFR Probabilities from GOES-13 (Upper Left), GOES-13 Brightness Temperature Difference Product (10.7 µm – 3.9 µm) (Upper Right), GOES-R Cloud Thickness from GOES-13 (Lower Left), Suomi/NPP Day/Night Band (Lower Right), at 0502 UTC 22 November 2013 (click image to enlarge)

At 0615 UTC, the brightness temperature difference field starts to show a signal that is consistent with the presence of fog and low stratus along coastal South Carolina. GOES-R IFR Probabilities increase, as well. This is to be expected because the GOES-R algorithms use signals from both the GOES Satellite and the Rapid Refresh data to compute IFR Probabilities. Given that the Rapid Refresh data has been suggesting Fog/Low Stratus might be present (something that can be assumed to be true given the elevated probabilities that could alert any forecaster to the presence of developing fog that have been present for hours in the absence of a distinct signal from satellite), the appearance of a definitive satellite signal should only increase the probability of IFR conditions. At 0616, Suomi/NPP was viewing coastal South Carolina, and both the Day/Night band and the brightness temperature field are shown in the figure below. GOES-R IFR Probability algorithms do not yet incorporate Suomi/NPP data.
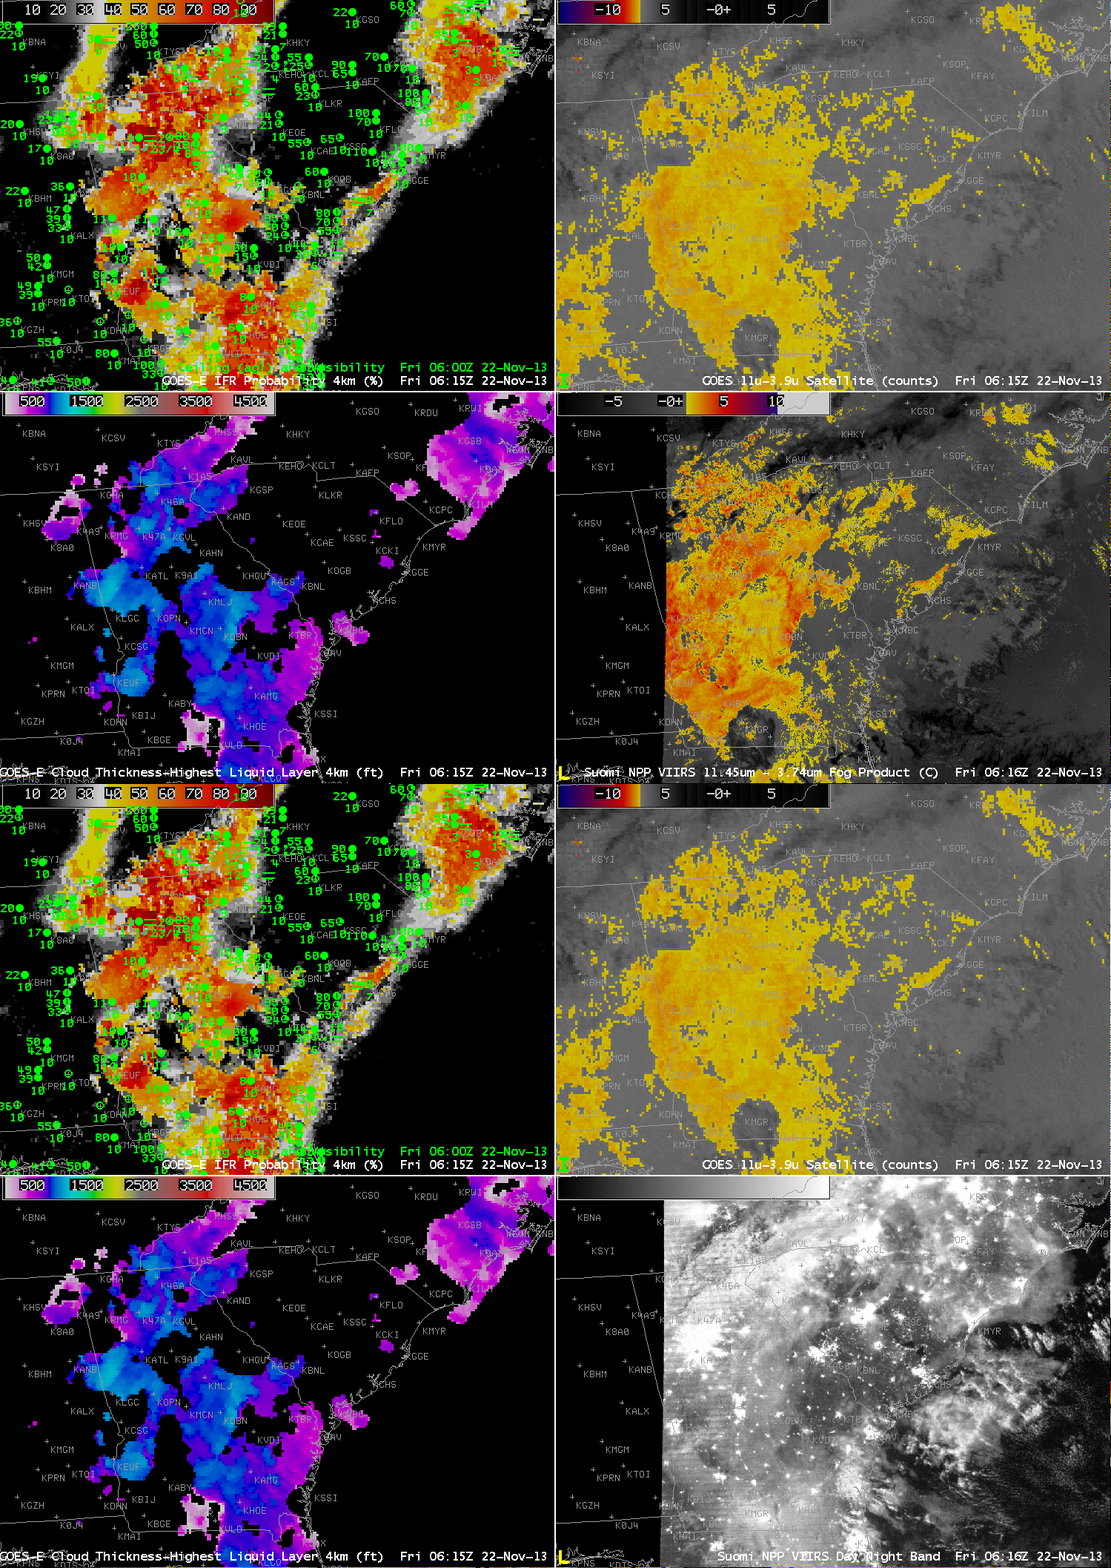
GOES_IFR_PROB_VIIRS_20131122_0616

GOES-R IFR Probabilities from GOES-13 (Upper Left), GOES-13 Brightness Temperature Difference Product (10.7 µm – 3.9 µm) (Upper Right), GOES-R Cloud Thickness from GOES-13 (Lower Left), Toggle between Suomi/NPP Day/Night Band and Brightness Temperature Difference (Lower Right), at ~0615 UTC 22 November 2013 (click image to enlarge)

By 0800 UTC, below, IFR Conditions are reported at Charleston, SC, and GOES-R IFR Probabilities, brightness temperature difference field from GOES and Suomi/NPP and the Day/Night Band from Suomi/NPP all suggest the presence of fog/low stratus. To the northwest, over southeastern Tennessee, high clouds are obscuring the satellite view of any stratus/fog that is present (IFR Conditions are reported at, for example, Crossville, TN).
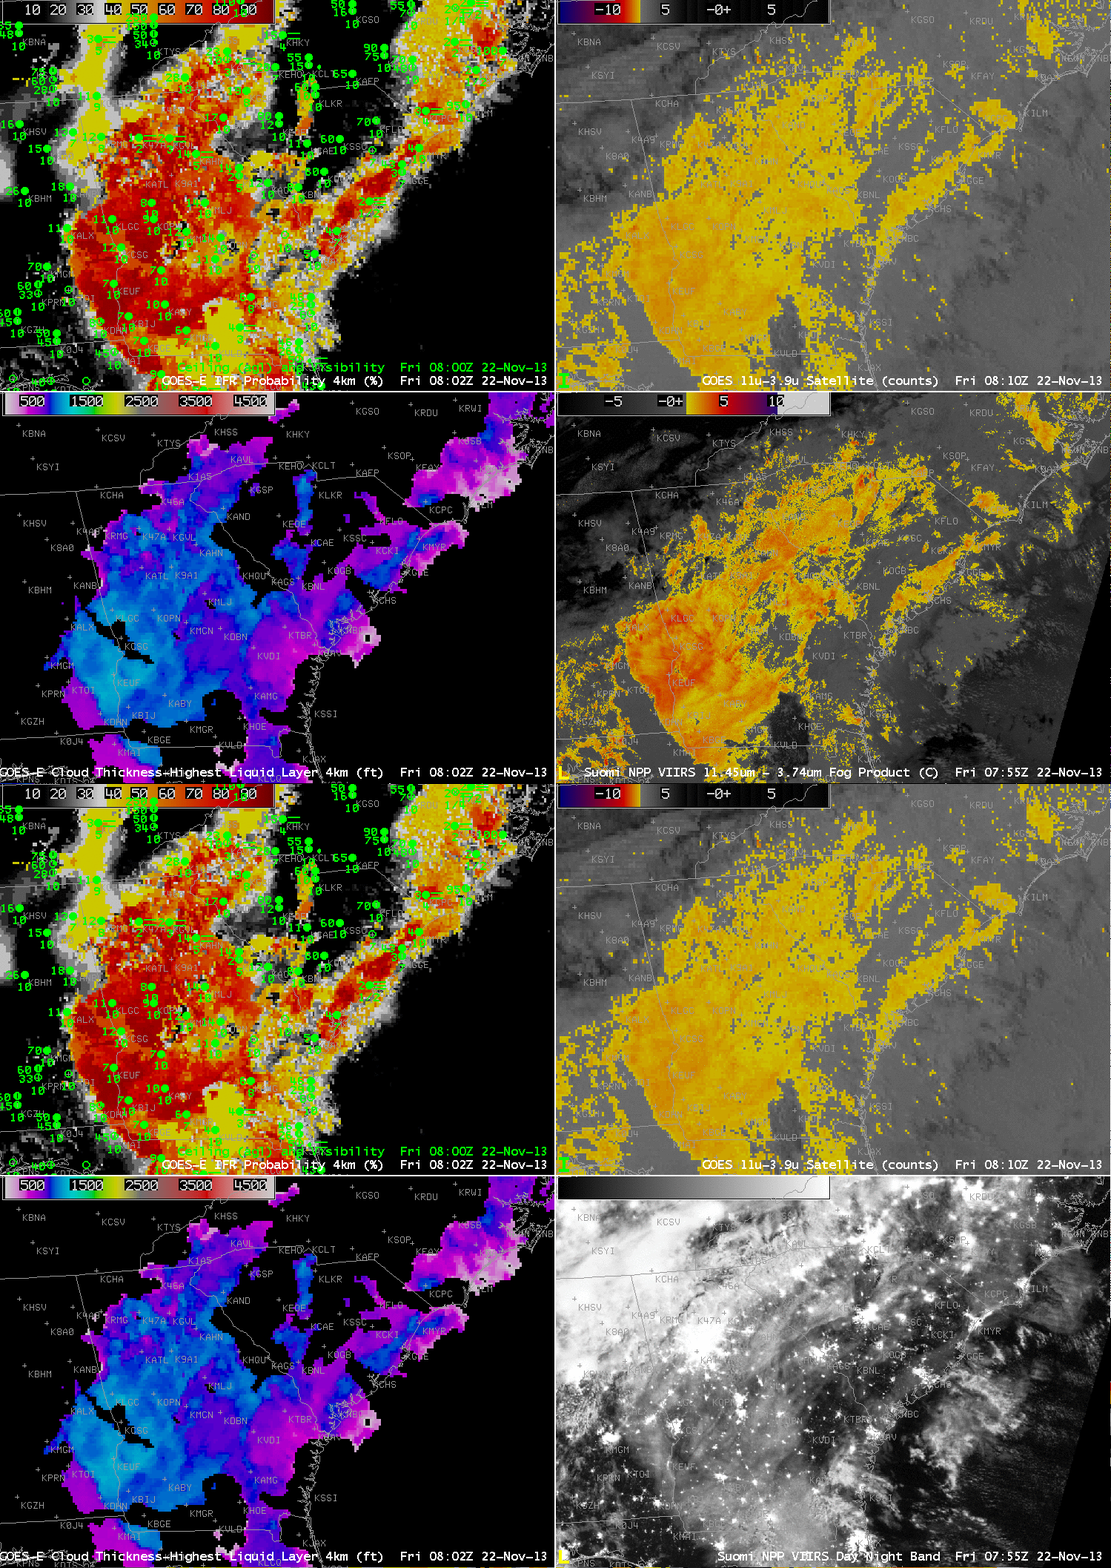
GOES_IFR_PROB_VIIRS_20131122_0800

GOES-R IFR Probabilities from GOES-13 (Upper Left), GOES-13 Brightness Temperature Difference Product (10.7 µm – 3.9 µm) (Upper Right), GOES-R Cloud Thickness from GOES-13 (Lower Left), Toggle between Suomi/NPP Day/Night Band and Brightness Temperature Difference (Lower Right), at ~0800 UTC 22 November 2013 (click image to enlarge)

At 1145 UTC, IFR Probabilities maintain their high values along coastal South Carolina (and all of southwest Georgia) where IFR conditions are occurring. Note how the GOES-13 Brightness temperature difference product has highlighted values over central South Carolina, where IFR conditions are not reported. In this region, the Rapid Refresh model data is not showing saturation (or near-saturation) consistent with low-level stratus/fog so IFR Probabilities are reduced.

1145 UTC is the last image for GOES-R Cloud Thickness prior to twilight conditions. Data in the image can be used (in concert with this chart) to predict the dissipation time for radiation fog. GOES-R Cloud Thickness values over southeast Georgia range from 950 to 1100 feet, suggesting a dissipation time of 3 hours, or near 1445 UTC.
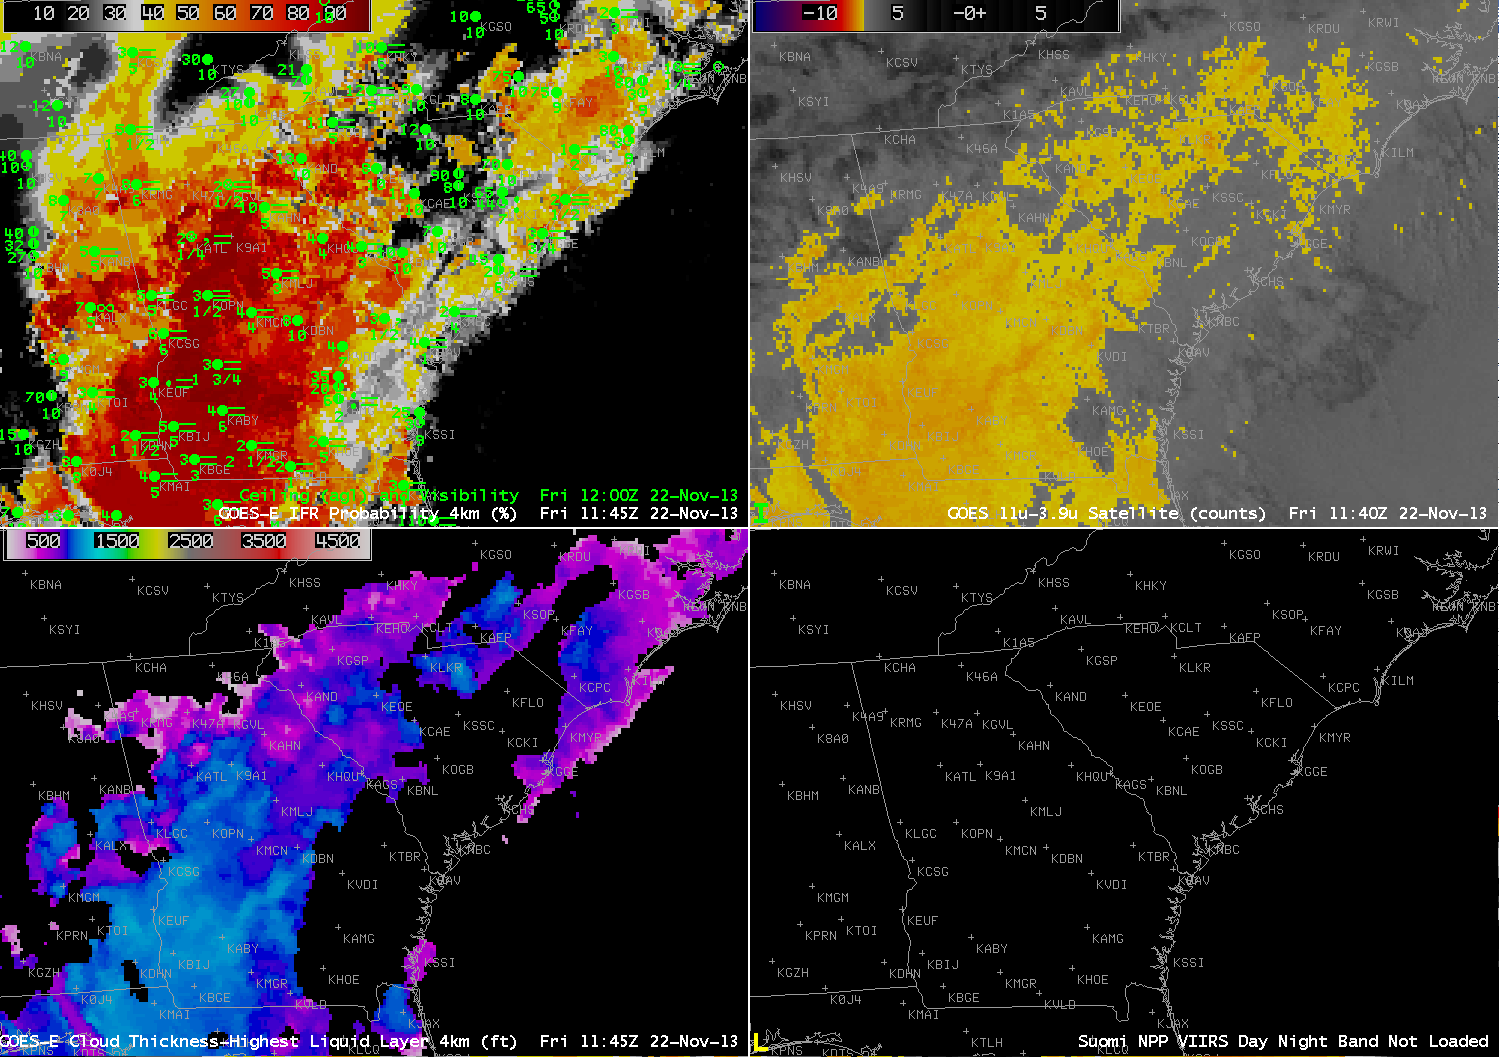
GOES_IFR_PROB_20131122_1145

GOES-R IFR Probabilities from GOES-13 (Upper Left), GOES-13 Brightness Temperature Difference Product (10.7 µm – 3.9 µm) (Upper Right), GOES-R Cloud Thickness from GOES-13 (Lower Left), Suomi/NPP Day/Night Band (Lower Right), at 1145 UTC 22 November 2013 (click image to enlarge)

(Added: Later in the day)

Higher clouds allowed the low clouds to linger. By 1732 UTC, the low clouds had almost dissipated.
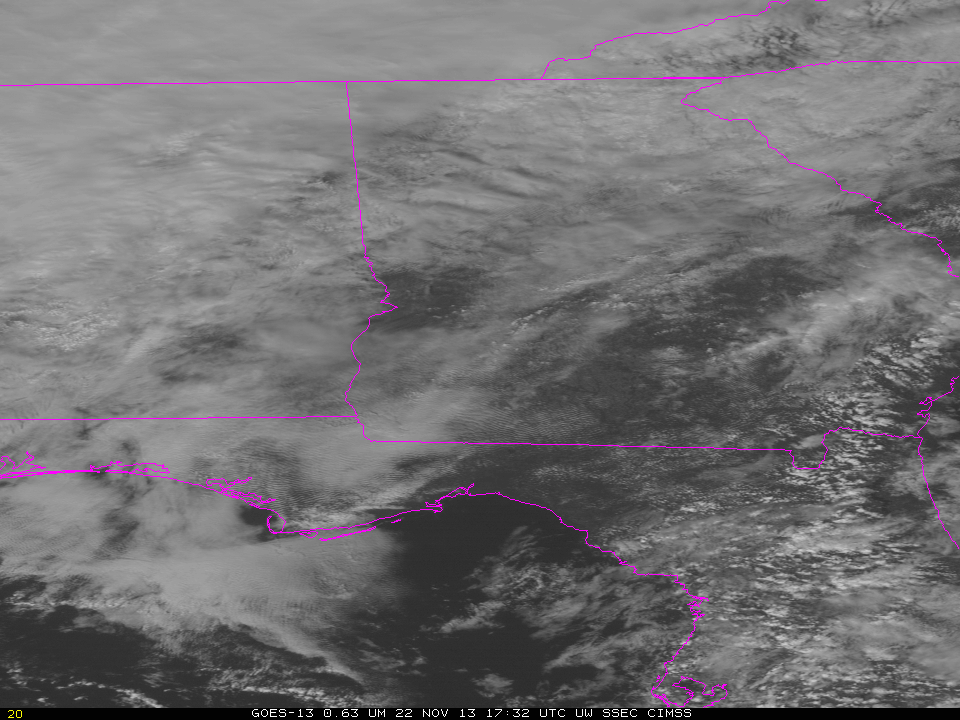
GOES13_VIS_22NOV_1732

GOES-13 Visible Imagery, 1732 UTC 22 November 2013 (click image to enlarge)
Resolving fog in the Cumberland Valley

MODISGOES_IFR_PROB_20131011_0415

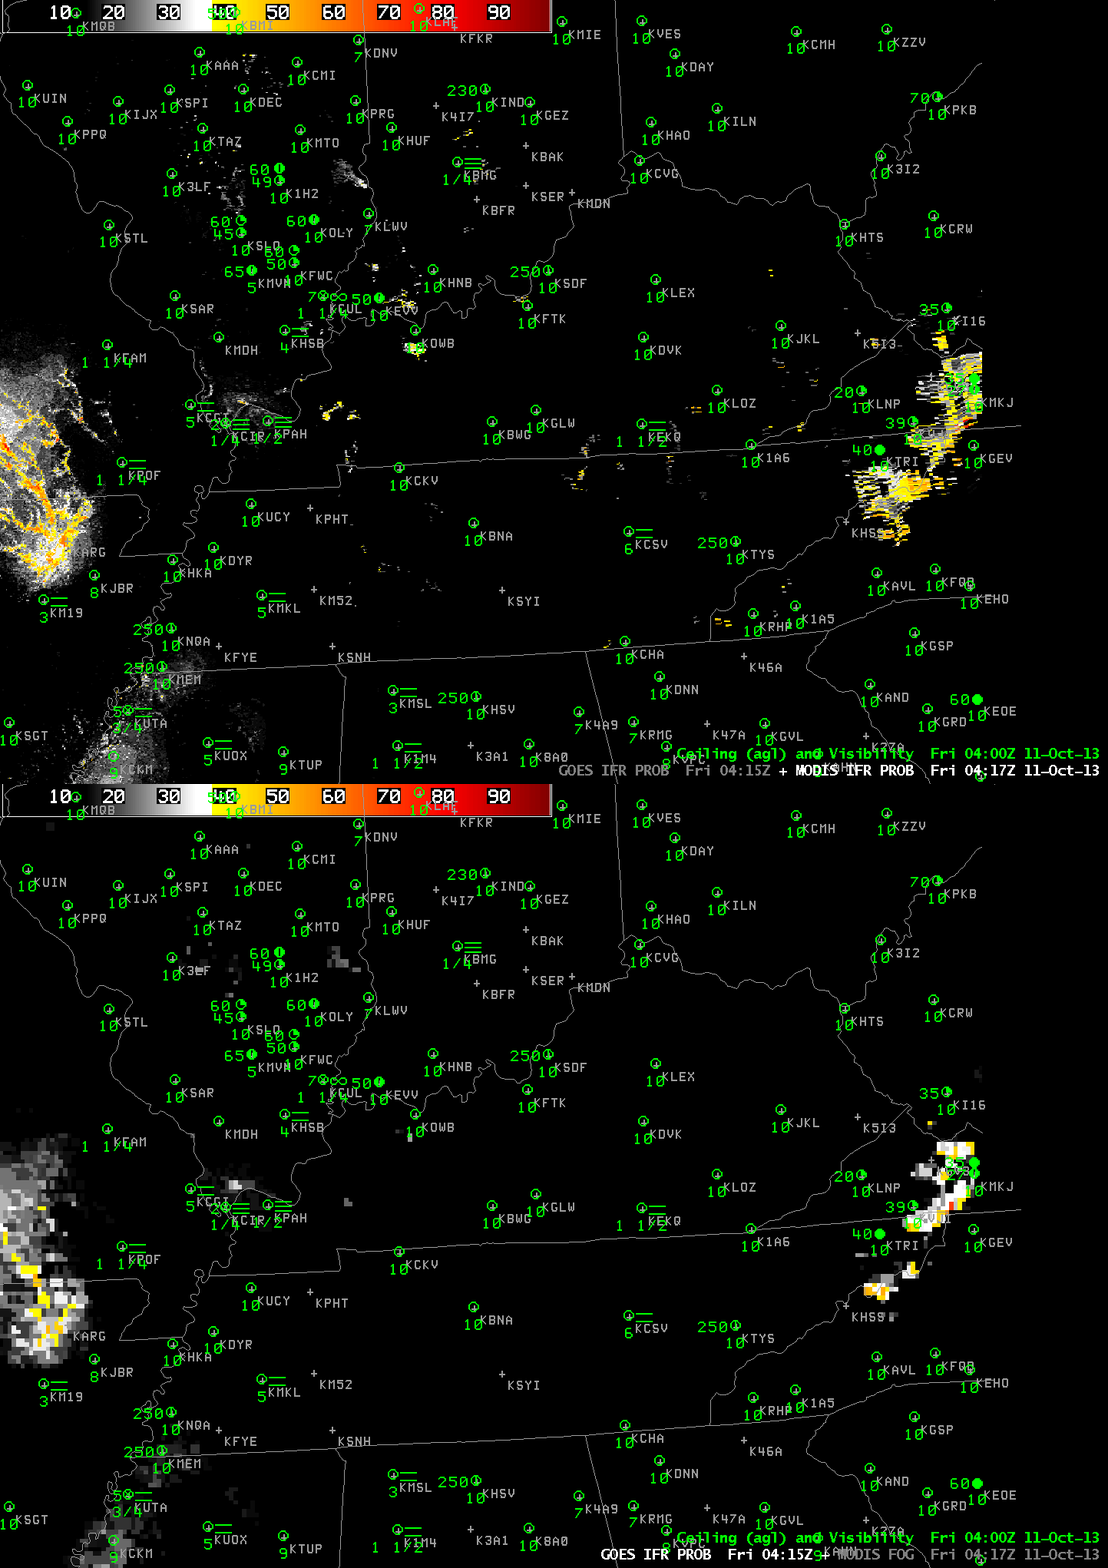
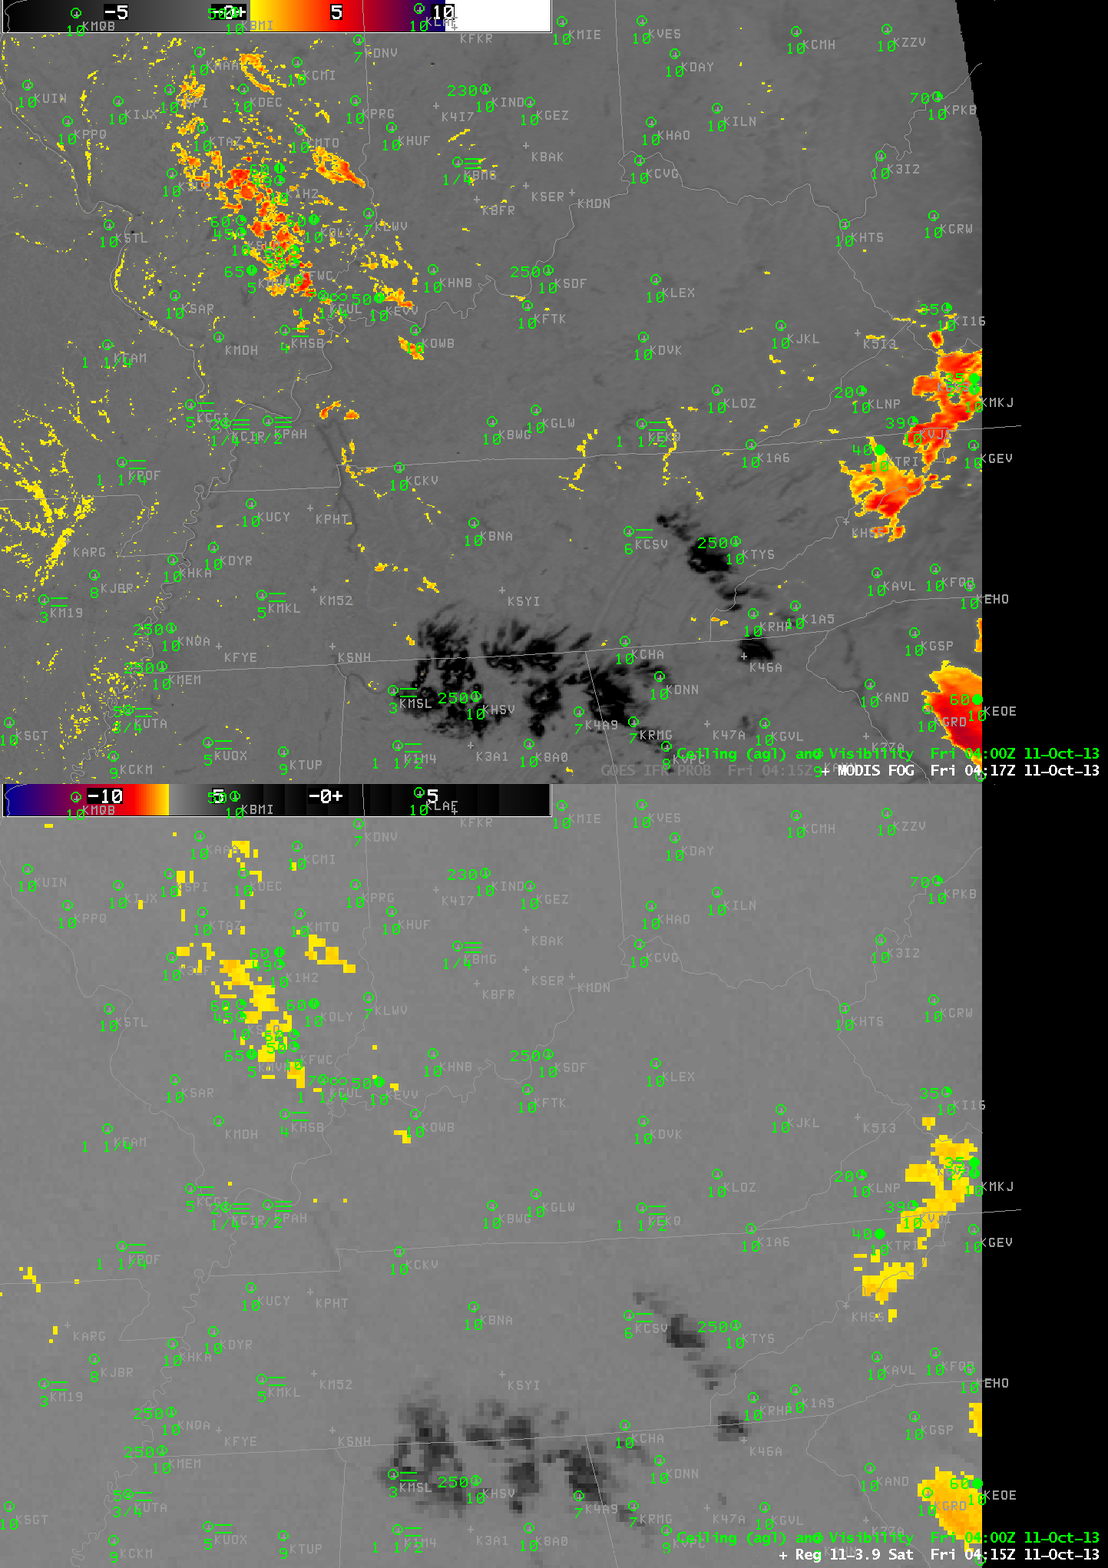
Toggle between GOES-13-based and MODIS-based GOES-R IFR Probabilities at ~0415 UTC on 11 October 2013 (click image to enlarge)
The toggle between the GOES-based and MODIS-based IFR Probabilities, above, shows how high-resolution MODIS data can give an earlier alert to the formation than is possible from GOES. Fog formed in the Cumberland Valley of central Tennessee and southeast Kentucky early in the morning of 11 October. MODIS-based IFR Probabilities over the river valley are peaking around 45% at 0415 UTC (vs. 5% for GOES-based IFR Probabilities). In fact, GOES-based IFR Probabilities do not reach 45% until about 0515 UTC, a full hour later. The toggle below shows the two brightness temperature difference products used at ~0415 UTC to make the IFR Probability fields. MODIS data are better able to resolve the small-scale river valleys where fog is forming earlier.

MODISGOES_FOG_20131011_0415

Toggle between GOES-13-based and MODIS-based Brightness Temperature Differences at ~0415 UTC on 11 October 2013 (click image to enlarge)
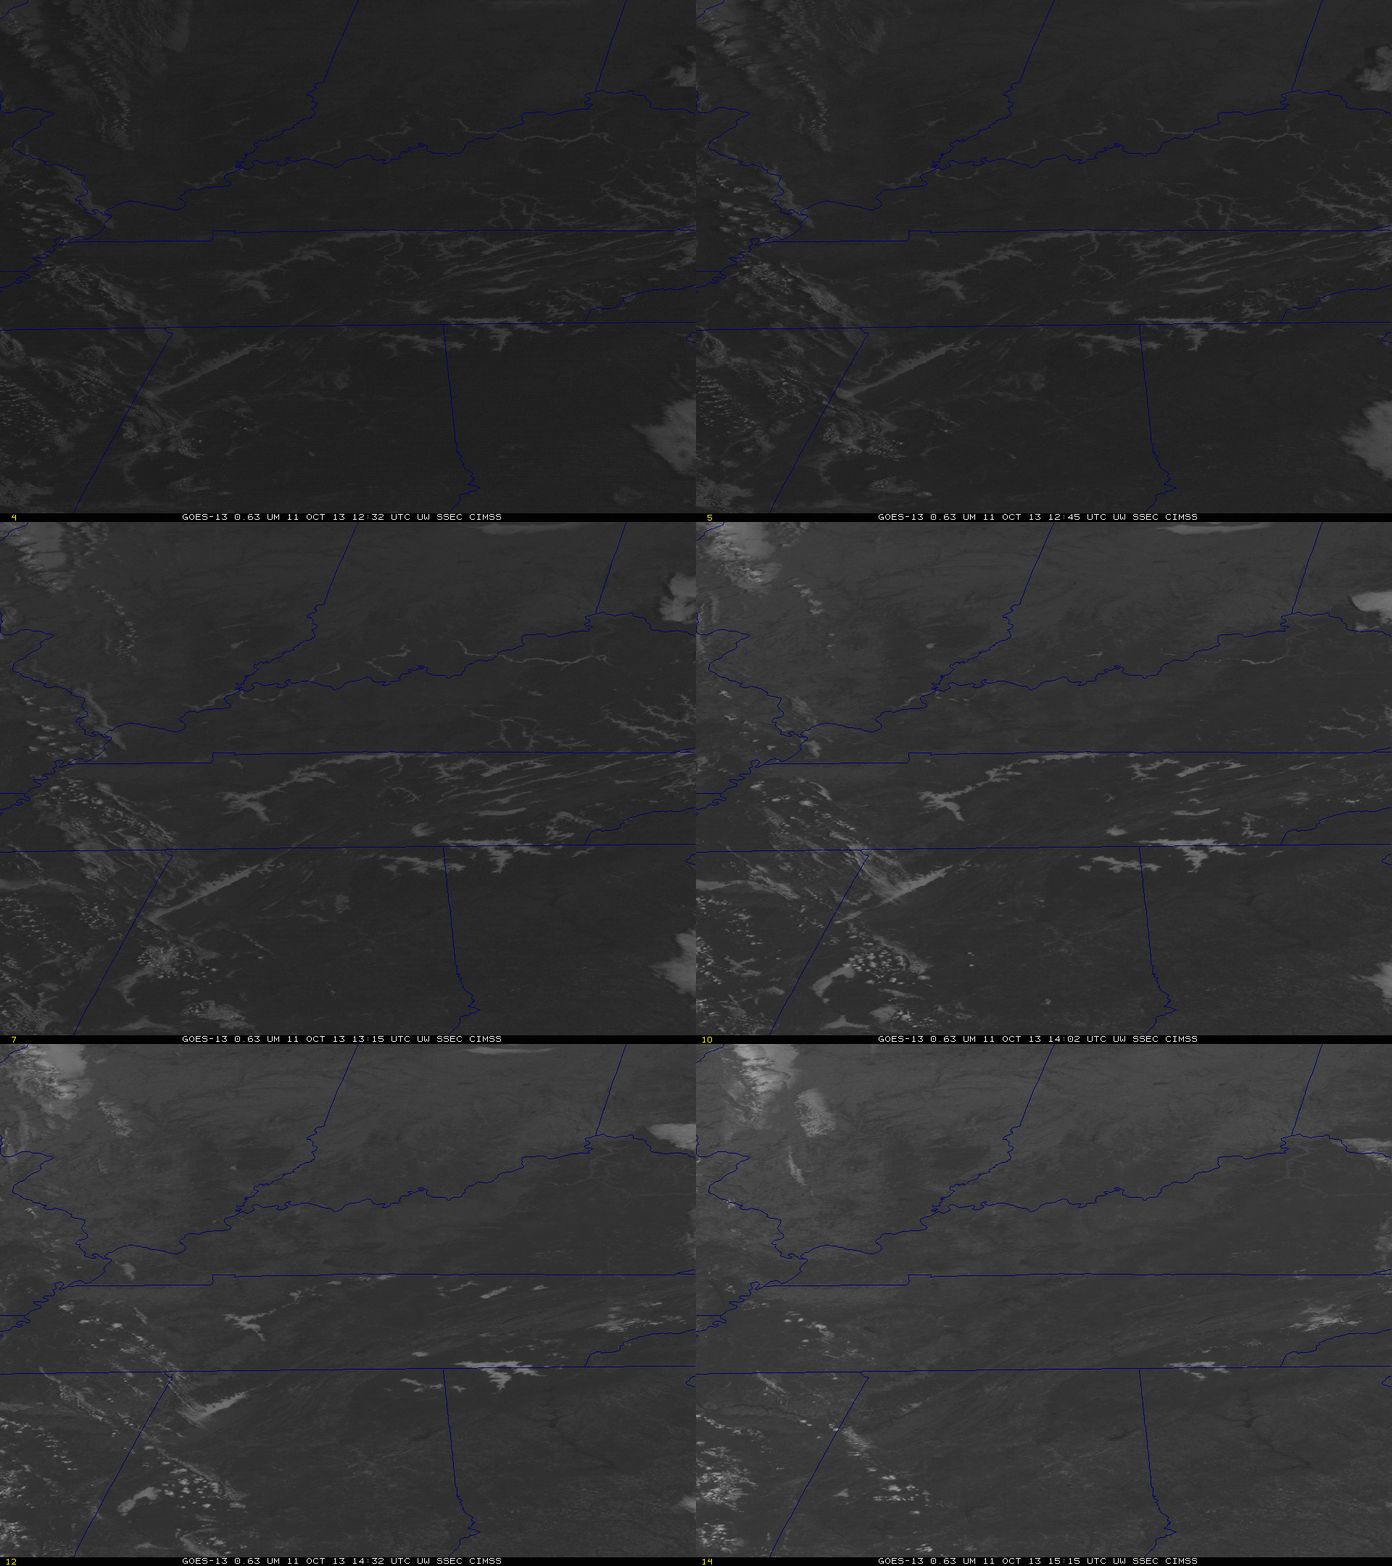
The animation below shows the fog quickly burning off in the morning. It has dissipated by 1500 UTC.

GOES13_VIS_11Oct2013loop

GOES-13 Visible Imagery during the morning of 11 October 2013 (click image to enlarge)
IFR Conditions in the Southeast

GOES_IFR_PROB_20131004loop

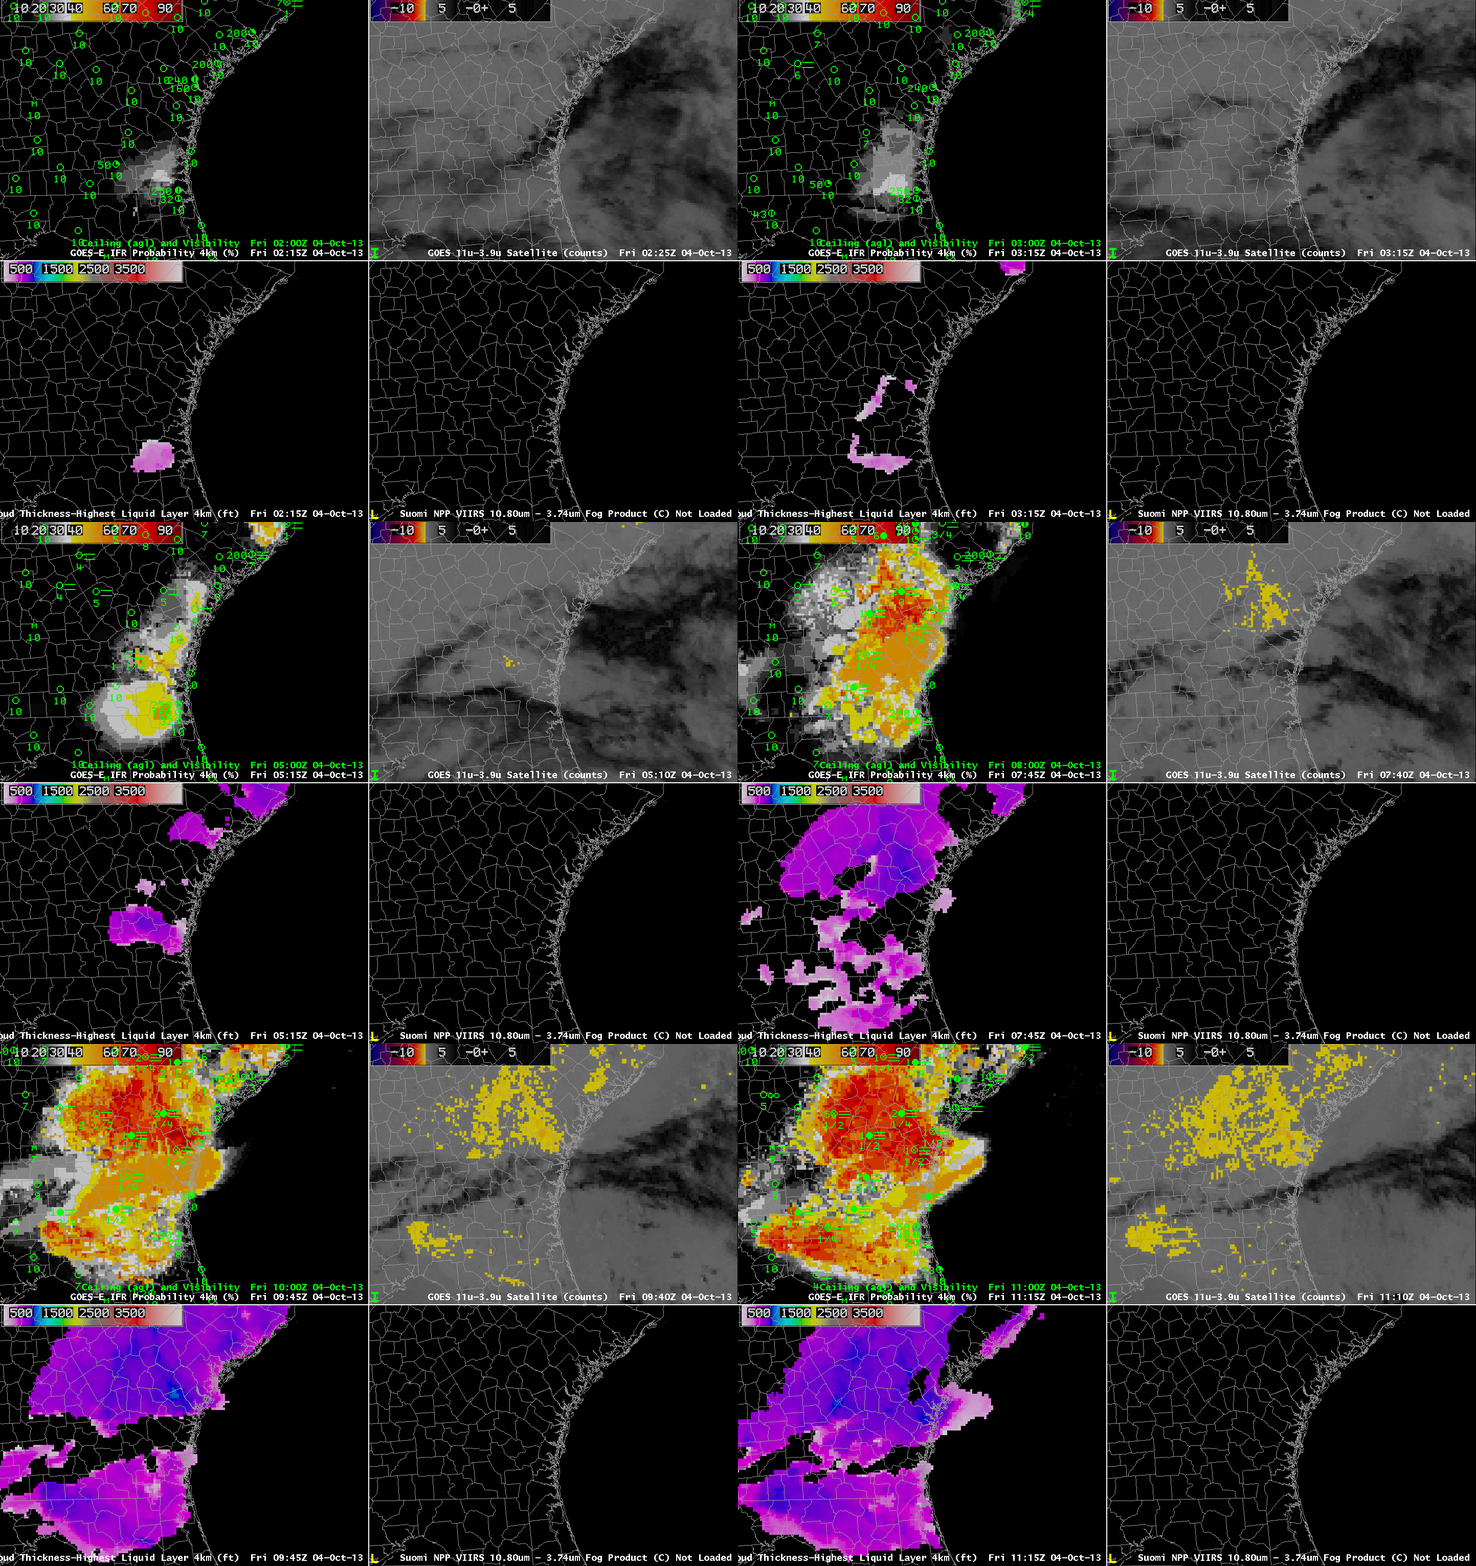
GOES-13-based GOES-R IFR Probabilities (Upper Left), GOES-13 Brightness Temperature Difference Product (10.7 µm – 3.9 µm) (Upper Right), GOES-13-based GOES-R Cloud Thickness (Lower Left), Suomi/NPP Brightness Temperature Difference (Lower Right), all times as indicated (click image to enlarge)

High Pressure of the southeast US allowed for clear skies and light winds overnight, and radiation fog developed over coastal portions of eastern Georgia. Because high clouds were present, the traditional method for detecting fog and low stratus, the brightness temperature difference between 10.7 µm and 3.9 µm on GOES could not capture the entire areal extent of the cloud. Fog is initially reported in eastern Georgia where IFR Probabilities are increasing underneath an ice-phase cloud deck that prevents the GOES satellite from seeing the development of low clouds and fog. Accordingly, the IFR probabilities are lower than they would be if satellite data were included. The uniform nature of the field is testament to the use of Rapid Refresh Data to drive the IFR Probability field. Shortly after 0600 UTC, a satellite signal develops over South Carolina as the high clouds shift to the south. When this happens, IFR probabilities increase (and acquire a more pixelated look). Regions under high clouds with IFR conditions persist through the end of the loop, however. It’s important to have a fused data product that allows two different complementary fields to diagnose where IFR conditions are likely. Where the brightness temperature difference cannot be used, Rapid Refresh Data gives vital information. Where brightness temperature difference data can be used, the Rapid Refresh Data can fine-tune things.

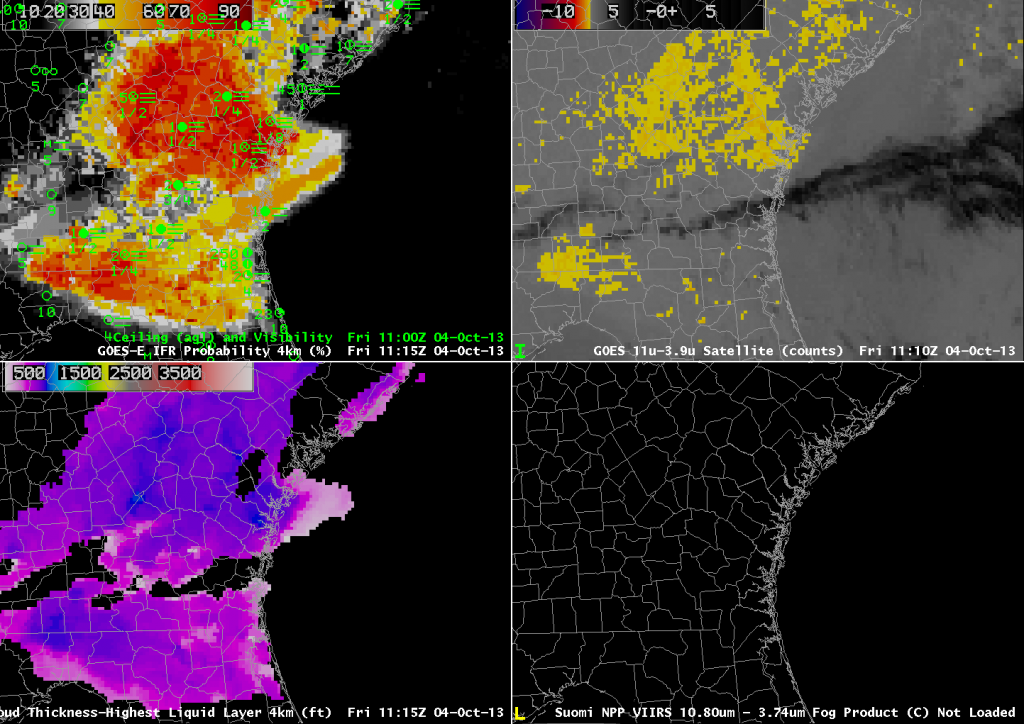
GOES_IFR_PROB_20131004_1115

As above, but for 1115 UTC (click image to enlarge)

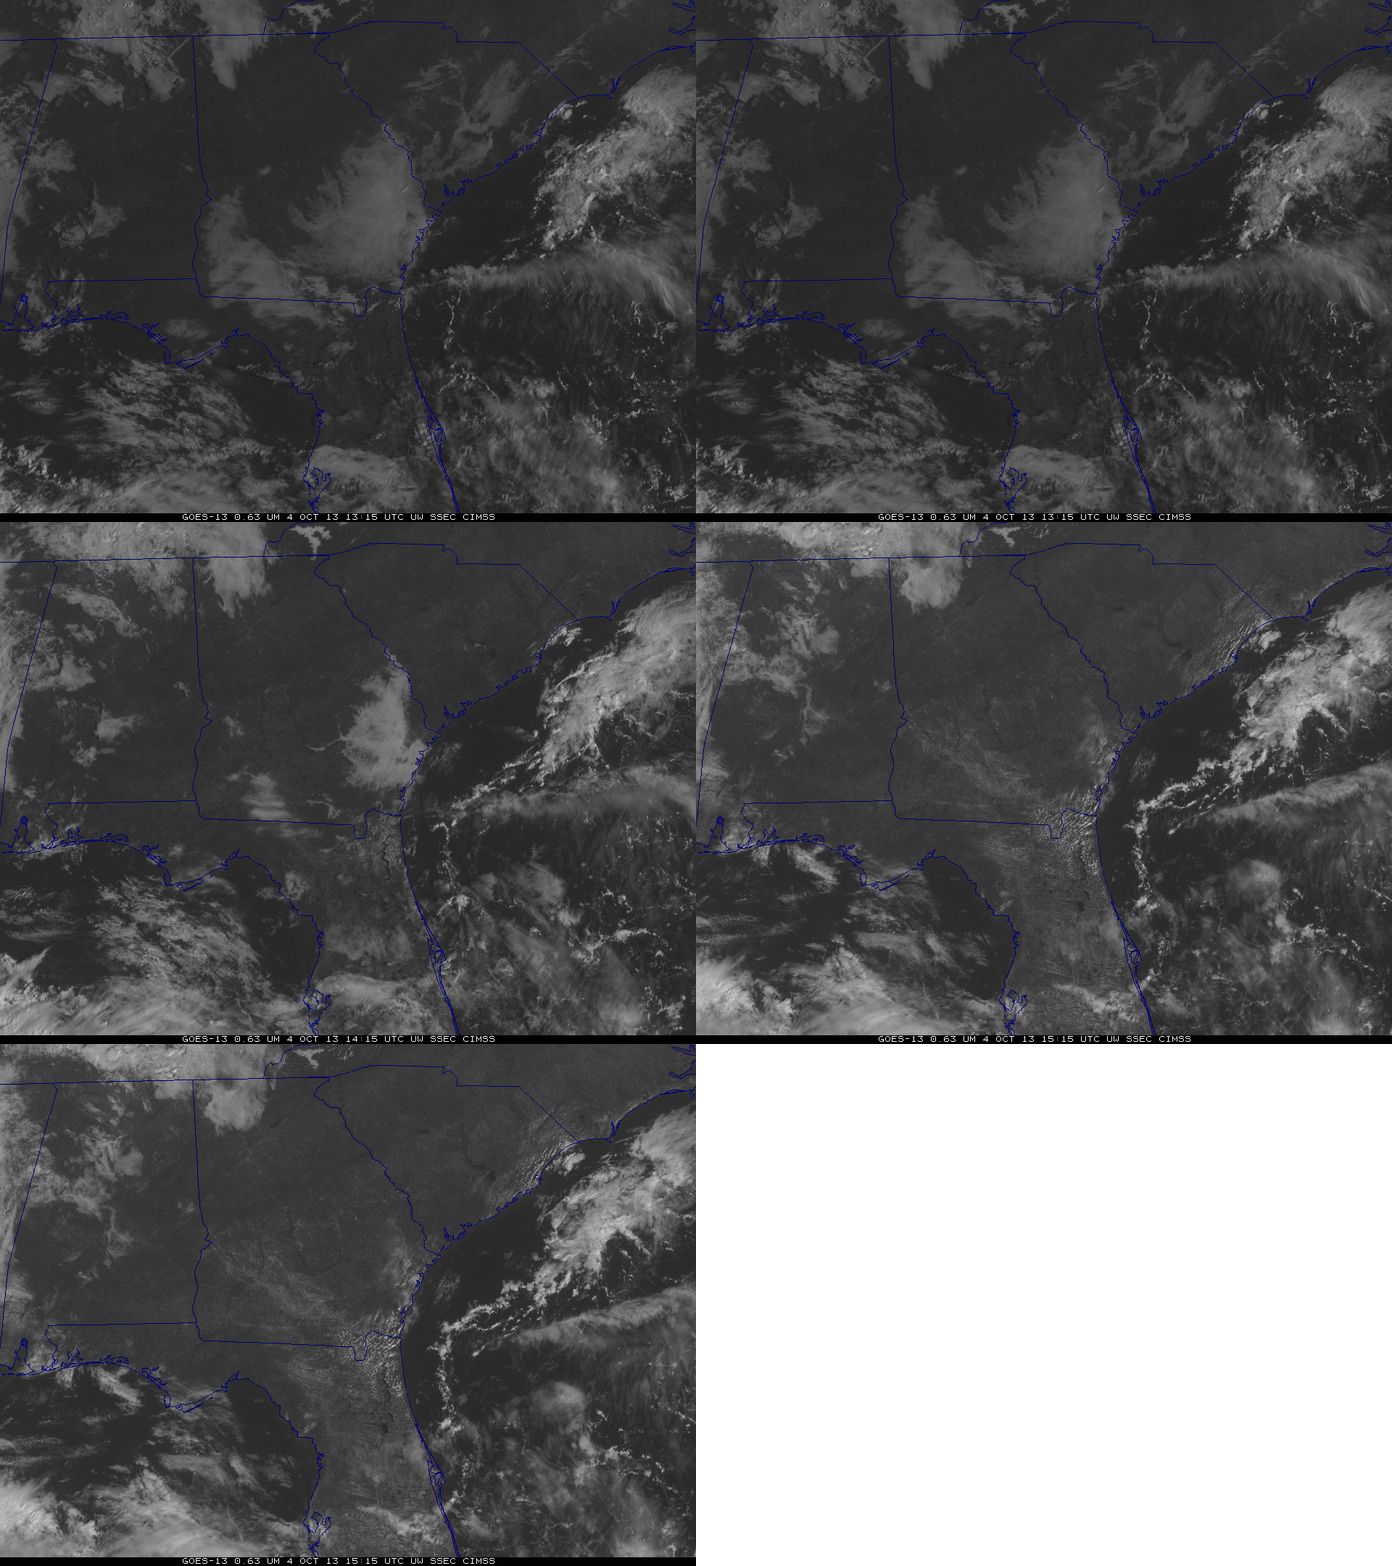
The 1115 UTC image, above, shows the GOES-R cloud thickness just before twilight conditions that accompany sunrise prohibit its computation. The cloud thickness in a radiation fog is related to dissipation time, and the cloud thickness is shown to be quite thin: Thickest values, in blue, are around 800 to 900 feet. This scatterplot relates cloud thickness to dissipation time, and it suggests a dissipation time of 1-2 hours. However, the visible imagery animation, below, shows actual dissipation occurred shortly after 1500 UTC. Note that there is considerable spread in that predictive scatterplot.

GOES13_4October2013_loop

GOES-13 Visible Imagery, hourly at 1315, 1415 and 1515 UTC on 4 October (click image to enlarge)

IFR Conditions over Georgia on a Summer Morning

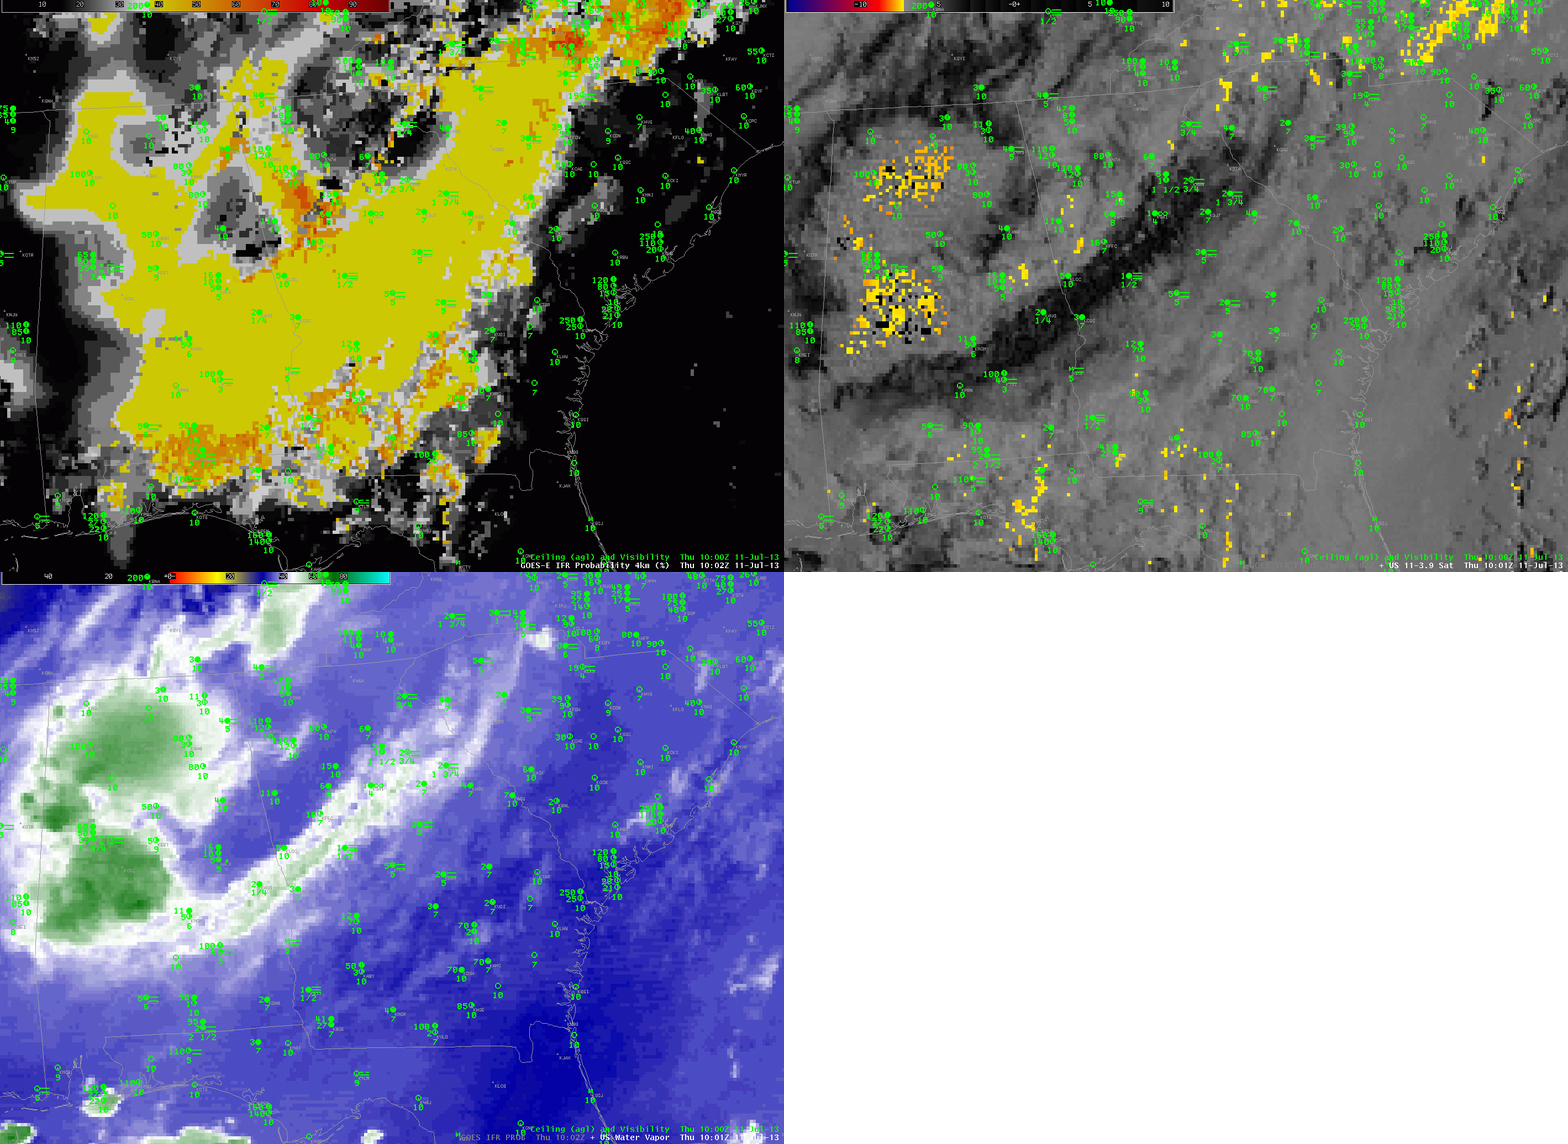
Animation of GOES-East Water Vapor Imagery (6.7 µm), Brightness Temperature Difference Product (10.7 µm – 3.9 µm) and GOES-R IFR Probability computed with GOES-East data, 1000 UTC on 11 July 2013

The satellite animation, above, shows ample evidence of multi-layered clouds over Georgia and surrounding states, in a region where ceilings and visibilities approached/exceeded IFR conditions.  The traditional method of determining regions of fog/low stratus — the brightness temperature difference between the 10.7 µm and 3.9 µm channels — gives no information here because low clouds are screened by higher ice-phase clouds.

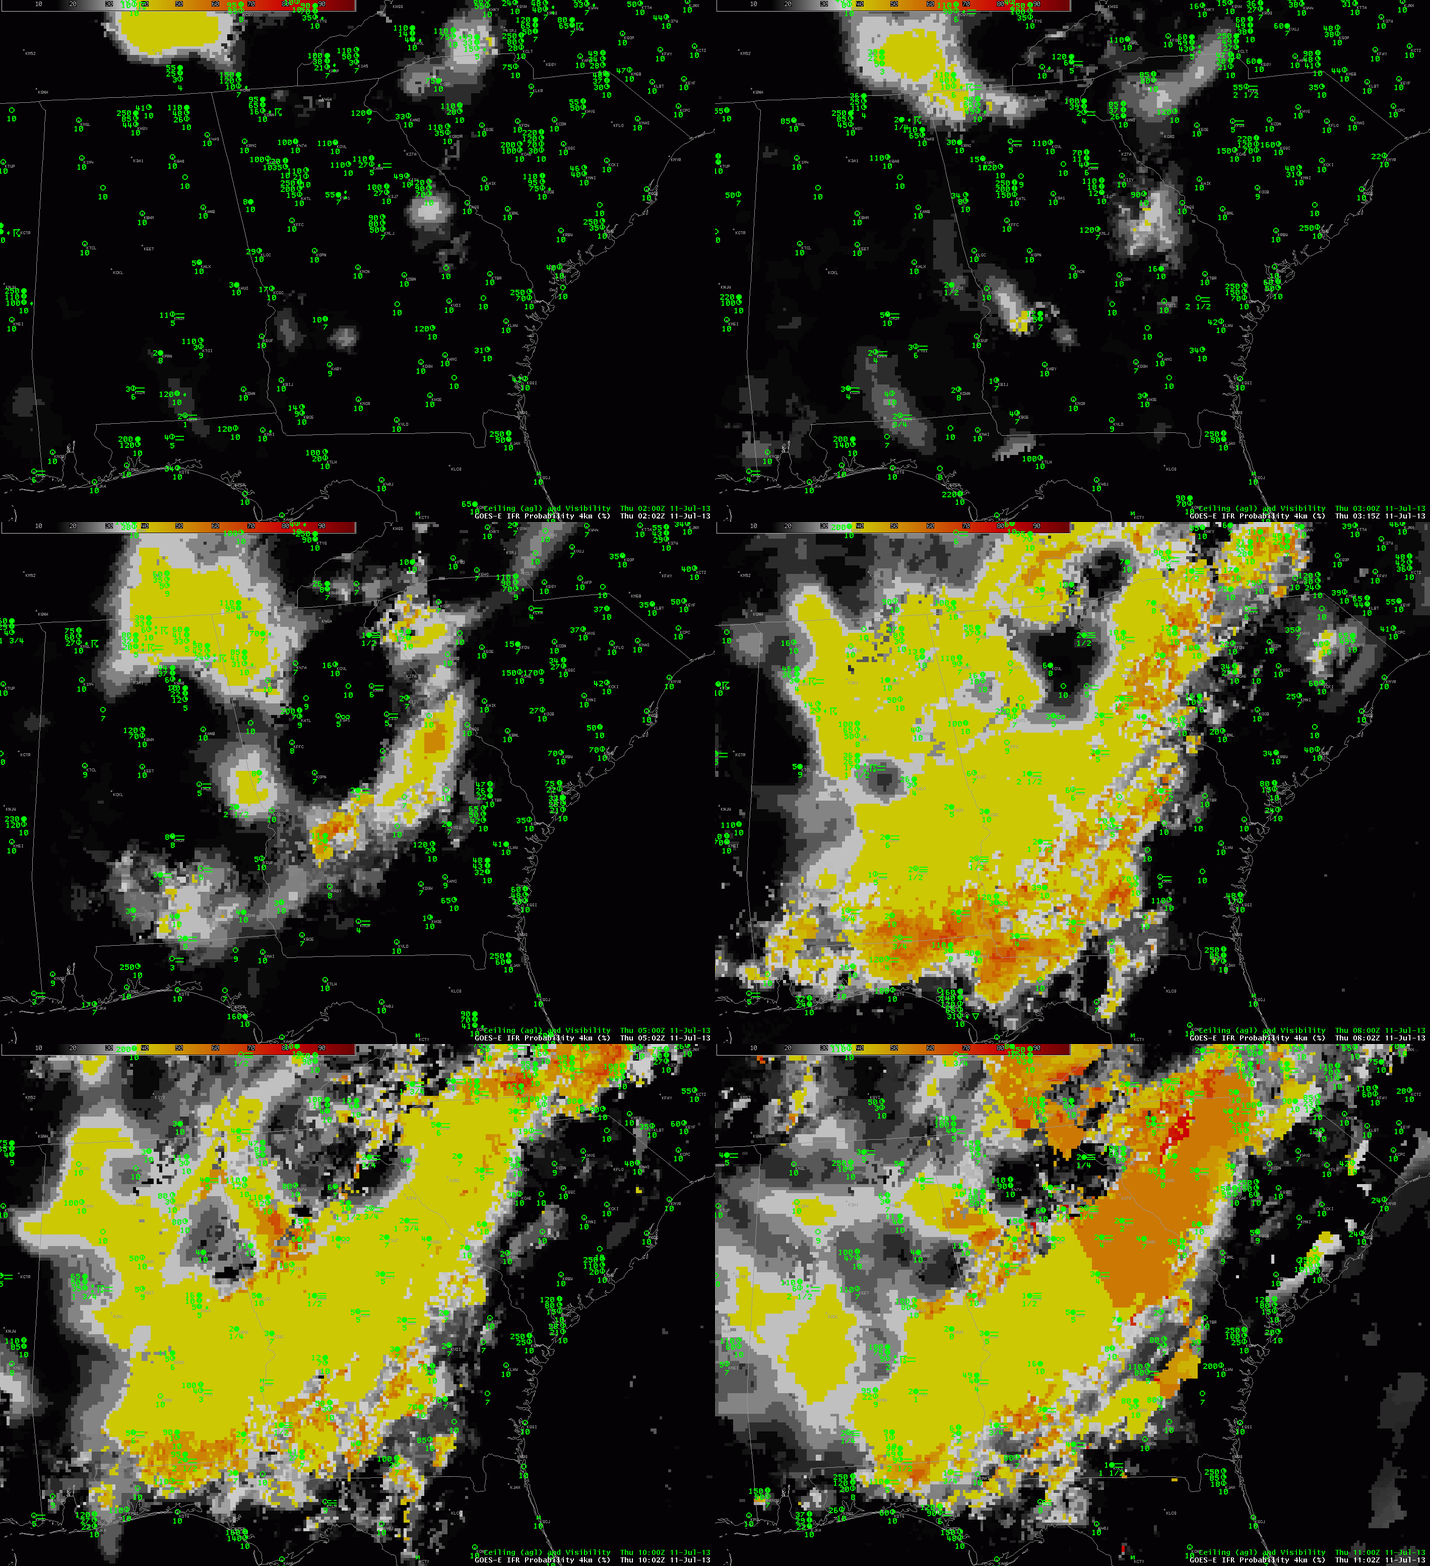
GOES-R IFR Probability fields merge information from GOES Imager data and the Rapid Refresh Model.  Even if GOES Imager data gives little information, GOES-R IFR Probability fields will give valuable information because they are also use information from the Rapid Refresh model.  Because the IFR Probability fields don’t include satellite data, probabilities are lower.  The large region of yellow — IFR Probabilities around 40% — sits over many stations that are reporting IFR conditions.   Note how IFR Probabilities are higher over North Carolina where satellite data are being used in the computation of the field — but there are fewer reports there of IFR conditions (despite the higher probability).  Temper the interpretation of the IFR Probabilities with knowledge of what is being used to compute them.

The evolution of IFR Probability fields can give a Head’s Up to deteriorating conditions in the atmosphere.  Note in the hourly animation below how probabilities initially do increase over regions that subsequently have IFR or near-IFR conditions.  At the end of the animation, there is an obvious boundary between different probabilities over northeast Georgia (Orange values around 55%) and western Georgia (values around 40%).  That southeast-to-northwest boundary shows where nighttime predictors are being used (to the west) vs. daytime predictors (to the east) in the computation of IFR Probabilities.

GOES-R IFR Probabilities (hourly) from 0200 through 1100 UTC, 11 July 2013

Radiation Fog and Dissipation Time in Florida

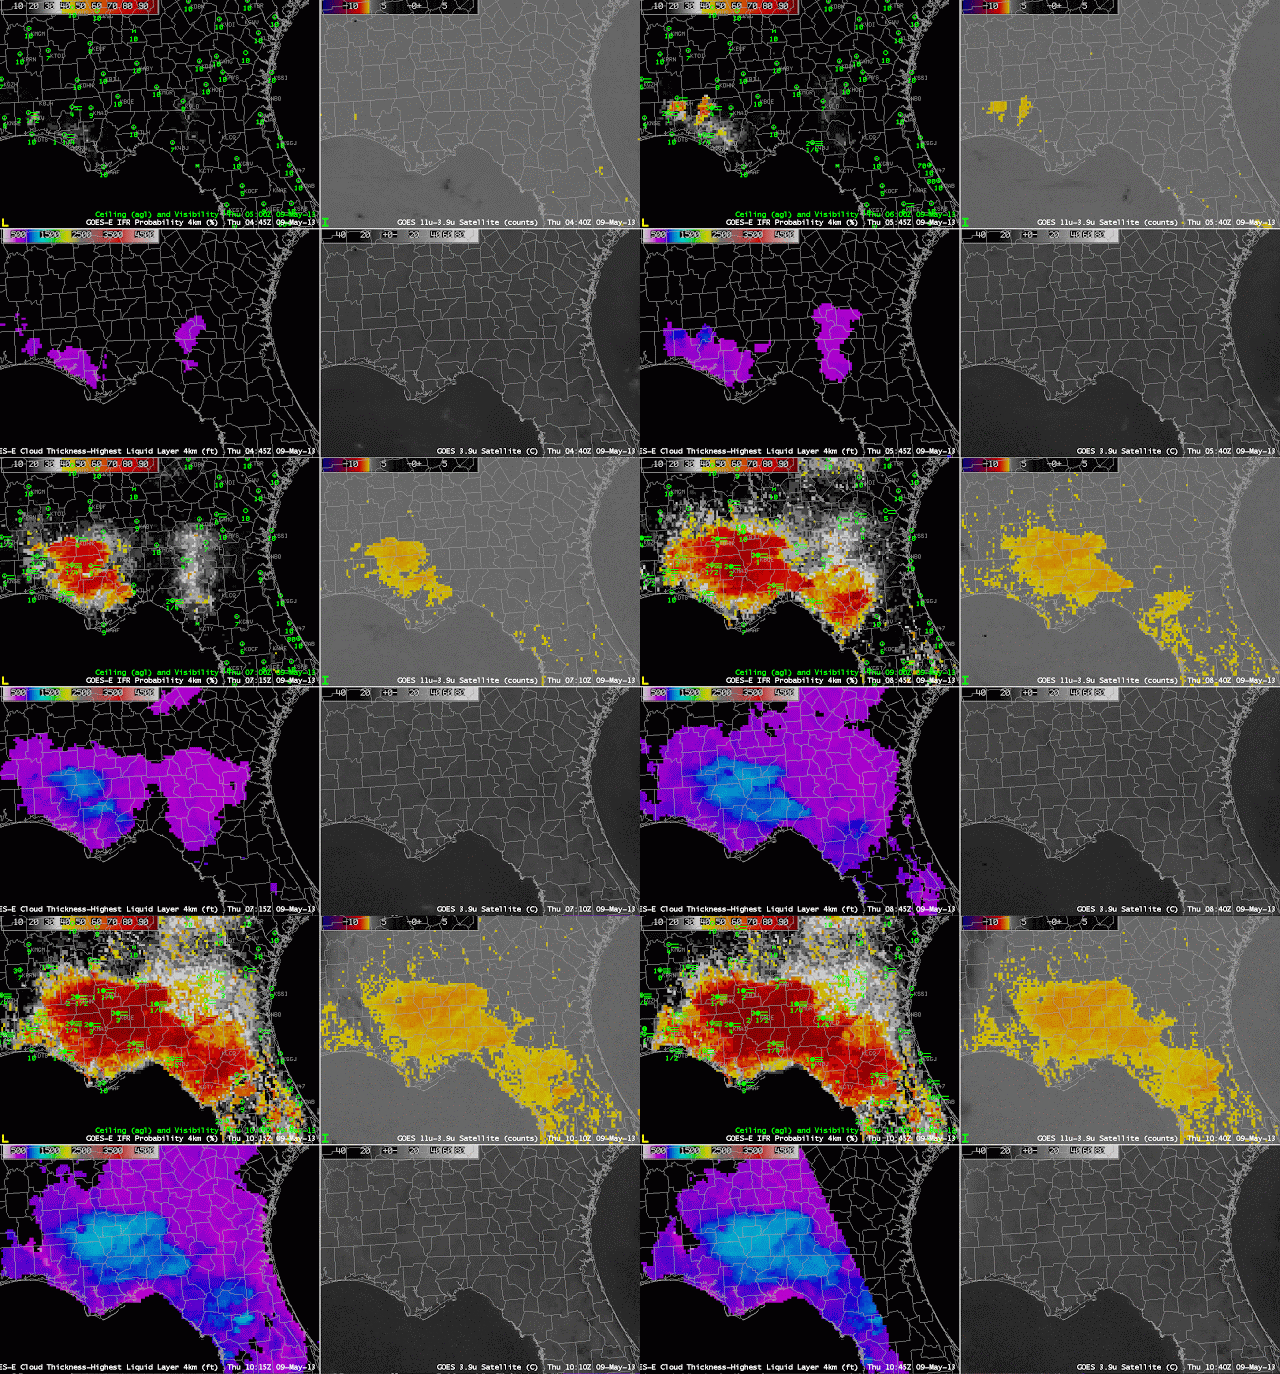
GOES-R IFR Probability computed from GOES-East (Upper left), GOES-East Brightness Temperature Difference (10.7 µm- 3.9 µm) (Upper right), GOES-R Cloud Thickness (Lower Left), GOES-East 3.9 µm Brightness Temperature (Lower Right)

GOES-R Fog/Low Stratus fields can be used to predict fog dissipation times, and in cases of radiation fog, the IFR probability fields sometimes give advance notification of developing IFR conditions before the traditional brightness temperature difference field has a strong signal.

In the example above, for instance, IFR probabilities at 0715 UTC suggest IFR conditions are possible over Perry, FL — in Taylor County, Florida — (where IFR conditions are observed) before the Brightness Temperature Difference field has a signal.   Predictions of IFR conditions via that GOES-R fields before the Brightness Temperature Difference field has a strong signal are common.

The GOES-R Cloud Thickness observed just before twilight conditions is used with this scatterplot to predict dissipation time.  In the example above, thicknesses are near 1000 feet over northern Florida and southern Georgia, so fog will dissipate in between 2 and 4 hours, according to the points plotted, or in a little over 3 hours according to the best linear fit through the plotted points.  The visible imagery animation, below, shows the fog dissipating as expected from the scatterplot.

GOES-13 Visible Imagery over northern Florida