GOES-based GOES-R IFR Probability (Upper Left), GOES-East Brightness Temperature Difference (10.7µm – 3.9µm) (Upper Right), GOES-R Cloud Thickness (Lower Left), MODIS-based GOES-R IFR Probability (Lower Right) (Click to Enlarge)
Fog and low ceilings developed over the southeast United States during the morning hours of 28 October 2014. The animation above, showing data each hour, shows IFR Probabilities developing initially near Charleston South Carolina then overspreading much of South Carolina, Georgia and Mississippi. In contrast, the brightness temperature difference field has a positive signal over most of those states. IFR Probability correctly screens out regions where Brightness Temperature Difference suggests low clouds are present but where ceilings and visibilities do not meet IFR criteria. IFR Probabilities are highest where the brightness temperature difference signal has the largest value, however.
The animation includes one hour (0700 UTC) with a MODIS-based IFR Probability field, shown below. MODIS- and GOES-based fields show similar patterns, but edges are sharper in the higher-resolution data.
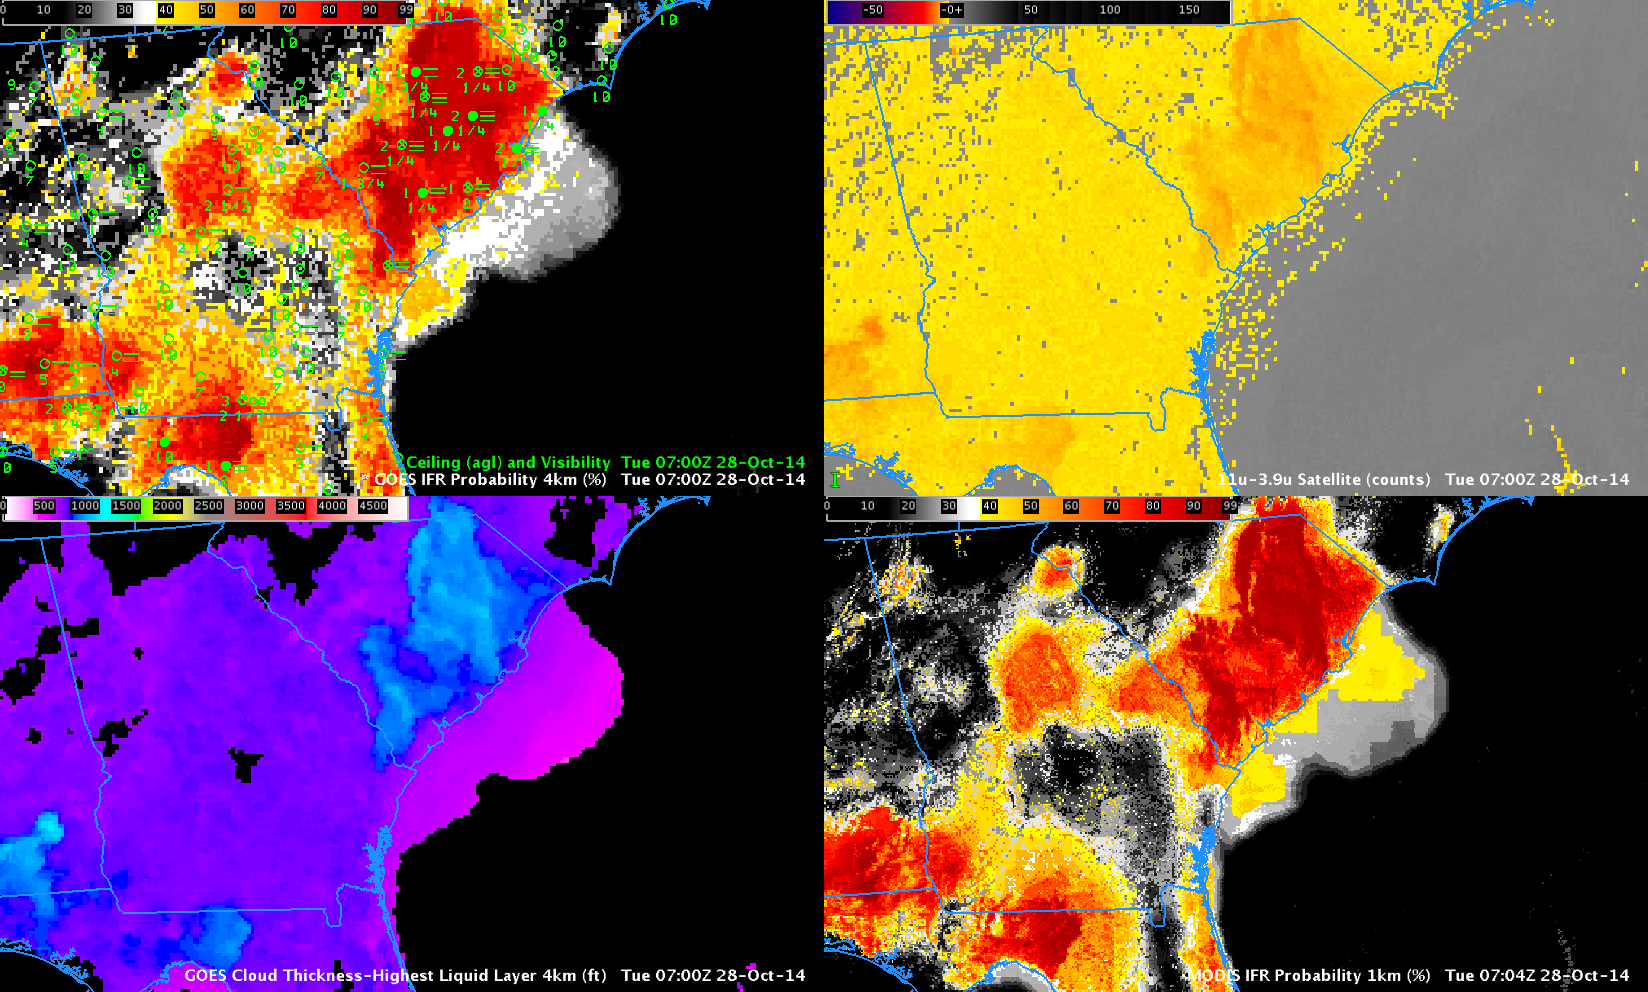
As above, but at 0700 UTC (Click to enlarge)
Suomi NPP overflew the southeast in the early morning as well. The toggle below of the Day Night Band and the Brightness Temperature Difference shows two things plainly: The near-New Moon has not yet risen and lunar illumination is missing; therefore, only Earth-glow and City Lights are providing light, and clouds are very difficult to detect. As with GOES data, the Suomi NPP Brightness Temperature Difference field overpredicts where low clouds and fog and creating IFR conditions.
As above, but at 0647 UTC, with Suomi NPP Brightness Temperature Difference (11.45µm – 3.74µm) and Day Night Band imagery in the bottom right (Click to enlarge)
GOES-R Cloud Thickness Fields can be used to predict when fog will burn off (Using this scatterplot as a first guess). The image below is the last pre-sunrise GOES-R Cloud Thickness field over the Southeast. The Thickest clouds are over east-central Mississippi and central North Carolina, so that is where fog should linger the longest. The short animation, at bottom, showing the 1415 and 1515 UTC shows that to be the case. Note that fog/low clouds over Mississippi are moving eastward and lingering, perhaps because the high clouds above them are reducing insolation.
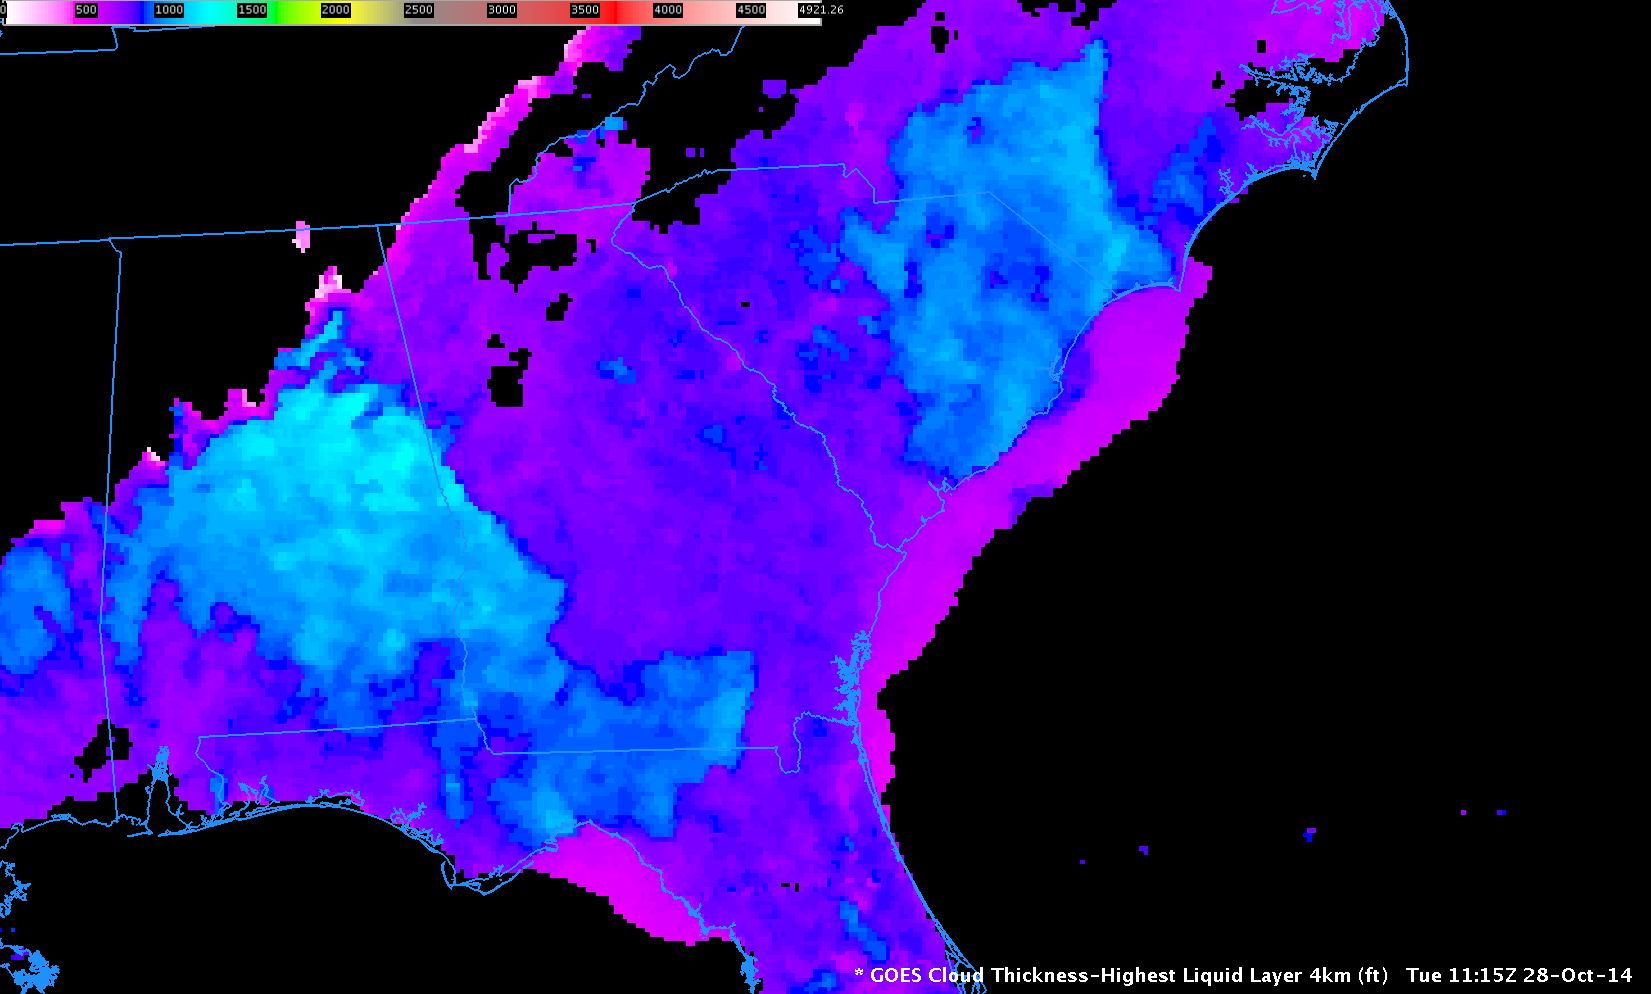
GOES-R Cloud Thickness, 1115 UTC on 28 October 2014 (Click to enlarge)
GOES-13 Visible Imagery, 1415 and 1515 UTC, 28 October 2014 (Click to enlarge)