Category Archives: Day/Night Band

Benefits of Resolution with a Polar-orbiting satellite

US_11-3_GOES_IFR_201401516_0630toggle

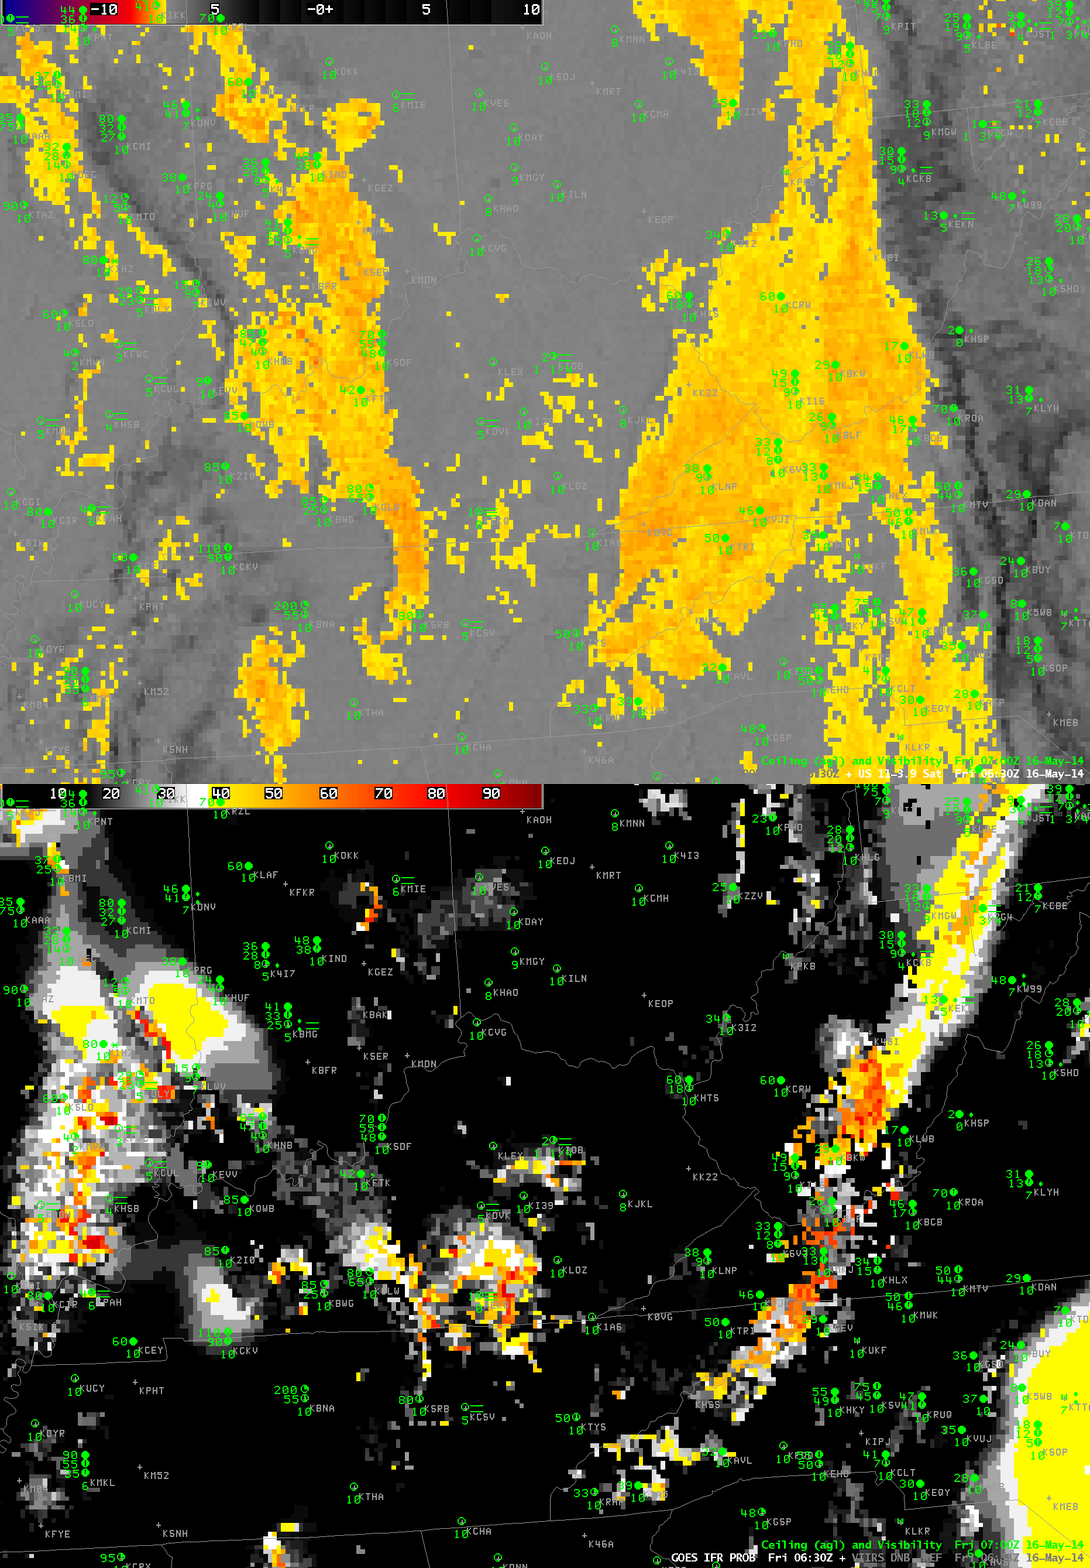
Toggle between GOES-13 Brightness Temperature Difference (10.7µm – 3.9µm) and GOES-R IFR Probability over Kentucky and surrounding states. Surface observations of ceiling heights and visibility are included, 0630 UTC 16 May 2014 (Click to enlarge)

The toggle above highlights a strength of the GOES-R IFR Probability fields compared to the GOES Brightness Temperature Difference when it comes to detecting low fog/stratus. The Brightness Temperature Difference field only sees the top of the cloud. In the toggle above, the region of elevated stratus, the stratus over western Virginia and western West Virginia is highlighted, but those clouds are unimportant for aviation/transportation, and IFR Probability fields ignore that region (save for the spine of the Appalachians where the mountains are rising up into the clouds, so ceilings are near the surface).

There are heightened IFR Probabilities in/around KEKQ (Monticello, Kentucky) at 0630 UTC: what is the character of that fog? It’s difficult to tell with the coarse GOES resolution (although someone familiar with the topography of eastern Kentucky might guess).

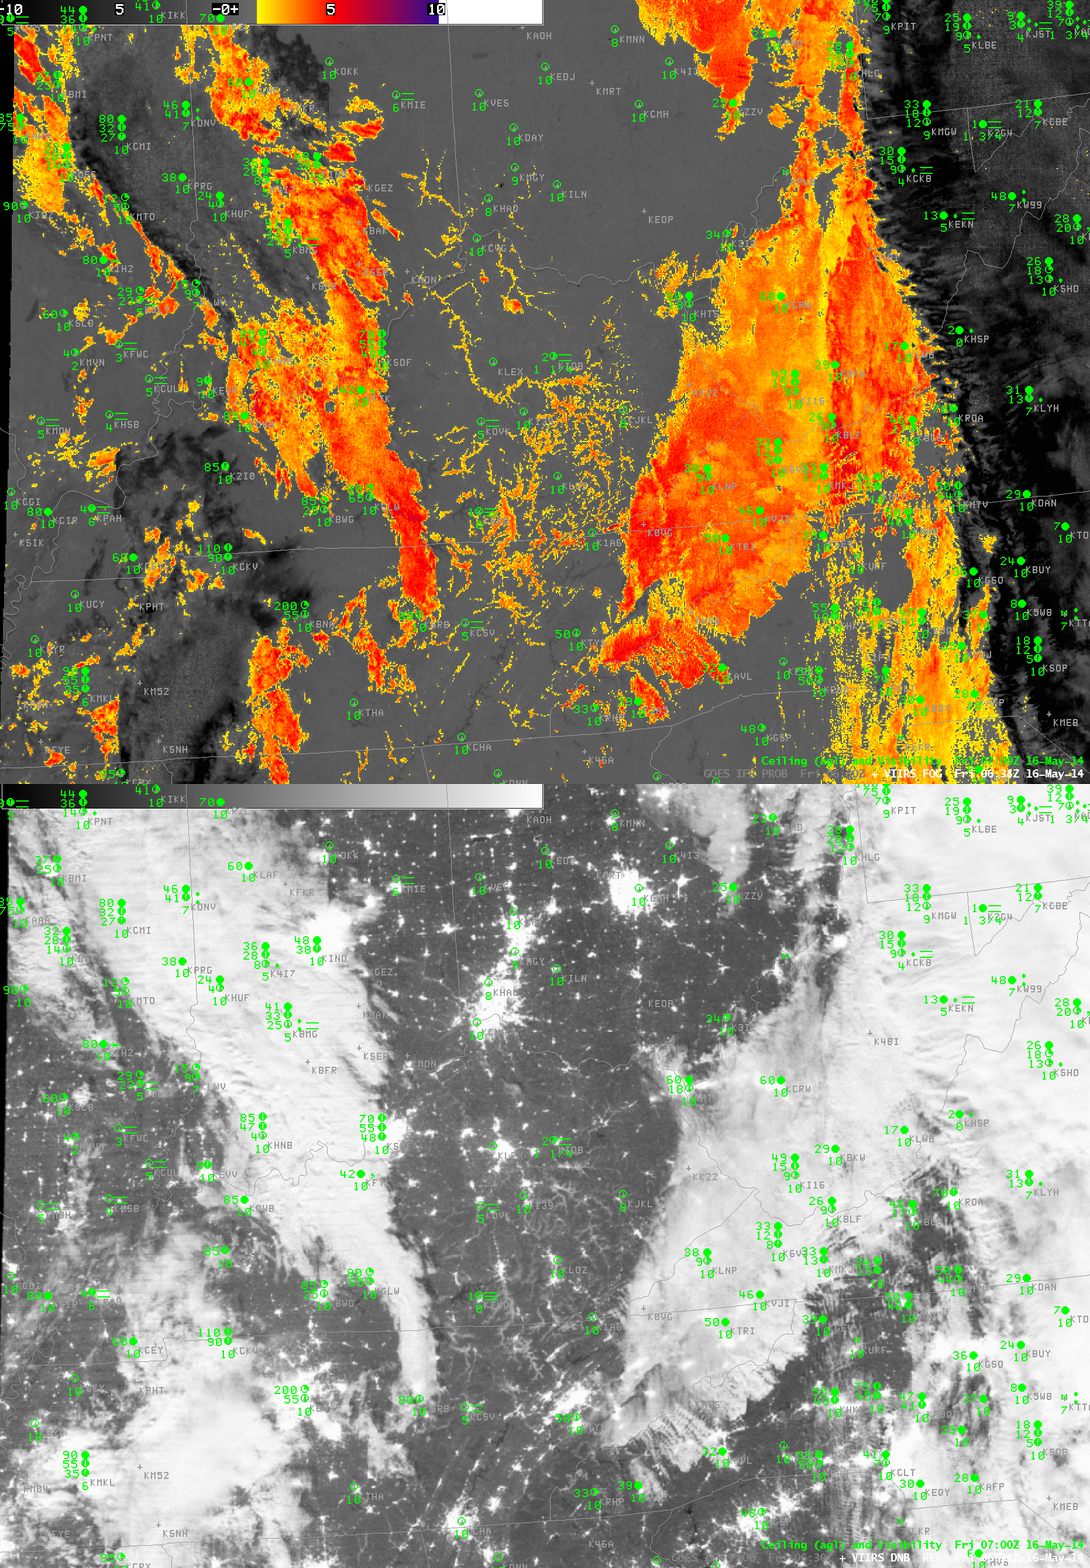
The imagery below toggle between the high-resolution (1-km) Suomi/NPP VIIRS Brightness Temperature Difference (11µm – 3.74µm) and the Day/Night Band at 0638 UTC. The higher resolution imagery allows the dendritic nature of the valley fog to appear in a way that is impossible with the coarser-resolution GOES data. Fog is initially developing in river valleys. Both the Brightness Temperature Difference and Day/Night imagery, however, are seeing only the top of the cloud and are not giving information about the likelihood of fog. But the cloud structure would alert a forecaster to the probability of developing fog (as does the time trend in the GOES-R IFR Probability fields).

Note how the cirrus shield east of the Appalachians shows up distinctly in both GOES and VIIRS brightness temperature difference fields. High clouds such as those prevent the satellite detection of fog/stratus at low levels. In those cases, only the IFR Probability field has a chance to detect fog if it is present.

VIIRS_DNB_FOG_20140516_0638toggle

Suomi/NPP Brightness Temperature Difference (11.0µm – 3.74µm) and Day/Night Band from VIIRS, 0638 UTC 16 MAy 2014 (Click to enlarge)

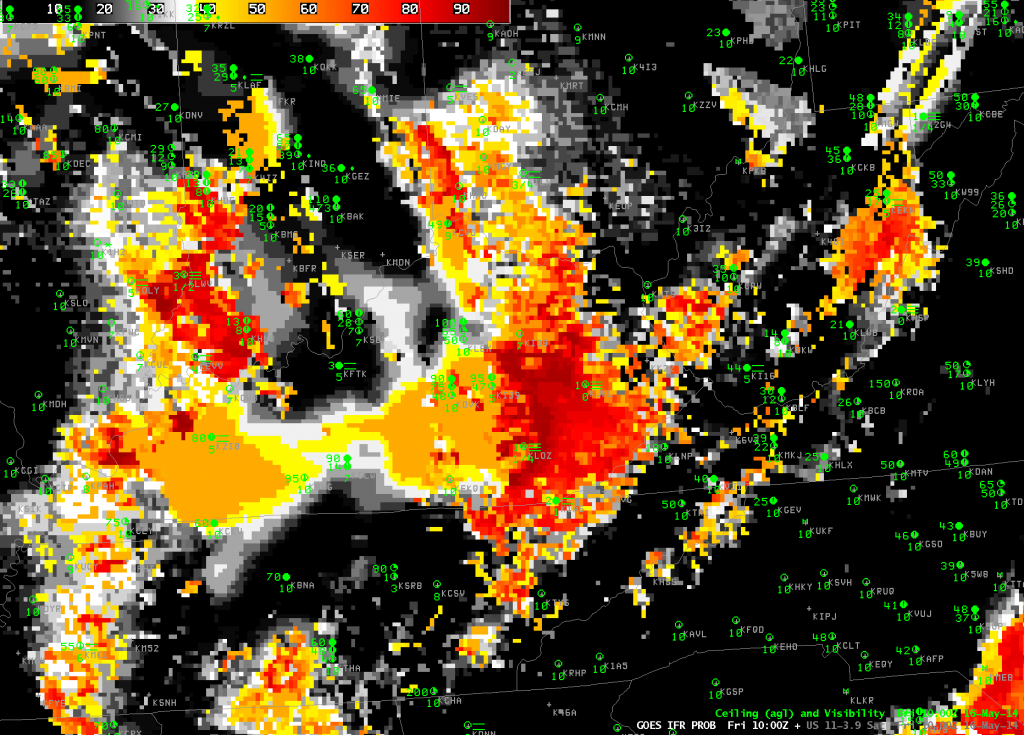
By 1000 UTC, the fog that was initially confined to river valleys over central Kentucky has expanded. In this case, Suomi/NPP data (or the trending of the GOES data) gives a forecaster a heads up on the development of overnight fog.

GOES_IFR_PROB_20140516_1000

GOES-R IFR Probability over Kentucky and surrounding states. Surface observations of ceiling heights and visibility are included, 1000 UTC 16 May 2014 (Click to enlarge)

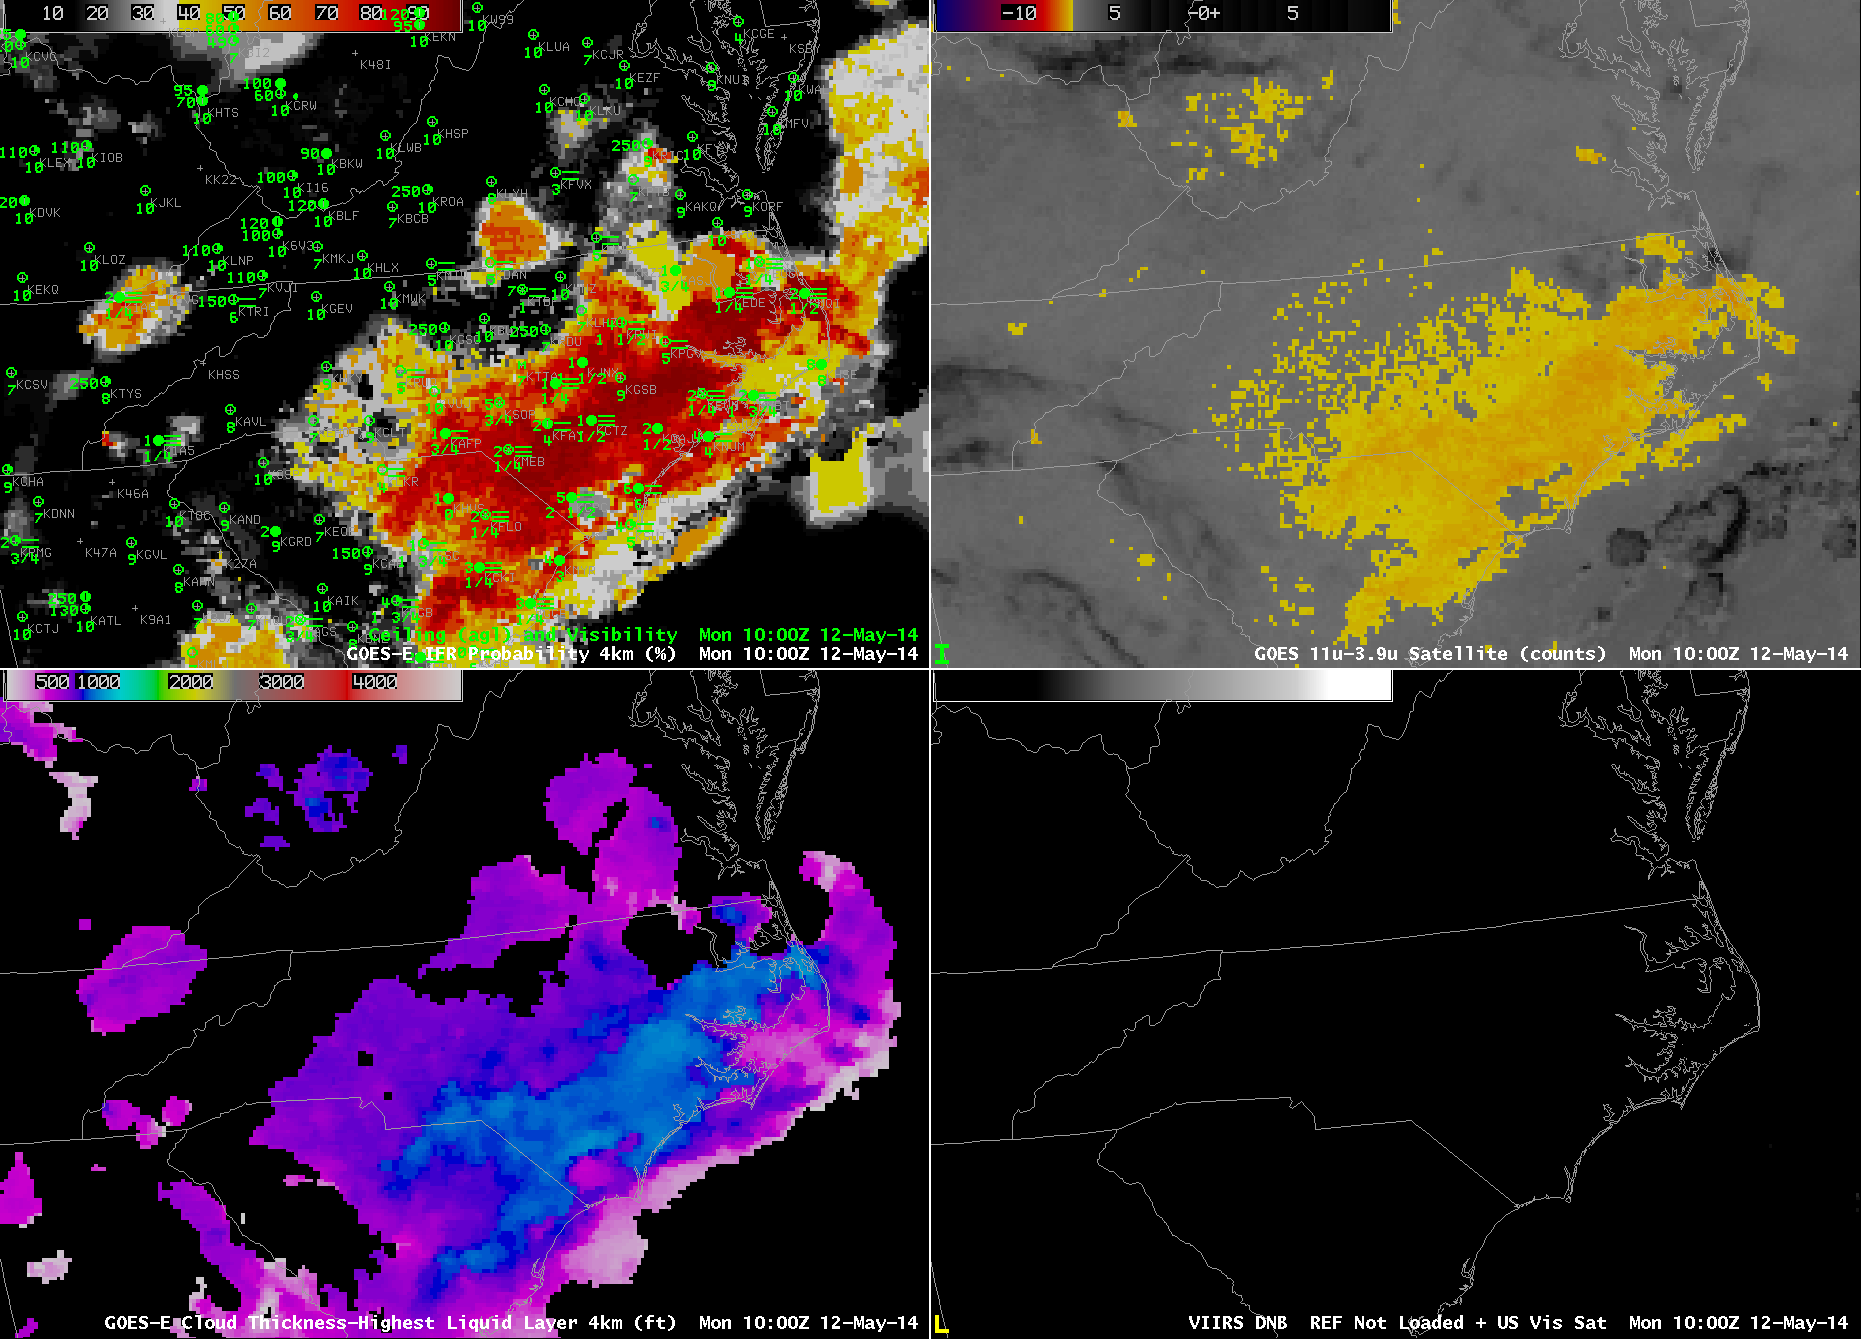
Radiation fog over coastal North Carolina

GOES_IFR_PROB_20140512_1000

GOES-R IFR Probabilities with observations of ceilings/visibilities (Upper Left), GOES-East Brightness Temperature Difference (10.7µm – 3.9µm) (Upper Right), GOES-R Cloud Thickness (Lower Left), Suomi/NPP VIIRS Day/Night Band (0.70 µm, at night) or GOES-East Visible imagery (0.63 µm, during day), Times as indicated (Click to enlarge)

Clear skies allowed for radiation fog with IFR conditions to develop over eastern North Carolina overnight. GOES-R Cloud Thickness as observed at the last time before twilight conditions begin — in this case at 1000 UTC (6 AM EDT) — can be used as a predictor for fog dissipation time using this chart. At 1000 UTC, maximum cloud thickness was 1000 feet, which suggests a dissipation time around 1300-1330 UTC.

The visible animation, below, is in agreement with the prediction from the cloud thickness field.

GOES13_VIS_NC_loop_12MAY2014

GOES-East Visible Imagery (0.62 µm) Times as indicated (Click to enlarge)

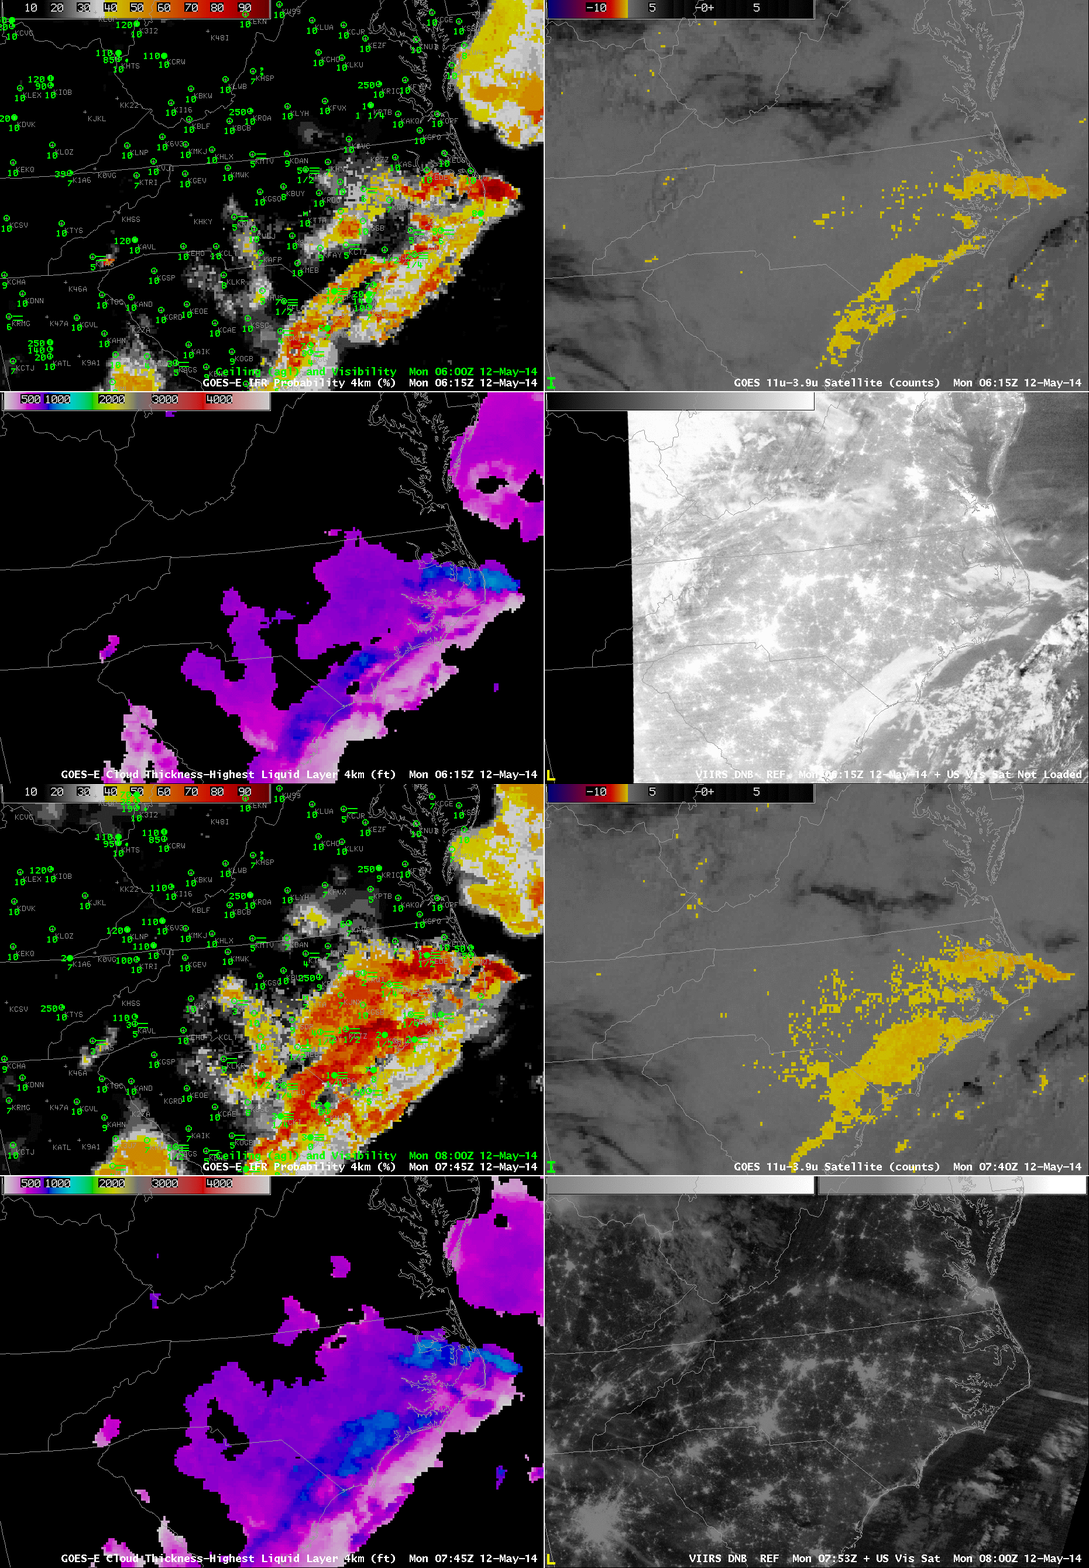
A toggle of two images with Day/Night band imagery, below, shows the difficulty in using the Day/Night band to identify regions of fog/low clouds consistently. In the 0615 UTC image, the developing low clouds show up well (Of course, it’s hard to tell if the clouds are low stratus or mid-level stratus), but the picture at 0745 UTC is a lot less distinct.

GOES_IFR_PROB_20140512_toggle_0615_0745

GOES-R IFR Probabilities with observations of ceilings/visibilities (Upper Left), GOES-East Brightness Temperature Difference (10.7µm – 3.9µm) (Upper Right), GOES-R Cloud Thickness (Lower Left), Suomi/NPP VIIRS Day/Night Band (0.70 µm), Times as indicated (Click to enlarge)

A toggle of two images with Day/Night band imagery, below, shows the difficulty in using the Day/Night band to identify regions of fog/low clouds consistently. In the 0615 UTC image, the developing low clouds show up well (Of course, it’s hard to tell if the clouds are low stratus or mid-level stratus), but the picture at 0745 UTC is a lot less distinct.

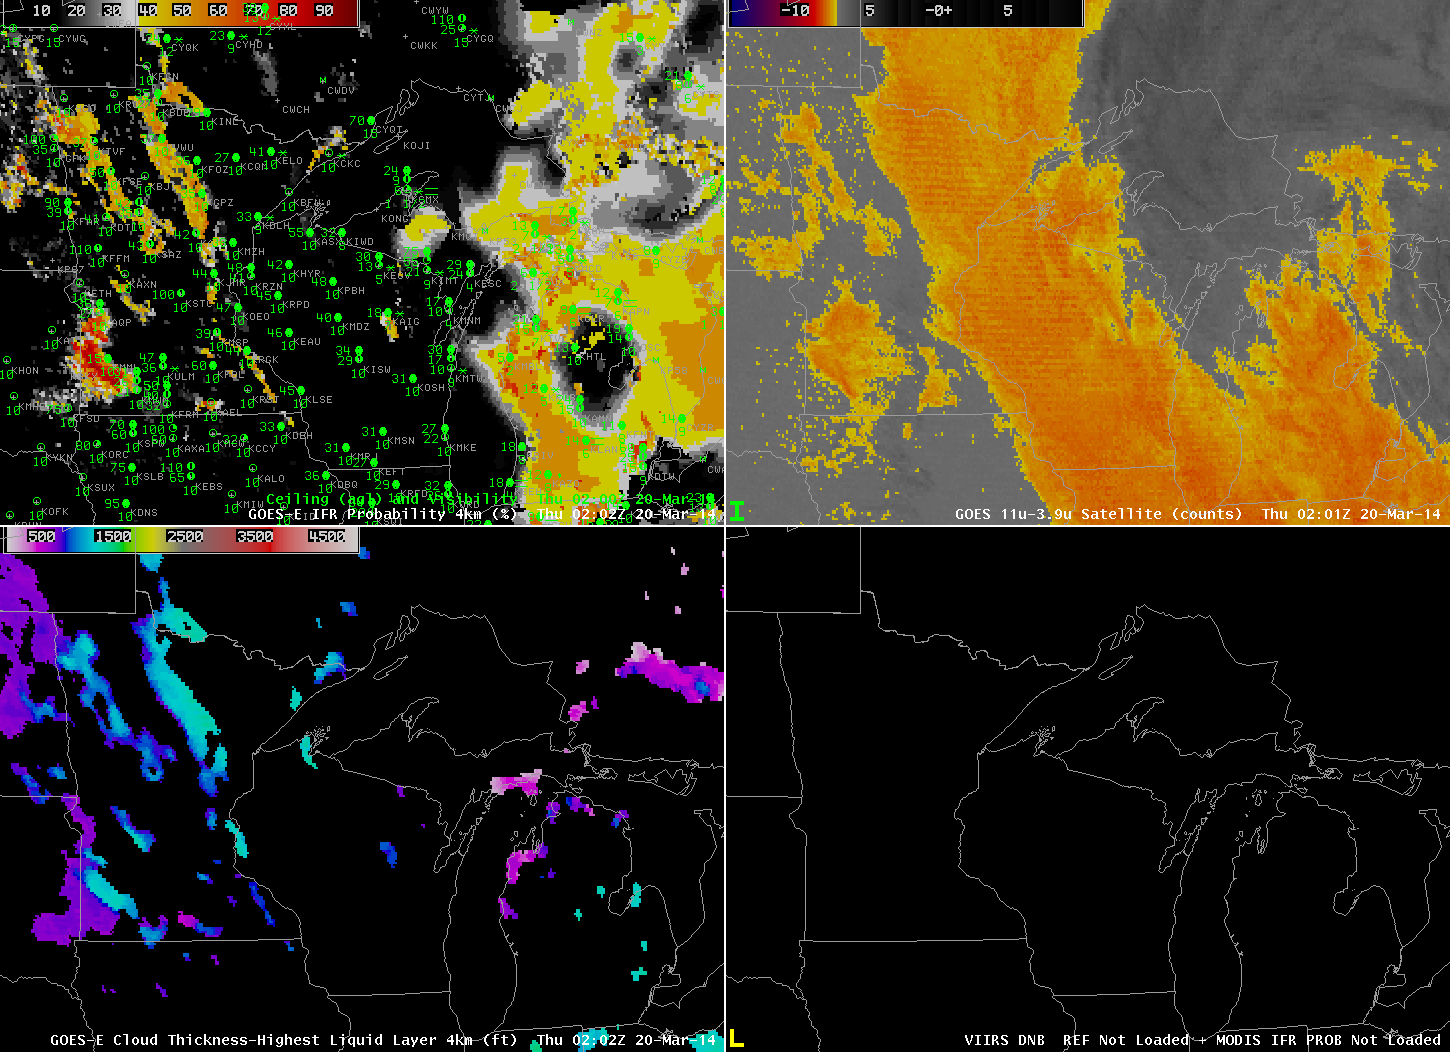
Stratus vs. Fog in the upper Midwest

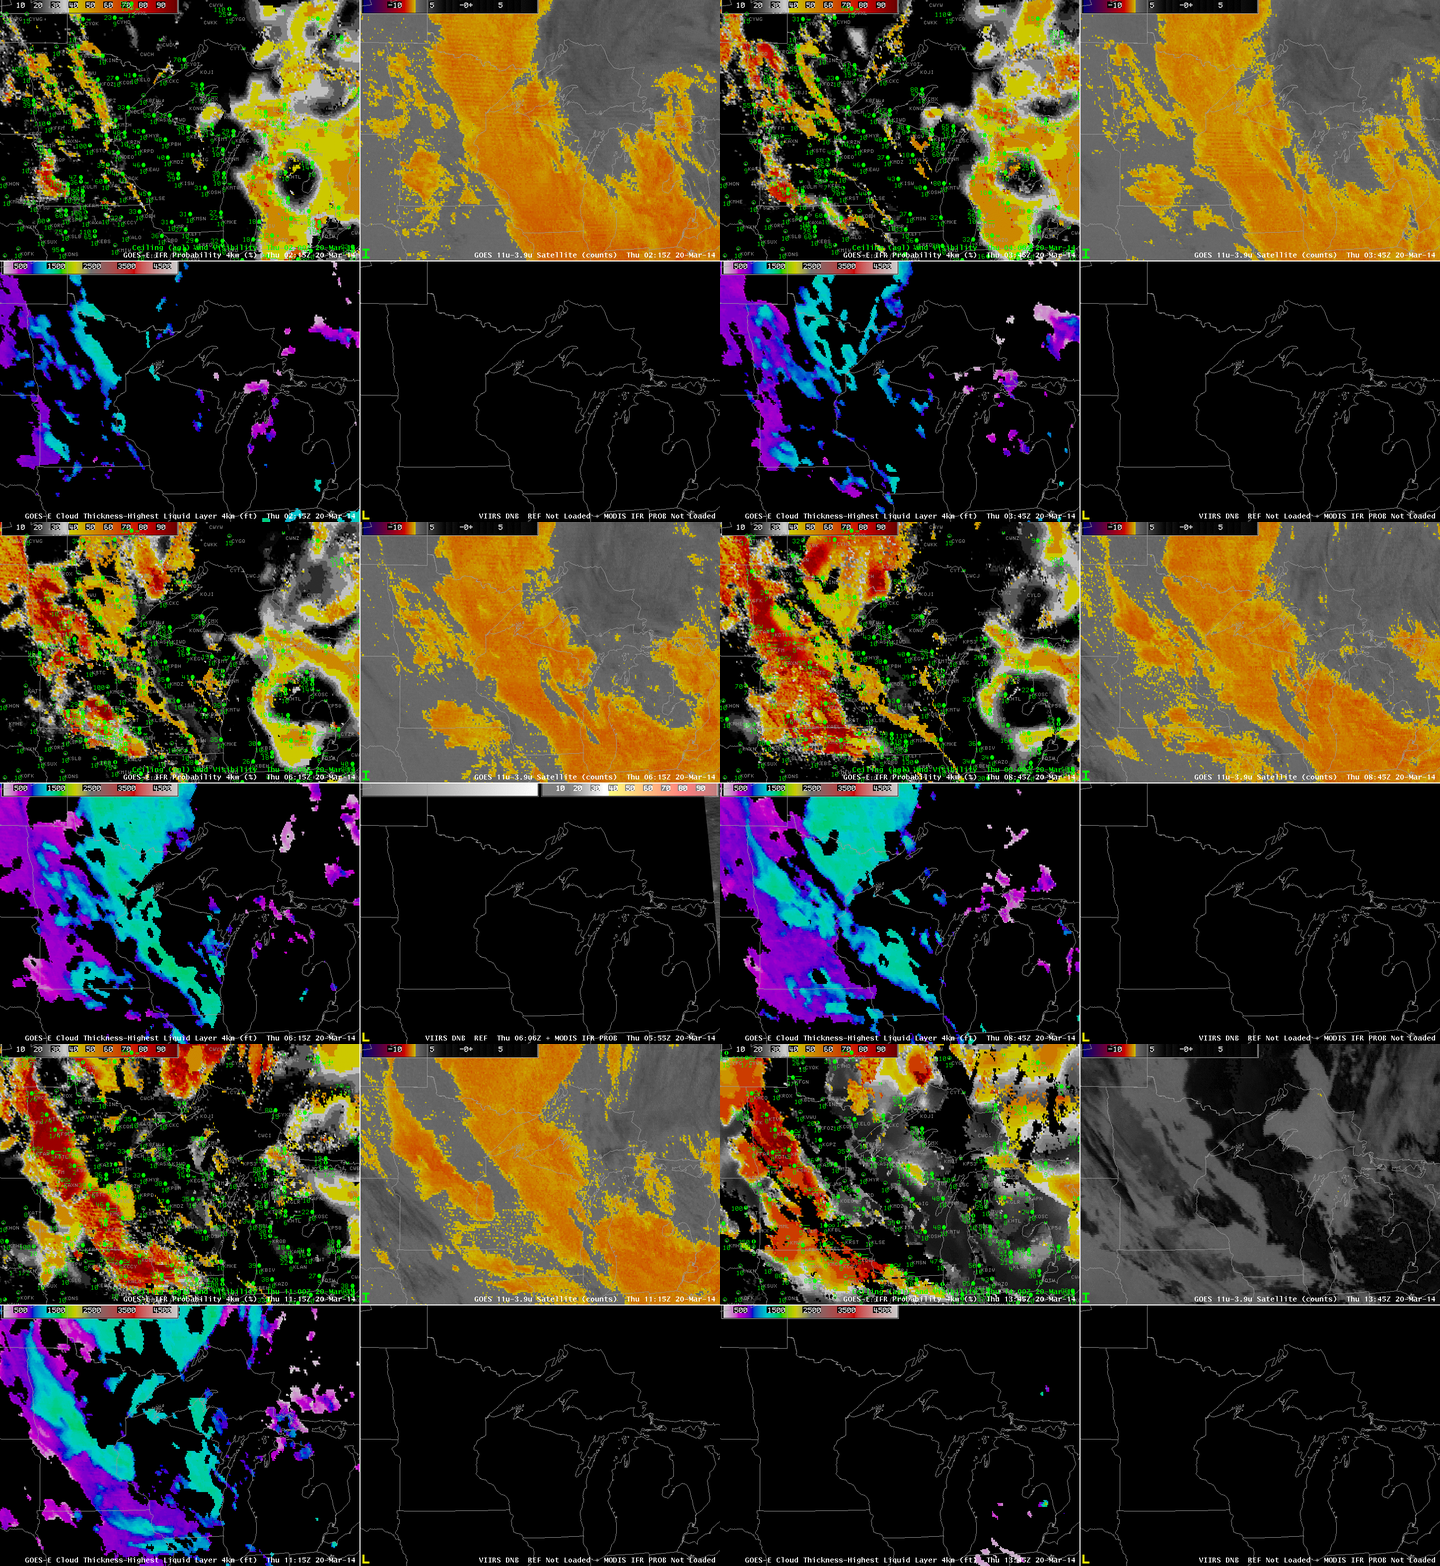
GOES_IFR_PROB_20140320_0202

GOES-R IFR Probabilities computed from GOES-13 (Upper Left), GOES-East Brightness Temperature Differences (10.7 µm – 3.9 µm) (Upper Right), GOES-R Cloud Thickness (Lower Left), Suomi-NPP Brightness Temperature (Lower Right), all near 0200 UTC on 20 March 2014 (click to enlarge)

Low clouds lingered over the upper midwest behind a departing low pressure system late on Wednesday the 19th. A strong signal was evident in the brightness temperature difference field from GOES-East, above, from 0200 UTC, extending northwest to southeast over eastern Minnesota into northern Indiana. Note, however, that ceilings in this region were indicative of mid-level stratus rather than fog. IFR Probabilities are correctly very small underneath this stratus.

GOES_IFR_PROB_20140320loop

GOES-R IFR Probabilities computed from GOES-13 (Upper Left), GOES-East Brightness Temperature Differences (10.7 µm – 3.9 µm) (Upper Right), GOES-R Cloud Thickness (Lower Left), MODIS-based IFR Probabilities and Suomi-NPP Day/Night Band (Lower Right), times as indicated (click to enlarge)

An animation of the fields, above, shows the development of a low IFR conditions over western Minnesota. The brightness temperature difference fields also show their development, and the combination of satellite predictors and model predictors lead to very high IFR Probabilities in that region, both in the GOES-based fields, shown half-hourly, and in the MODIS-based fields, shown when available.

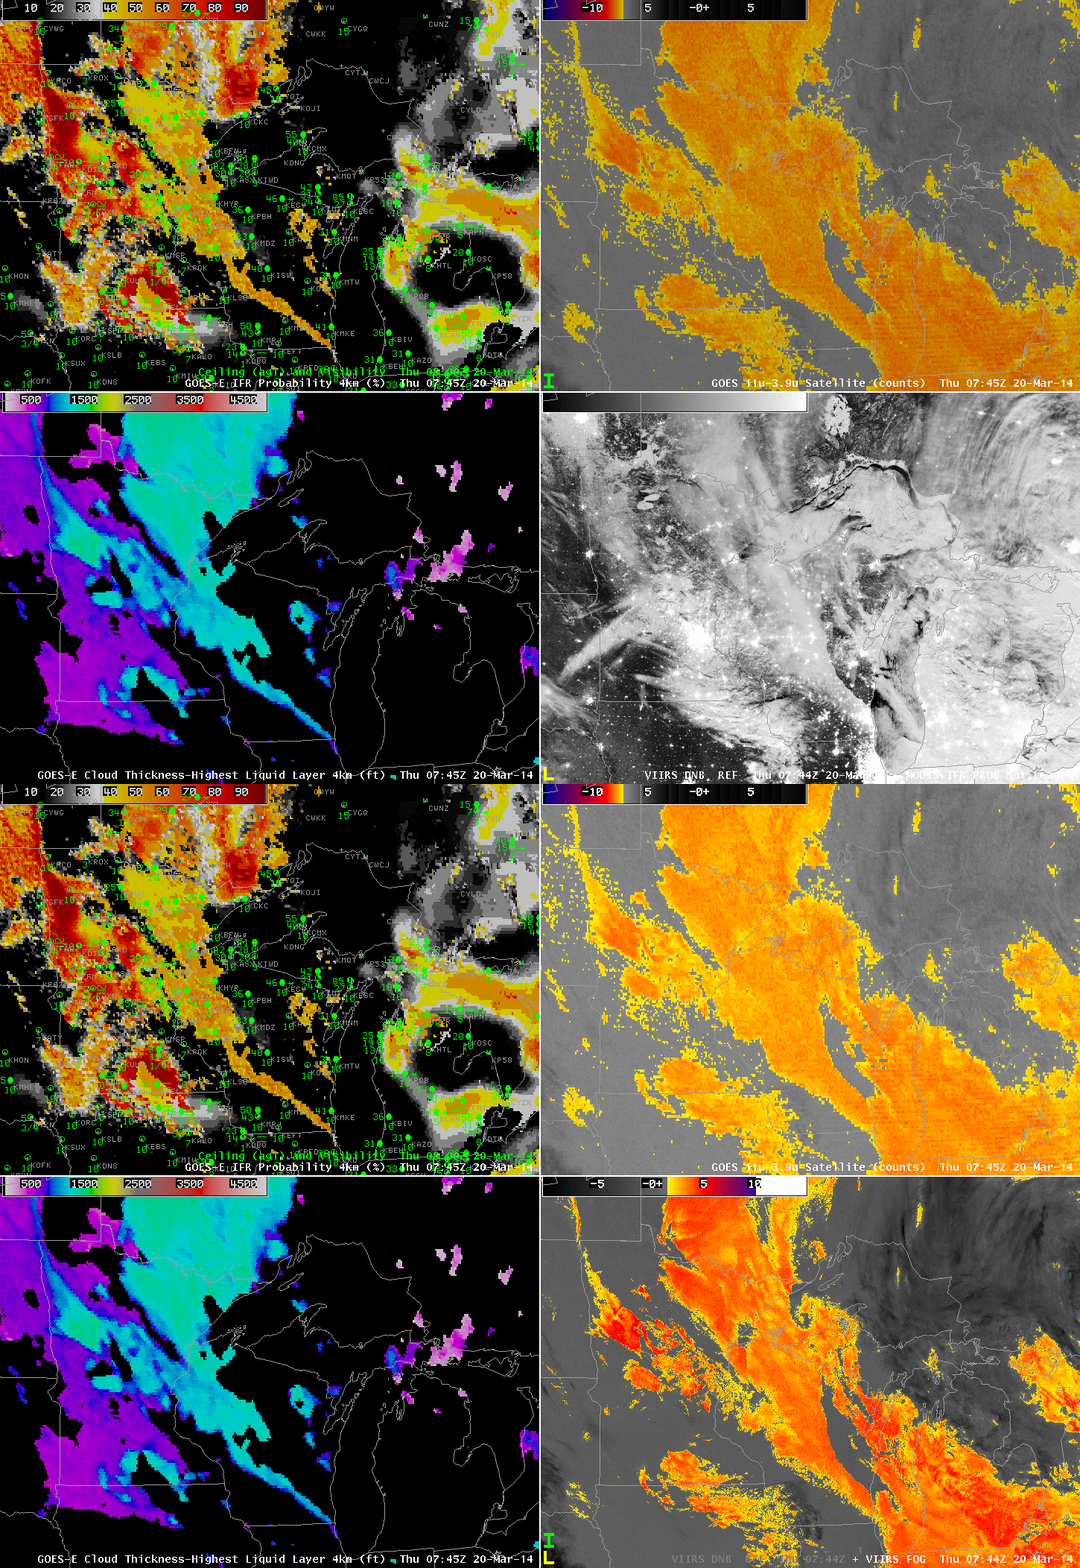
GOESVIIRS_FOG_20140320_0745

Suomi/NPP Day/Night band and brightness temperature difference field, 0744 UTC on 20 March 2014 (click to enlarge)

The near-full Moon provided ample illumination for the clouds, and the day/night band reveals the extensive cloud cover over the upper midwest, but as it only shows the top of the clouds, it is difficult to determine if visibility restrictions are also present. The Brightness temperature difference produce is also shown, which field is helpful in screening out snow cover and city lights.

Low clouds and Fog along the West Coast

Low clouds and fog developed along the west coast this morning. From the Monterey (CA) AFD:

FXUS66 KMTR 141143
AFDMTR

AREA FORECAST DISCUSSION
NATIONAL WEATHER SERVICE SAN FRANCISCO BAY AREA
443 AM PDT FRI MAR 14 2014

.SYNOPSIS…AFTER A BIT OF COOLING TODAY…A WARM AND DRY UPPER LEVEL
RIDGE OF HIGH PRESSURE WILL BUILD STRONGLY INTO THE WEST COAST
OVER THE WEEKEND. THIS WILL RESULT IN AFTERNOON TEMPERATURES
REACHING WELL ABOVE SEASONAL NORMS…AND POSSIBLY TO NEAR RECORD
LEVELS FOR THESE DATES. THIS WARM-UP WILL BE SHORT-LIVED HOWEVER…WITH
INCREASED ONSHORE FLOW AND A SIGNIFICANTLY COOLER AIR MASS MOVING
IN ALOFT THE FIRST PART OF NEXT WEEK. DRY CONDITIONS ARE EXPECTED
TO CONTINUE THROUGH MID WEEK…BUT THEN WITH UPPER LEVEL TROUGHING
AND A CHANCE OF RAIN FOR THE OUTER PORTION OF THE FORECAST PERIOD.

&&

.DISCUSSION…AS OF 4:10 AM PDT FRIDAY…THE DRY TAIL END OF A
WEATHER SYSTEM MOVING IN TO THE PACIFIC NORTHWEST IS APPROACHING
OUR DISTRICT…AND RESULTING IN ENHANCEMENT OF THE MARINE LAYER
AND A RETURN OF THE MARINE STRATUS. LATEST GOES FOG PRODUCT
IMAGERY…AND IN RATHER SPECTACULAR DETAIL JUST REC’D SUOMI VIIRS
NIGHTTIME HIGH RES VISUAL IMAGE…SHOW COVERAGE ALONG MUCH OF THE
COAST FROM PT REYES SOUTH TO THE VICINITY OF THE MONTEREY
PENINSULA…AND A BROAD SWATH EXTENDING INLAND ACROSS SAN
FRANCISCO AND THROUGH THE GOLDEN GATE TO THE EAST BAY. LATEST
BODEGA BAY AND FT ORD PROFILER DATA INDICATE A MARINE LAYER DEPTH
OF ABOUT 1300 FT. SOME THIN HIGH CLOUDS ARE ALSO PASSING THROUGH ABOVE.

NAM MODEL AND IN-HOUSE LOCAL WRF MODEL BOUNDARY LAYER RH OUTPUT
BOTH INDICATE STRATUS SHOULD GENERALLY CLEAR BY MIDDAY…EXCEPT
ALONG THE SAN MATEO COAST AND IN THE VICINITY OF THE MONTEREY
PENINSULA. EXPECT AFTERNOON HIGHS TO BE AROUND 3 TO 5 DEGS COOLER
THAN ON THURSDAY…BUT STILL WELL ABOVE SEASONAL NORMS ESPECIALLY
INLAND.

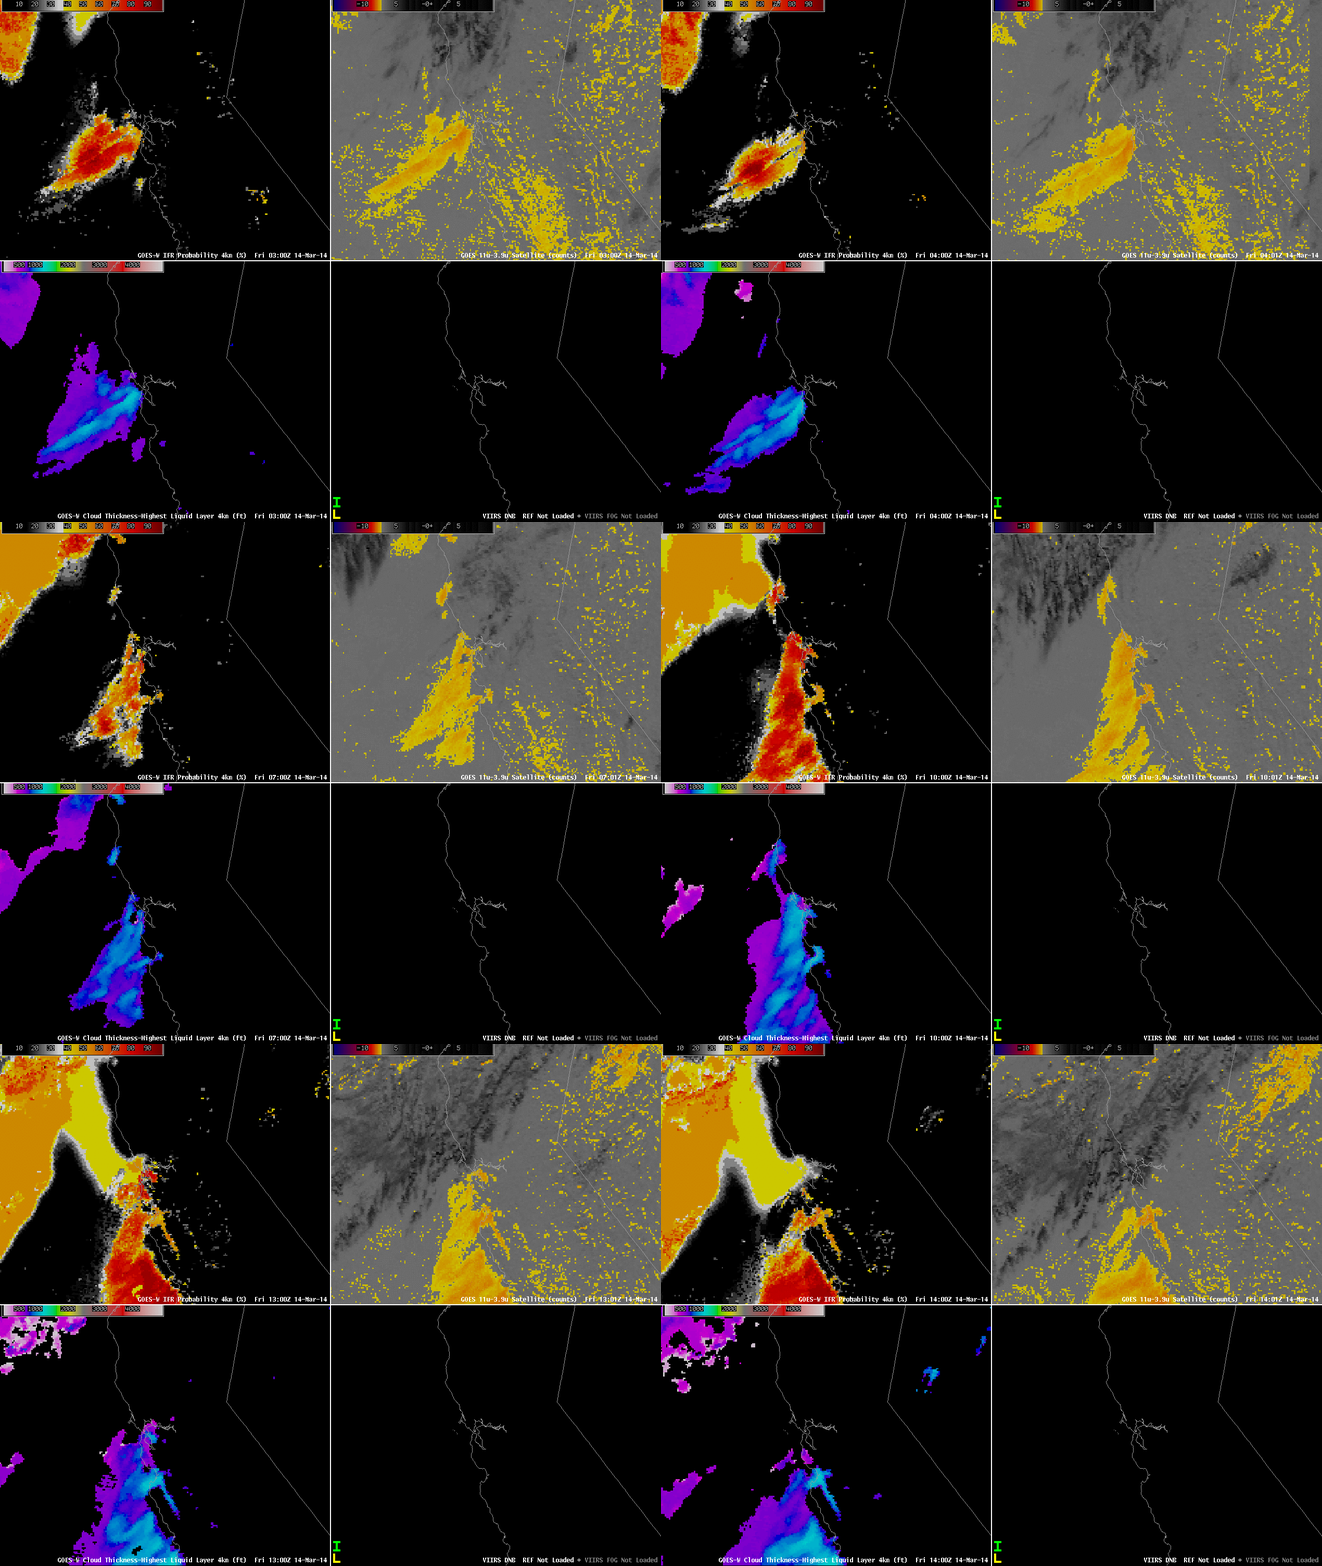
GOES_IFR_PROB_20140314loop

GOES-R IFR Probabilities computed from GOES-15 (Upper Left), GOES-West Brightness Temperature Differences (10.7 µm – 3.9 µm) (Upper Right), GOES-R Cloud Thickness (Lower Left), Suomi/NPP Day/Night Band (Lower Right), all hourly times as indicated (click to enlarge)

The animation of satellite and satellite-derived fields, above, shows how the GOES-R and GOES-West fields depicted the development of the low clouds. Note how the brightness temperature difference fields over CA and NV throughout the animation have a speckled appearance. These positive signals are due not to the presence of fog/low clouds but rather to differences in emissivity properties of the dry land. Near the end of the animation, high clouds are widespread over northern California. For such cases, the brightness temperature difference product provides little information about low-level clouds. However, the GOES-R IFR Probability field, because it blends together information from satellite and from Rapid Refresh does provide a signal under clouds. It is a much smoother signal because it does vary from one satellite pixel to the next, and the Probability values are smaller because satellite predictors cannot be used in the algorithm.

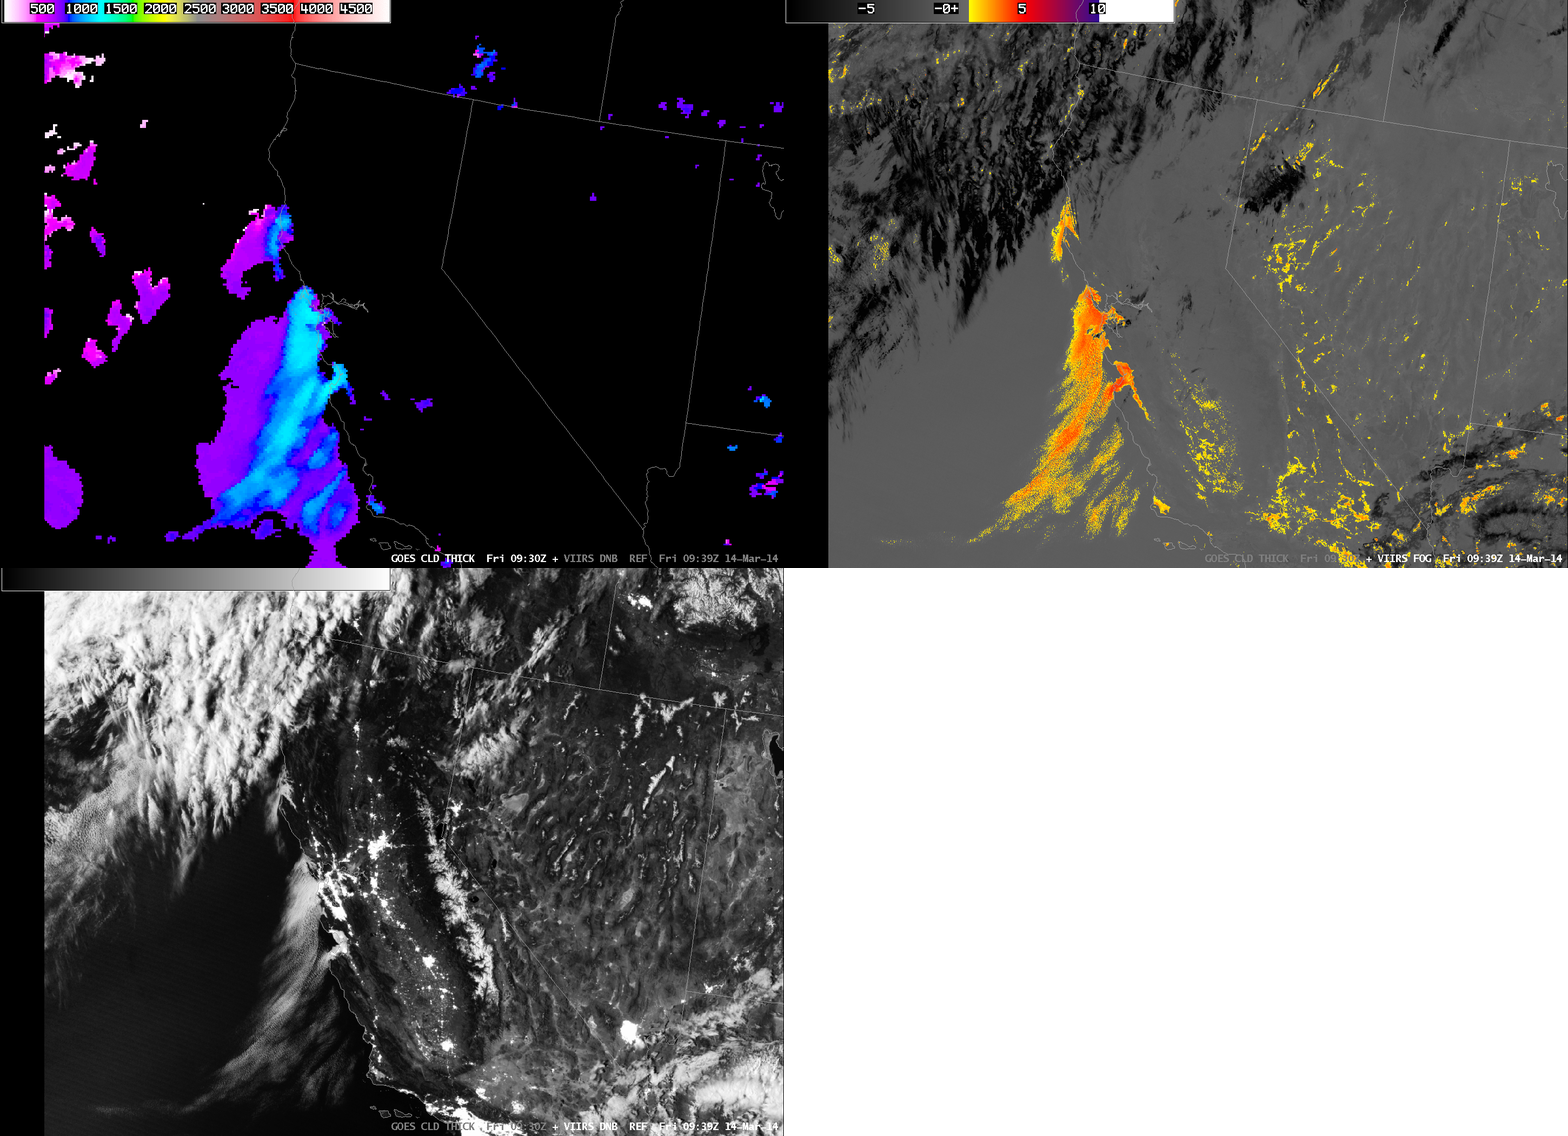
The AFD above notes the Day/Night band, and also the depth of the marine stratus. The toggle of Cloud Thickness, Day/Night Band, and brightness temperature difference, below (useful to distinguish white clouds from white city lights!), shows a nice overlap between the GOES-R product and the clouds detected at high resolution by Suomi/NPP. Cloud thickness is around 1150 feet at Bodega Bay, and closer to 1250 feet at Fort Ord, in good agreement with the profile data cited.

VIIRS_DNB__REF_GOES_CLD_THICK_20140314_09

Toggle of GOES-R Cloud Thickness, Suomi/NPP Brightness Temperature Difference and Day/Night Band (click to enlarge)

Sea fog over the western Gulf of Mexico

The National Weather Service in Houston/Galveston has issued Dense Fog advisories for Sea Fog in the easterly flow south of a cold front draped across the northern Gulf:

MARINE WEATHER STATEMENT
NATIONAL WEATHER SERVICE HOUSTON/GALVESTON TX
602 PM CST SUN FEB 23 2014

GMZ330-335-350-355-370-375-260000-
MATAGORDA BAY-GALVESTON BAY-
WATERS FROM FREEPORT TO THE MATAGORDA SHIP CHANNEL OUT 20 NM-
WATERS FROM HIGH ISLAND TO FREEPORT OUT 20 NM-
WATERS FROM FREEPORT TO THE MATAGORDA SHIP CHANNEL 20 NM TO 60 NM-
WATERS FROM HIGH ISLAND TO FREEPORT 20 TO 60 NM-
602 PM CST SUN FEB 23 2014

…DENSE SEA FOG POSSIBLE ACROSS THE AREA FOR THE NEXT SEVERAL DAYS…

AREAS OF SEA FOG…SOME DENSE WITH VISIBILITIES OF 1 NM OR LESS…WILL
CONTINUE TO BE POSSIBLE IN AND AROUND THE GALVESTON AND MATAGORDA BAY
AREAS ALONG WITH THE UPPER TEXAS COASTAL WATERS OUT TO APPROXIMATELY
20 NM. DENSE FOG ADVISORIES MIGHT BE NEEDED.

LITTLE CHANGE IN THIS PATTERN IS EXPECTED UNTIL THE PASSAGE OF THE NEXT
COLD FRONT SOME TIME AROUND LATE TUESDAY NIGHT OR EARLY WEDNESDAY
MORNING.

MARINERS SHOULD BE PREPARED FOR SUDDEN CHANGES IN VISIBILITY OVER SHORT
DISTANCES. REDUCE YOUR SPEED AND KEEP A LOOKOUT FOR OTHER VESSELS…BUOYS
AND BREAKWATERS. KEEP YOUR NAVIGATION LIGHTS ON. INEXPERIENCED MARINERS…
ESPECIALLY THOSE OPERATING SMALLER CRAFT OR NOT EQUIPPED WITH RADAR…SHOULD
CONSIDER SEEKING SAFE HARBOR.

$$

How does the GOES-R IFR Probability field handle this event?

GOES_IFR_PROB_20140224loop

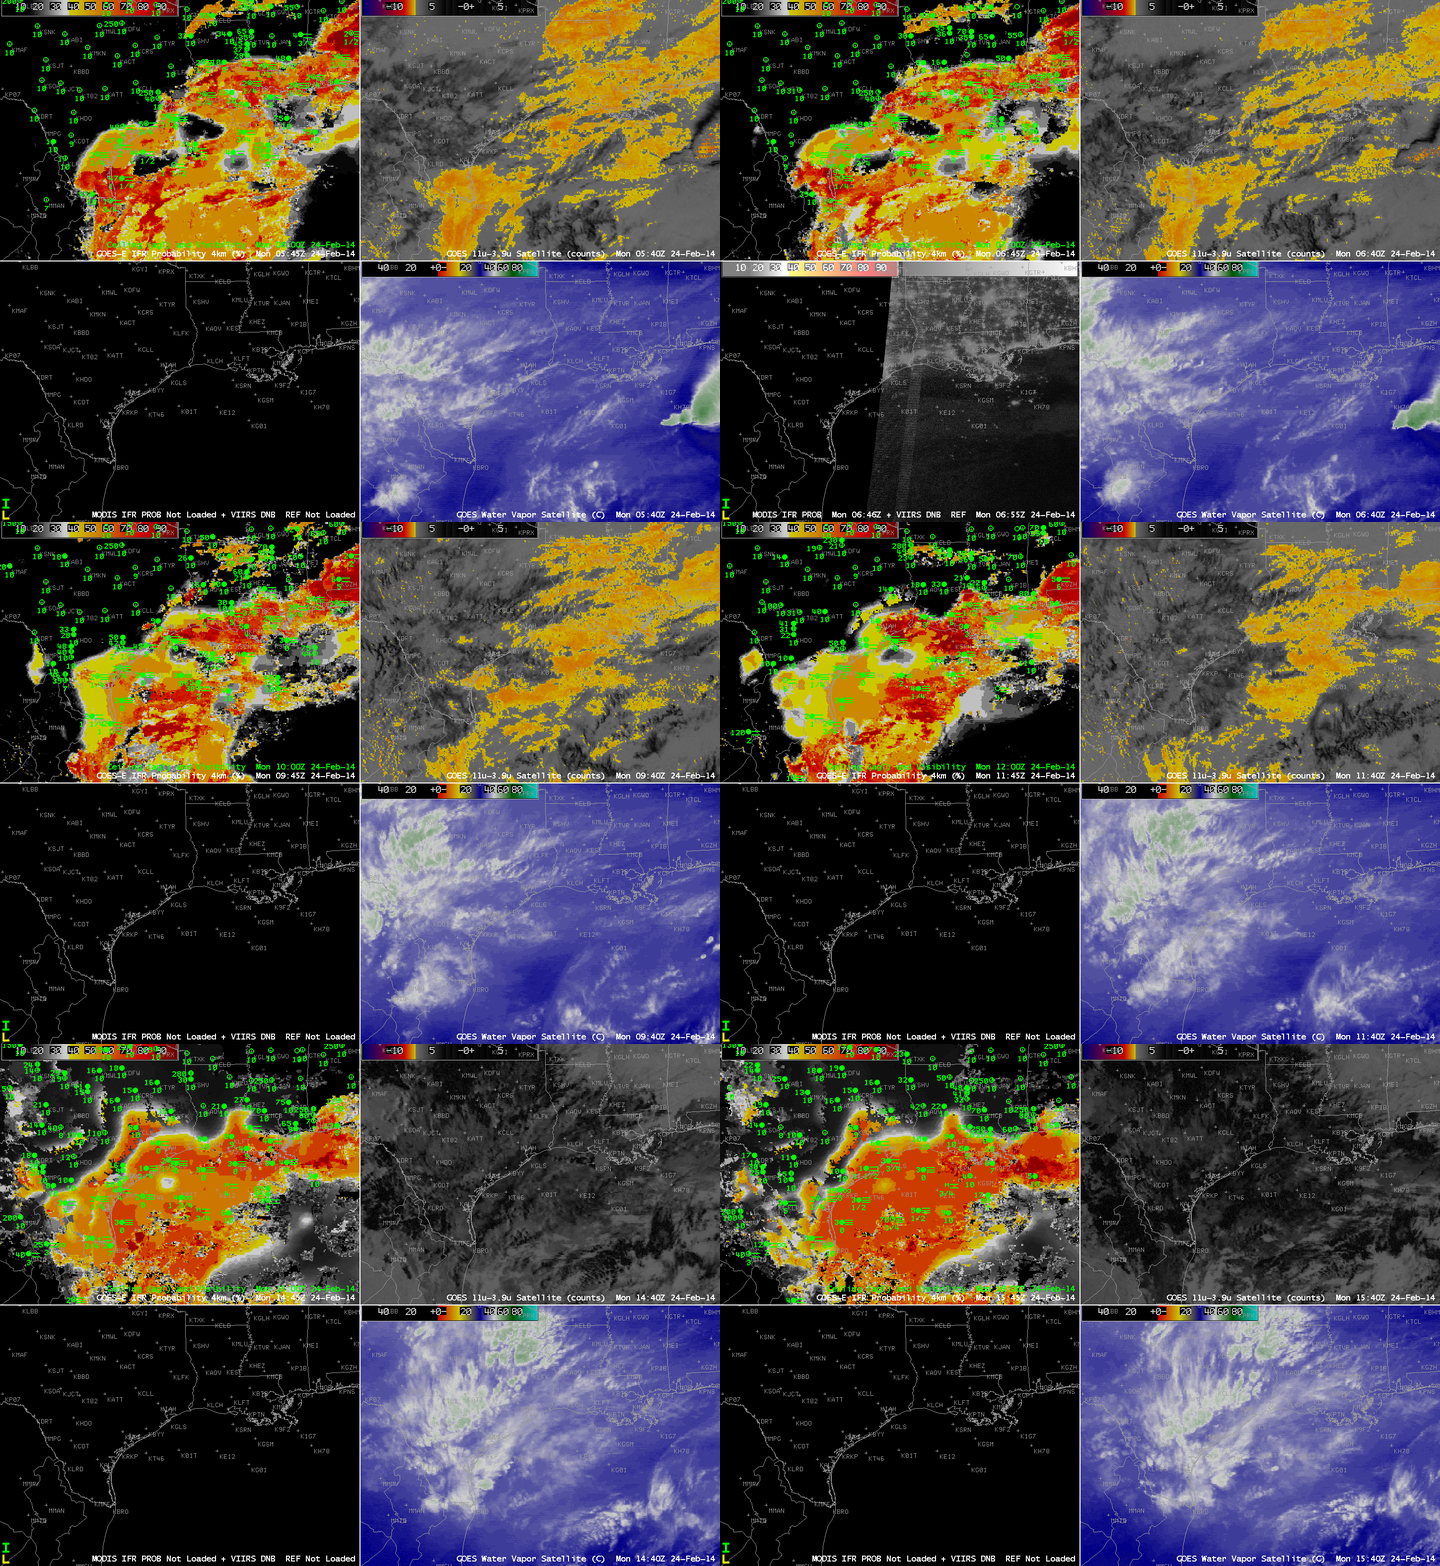
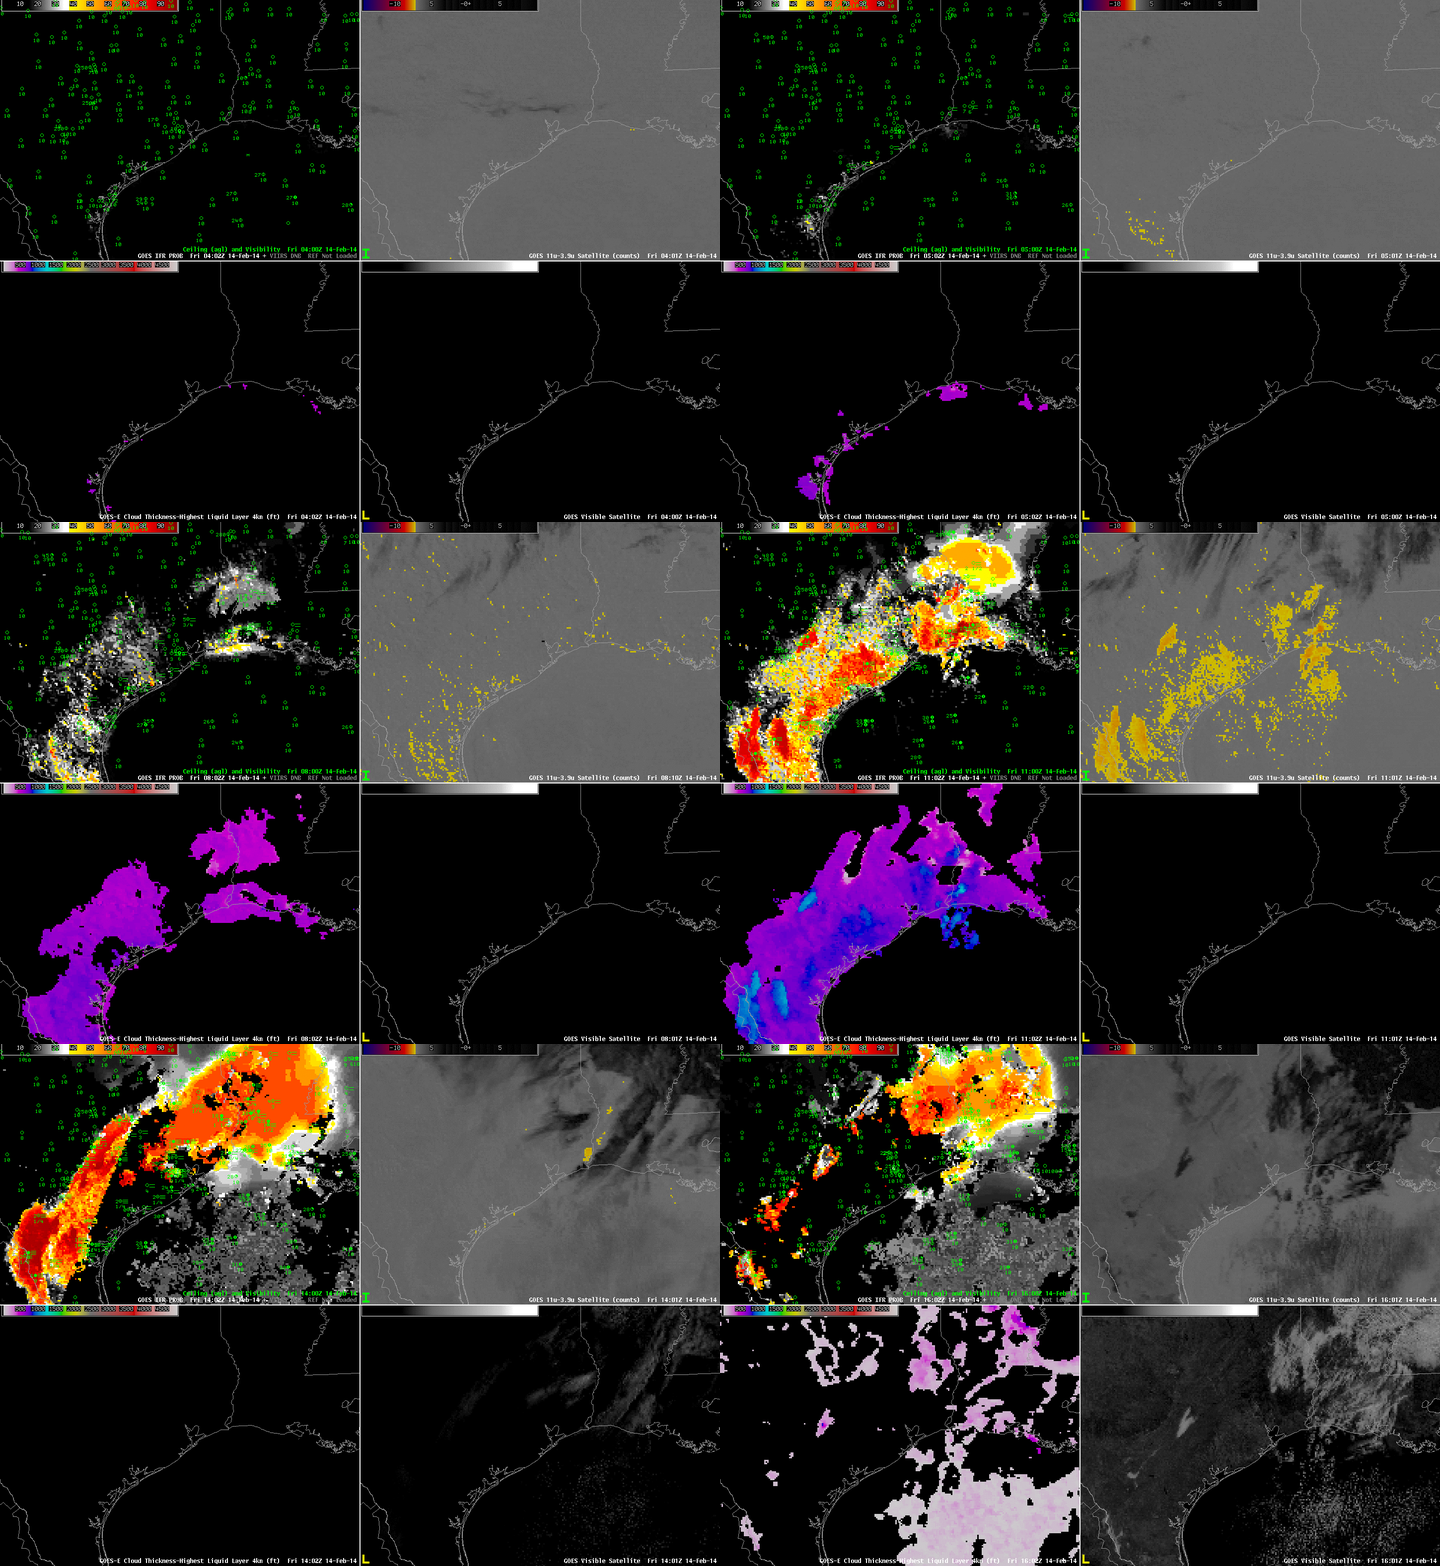
GOES-Based GOES-R IFR Probabilities (Upper Left), GOES-East Brightness Temperature Difference Fields (10.7 µm – 3.9 µm) (Upper Right), Suomi/NPP Day/Night band and MODIS-based IFR Probability fields (Lower Left), GOES-East Water Vapor Imagery (6.7 µm)(Lower Right), hourly from 0400 UTC through 1600 UTC 14 February 2014 (click image to enlarge)

IFR Probabilities are correctly limited to coastal regions of east Texas, with high values off shore. The brightness temperature difference field has difficulty identifying regions of low clouds over the Gulf of Mexico because of southwesterly flow aloft that contains mid- and high-level cloudiness. The relatively flat field over the Gulf — large values, but little variability — correspond to regions where high clouds exist. These high clouds prevent satellite predictors from being used in the IFR Probability algorithm because the brightness temperature difference does not observe low clouds, so only the Rapid Refresh model output is used to compute the IFR Probability. Therefore the IFR Probability fields are a bit flatter. Where there are breaks in the high clouds, the brightness temperature difference field can be used in the IFR Probability algorithm, and the computed IFR Probability is larger. In addition, the character of the probability field is more pixelated like a satellite image.

The bottom left image in the 4-panel composite above includes both the Day/Night band from Suomi/NPP (an image that — because of scant lunar illumination — gives little distinct information about the clouds present) and a MODIS-based IFR Probability field. For selected still imagery of ~0830 UTC Suomi/NPP click here; click here for ~0730 UTC MODIS-based IFR probability.

IFR Probability Fields are an early-alert for Developing Fog

GOES_IFR_PROB_20140214loop

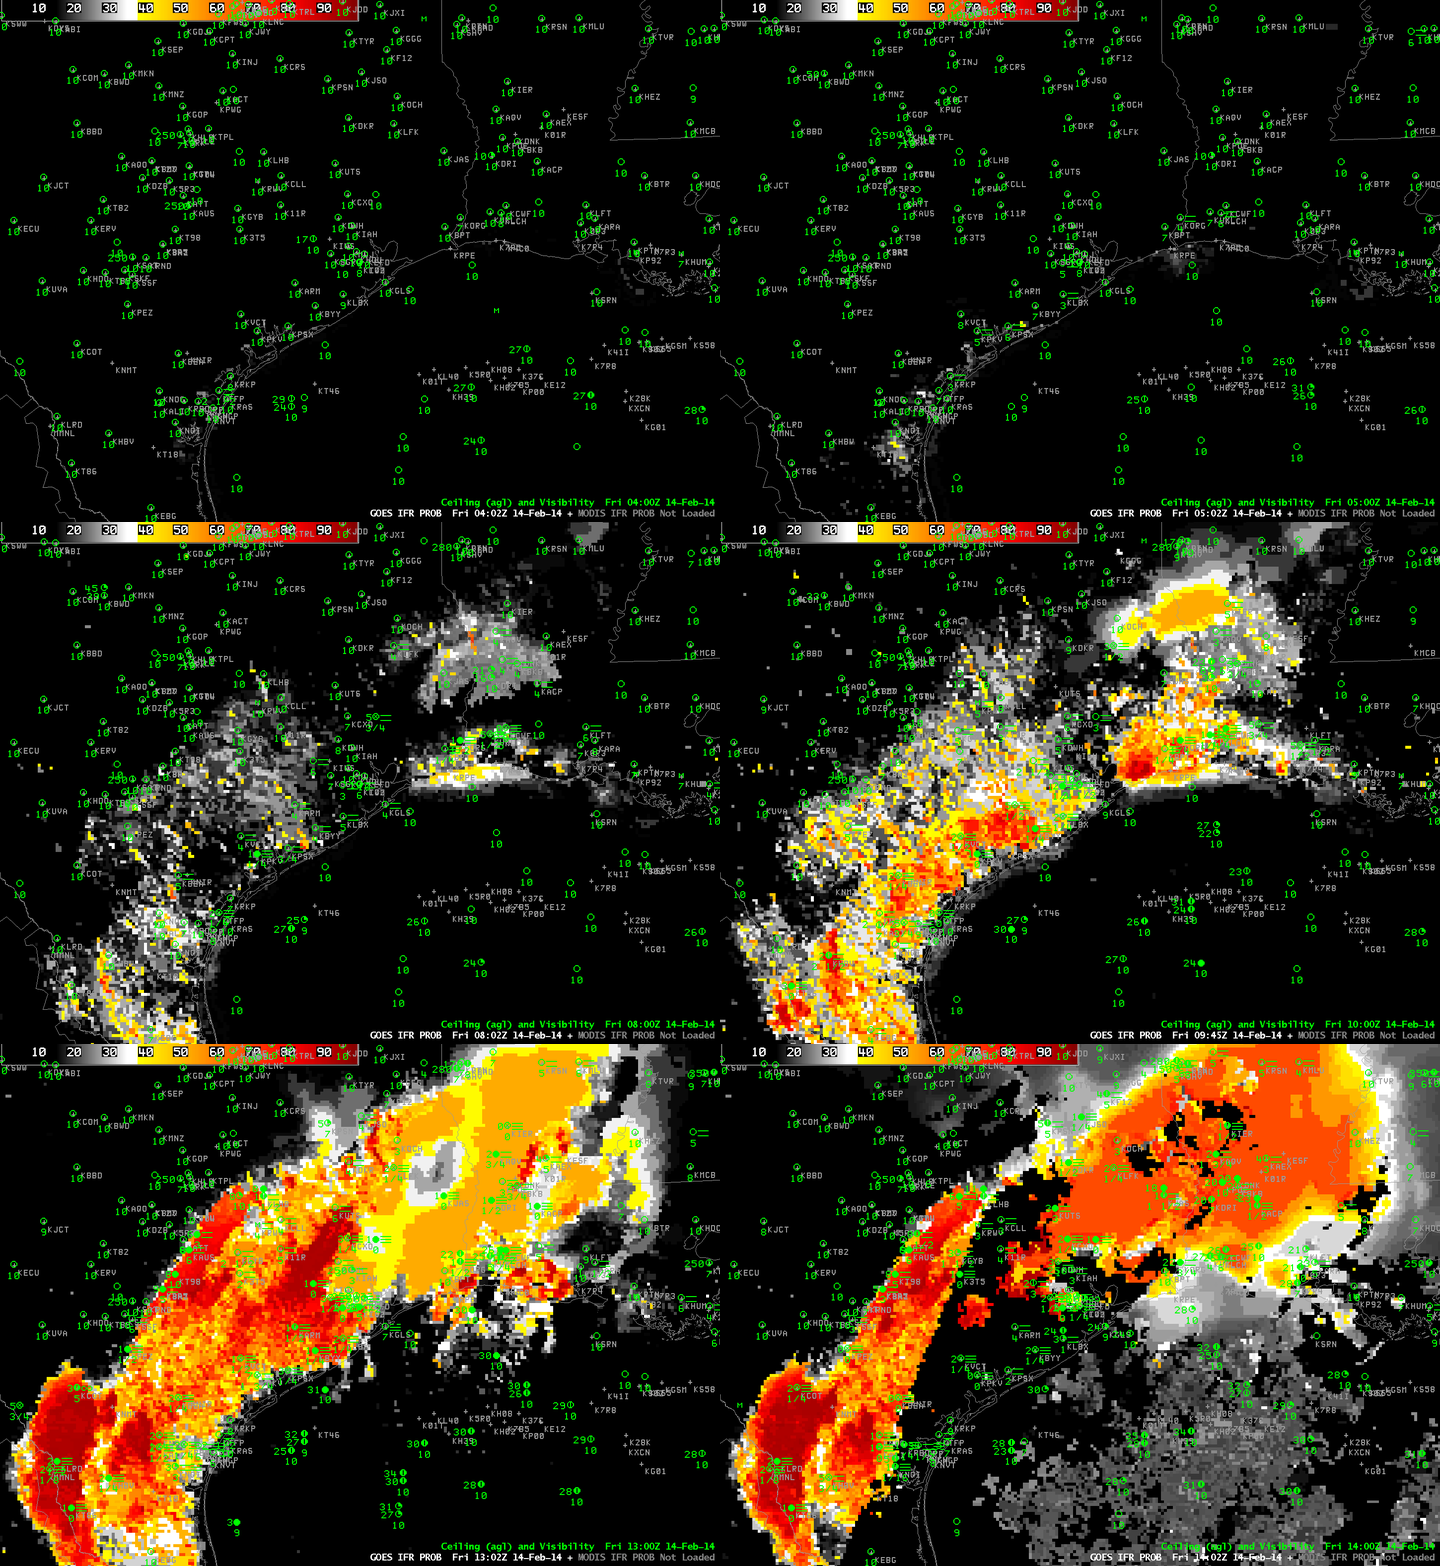
GOES-R IFR Probabilities from 0400 through 1400 UTC on 14 February 2014 (click image to enlarge)

Fog and Low clouds resulted in IFR conditions along a long swath of the western Gulf Coast today. IFR Probability fields warned of the development of these conditions long before a strong signal appeared in the traditional brightness temperature difference fields. The animation above, of hourly GOES-R IFR Probability fields (and surface observations of ceiling and visibility). There are indications by 0615 and 0702 that fog/low stratus is developing, and those indications are matched by some observations of IFR conditions. By 0915 UTC, widespread IFR conditions are present from southwest Louisiana southwestward through coastal Texas.

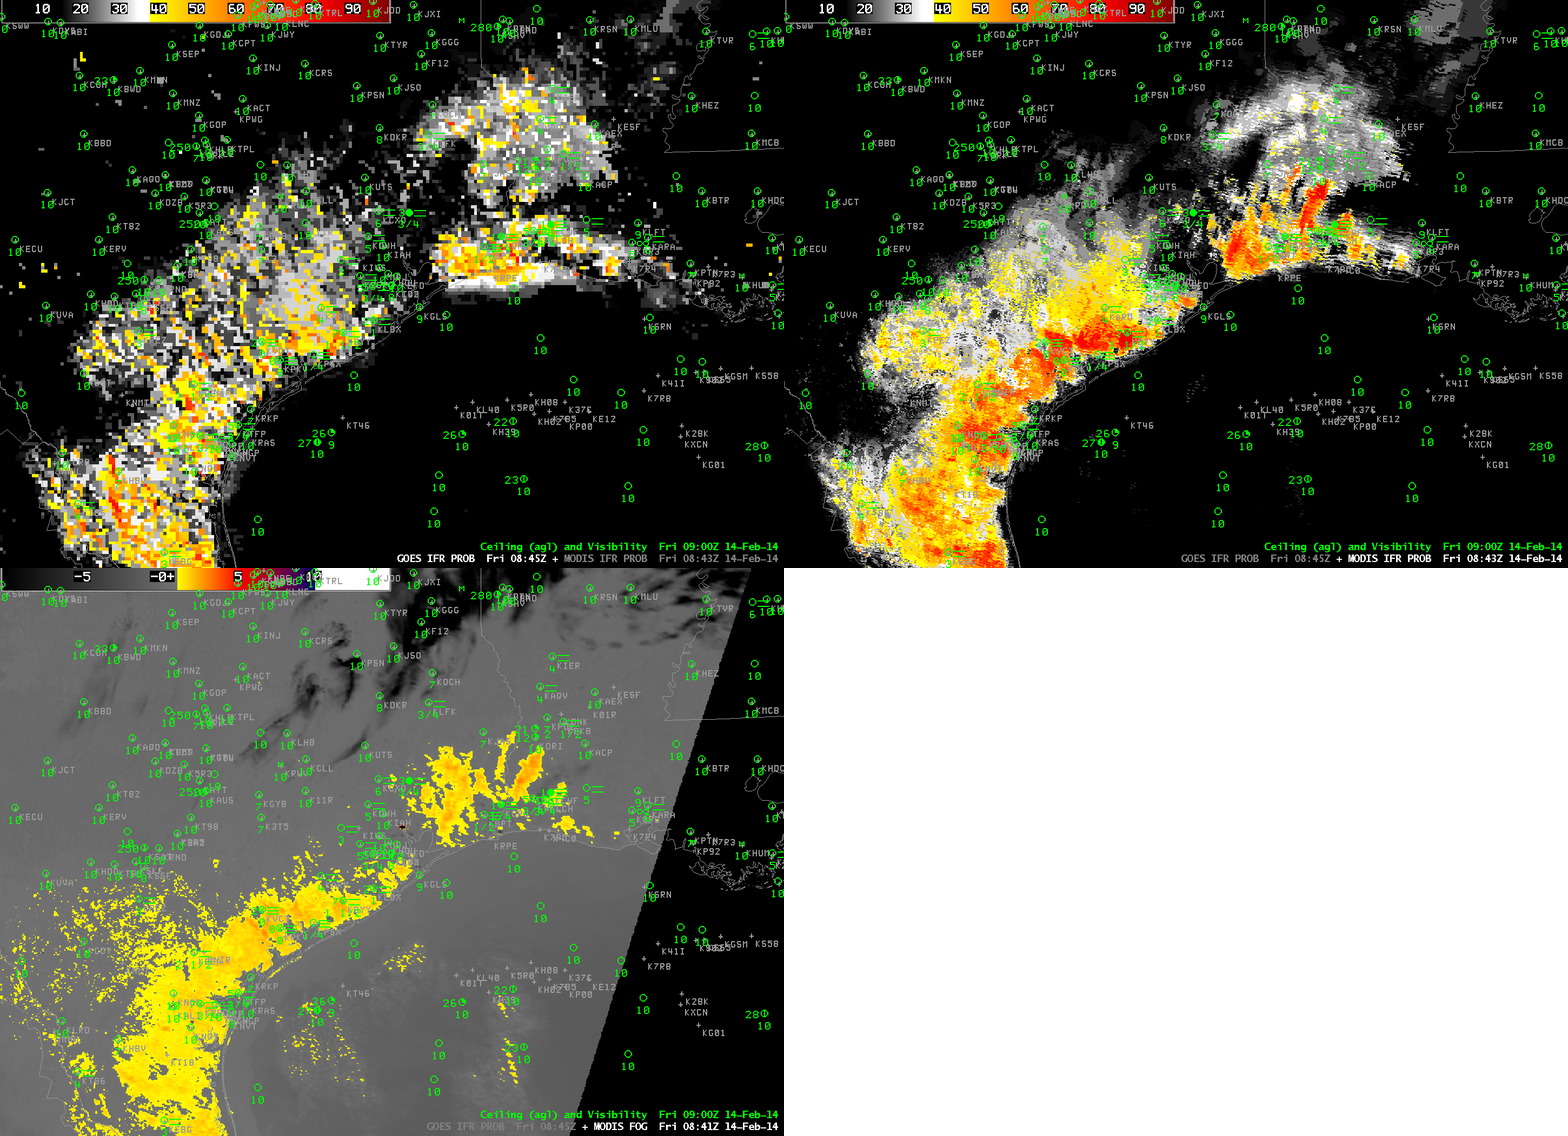
GOESMODIS_IFR_20140214_0845

GOES-R IFR Probabilities, MODIS IFR Probabilities, and MODIS Brightness Temperature Difference fields, all from ~0845 UTC 14 February 2014 (click image to enlarge)

MODIS data can be used to generate IFR Probabilities as well, as shown above. The MODIS-based and GOES-based fields both generally overlap regions with developing IFR conditions. The MODIS-based Brightness temperature difference product (called MODIS FOG in the image annotation) shows little signal in central Louisiana/east Texas (near Lufkin, for example) or southwest of Houston, two places where near-IFR conditions are developing (and where the IFR Probability fields have a signal).

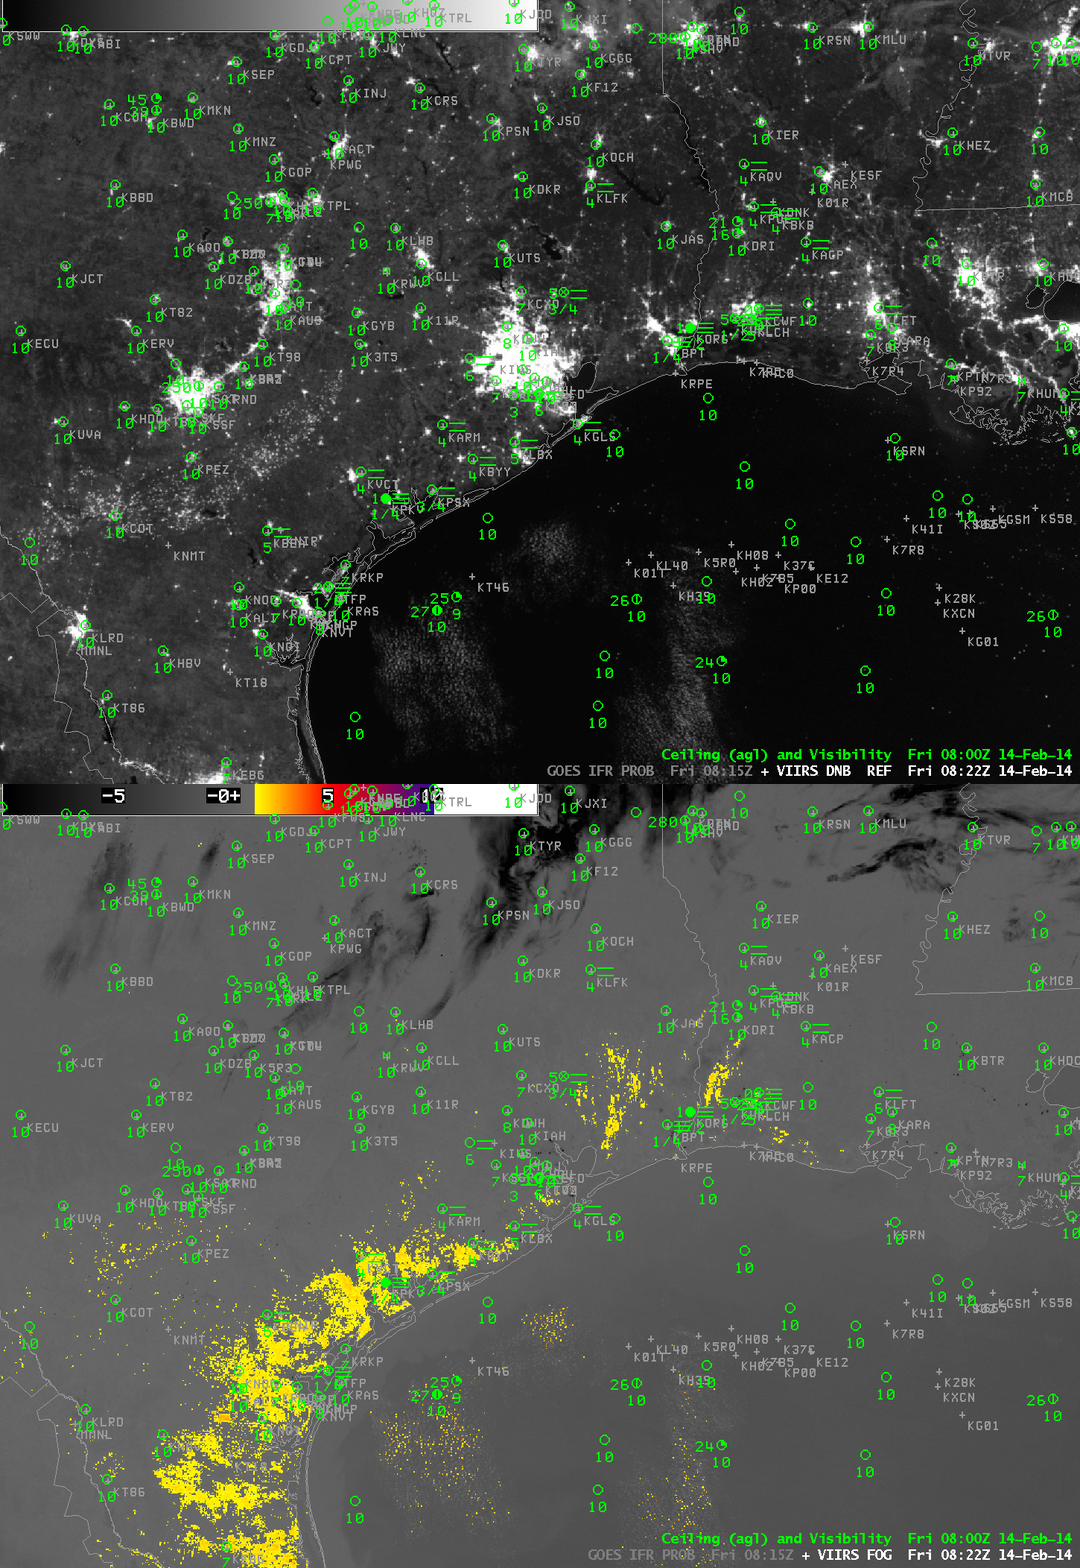
VIIRS_DNB_FOG_20140214toggle

GOES-R IFR Probabilities, MODIS IFR Probabilities, and MODIS Brightness Temperature Difference fields, all from ~0845 UTC 14 February 2014 (click image to enlarge)

Suomi/NPP data (Brightness Temperature Difference fields, and the Day/Night band) from the same hour (0822 UTC) as the MODIS data similarly underpredicts the areal extend of the developing IFR conditions.

GOES_IFR_PROB_20140214_4panelloop

GOES-Based GOES-R IFR Probabilities (Upper Left), GOES-East Brightness Temperature Difference Fields (Upper Right), GOES-R Cloud Thickness (Lower Left), GOES-East Visible Imagery (Lower Right), hourly from 0400 UTC through 1600 UTC 14 February 2014 (click image to enlarge)

The animation above shows hourly views of GOES-R IFR Probability and GOES-East Brightness Temperature Difference fields. There is little discernible signal in the brightness temperature difference field until about 0915 UTC (several hours after the IFR Probability field has been suggesting fog development). Thus the GOES-R IFR Probability field is giving better lead time is diagnosing where visibility restrictions might occur/be occurring. In addition, the GOES-R Cloud Thickness product shows that the thickest fog/stratus field just before sunrise is just east of Austin/San Antonio, and that is the last region to clear out after sunrise.

The presence of high clouds has an effect on both the IFR Probability fields and the brightness temperature difference field. When high clouds are present (in the brightness temperature difference enhancement used, high clouds are dark), IFR Probabilities drop in value and the field becomes flatter because satellite data cannot be used in the computation of the IFR Probability Field.

IFR Conditions over the southern Plains

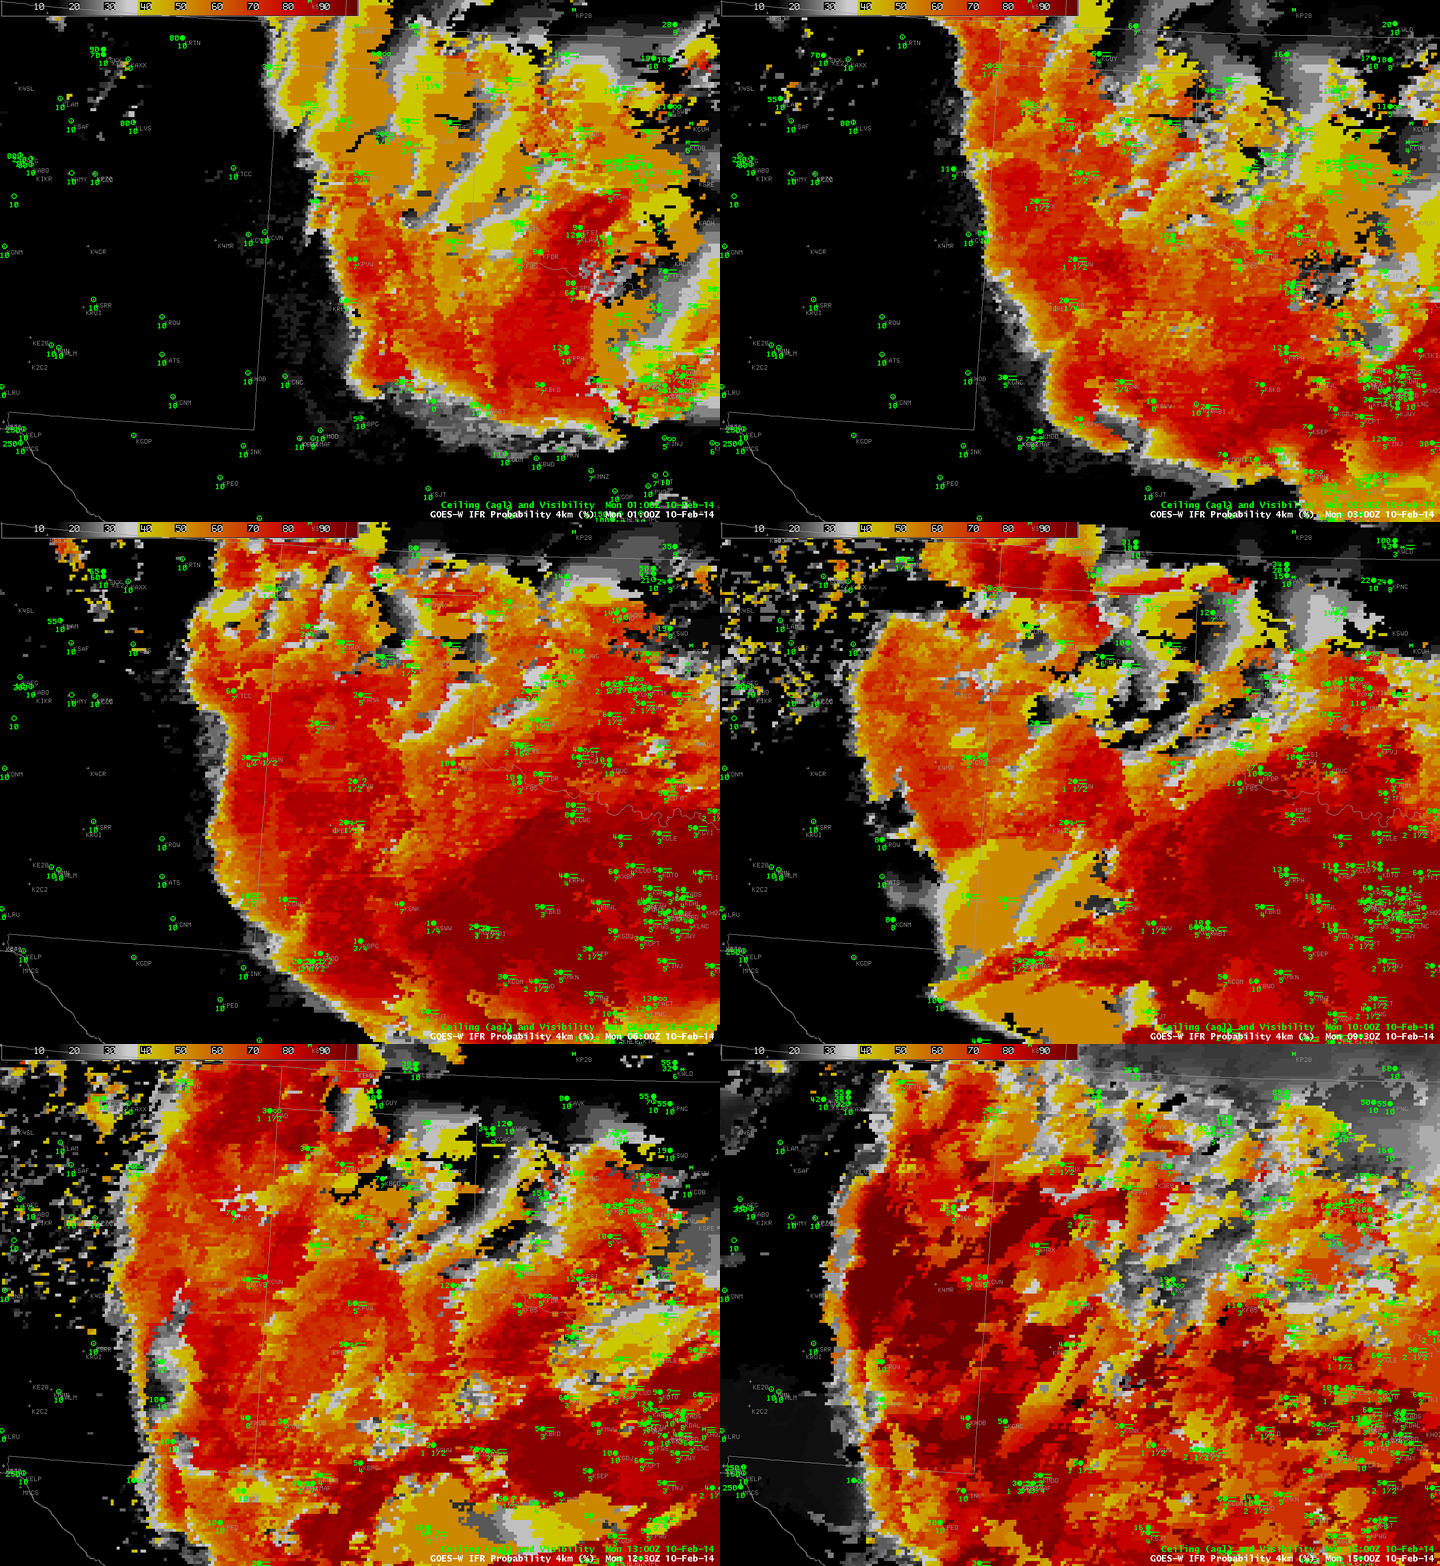
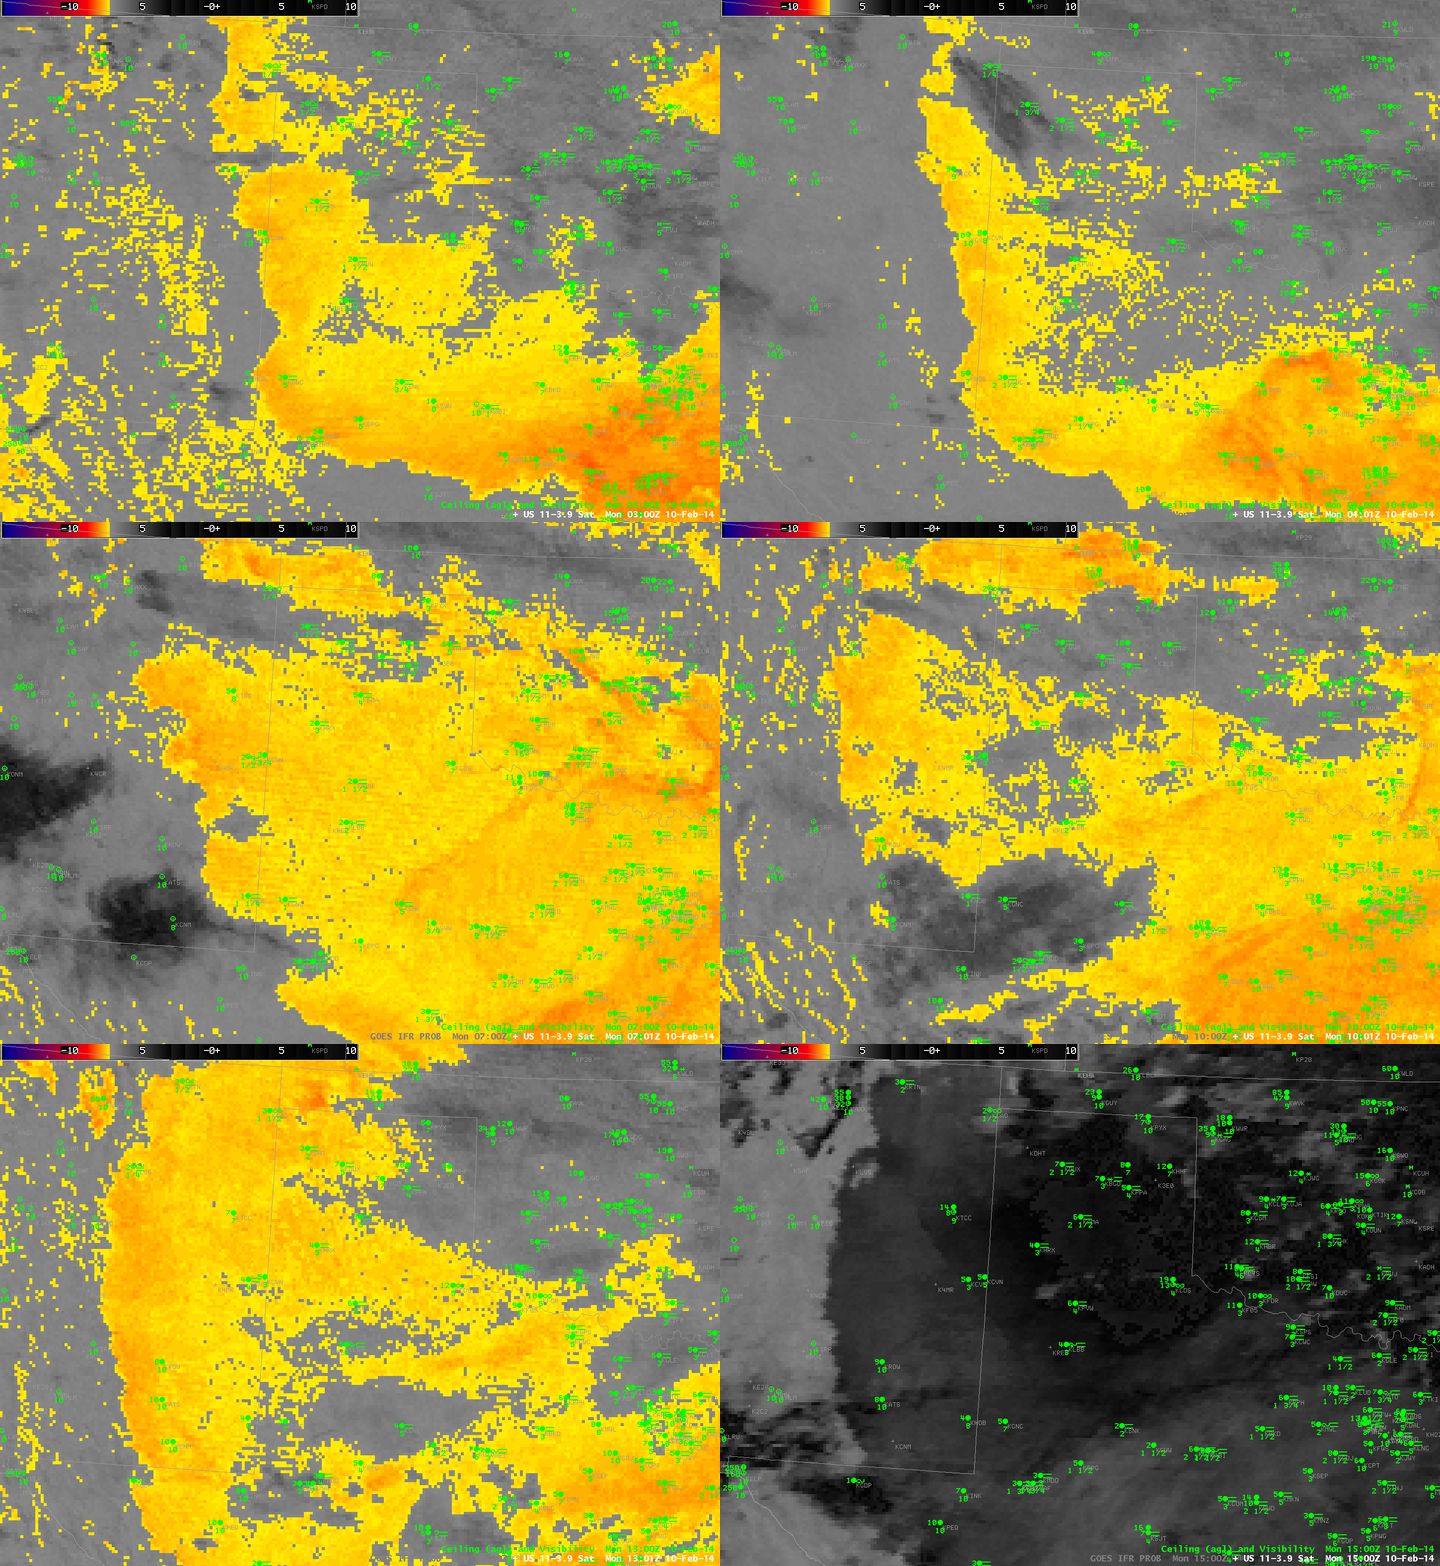
GOES_IFR_PROB_20140210loop

GOES-R IFR Probabilities from 0100 through 1500 UTC on 10 February 2014 (click image to enlarge)

Cold air dropping southward through the southern Plains is sometimes shunted westward towards higher elevation on the Equatorward side of the Polar High that anchors the cold air. That upslope flow facilitates the development of fog and low stratus. That was the case today, and the southward and westward movement of low clouds/fog is obvious in the IFR Probability field animation shown above. Much of the High Plains south of Kansas had reduced visibility and lowered ceilings, and IFR Probabilities were high.

The IFR Probability field does a better job of outlining where the low clouds associated with IFR Conditions are present. Compare the half-hourly loop above to the hourly loop of the Brightness Temperature Difference (10.7 µm – 3.9 µm), below. Regions with multiple cloud layers show little signal in the brightness temperature field, and the flip in signal at sunrise — as 3.9 µm radiation from the Sun is reflected off the clouds, overwhelming the emitted signal — is obvious.

US_11-3.9_Sat_20140210loop

GOES-East Brightness Temperature Difference (10.7 µm – 3.9 µm) 0300 through 1500 UTC on 10 February 2014 (click image to enlarge)

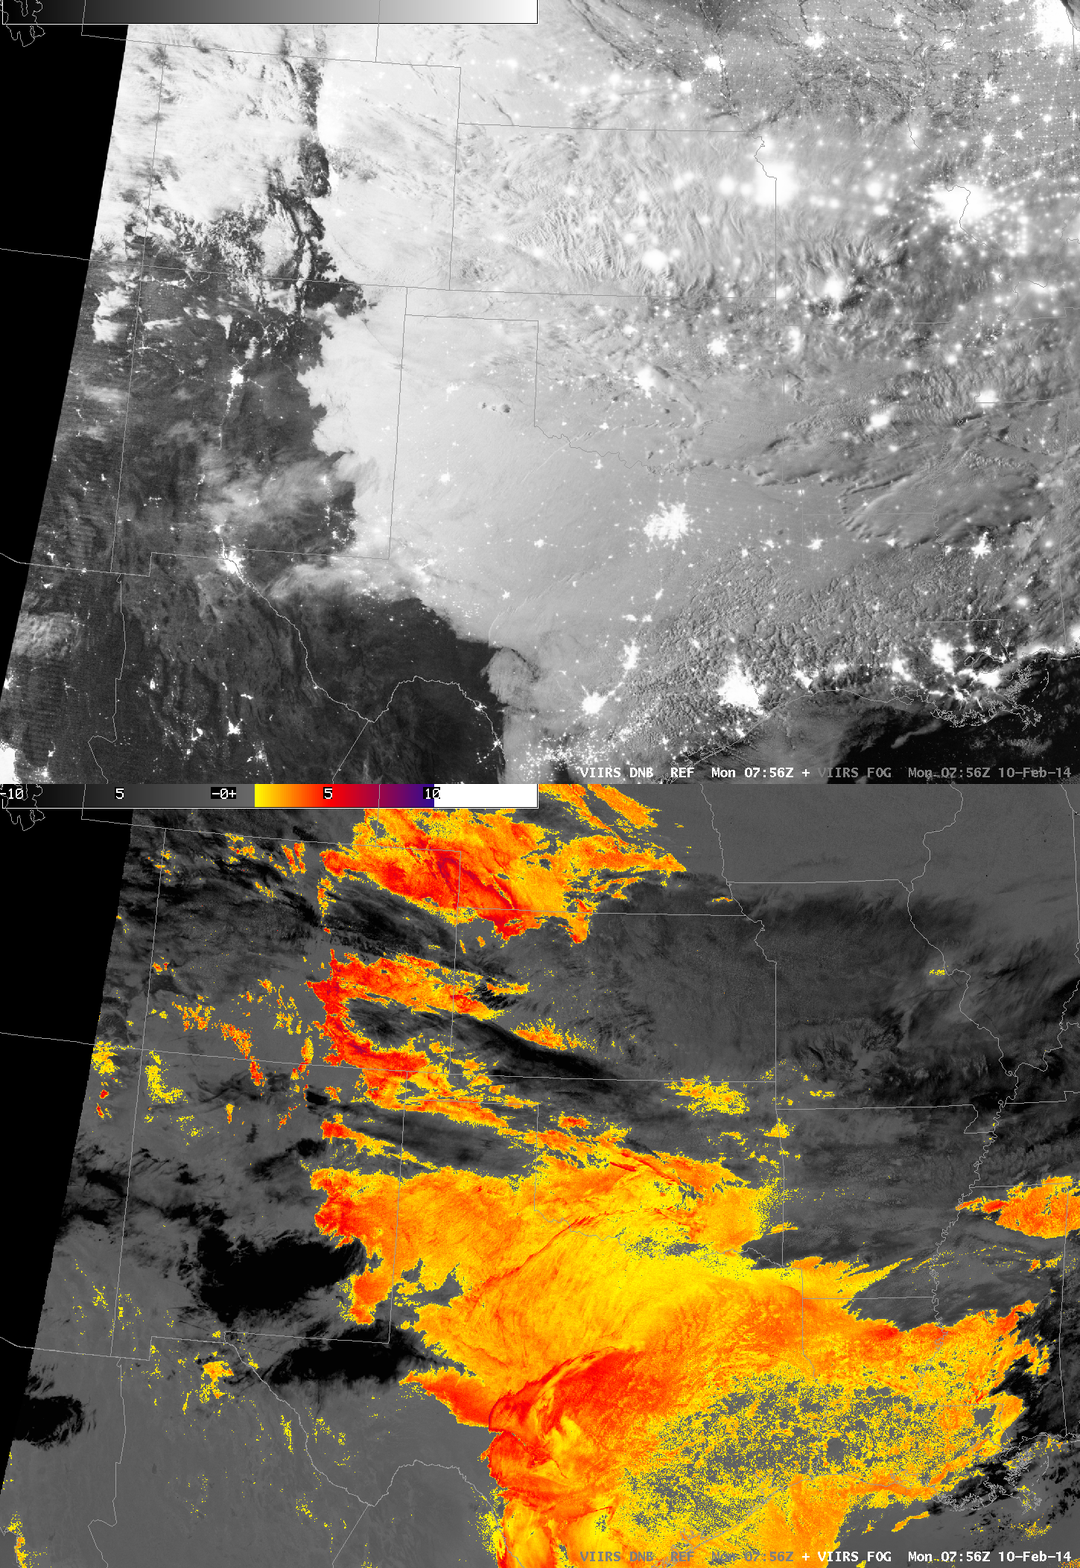
Polar-orbiting satellites can give high-resolution views of scenes. Suomi/NPP carries the VIIRS instrument, which has a Day/Night band and 11.35 and 3.74 µm channels, shown below in a toggle. Of course, these views are telling you something about the top of the clouds only. Whether of not visibility/ceiling restrictions are happening is unknown. GOES-R IFR Probability algorithms have not yet been configured for Suomi/NPP data (such a configuration is complicated by the lack of a water vapor channel on VIIRS). The characteristic signal of high clouds — dark features in the enhancement used — shows up in the VIIRS Brightness Temperature Difference field.

VIIRS_20140210_0756

Suomi/NPP VIIRS Day/Night band and Brightness Temperature Difference (11.35 µm – 3.74 µm) at 0756 UTC on 10 February 2014 (click image to enlarge)

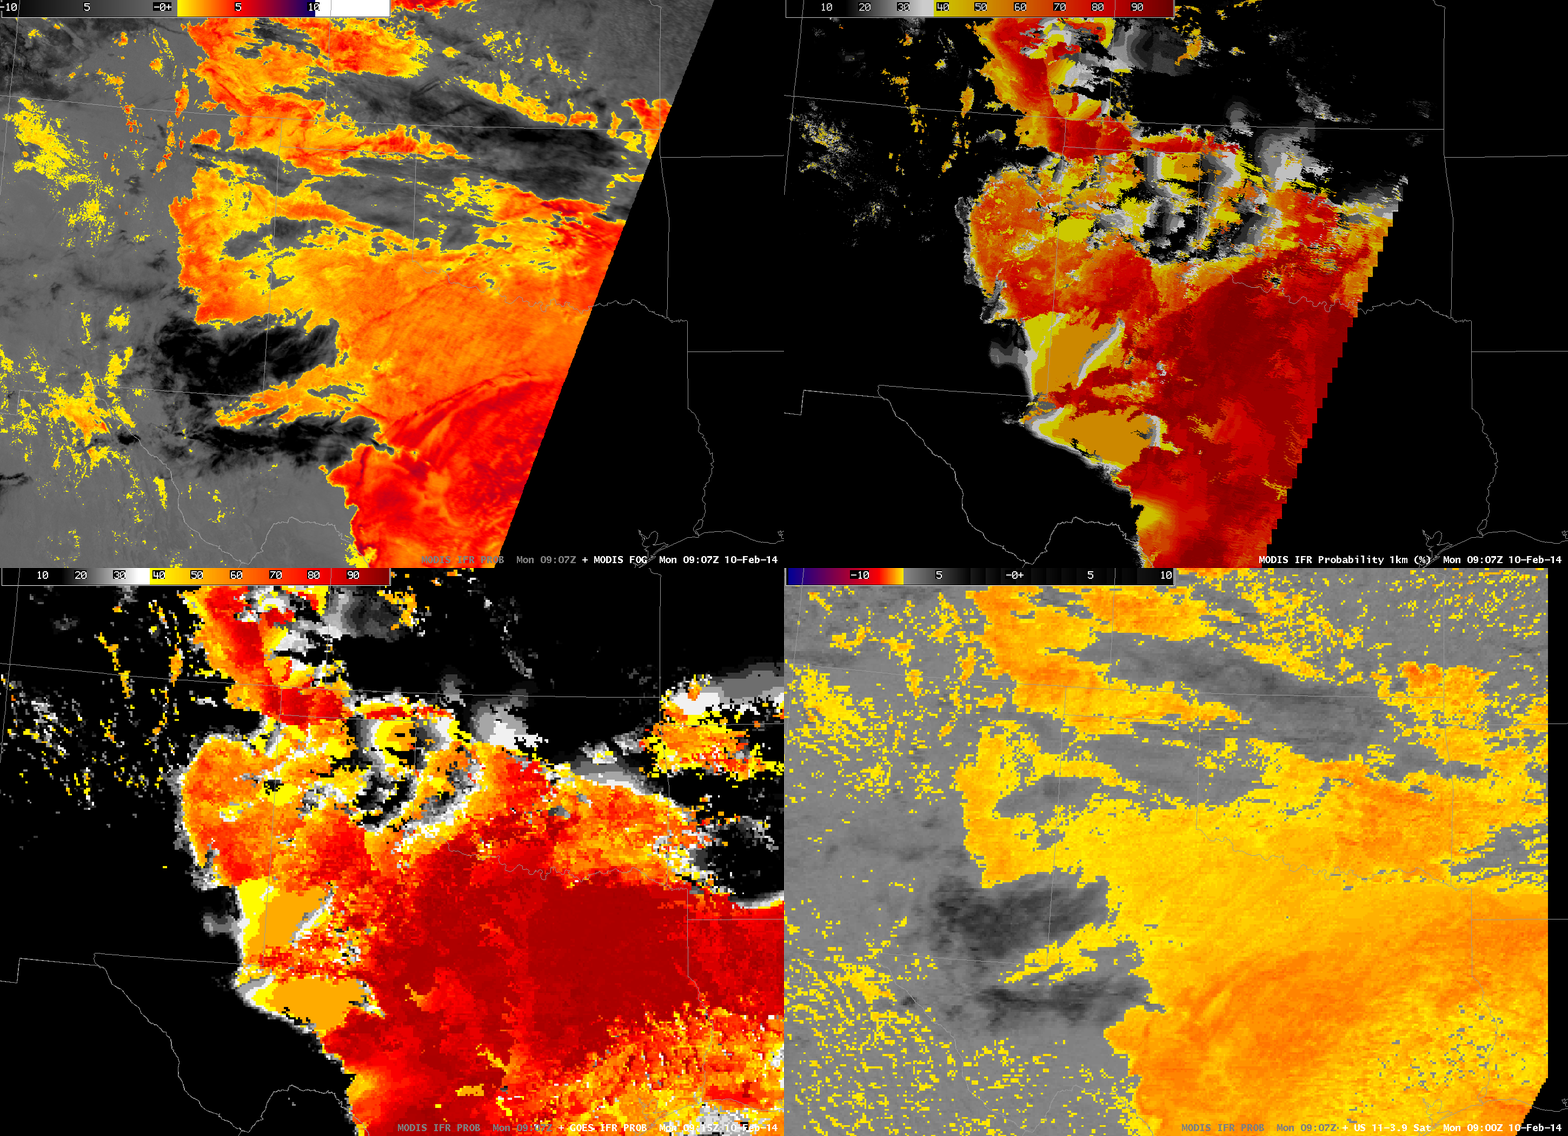
MODIS data includes water vapor imagery, and thus GOES-R IFR Probability fields can be computed using MODIS data, as shown below from 0907 UTC. This toggle includes MODIS-based Brightness Temperature Differences, MODIS-based GOES-R IFR Probabilities, GOES-based GOES-R IFR Probabilities and GOES Brightness Temperature Differences. The shortcoming of the MODIS-based data is obvious (it doesn’t view the entire scene), but its strength (excellent spatial resolution) is also apparent.

MODIS_GOES_BTD_IFR_0900

MODIS Brightness Temperature Difference (11 µm – 3.9 µm), MODIS-based GOES-R IFR Probabilities, GOES-based GOES-R IFR Probabilities and GOES-East Brightness Temperature Differences (10.7 µm – 3.9 µm) at ~0910 UTC on 10 February 2014 (click image to enlarge)

Fog in Idaho, Oregon and Washington over three days

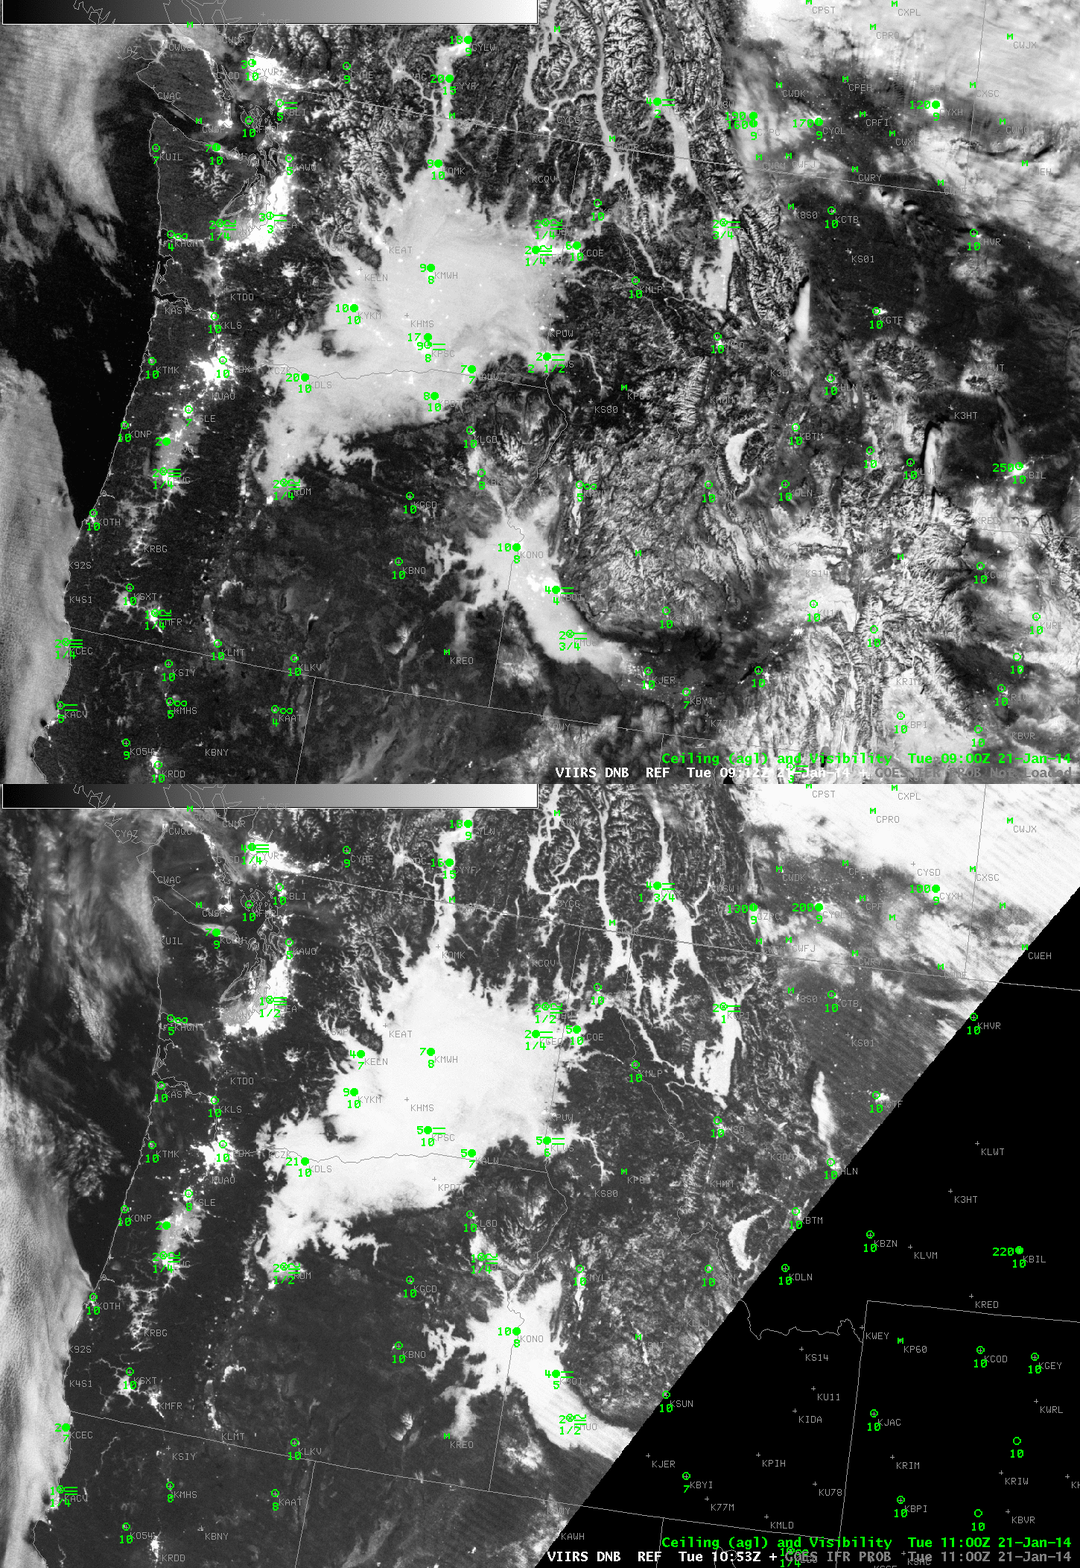
VIIRS_DNB__REF_20140121loop

Suomi/NPP Day/Night band imagery over the Pacific Northwest, 0912 and 1053 UTC on 21 January 2014(click image to enlarge)

Suomi/NPP viewed eastern Oregon/Washington and western Idaho on two successive scans overnight. The 3/4 full moon provides ample illumination, and fog/low stratus is apparent in the imagery above. A view of the top of the clouds, however, gives little information about the cloud base, that is, whether or not important restrictions in visibility are occurring. For something like that, it is helpful to include surface-based data. Rapid Refresh data are fused with the model data to highlight regions where IFR conditions are most likely. The image below is a toggle of the 1053 UTC Day/Night band image and the 1100 UTC GOES-R IFR Probabilities (computed using GOES-West data). GOES-R IFR Probabilities are correctly highlighting regions where ceilings and visibilities are consistent with IFR conditions. Where the Day/Night band is possibly seeing elevated stratus (between The Dalles (KDLS) and Yakima (KYKM), for example), IFR Probabilities are lower.

GOES-based data cannot resolve very small-scale fog events in river valleys (over northeastern Washington State, for example). The superior spatial resolution of a polar-orbiting satellite like Suomi/NPP (or Terra/Aqua) can really help fine-tune understanding of the horizontal distribution of low clouds.
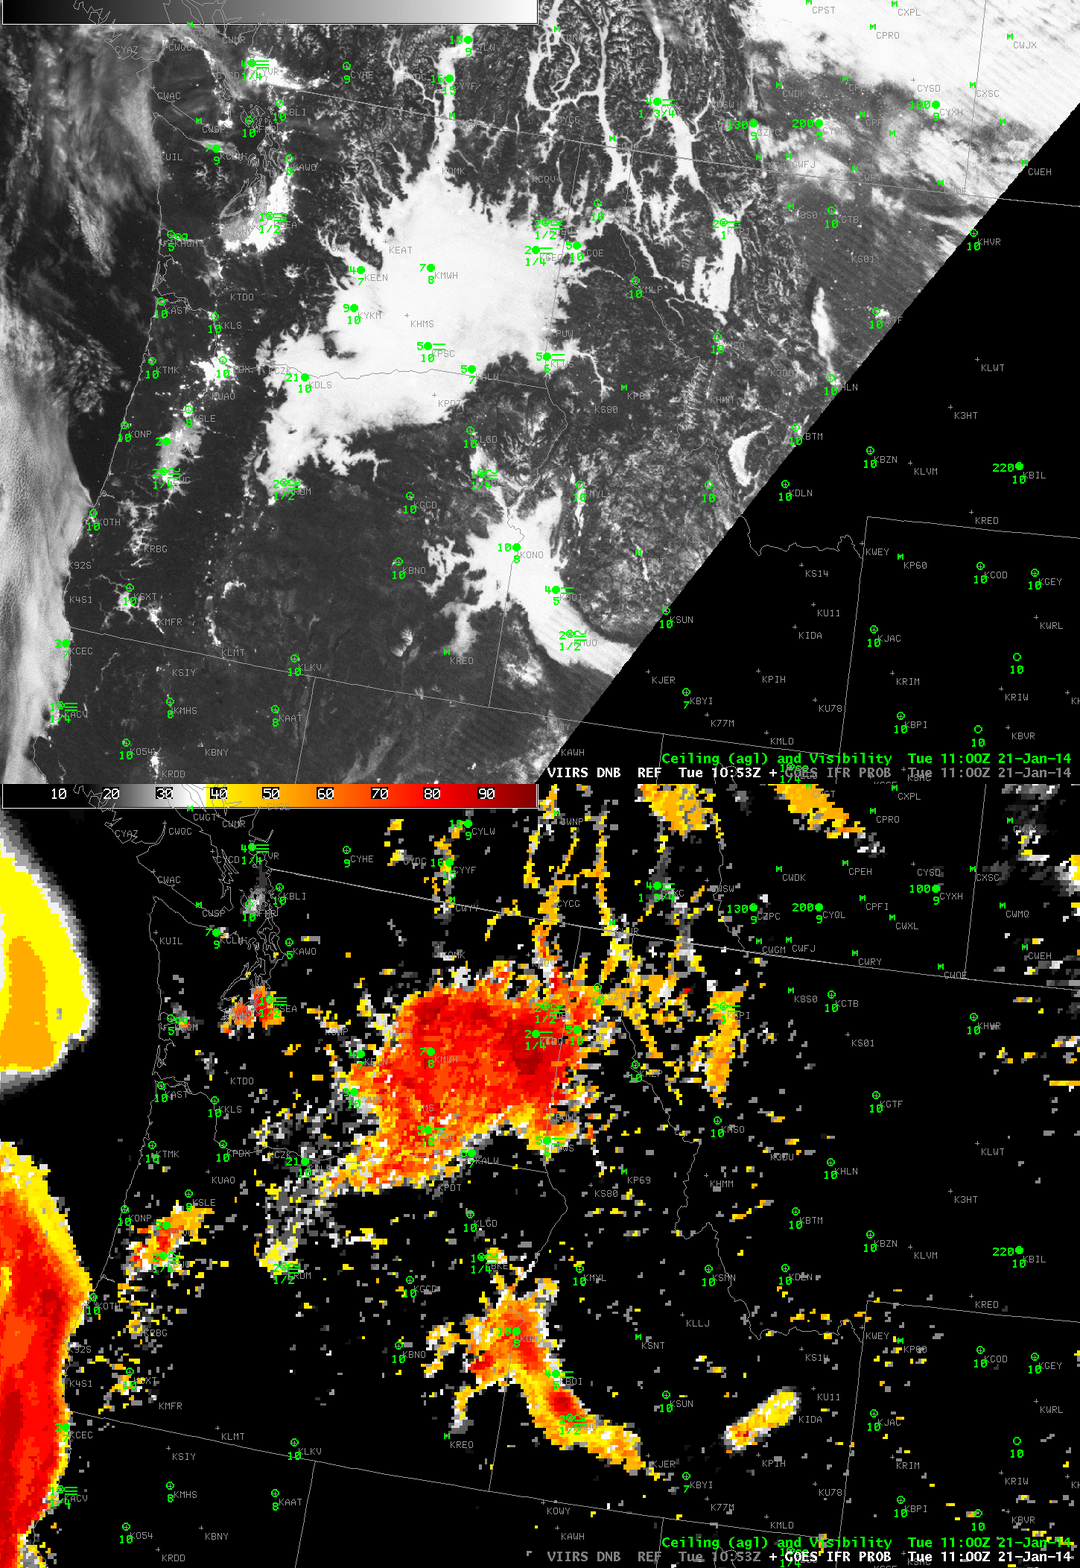
VIIRS_DNB_GOESIFR_TOGGLE_20140121_1100

Suomi/NPP Day/Night band imagery and GOES-R IFR Probabilities, ~1100 UTC on 21 January 2014(click image to enlarge)

Added: 22 January 2014
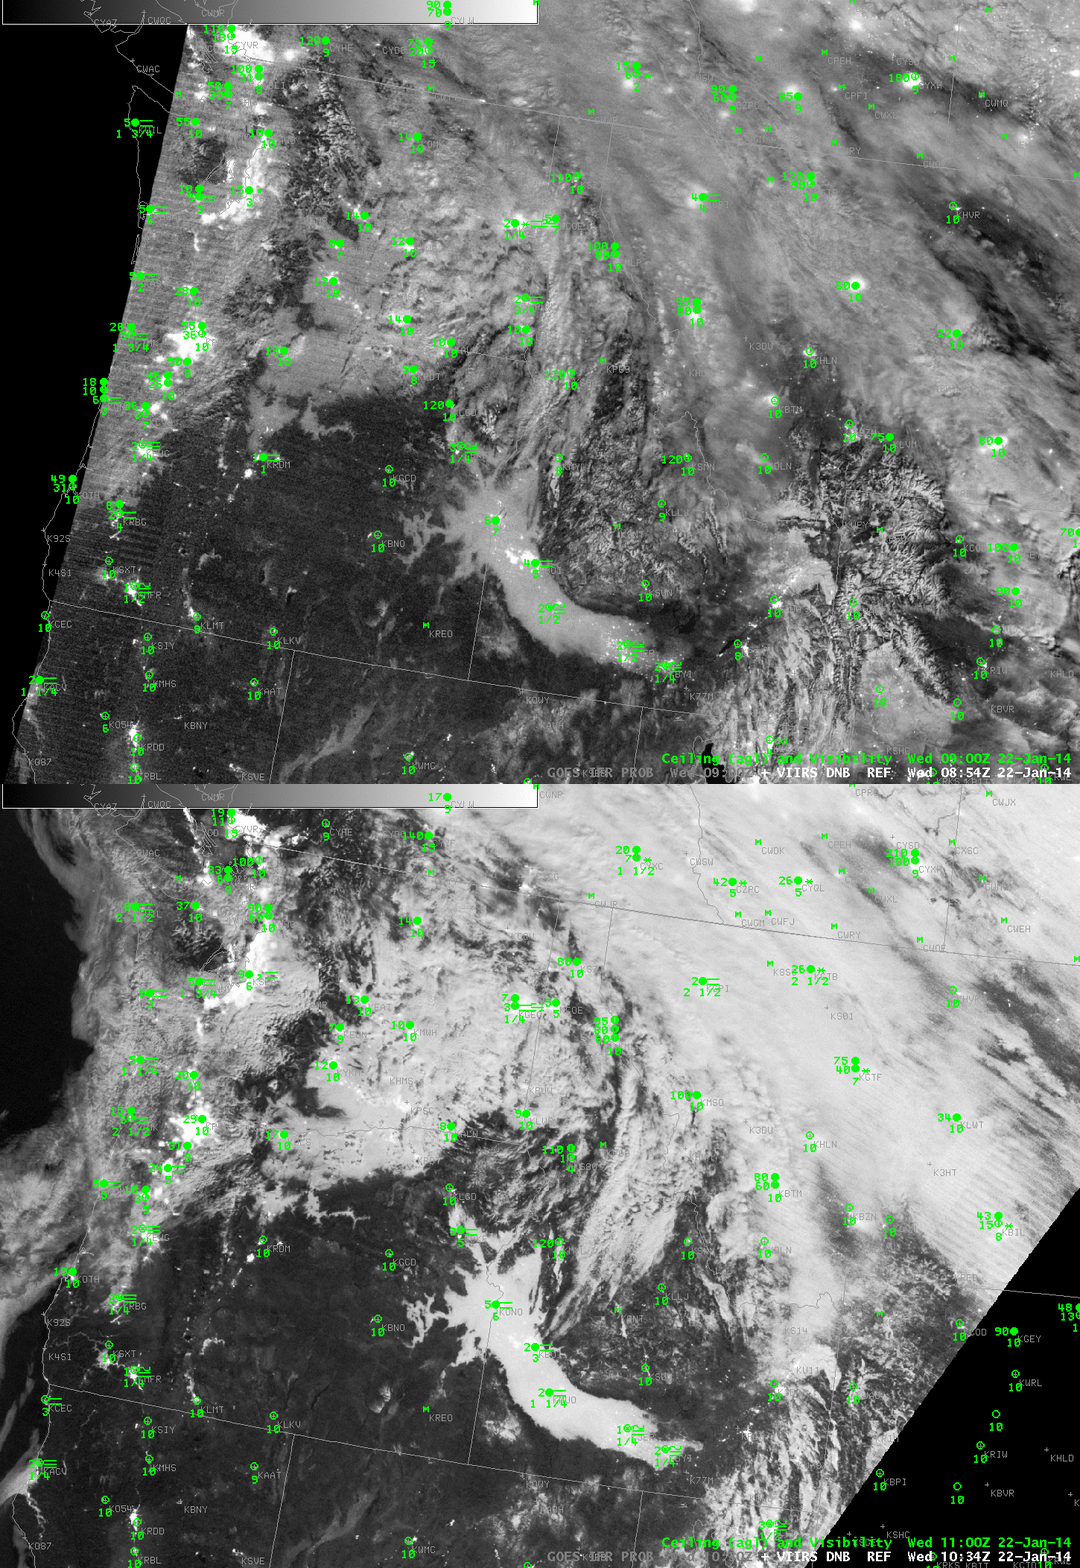
VIIRS_DNB__REF_20140122loop

Suomi/NPP Day/Night band imagery over the Pacific Northwest, 0854 and 1034 UTC on 22 January 2014(click image to enlarge)
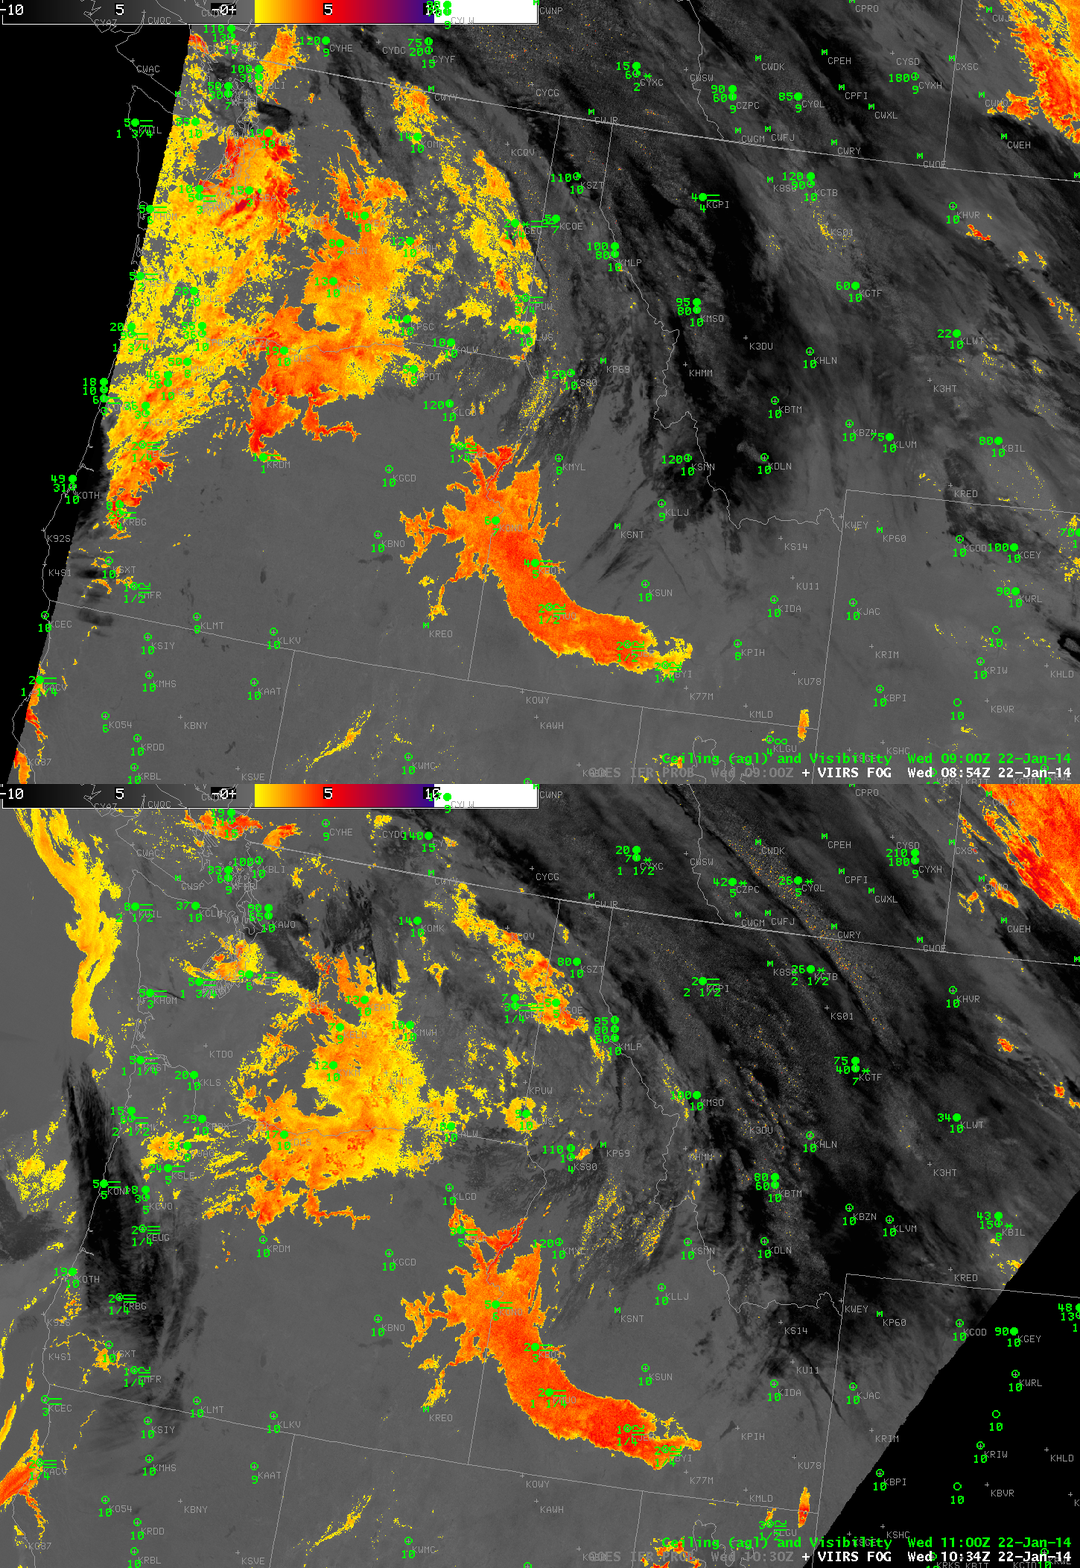
VIIRS_FOG_20140122loop

Suomi/NPP Brightness Temperature Difference from VIIRS, 11 µm – 3.74 µm imagery over the Pacific Northwest, 0854 and 1034 UTC on 22 January 2014(click image to enlarge)

The stagnant weather pattern under the west coast ridge allowed fog to persist overnight on January 22nd, and once again, the Day/Night band observed the fog-filled Snake River Valley of southern Idaho. The newly-rising moon at 0854 UTC provided less illumination than the higher moon at 1034 UTC, but both show fog/low stratus over the Snake River Valley of Idaho, and over parts of northern Oregon and central Washington. It is difficult to tell where the stratus is close enough to the ground to produce IFR conditions, however. The brightness temperature difference product from VIIRS, above, can distinguish between low clouds (orange enhancement) and higher clouds (dark grey) because of the different emissivity properties of water-based low clouds and ice-based higher clouds.

The toggle below shows how the higher-resolution VIIRS instrument can more accurately portray sharp edges to low clouds. Both instruments show the region of high clouds moving onshore in coastal Oregon (at the very very edge of the Suomi/NPP scan). These high clouds make satellite-detection of low clouds difficult because they mask detection of lower clouds.
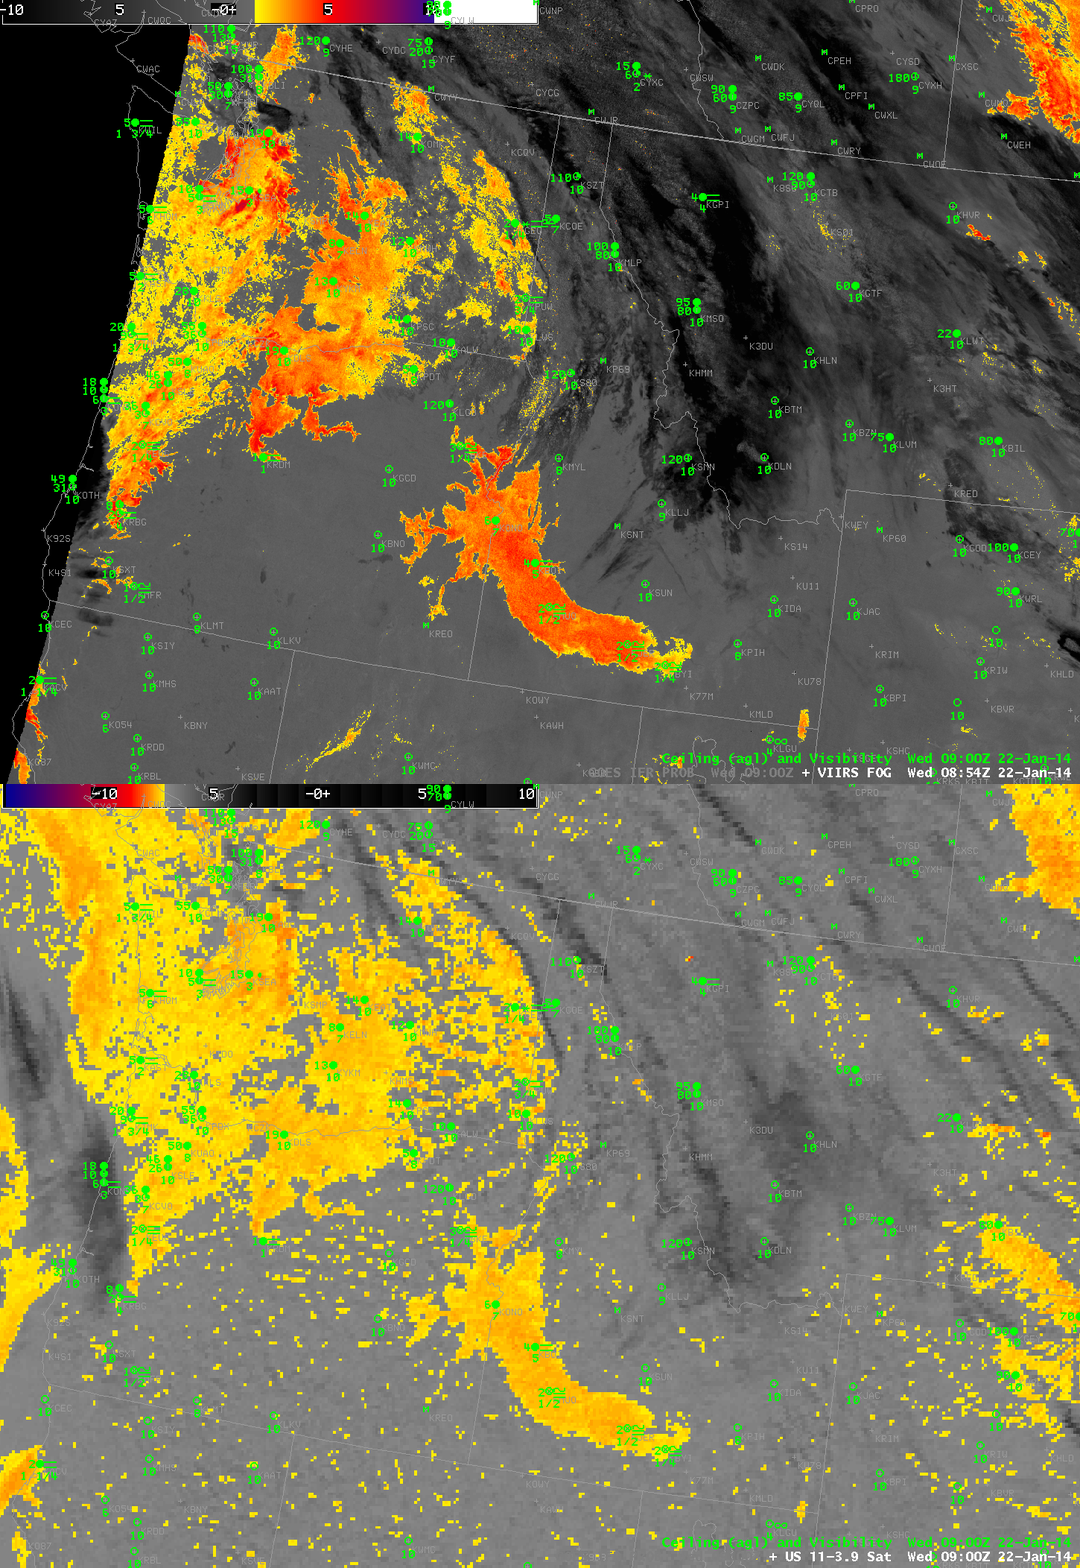
GOESVIIRS_11-3.9_Sat_20140122_0900

Suomi/NPP Brightness Temperature Difference from VIIRS (10.35 µm – 3.74 µm) and GOES-15 Imager Brightness Temperature Difference (10.7 µm – 3.9 µm imagery over the Pacific Northwest, ~0900 UTC on 22 January 2014(click image to enlarge)
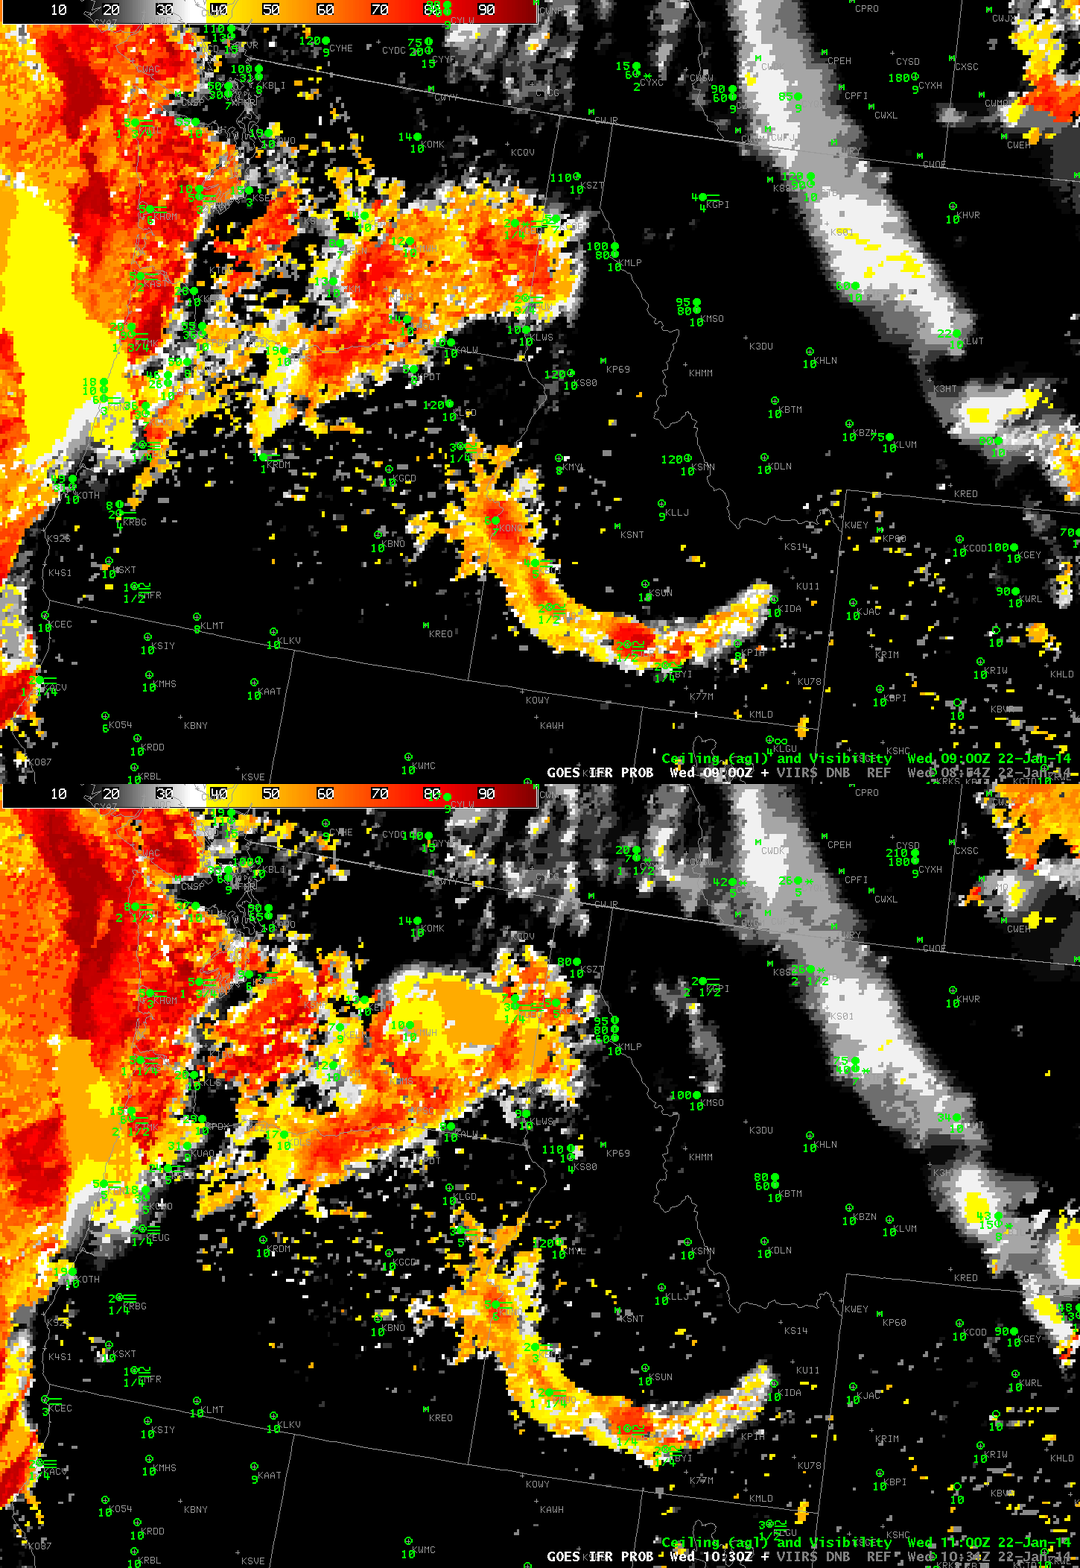
GOES_IFR_PROB_20140122loop

GOES IFR Probabilities at 0900 UTC and at 1030 UTC (click image to enlarge)

GOES-based IFR Probabilities show the probability of fog and low ceilings (IFR conditions) even where high clouds are present. In the toggle above, note the regions where the IFR Probability field is uniform (off the coast of Oregon, yellow, and over west-central Washington State, orange and yellow, both at 0900 UTC). These smooth fields are typical of IFR Probabilities that are determined primarily from Rapid Refresh data. Where those smooth fields exist, satellite data does not give a signal of low clouds — usually because of the presence of ice-based clouds at higher levels; therefore, model data are driving the IFR Probability signal, and model data are typically smoother than the more pixelated satellite field. There are places, however, where model data alone does not accurately portray IFR conditions (at KGPI, for example (Glacier Park), where high clouds are present).

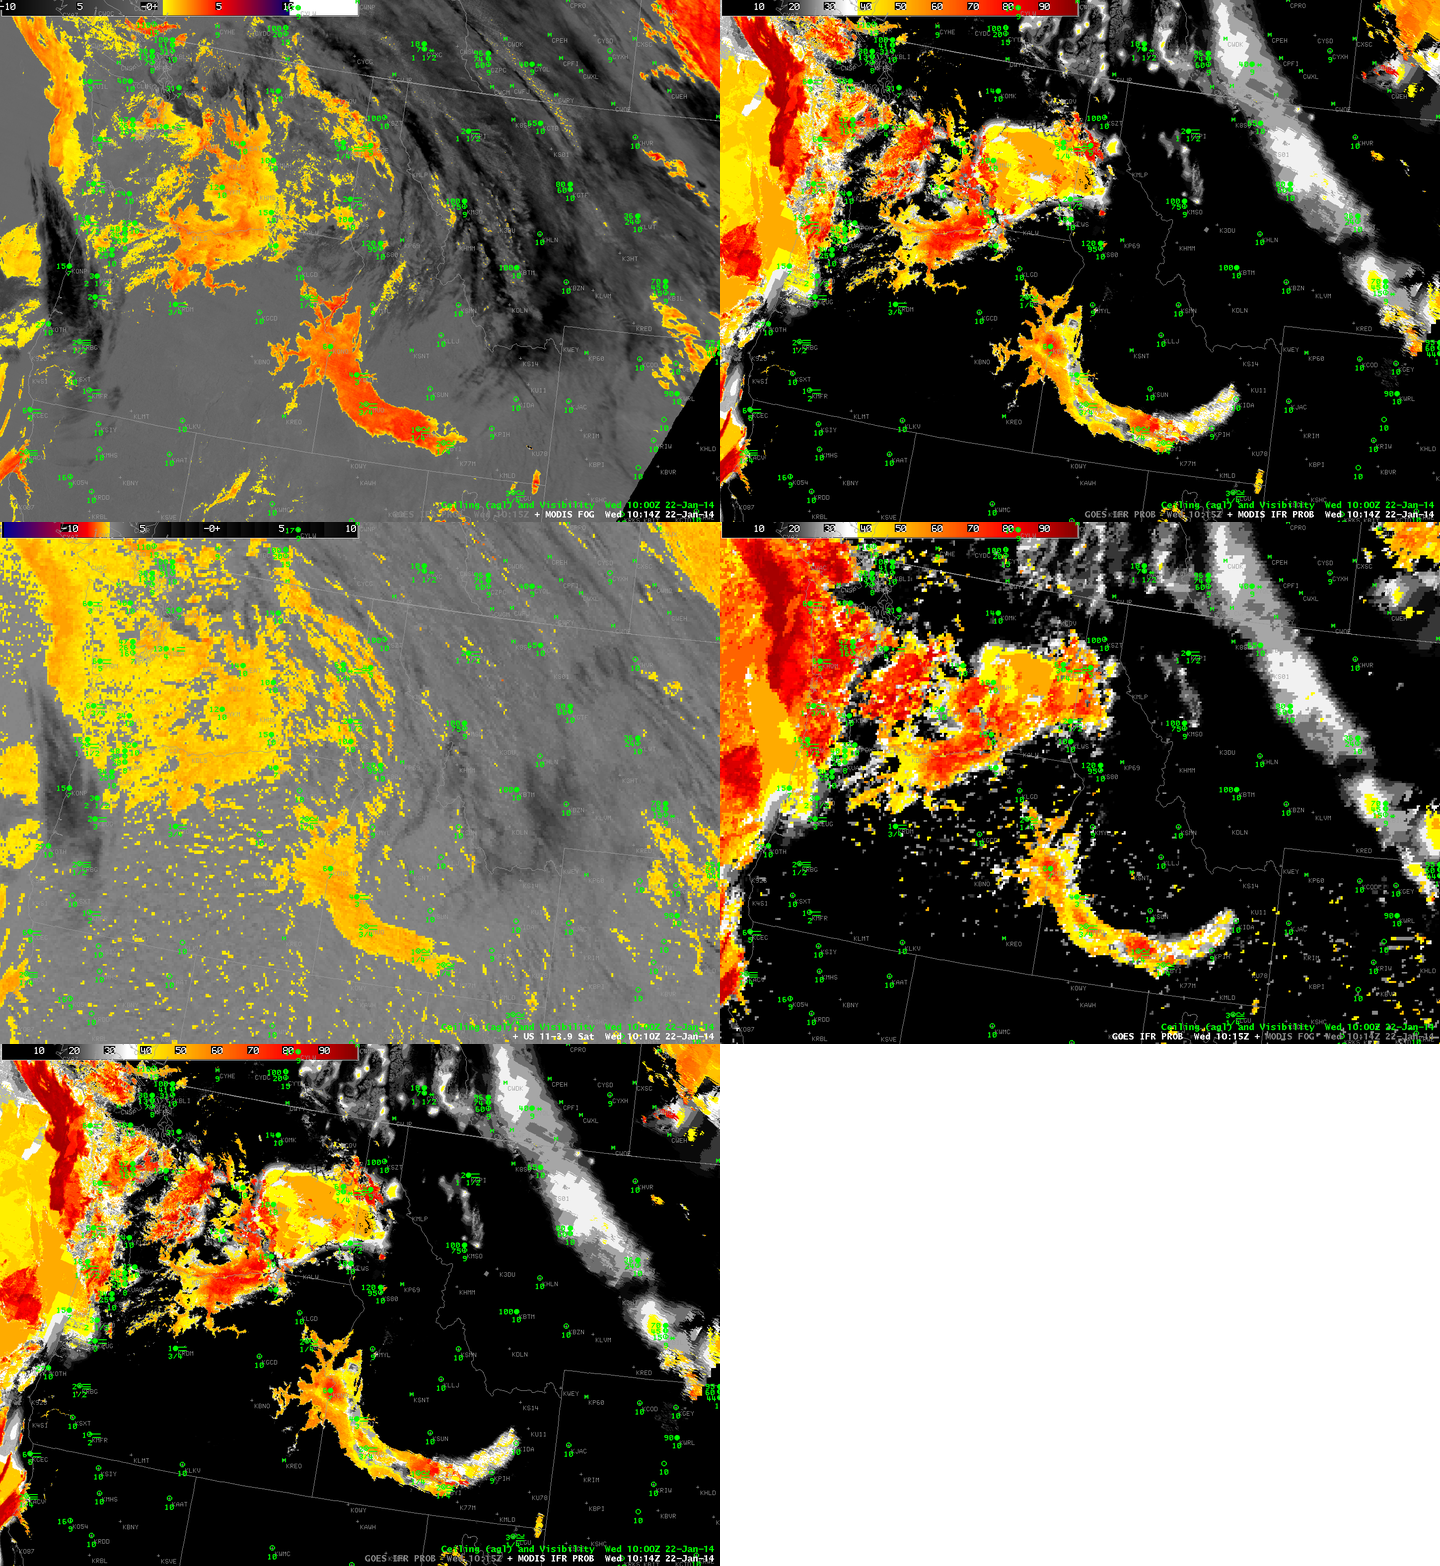
IFR Probability algorithms have not yet been extended using data from Suomi/NPP, in large part because the VIIRS instrument does not detect radiation in the so-called water-vapor channel (around 6.7 µm). The MODIS detector on board Terra and Aqua does have a water vapor channel, and IFR Probabilities are routinely produced from MODIS data, as shown below. MODIS, like VIIRS, has a 1-km pixel footprint that excels at detecting very fine small-scale features in clouds, especially small valleys, that are smeared out in the GOES imagery. The toggle below is of MODIS Brightness Temperature Difference, MODIS-based IFR Probabilities, GOES Brightness Temperature Difference, and GOES-based IFR Probabilities, all at ~1015 UTC on 22 January. Two things to note: MODIS has cleaner edges to fields, related to the high spatial resolution. The GOES-based brightness temperature difference highlights many more pixels over central Oregon where fog is not present. These positive hits bleed into the GOES-based IFR Probabilities, and they occur because of emissivity differences in very dry soils (See for example, this post). As drought conditions persist and intensify on the west coast under the longwave ridge, expect this signal to persist. The signals are not apparent in MODIS or VIIRS brightness temperature differences because of the narrower spectrum of those observations.
GOESMODIS_IFR_PROB_20140122_1014

MODIS Brightness Temperature Difference (11 µm – 3.74 µm), MODIS-based GOES-R IFR Probabilities, GOES-15 Imager Brightness Temperature Difference (10.7 µm – 3.9 µm), GOES-based GOES-R IFR Probabilities and MODIS-based IFR Probabilities (again), all near 1015 UTC 22 January 2014(click image to enlarge)

Added, 23 January:

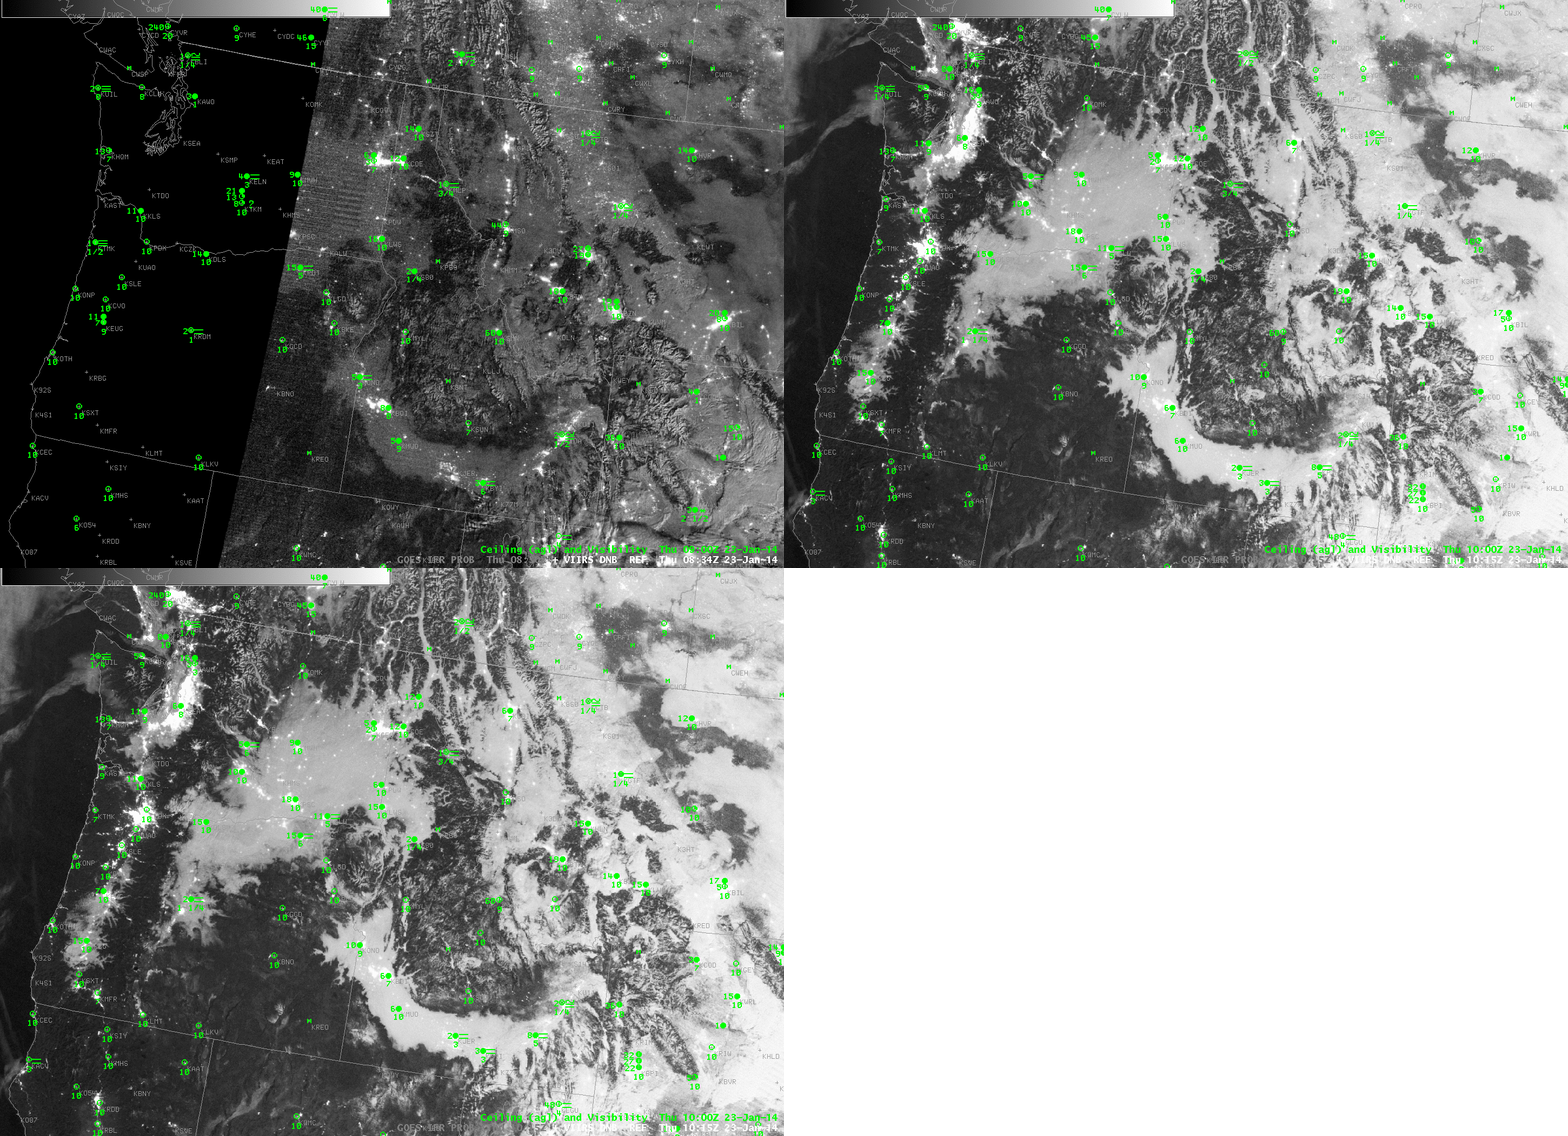
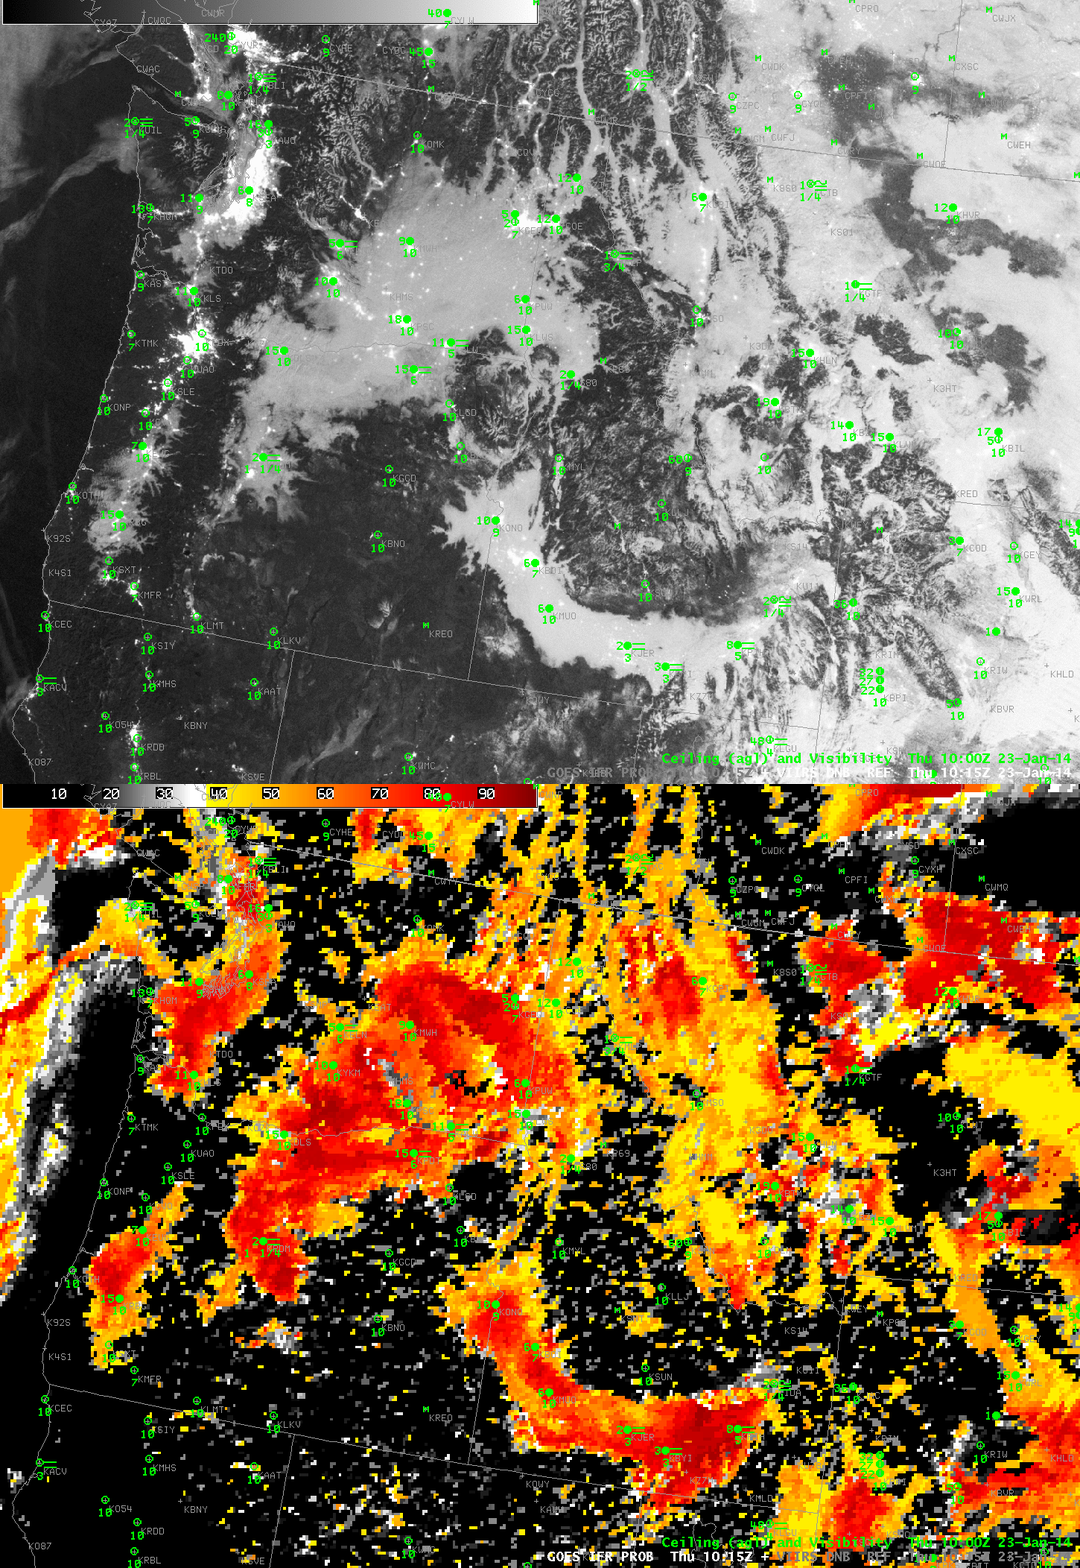
Fog persists in the Snake River Valley and elsewhere. It has also become more widespread over the high plains of Montana. Note the difference in the Day/Night band imagery below. At 0834 UTC, the rising quarter moon is unable to provide a lot of illumination; by 1015 UTC, however, the moon is illuminating the large areas of fog. Because the moon is waning, however, Day/Night band imagery will become less useful in the next week. A toggle between the 1015 UTC Day/Night band and the GOES-R IFR Probabilities computed using GOES-West (below the Day/Night band imagery) continues to demonstrate how well the field outlines the region of IFR conditions.
VIIRS_DNB__REF_20140123loop


Suomi/NPP Day/Night band imagery over the Pacific Northwest, 0834 and 1015 UTC on 23 January 2014(click image to enlarge)
VIIRS_DNB_GOES_IFR_PROB_20140123_1015


Suomi/NPP Day/Night band imagery and GOES-R IFR Probabilities (from GOES-15 and Rapid Refresh data) over the Pacific Northwest, 1015 UTC on 23 January 2014(click image to enlarge)
Dense fog on the East Coast

VIIRS_DNB_FOG_20140115toggle

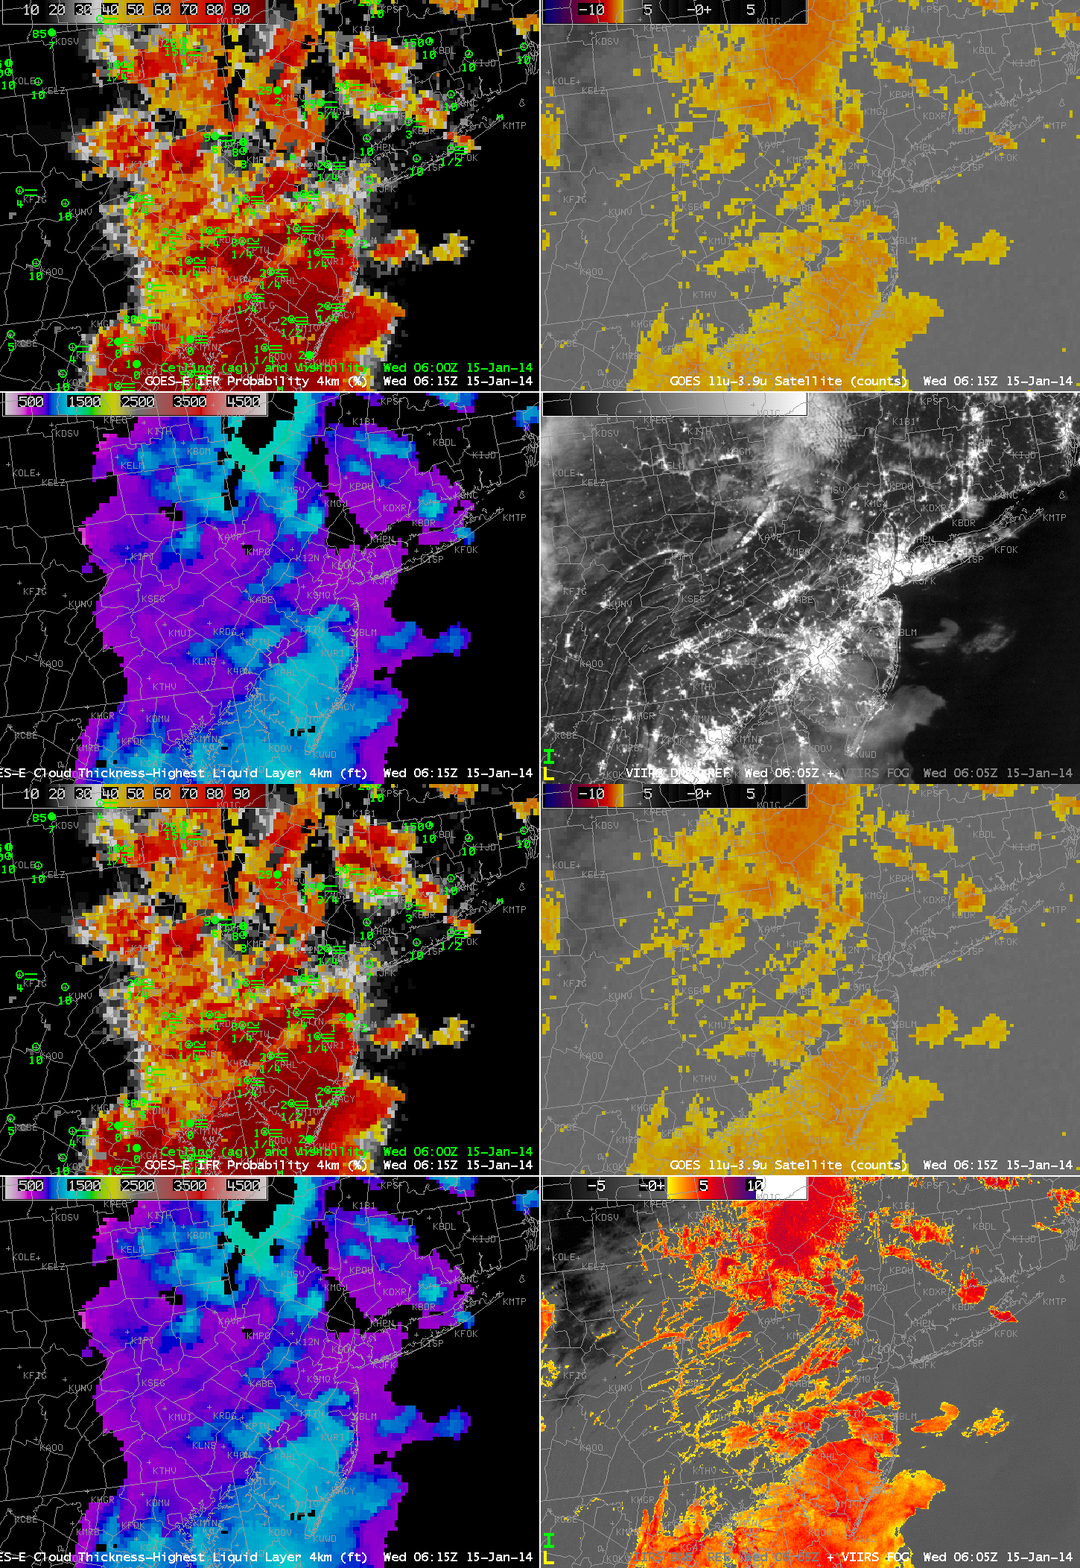
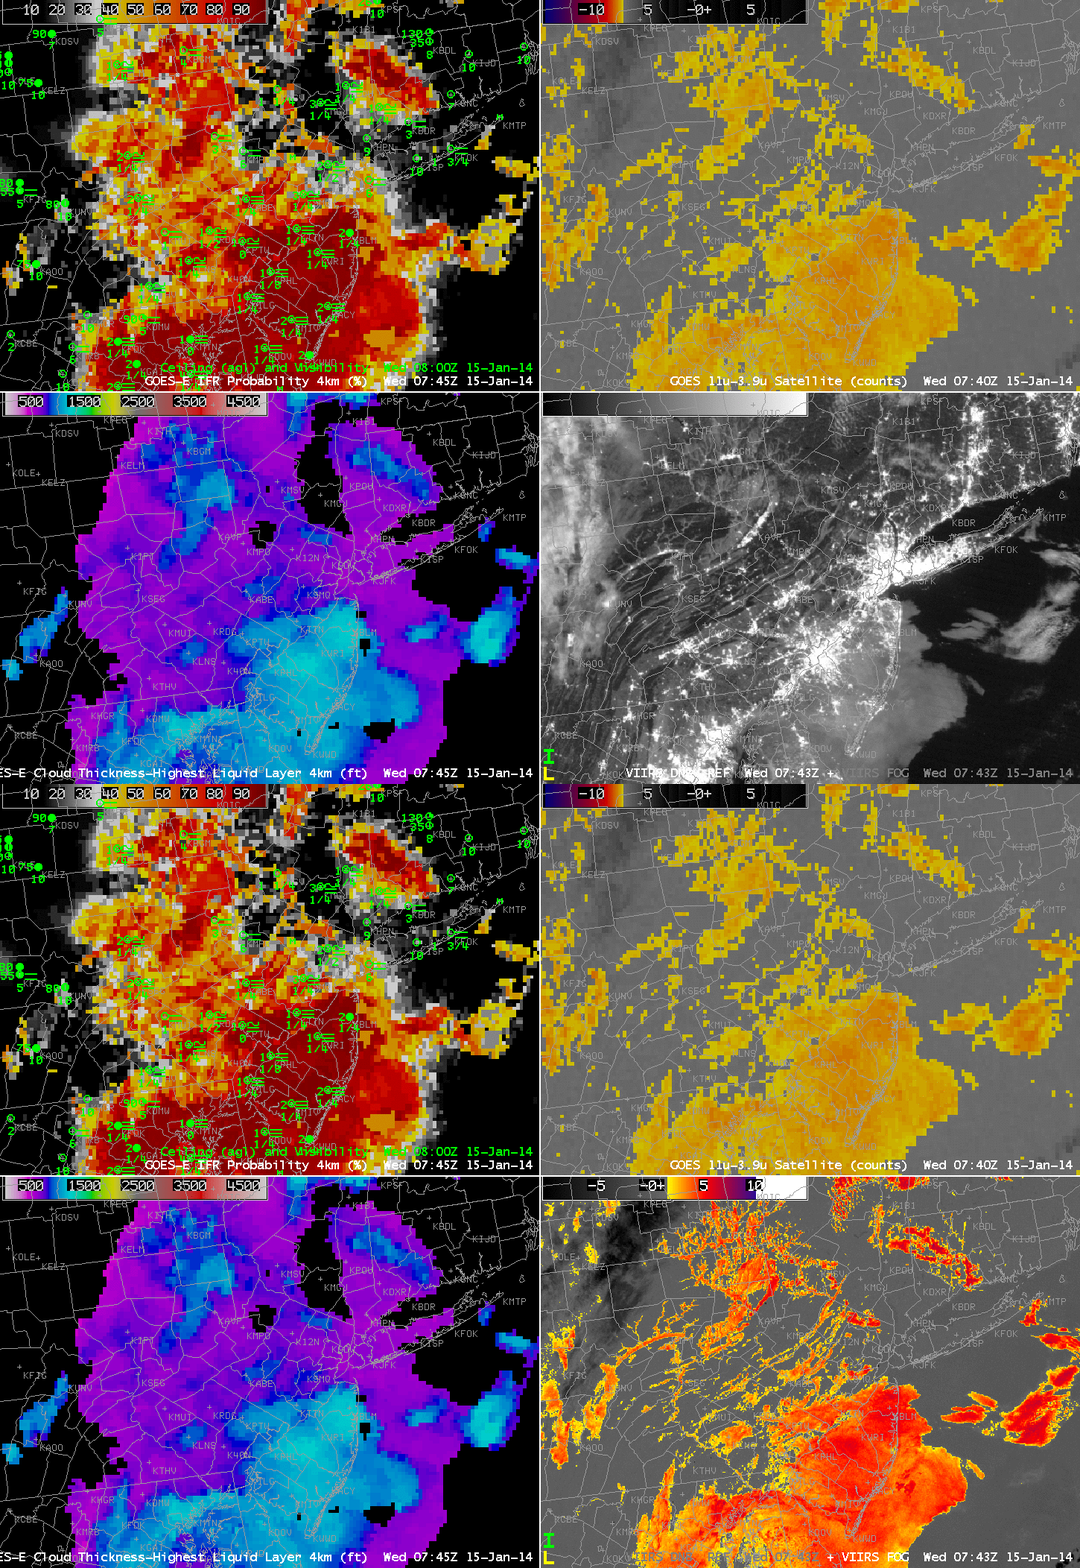
GOES-East IFR Probabilities and surface plots of visibilities/ceilings at 0615 UTC 15 January (Upper Left), GOES-East Brightness Temperature Difference (10.7 µm – 3.9 µm), 0615 UTC 15 January (Upper Right), GOES-R Cloud Thickness, 0615 UTC 15 January (Lower Left), and Suomi/NPP Day/Night Band and Brightness Temperature Difference toggle (11.35 µm – 3.74 µm), 0605 UTC 15 January (Lower Right)(click image to enlarge)
The image above documents the GOES-R IFR Probability field during a fog event over the East Coast. Note how the IFR Probability field shows more horizontal uniformity than the traditional brightness temperature difference field over eastern Pennsylvania (where IFR conditions are reported). For example, both Selinsgrove along the Susquehanna and Reading in south-central Pennsylvania report IFR conditions in regions where the IFR Probability field has a strong return, but where the brightness temperature difference field’s diagnosis is less certain.

The Suomi/NPP field demonstrates the importance of higher resolution from polar orbiting satellites. Both the Day/Night Band and the brightness temperature difference fields suggest the presence of river valley fog over the West Branch of the Susquehanna and its many tributaries in central Pennsylvania. This continues at 0743 UTC, below, when Suomi/NPP’s subsequent overpass also viewed the Susquehanna valley. At both times, the river fog is too small-scale to be detected with GOES-13’s nominal 4-km pixel size.

VIIRS_DNB_FOG_20140115toggle

GOES-East IFR Probabilities and surface plots of visibilities/ceilings at 0745 UTC 15 January (Upper Left), GOES-East Brightness Temperature Difference (10.7 µm – 3.9 µm), 0745 UTC 15 January (Upper Right), GOES-R Cloud Thickness, 0745 UTC 15 January (Lower Left), and Suomi/NPP Day/Night Band and Brightness Temperature Difference toggle (11.35 µm – 3.74 µm), 0743 UTC 15 January (Lower Right)(click image to enlarge)
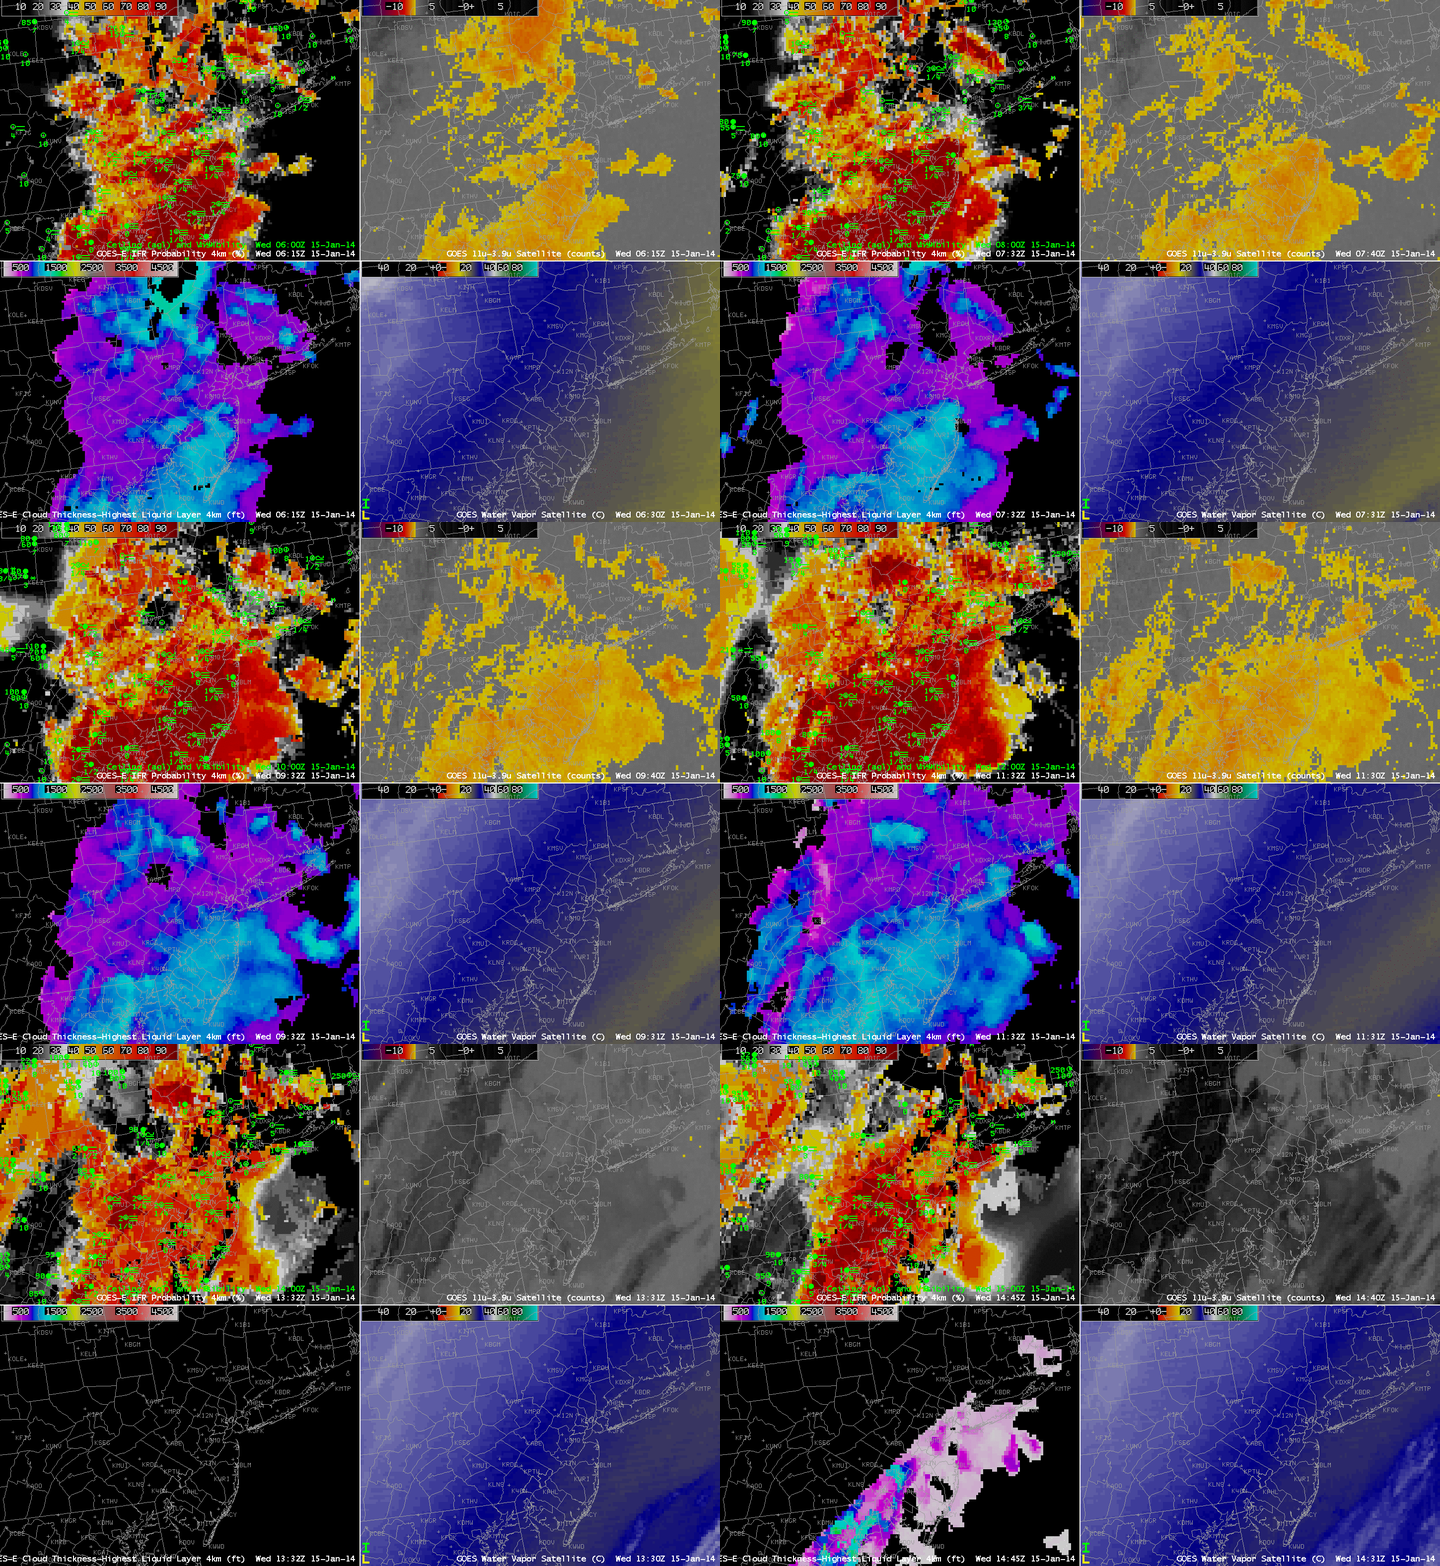
The animation of the fields, below, done to demonstrate the importance of GOES-13’s temporal resolution, shows how the GOES-R IFR Probability field accurately captures the extent of the fog, even as the sun rises and causes the sign of the brightness temperature difference to flip. The traditional brightness temperature difference field has difficulty both in maintaining a signal through sunrise, and it diagnosing the region of fog/low stratus over northcentral Pennsylvania in and around the Poconos and in the Susquehanna River valley. The IFR Probability field has a minimum over/around Mt. Pocono, where IFR conditions are not observed until close to sunrise. IFR probabilities are small over Altoona, where the brightness temperature difference field shows a strong signal developing late at night (and where observations suggest an elevated stratus deck). In this region, although the satellite suggests fog might be present, model conditions do not agree, and IFR Probabilities are correctly minimized.

GOES-R Cloud thickness suggests that the thickest blanket of fog is over New Jersey. This diagnosis continues up through the twilight conditions of sunrise, at which point Cloud thicknesses are no longer diagnosed.

GOES_IFR_PROB_20140115loop

GOES-East IFR Probabilities and surface plots of visibilities/ceilings (Upper Left), GOES-East Brightness Temperature Difference (10.7 µm – 3.9 µm) (Upper Right), GOES-R Cloud Thickness (Lower Left), and GOES-East Water Vapor (6.7 µm), all times as indicated (Lower Right)(click image to enlarge)
Widespread Advection Fog over the Midwest

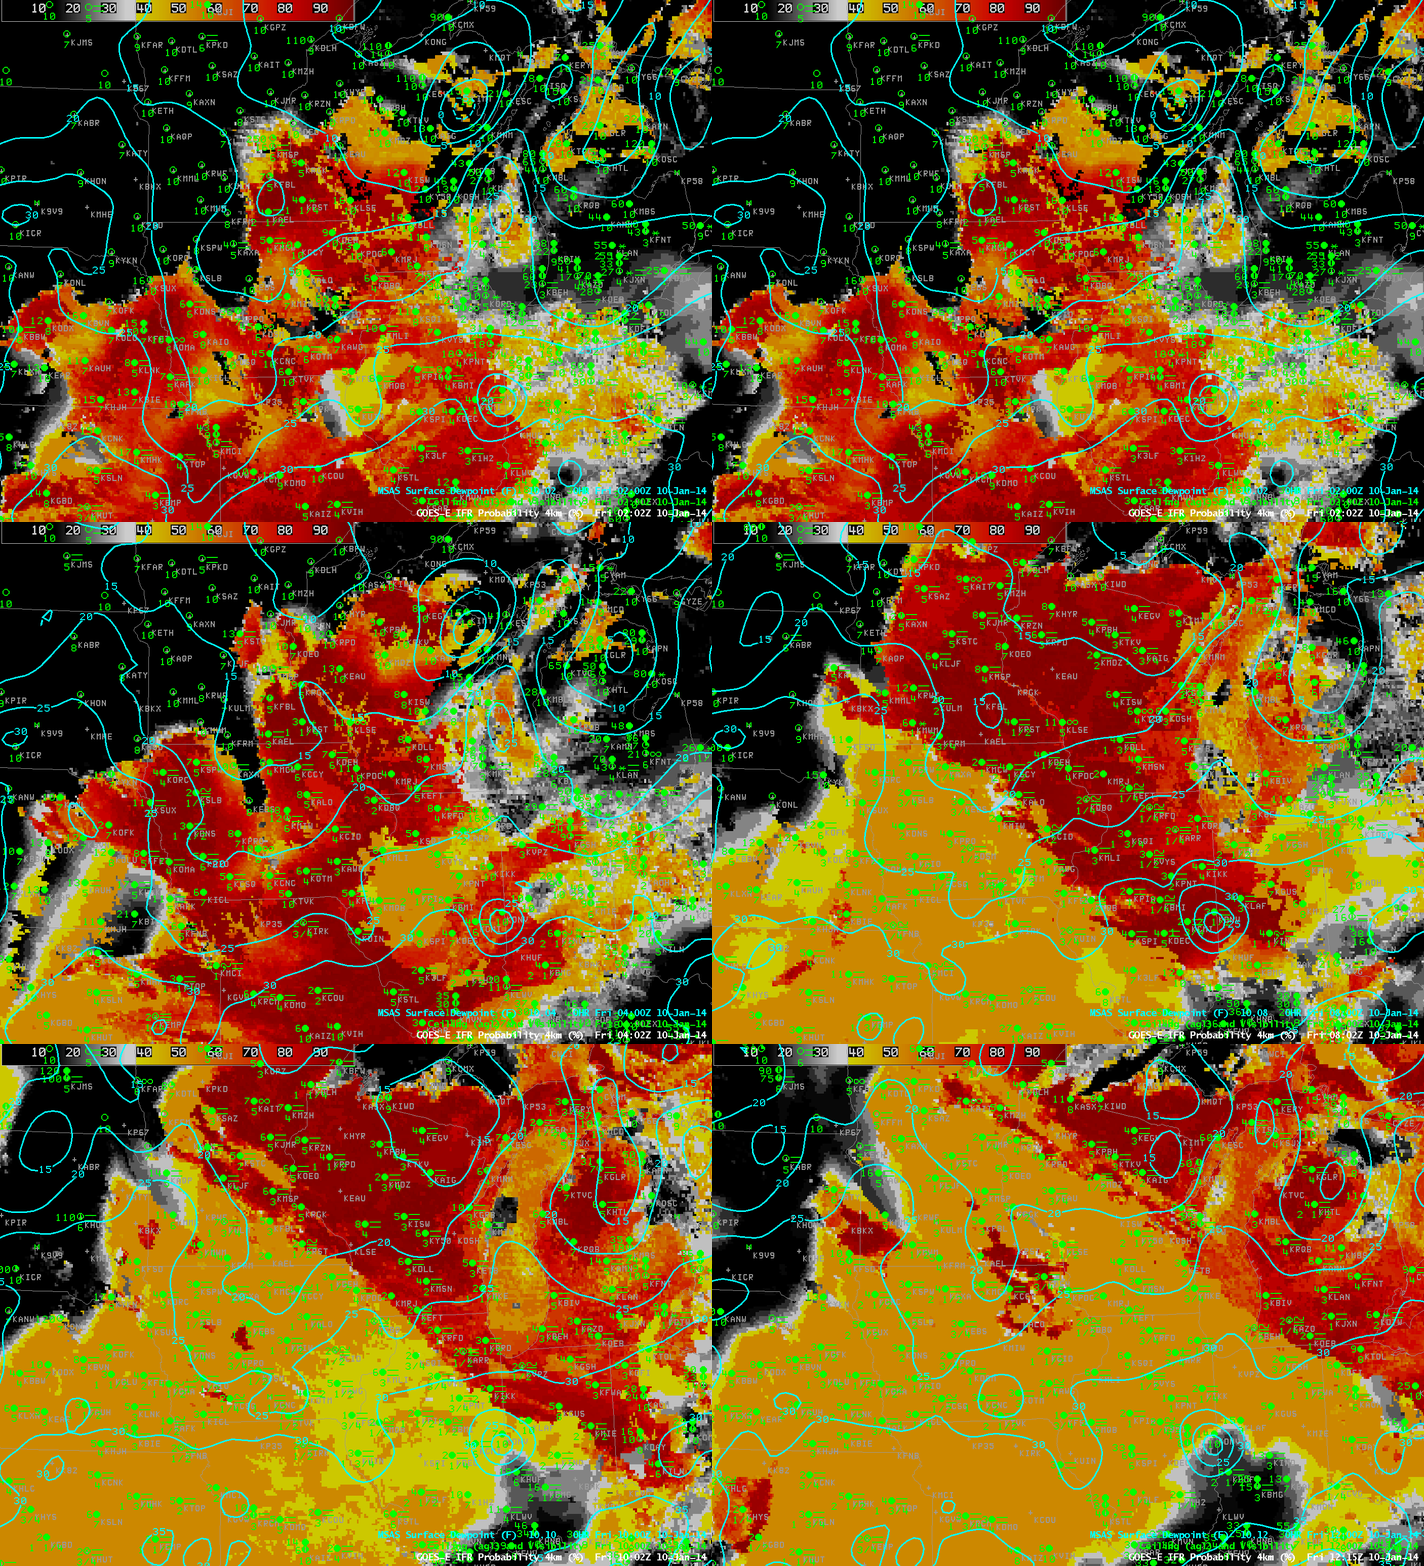
GOES_IFR_PROB_20140110loop

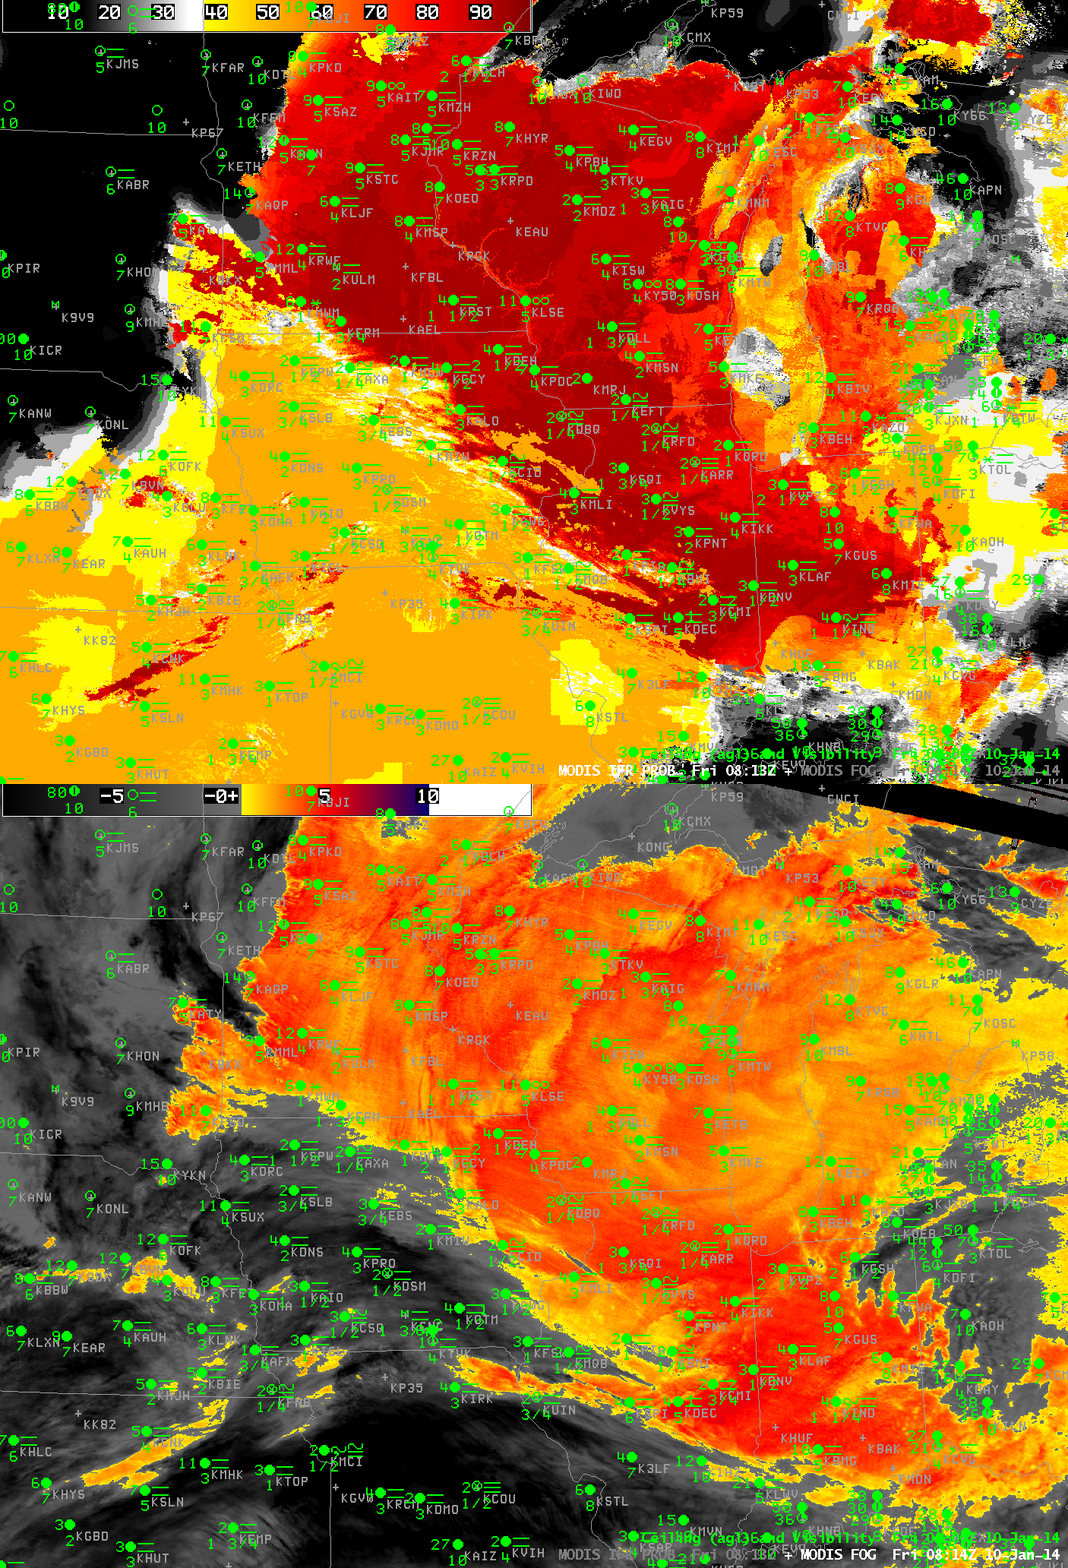
GOES-East IFR Probabilities and surface plots of visibilities/ceilings and surface analysis of dewpoint at 0202, 0402, 0615, 0802, 1002 and 1215 UTC on 10 January 2014 (click image to enlarge)
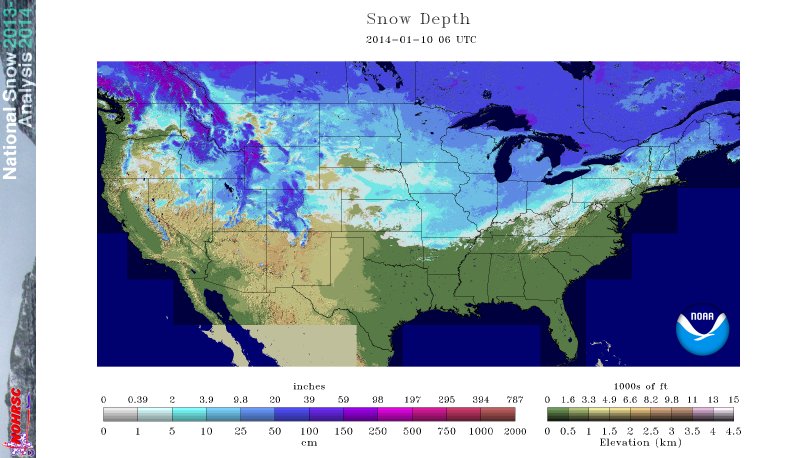
The northward movement of moist air over a snow-covered surface allowed for widespread advection fog in the midwest overnight from January 9th to 10th. The animation, above, shows GOES-R IFR Probabilities at 2-hour time steps. Included in the plots are surface observations and cloud ceilings (documenting the widespread region of IFR conditions) and the RTMA Dewpoint analysis that shows the slow northward movement of dewpoints at the surface. As this moist air moves over the cold snow-covered surface (the snow analysis from the National Operational Hydrological Remote Sensing Center is below), advection fog is a result. The GOES-R IFR Probability fields do a fine job of outlining where the IFR conditions are observed.

nsm_depth_2014011005_National

Analysis of snow depth from NOHRSC, 0600 UTC, 10 January 2014 (click image to enlarge)
Note in the animation above how the presence of higher clouds moving up from the southwest affects the IFR Probability fields. As high clouds overspread the advection fog, satellite data can no longer be incorporated into the GOES-R IFR probability algorithm, and IFR Probabilities drop, in this case from values near 90% to values near 55%.

Polar-orbiting data can also give information about low clouds and fog. Temporal resolution is far superior to geostationary, as shown below. In cases of small-scale fog, polar orbiter data can give important information by identifying the first region of a developing fog. In large-scale cases such as this, high-resolution data can better identify edges to the fields. The MODIS data in this case does show high probabilities over the midwest; the brightness temperature difference field shows evidence of high clouds from central Iowa southwestward. As with the GOES data, the presence of high clouds results in lower IFR Probabilities.

MODIS_FOG_IFR_20140110_0814

Toggle between MODIS-based IFR Probabilities and Brightness Temperature Difference at 0814 UTC 10 January 2014 (click image to enlarge)
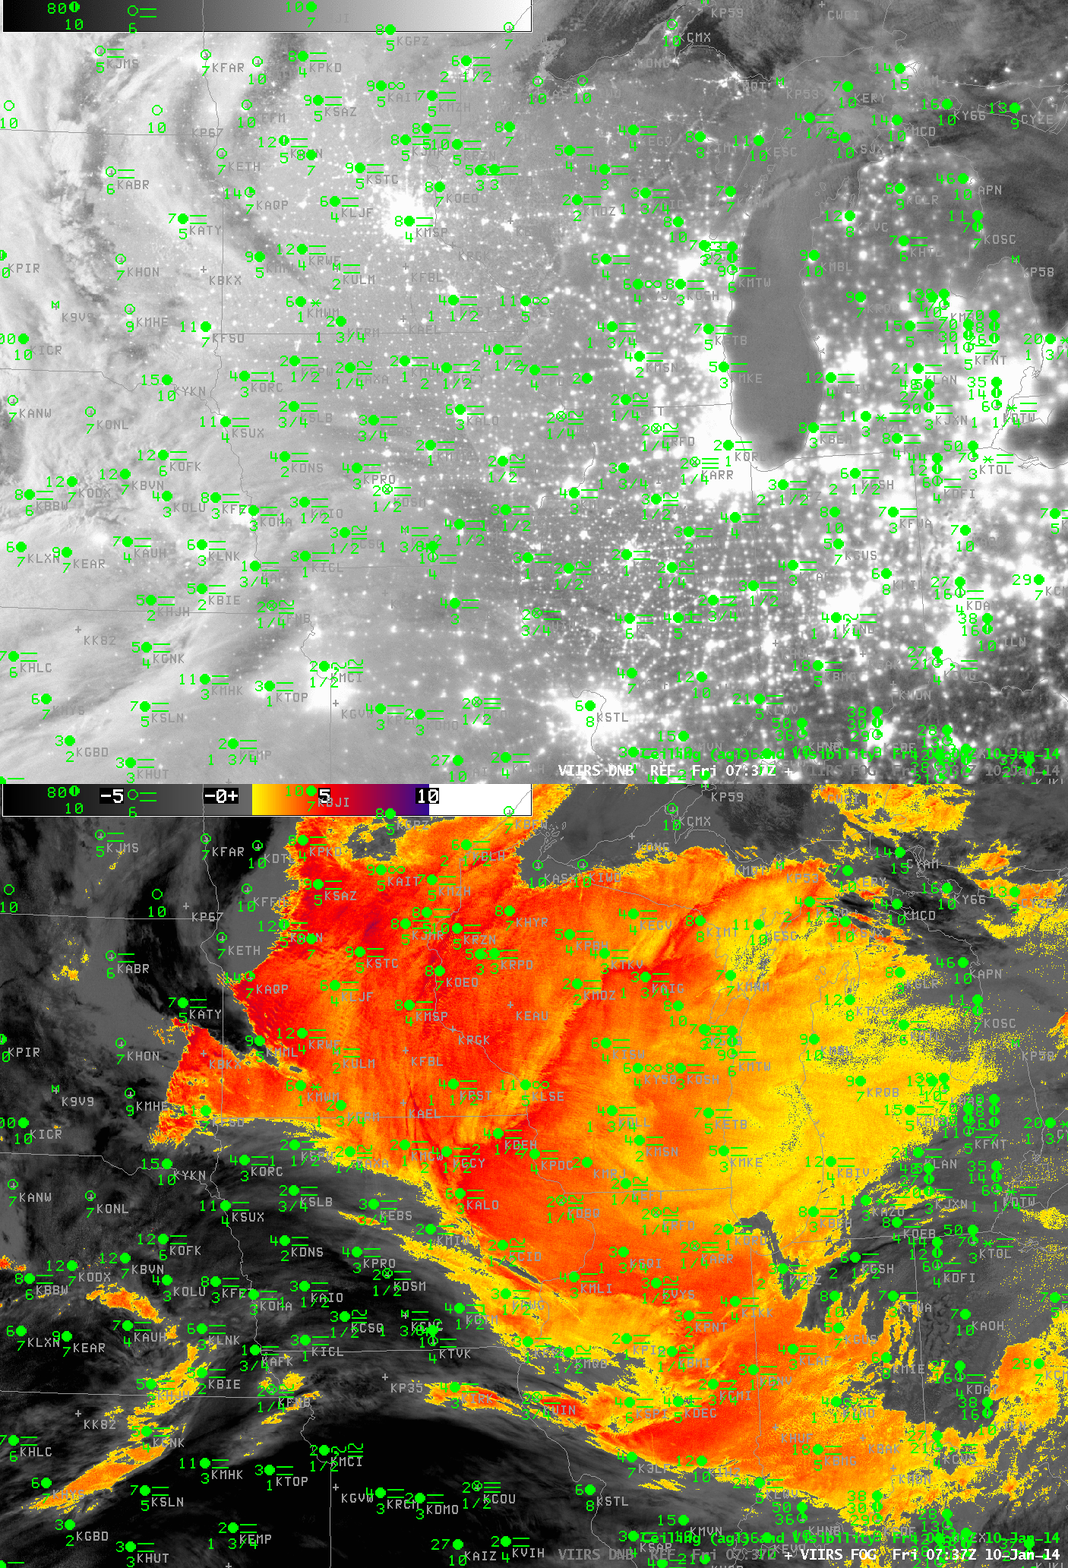
Suomi/NPP data, below, from the Day/Night band shows widespread cloudiness over the midwest. The clouds are illuminated by the moon, nearly full, setting at this time in the west. Shadows are being cast by high clouds on the lower clouds over western Minnesota. The brightness temperature difference fields from Suomi/NPP are very similar to the MODIS data. In contrast to MODIS, the VIIRS instrument does not have a water vapor sensor, so the IFR Probability algorithms are not directly transferable to Suomi/NPP VIIRS data.

VIIRS_FOG_DNB_20140110_0737

Toggle between Suomi/NPP Day/Night band and Brightness Temperature Difference at 0737 UTC 10 January 2014 (click image to enlarge)