 |
| Animation of GOES-R IFR probabilities (upper left), GOES-R Cloud Thickness (upper right), GOES-East Brightness Temperature Differences (lower left), and Visible Imagery (lower right), from 0400 through 1400 UTC on 6 August 2012 |
River Valleys — sources of moisture — are nearly sub-pixel scale in GOES-East imagery. Thus, any signal that develops in a river valley will likely take time to appear, and an example of that occurred over the upper Midwest on the morning of August 6th. The signal develops along the river starting around 0800 — 0900 UTC (LaCrosse, WI, starts to report visibility and ceiling obstructions at 1000 UTC). There are several interesting aspects in the loop.
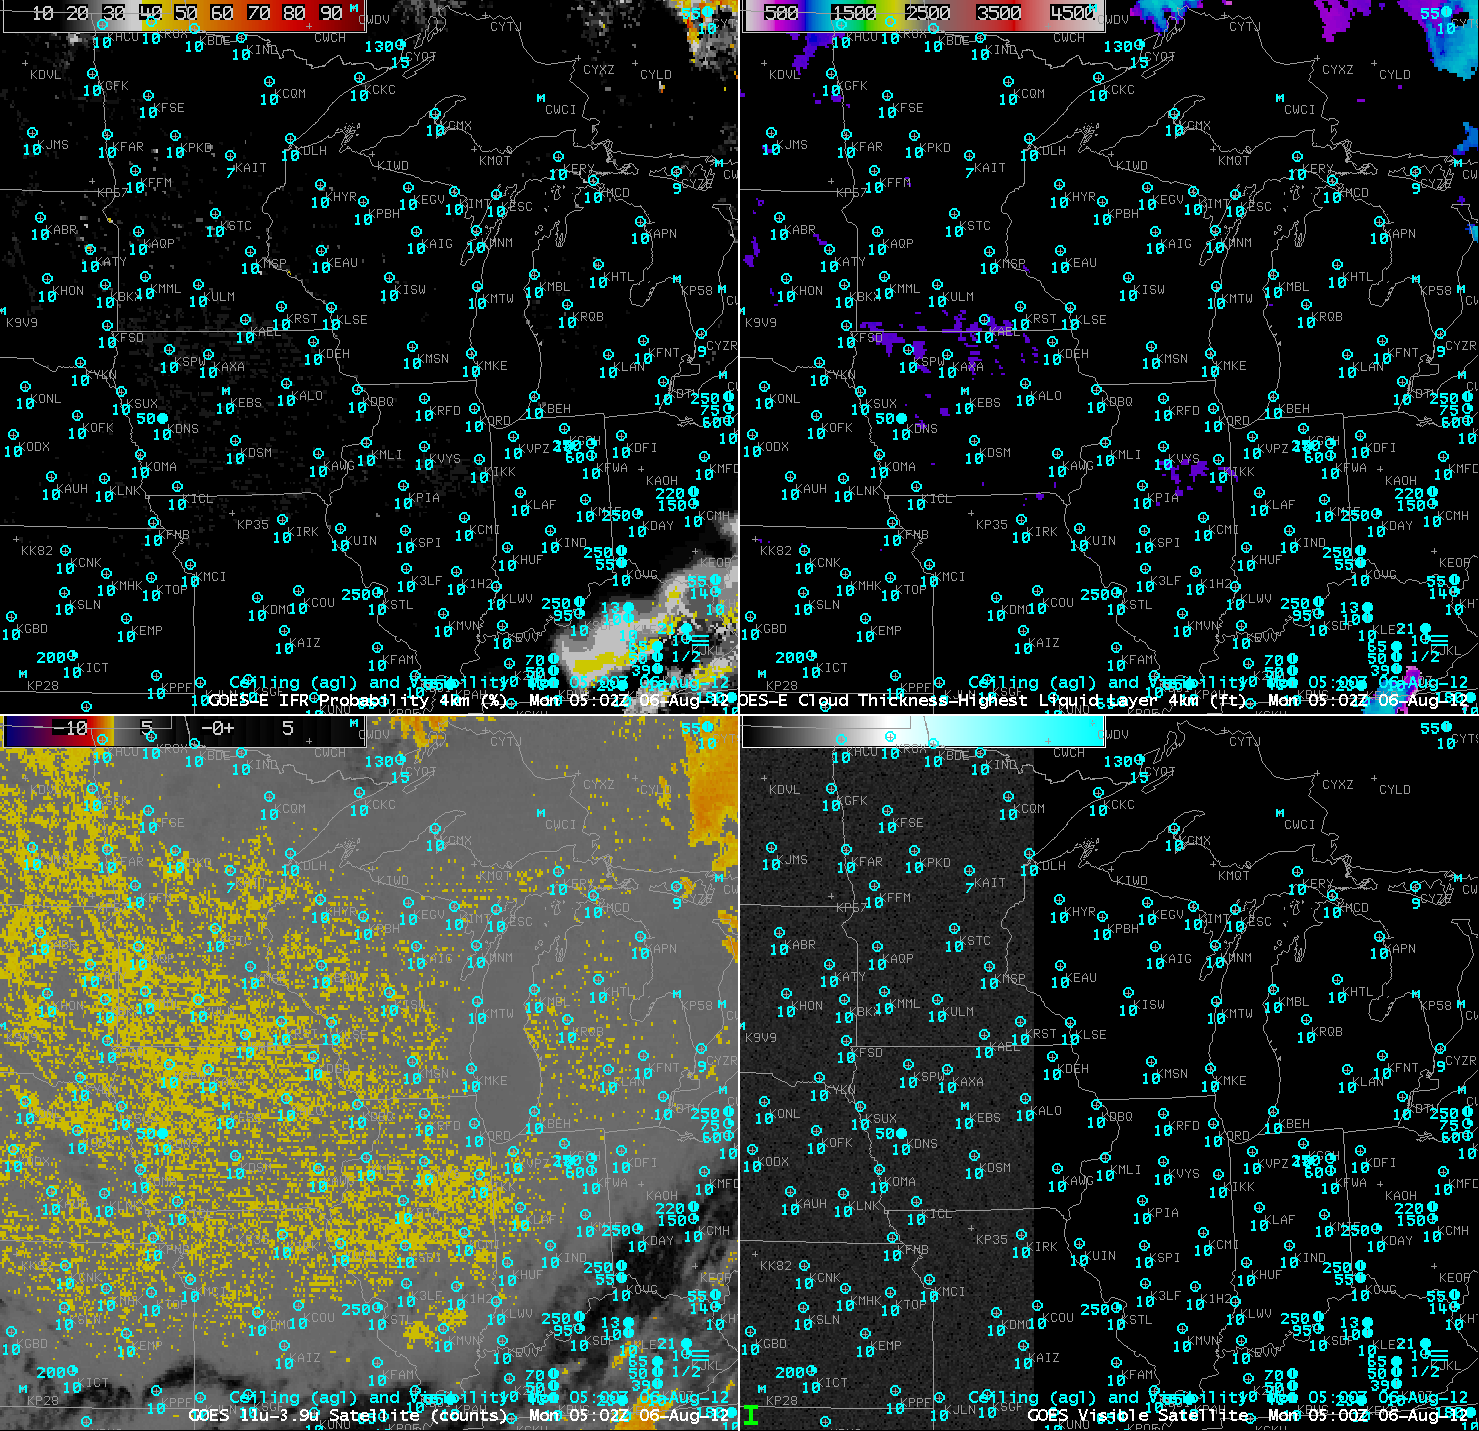 |
| GOES-R IFR probabilities (upper left), GOES-R Cloud Thickness (upper right), GOES-East Brightness Temperature Differences (lower left), and Visible Imagery (lower right), at 0502 UTC on 6 August 2012 |
The imagery at 0502 UTC (above) shows the result of stray light contamination on the brightness temperature difference field (lower left), but this increase in signal over the Plains is ephemeral, and it is gone in 15 minutes. There is also an increase in the brightness temperature difference signal over the Plains as sunrise approaches.
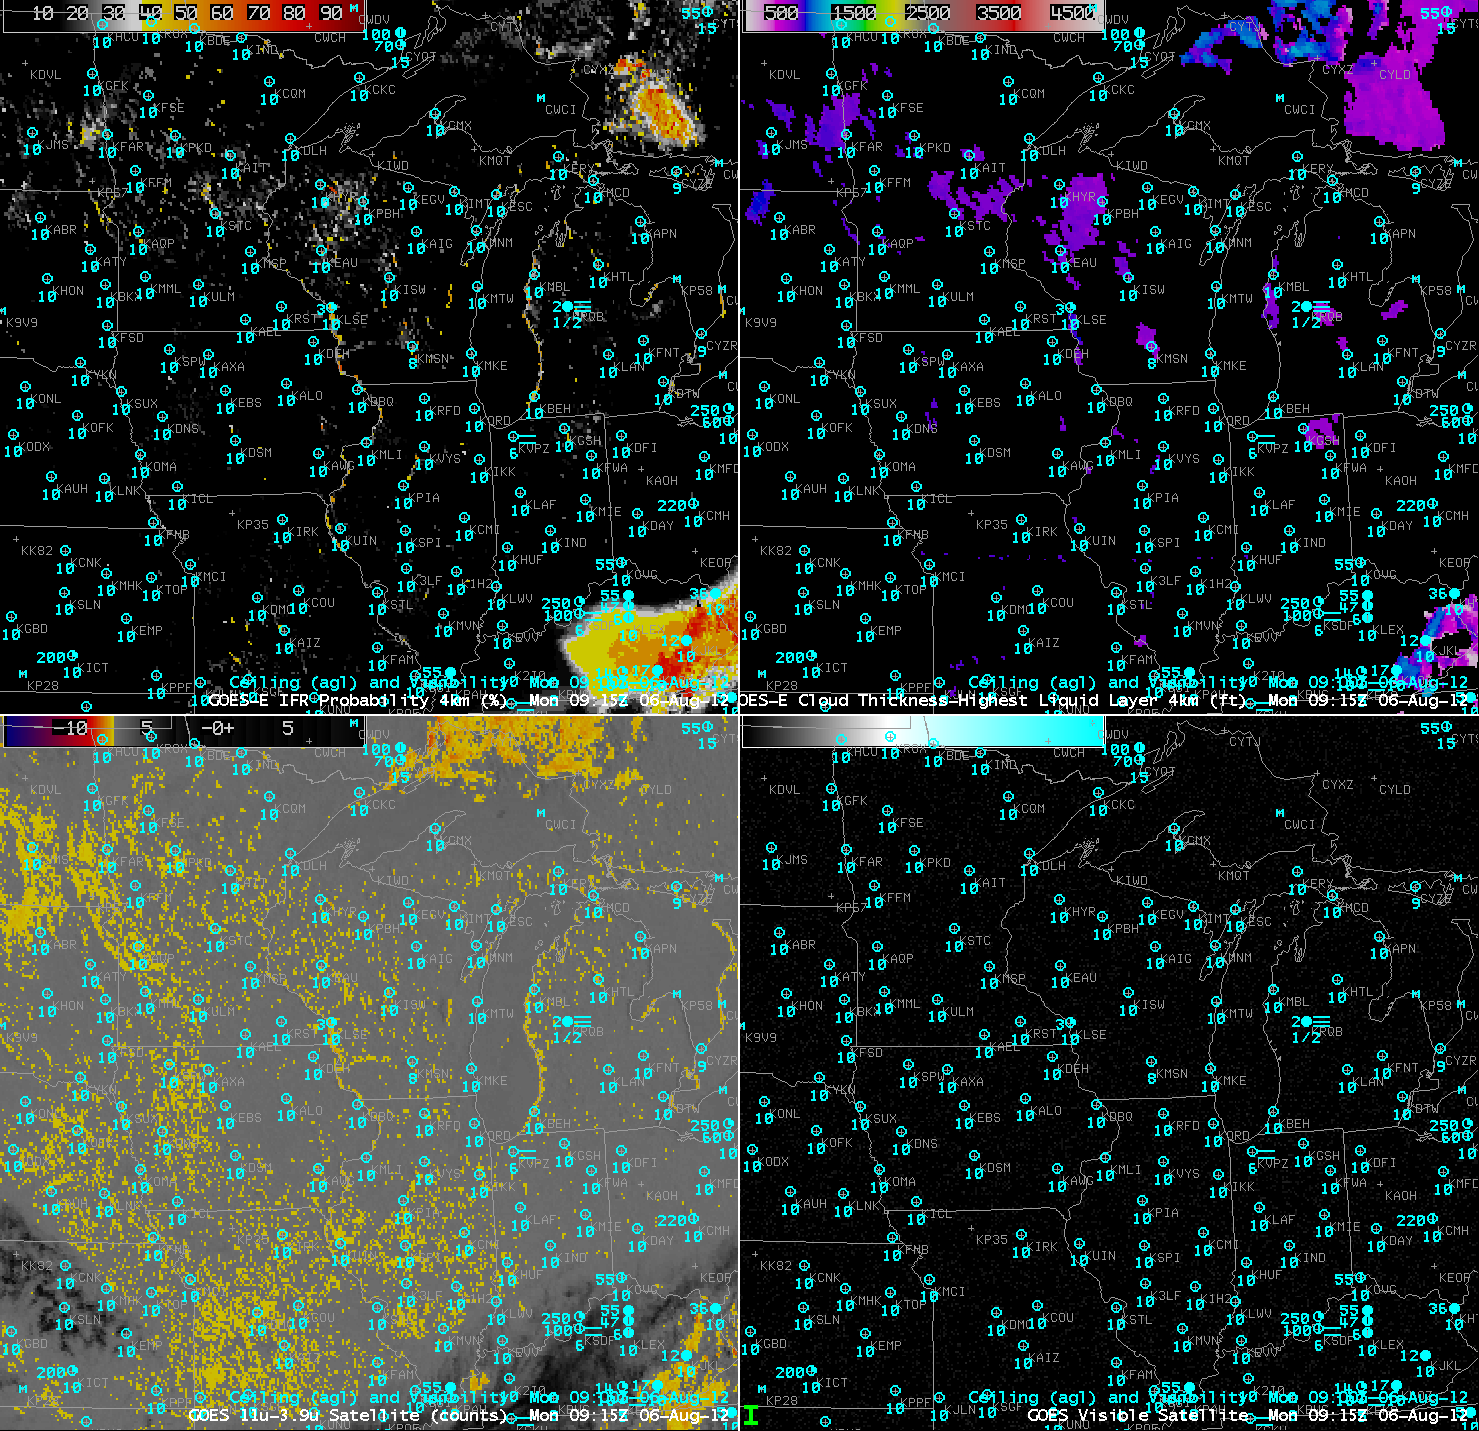 |
| GOES-R IFR probabilities (upper left), GOES-R Cloud Thickness (upper right), GOES-East Brightness Temperature Differences (lower left), and Visible Imagery (lower right), at 0915 UTC on 6 August 2012 |
By 0915 UTC, the GOES-R IFR probabilities have increased slightly along the Wisconsin River in southwest Wisconsin, as has the brightness temperature difference signal (although that signal has increased elsewhere as well where the GOES-R IFR probabilities remain low). Compare the (relatively) low-resolution GOES-based imagery to the higher resolution Suomi/NPP resolution discussed here. Note also how the GOES-R IFR probability product correctly suppresses the IFR probabilities over Iowa and Missouri where observations show no obstructions to visibility.