Monthly Archives: July 2012

How to validate GOES-R IFR in regions with no surface observations

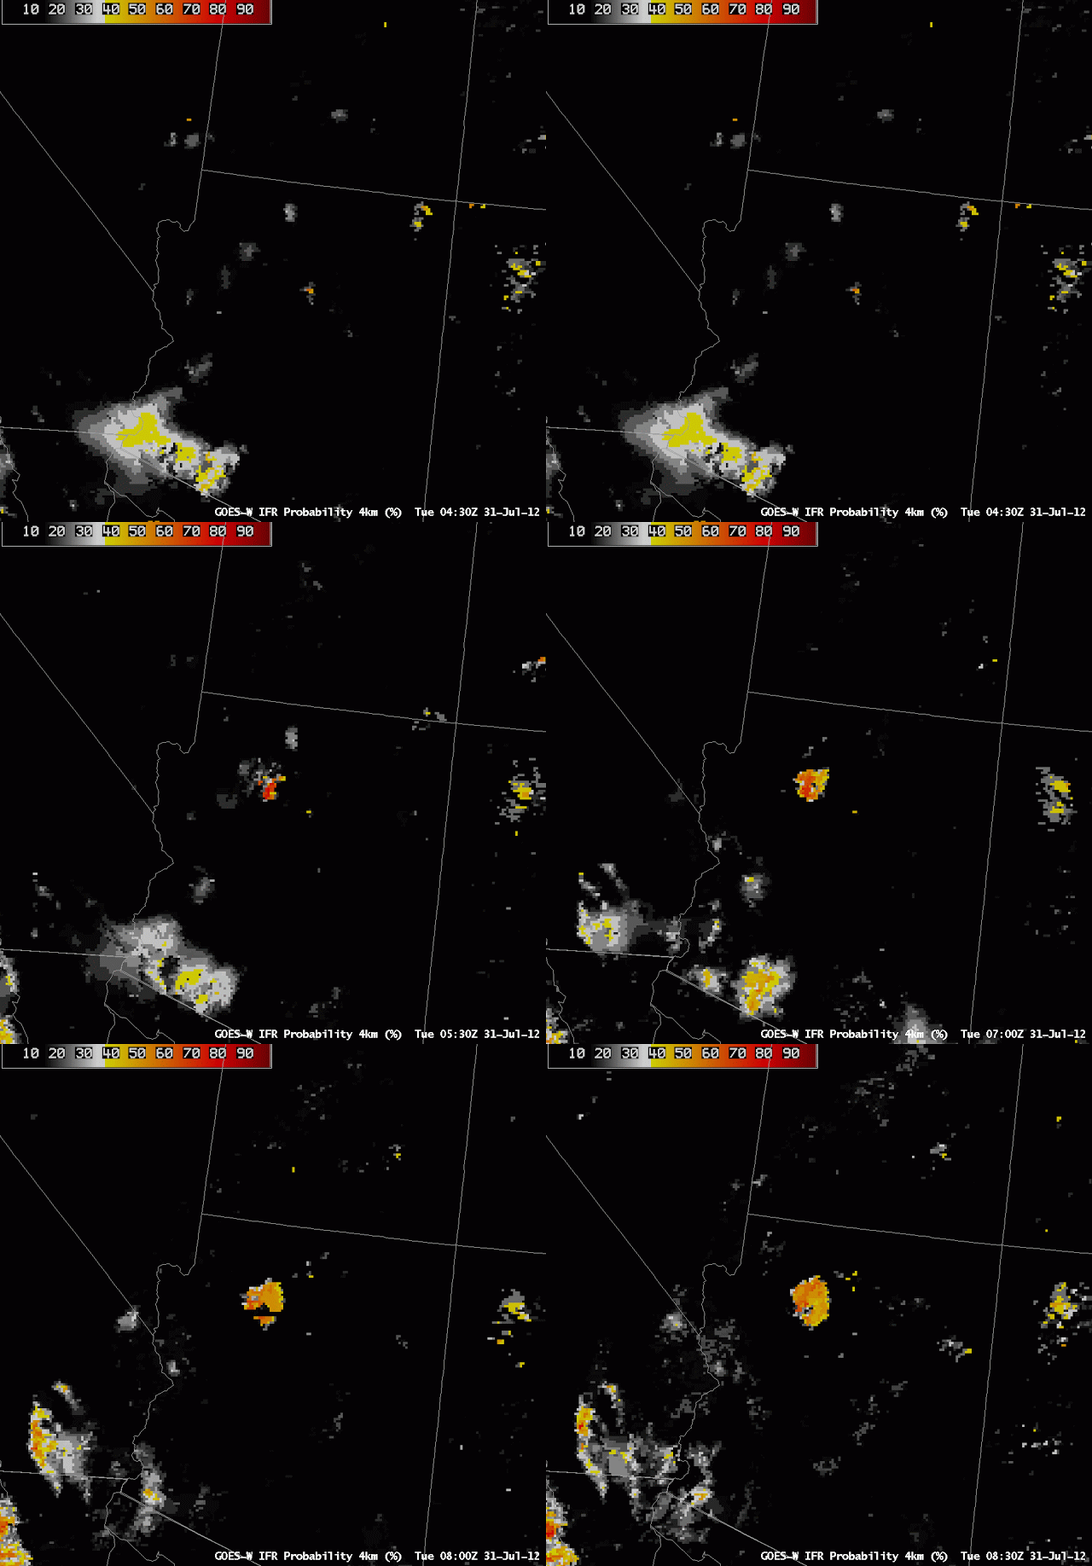
Animation of GOES-W IFR Probabilities over Arizona, half-hourly from 0430 UTC to 0800 UTC 31 July 2012

The animation of GOES-R IFR Probabilities over north-central Arizona shows the development of relatively high probabilities as the night progresses, an evolution that is consistent with the formation of radiation fog.  However, there are no surface observations routinely taken in the region to verify the presence of IFR conditions, or even clouds.  How much credence should be given to such a field?

GOES-R IFR Probabilities from GOES-West (upper left), Suomi-NPP Day/Night band imagery (upper right), Surface observations (lower left), GOES-West color-enhanced window channel (lower right), times as indicated.

A serendipitous Suomi-NPP overpass shows a region of clouds neatly outlined by the GOES-W IFR probabilities. Although the Day/Night band cannot give ceiling heights or visibilities (that is, it cannot alone determine if IFR conditions are occurring), it does show the presence of low clouds.

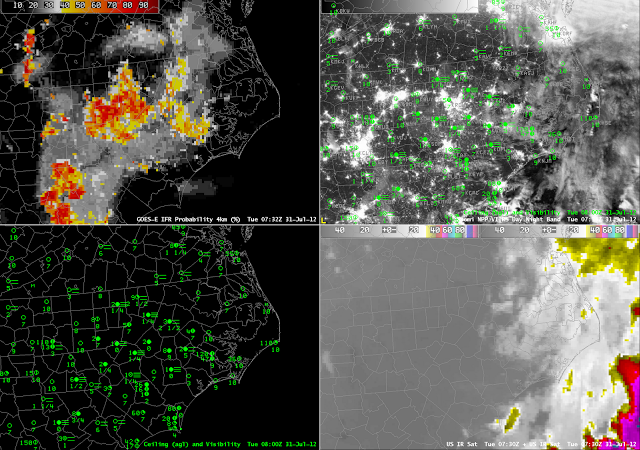
An earlier Suomi/NPP overpass over the eastern United States overflew a second developing region of enhanced IFR probabilities, over the piedmont from North Carolina southwestward into South Carolina (below).  The city lights of the Carolinas make it more difficult to detect cloud edges, although evidence of one does exist between Camden SC (KCDN) and Fairfield CO Airport (KFDW).  This is a also a region where IFR probabilities quickly drop from high values (near KCDN, where there is fog with 100-foot ceilings) to low (near KFDW, which reports clear skies).

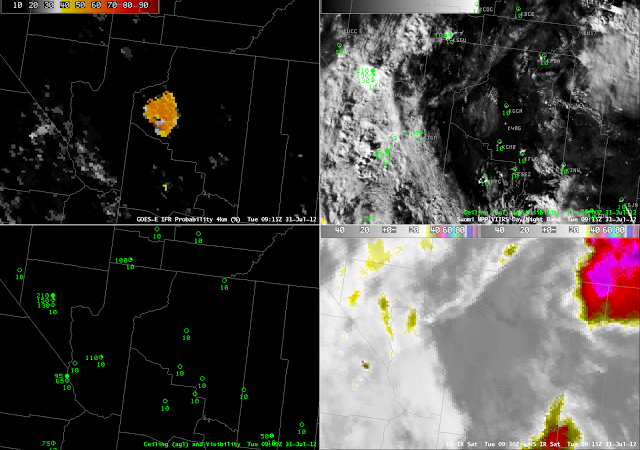
GOES-R IFR Probabilities from GOES-East (upper left), Suomi-NPP Day/Night band imagery (upper right), Surface observations (lower left), GOES-West color-enhanced window channel (lower right), times as indicated.

GOES-R Probabilities are too low: Why?

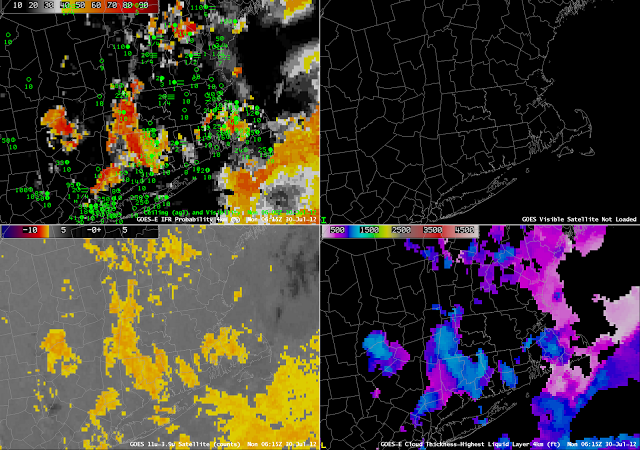
GOES-R IFR Probabilities (upper left), GOES-East Visible imagery (upper right), Brightness temperature difference between 10.7 and 3.9 micrometers (lower left), GOES-R Cloud Thickness (lower right)

The imagery above shows high IFR probabilities over western Massachusetts — where IFR conditions are not observed — and very low probabilities in central Massachusetts in and near the Connecticut River Valley where IFR conditions are observed.  The brightness temperature difference in central Massachusetts is not suggestive of low clouds and fog.  For the IFR probability to be high there, then, would require that the Rapid Refresh Model showed saturation in the lower part of the model atmosphere.  Thus, the fused product could show higher probabilities in this region where fog is observed.  However, as shown below, relative humidity in the lowest part of the model was actually a relative minimum over central Massachusetts.

Two-hour forecasts of Relative Humidity from the Rapid Refresh, all valid at 0600 UTC from the 0400 UTC model run;  Lowest 30 mb of the model (upper left), lowest 60 mb of the model (upper right), lower 90 mb of the model (lower left), surface (lower right)
Two-hour forecasts of Relative Humidity from the Rapid Refresh, all valid at 0800 UTC from the 0600 UTC model run;  Lowest 30 mb of the model (upper left), lowest 60 mb of the model (upper right), lower 90 mb of the model (lower left), surface (lower right)

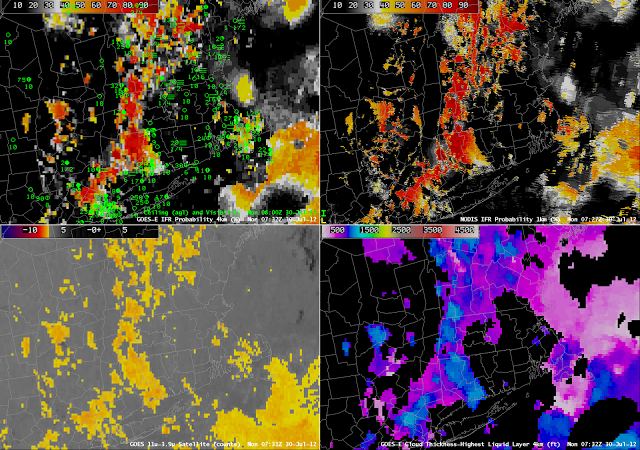
By 0730 UTC, the satellite brightness temperature difference product (below) is starting to suggest that fog/low clouds are more widespread (A MODIS image at the same time tells the same tale).  As that happens, the IFR probabilities start to increase.

GOES-R IFR Probabilities computed from GOES-East imager data (upper left), GOES-R IFR probabilities computed from MODIS data (upper right), Brightness temperature difference between 10.7 and 3.9 micrometers (lower left), GOES-R Cloud Thickness (lower right)
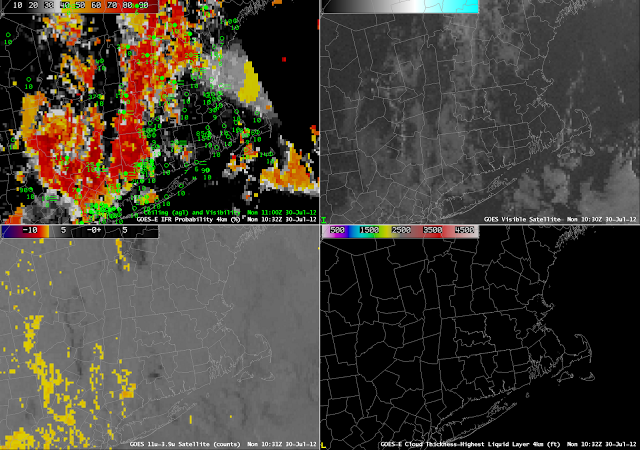
GOES-R IFR Probabilities (upper left), GOES-East Visible imagery (upper right), Brightness temperature difference between 10.7 and 3.9 micrometers (lower left) at 1032 UTC, GOES-R Cloud Thickness (lower right) not shown because of twilight conditions

The 1032 UTC imagery (above) shows the very small scale of this fog feature that is in central Massachusetts.

The Terminator

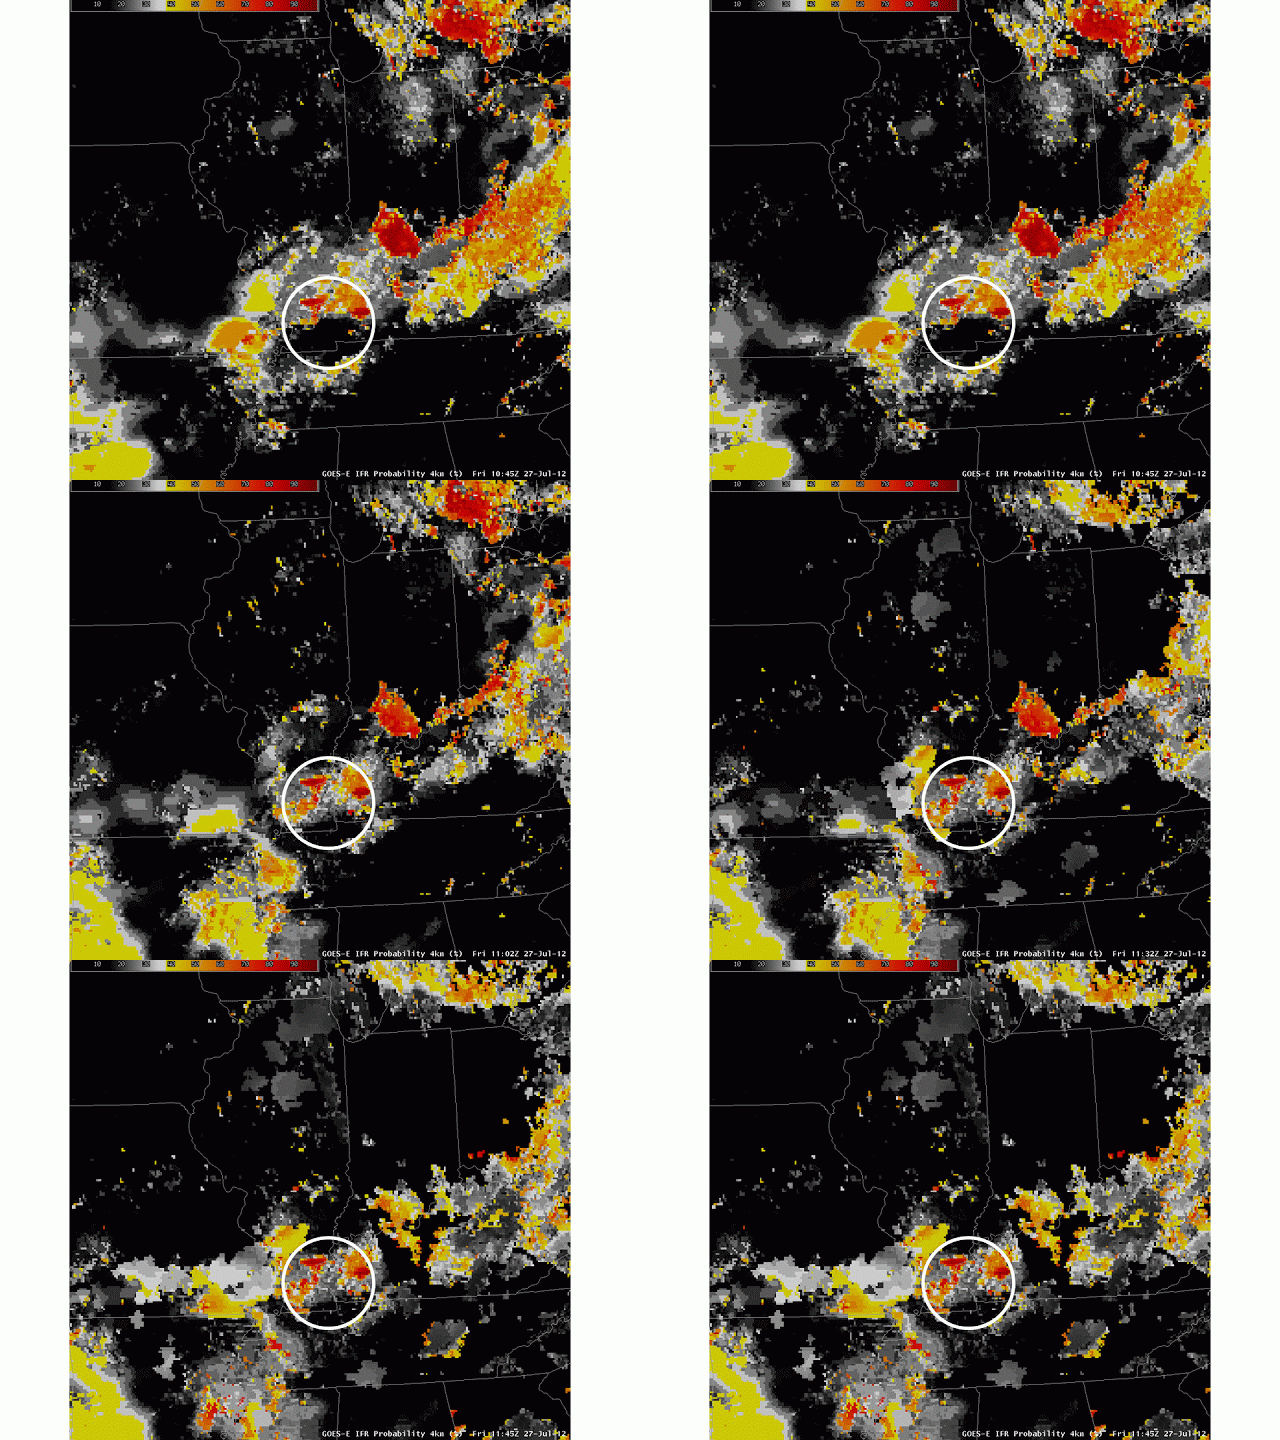
GOES-R IFR Probabilities near sunrise on 27 July 2012

The loop above demonstrates an artifact of the GOES-R IFR probabilities that occurs due to the terminator.  Note how values within the circled region are constant for the last three images.   When the solar zenith angle is between 85-90 degrees there is a stabilizing temporal aspect to the algorithm. In these 5 degrees (just after sunrise), the last nighttime satellite parameters from an angle >90 degrees are kept and used (and re-used) because the visible channels are not reliable at such high solar zenith angles. Current Rapid Refresh model information is used, but if the model data doesn’t vary greatly over this timeframe then it is likely that the same information will be used for the Bayesian model, thus resulting in the same probability values. This approach reduces significant artifacts in the terminator region where FLS detection is complicated by a low sun angle and the attendant rapid changes in reflectivity.

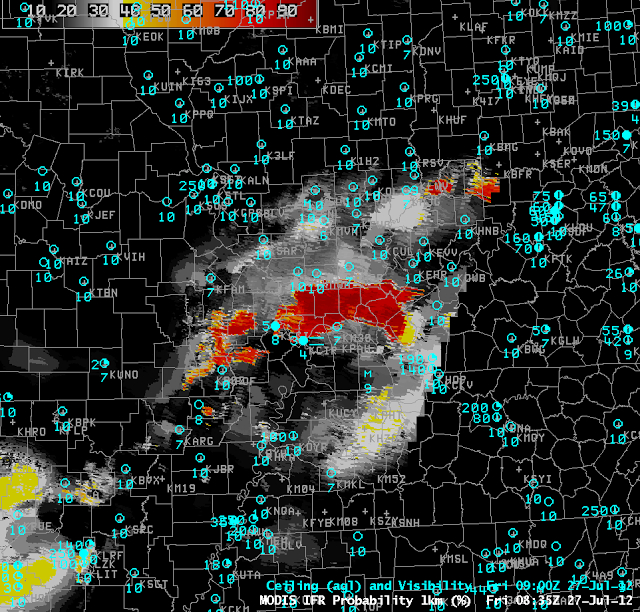
MODIS-based IFR probabilities at 0835 UTC.  Because western Kentucky is at the edge of the MODIS scan, some bow-tie correction artifacts are present.  Nevertheless, high probabilities nicely correspond to observations of reduced visibilities/ceilings.

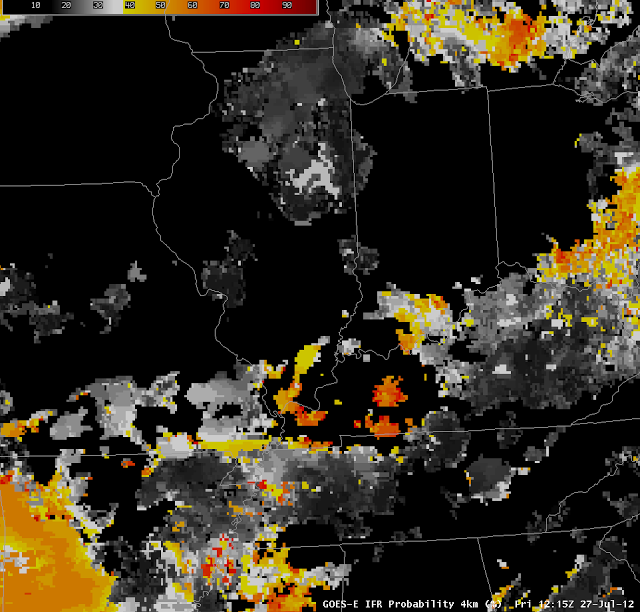
Note that this is occurring in a region of fog as evidenced by the MODIS-based IFR probabilities at 0900 UTC (above).  The image at 1215 UTC (below), 30 minutes after the end of the animation above, shows how the IFR probabilities have evolved as the sun rises.

GOES-R IFR Probabilities as computed from GOES-East information, 1215 UTC on 27 July 2012.

Spatial and Temporal Resolution

GOES-R IFR Probabilities computed from MODIS data (upper left) and from GOES-East data (lower left);  Ceiling and visibility observations (upper right) and 10.7-micrometer brightness temperatures from GOES-East (lower right)

GOES-R IFR Probabilities can be computed using GOES-East Imager data (the Imager has 5 radiometric channels), with a nominal resolution of 4 kilometers at the sub-satellite point (The Equator, at 75 degrees W for GOES-East;  Actual resolution in the upper midwest is closer to 5 or 6 kilometers).  IFR Probabilities can also be computed using MODIS data from Terra or Aqua;  the MODIS instrument yields information at 36 different radiometric channels, with a nadir resolution of 1 km.  Thus, small-scale features, such as river valleys, or ridge-tops, are far more likely to be visible in the data.  However, MODIS data are available infrequently because Terra and Aqua are polar orbiters, and each satellite passes over a location in the upper Midwest only 2 times daily.

The strength of GOES-R IFR imagery is its temporal resolution.  Routine imaging every 15 minutes is typical, and that allows observations of fog development, as shown in the loop below.  The increase in GOES-R IFR probabilities alerts the forecaster to a region of interest, where more vigilant monitoring of sky conditions may be warranted.  The surface observations do show decreasing visibilities and ceilings where the IFR probabilities are increasing;  that is, the IFR probabilities and actual observations are consistent.

GOES-R IFR Probabilities computed using GOES-East imager data and surface observations of visibility and ceiling from 0400 UTC to 1400 UTC on 26 July 2012.

The ABI (Advanced Baseline Imager) on GOES-R will have twice the resolution of the current GOES Imager (that is, 2 kilometer for infrared channels at the subsatellite point) and higher temporal resolution as well.

IFR Probabilities under a Thick Cloud Deck

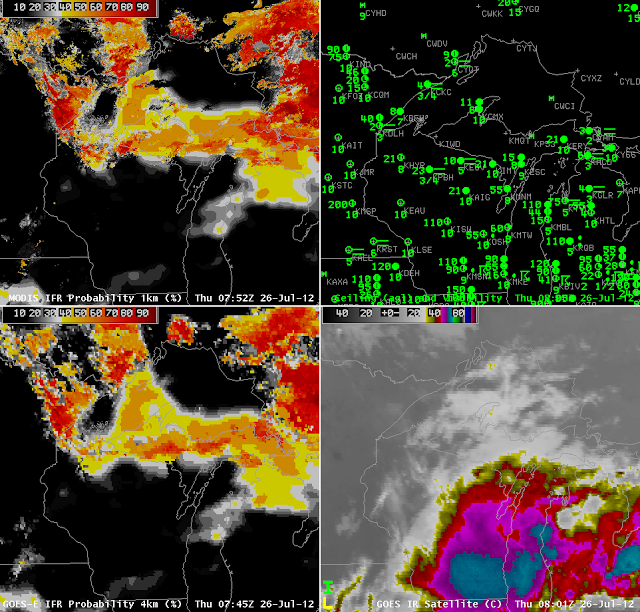
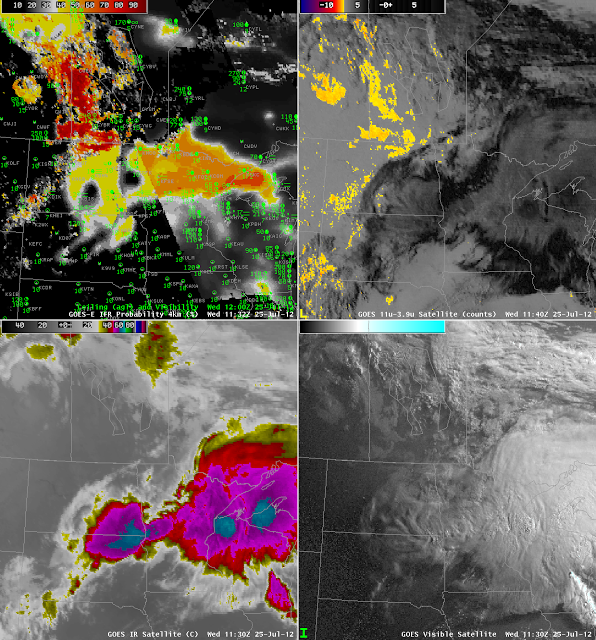
GOES-R IFR Probabilities at 1132 UTC with 1200 UTC surface Observations (Upper left), GOES-East Brightness Temperature Difference (10.7 micrometer brightness temperature – 3.9 micrometer brightness temperature) at 1130 UTC (upper right), GOES-East 10.7 micrometer brightness temperature (lower left) and GOES-East Visible imagery at 1130 UTC (lower right).

Convection developed over the upper Midwest and northern Plains during the early morning hours of 25 July 2012.  Deep convective clouds preclude the ‘traditional’ brightness temperature difference method of fog detection:  emissions from the low-level water-based clouds cannot be seen by the satellite because of high-level cirrus clouds associated with thunderstorm anvils.  IFR conditions nevertheless can occur and can be predicted using model-based predictors in the fused GOES-R IFR probability product.  The case above is an excellent example.

The bottom two images show the tradiational satellite imagery, telling the tale of a departing mesoscale system.  It leaves in its wake low clouds over North Dakota and Manitoba that are detected by the traditional product, and notice how the GOES-R IFR probabilities are highest here, because satellite and model predictors both agree.  Under the convective cloud canopy, probabilities are lower:  around 40% in central North Dakota (where night-time predictor relationships are being used) and around 55% over the Arrowhead of Minnesota (where daytime predictor relationships are being used);  the terminator boundary is very obvious in the IFR Probability figure.  There is an excellent overlap between the GOES-R IFR Probabilities and reported IFR conditions that is impossible to get in this case with satellite information alone.

GOES-R IFR as a ‘cleaner’ Product

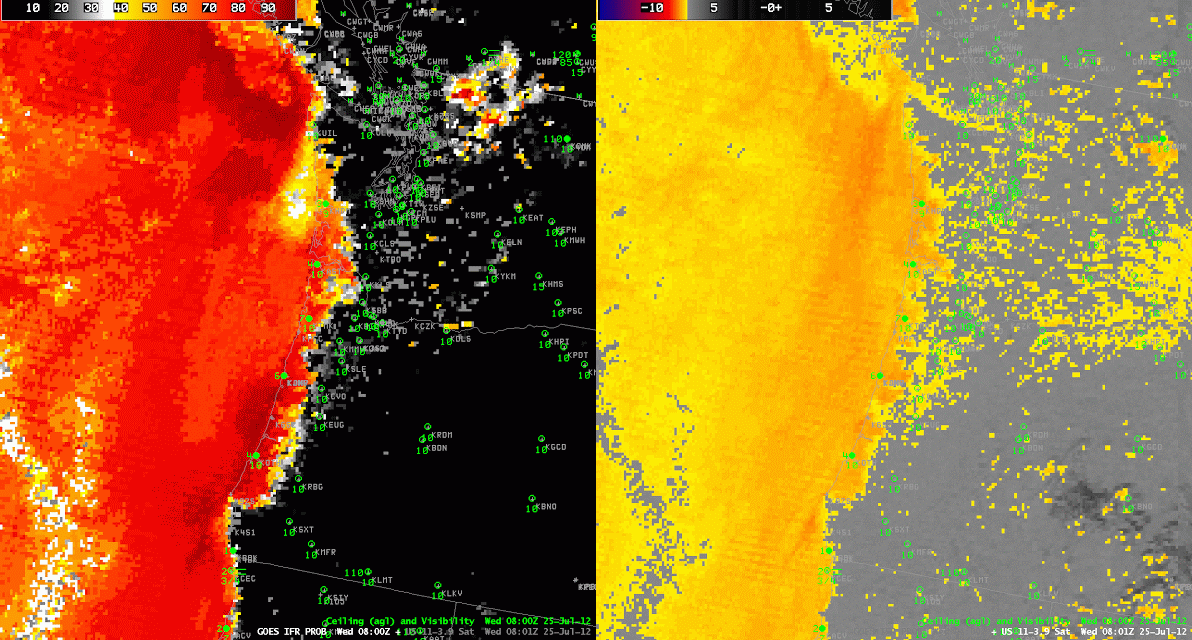
Image toggle between 0800 UTC GOES-R IFR Probability and GOES-West Brightness Temperature Difference between 10.7 and 3.9 micrometers

Because the GOES-R IFR Probabilty product uses multiple predictors in its computation of probabilities, regions where the satellite returns give erroneous signals — because of soil emissivity property changes, for example — can be suppressed if the Rapid Refresh strongly suggests fog is unlikely in that region.  In this example over the Pacific Northwest on the morning of 25 July, both products correctly suggest IFR conditions are likely along the coast (and observations are congruent with that suggestion).  The ‘traditional’ brightness temperature difference product, however, shows a signal over central and western Washington.  IFR conditions are not present there.  The GOES-R IFR product de-emphasizes the satellite signal there.  This ably demonstrates a benefit in using a fused product.

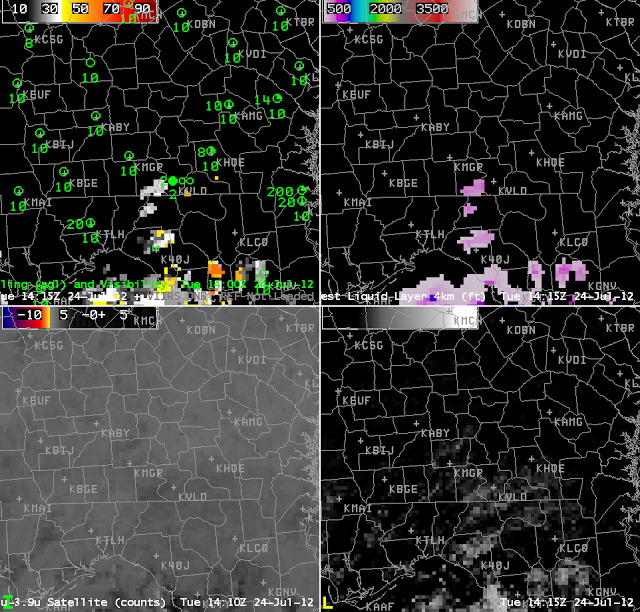
Fog Dissipation

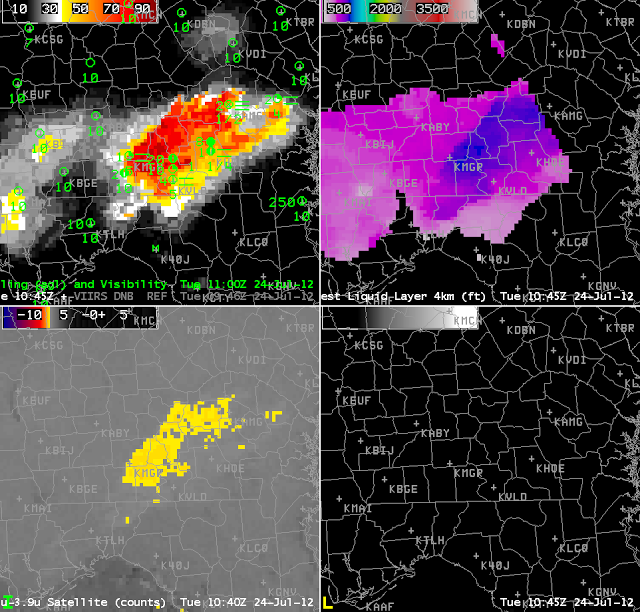
GOES-R IFR Probability (upper left), GOES-R Cloud Thickness of highest Liquid Cloud Layer (upper right), Traditional brightness temperature difference (lower left) and Visible Imagery (lower right) over southern Georgia and northern Florida near 1100 UTC on 24 July 2012

GOES-R Cloud thickness at the last valid time before sunrise (recall that Cloud Thickness is not available during twilight times) can be used as a predictor for where low clouds/fog (that formed via radiative processes) will linger longest after sunrise.  In the image above, the thickest cloud — about 1000 feet thick — is diagnosed to be near KMGR (Moultrie, GA).  It is in this area that the fog should be last to dissipate.  The relationship between cloud thickness and time to dissipate was derived from Spring-time observations and is shown in the plot below.  (You can download the figure here as a png or here as a pdf).

This figure, from the GOES-R Fog/Low Stratus Training developed for the National Weather Service, shows dissipation time after sunrise as a function of Cloud Thickness
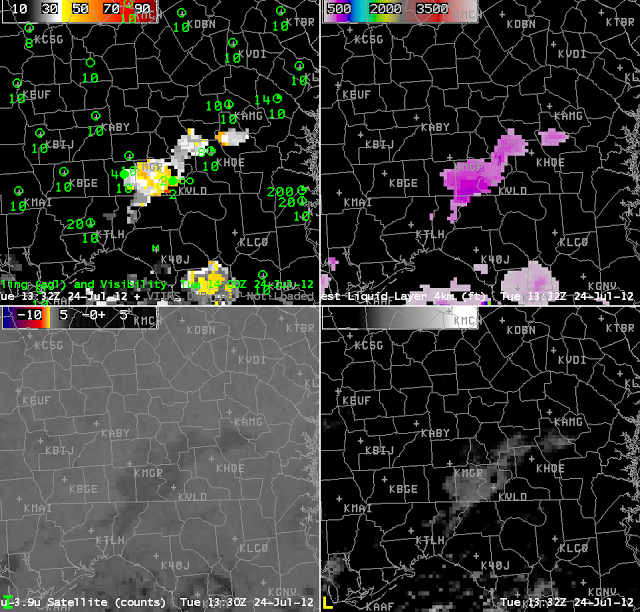
GOES-R IFR Probability (upper left), GOES-R Cloud Thickness of highest Liquid Cloud Layer (upper right), Traditional brightness temperature difference (lower left) and Visible Imagery (lower right) over southern Georgia and northern Florida near 1330 UTC on 24 July 2012

The visible imagery shows that fog is lingering as expected in the region between Moultrie and KVLD (Valdosta).  By 1401 UTC, below, the fog has largely dissipated as cumulus convection starts to develop surrounding the region where fog had existed.

GOES-R IFR Probability (upper left), GOES-R Cloud Thickness of highest Liquid Cloud Layer (upper right), Traditional brightness temperature difference (lower left) and Visible Imagery (lower right) over southern Georgia and northern Florida near 1415 UTC on 24 July 2012

Fog over Louisiana and Mississippi

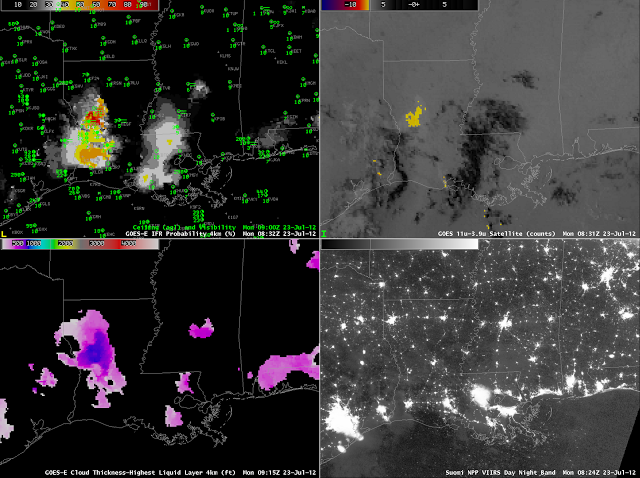
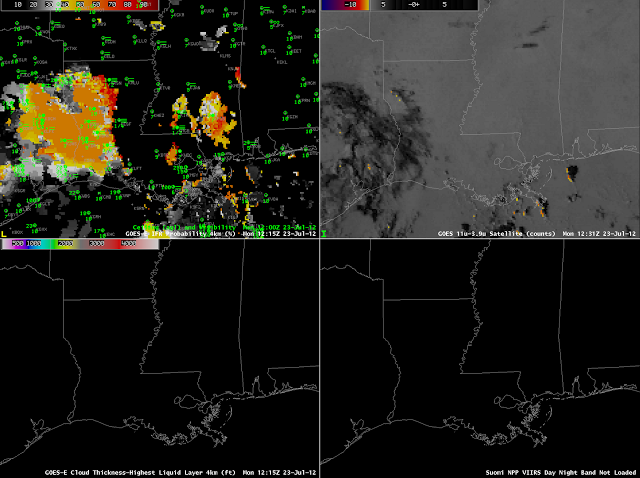
GOES-R IFR Probabilities computed from GOES-East Imager data (upper left), GOES-East brightness temperature difference (upper right), GOES-R Cloud Thickness of the highest liquid water cloud layer (bottom left), Suomi/NPP Day/Night band (bottom right), all from 0830-0900 UTC on 23 July 2012.
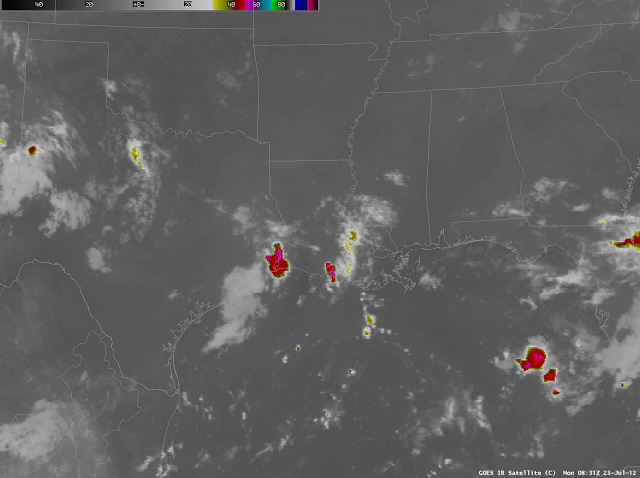
Enhanced 11-micrometer imagery, 0831 UTC 23 July 2012

Fog formed over the southern Mississippi Valley in the early morning of July 23 in a region where high clouds associated with a westward-tracking wave made detection difficult via the traditional brightness temperature difference method.  The imagery above shows relatively high IFR probabilities over southwestern Louisiana where IFR conditions are occurring.  Two items should jump out.  The IFR probabilities are highest where both satellite and model predictors are high, and that occurs in west-central Louisiana.  In regions to the south and west, where higher clouds exist (and satellite predictors are therefore low), probabilities are a bit lower in a region where only model predictors are being used.  However, IFR conditions are present.  Note how the character of the IFR probability field changes from the region where satellite data are used (much more spatially variable) to the region where mostly model data are used (more spatially uniform).  It is very important when interpreting the probability fields to be aware of the presence of high clouds that limit the inclusion of satellite data in the predictors.

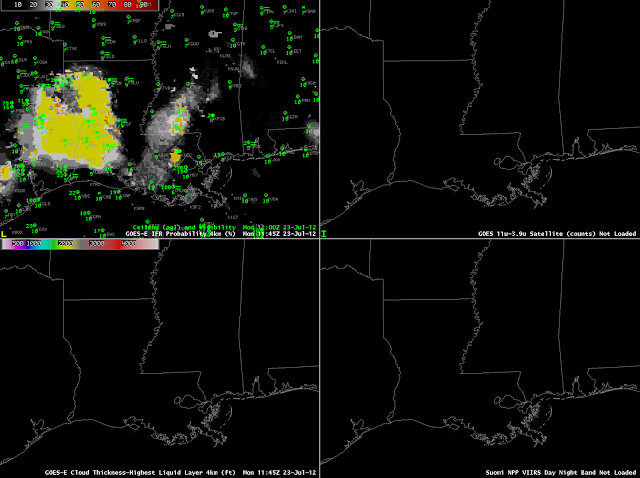
GOES-R IFR Probabilities computed from GOES-East Imager data (upper left), GOES-East brightness temperature difference (upper right), GOES-R Cloud Thickness of the highest liquid water cloud layer (bottom left), Suomi/NPP Day/Night band (bottom right), all from 1145-1200 UTC on 23 July 2012.
GOES-R IFR Probabilities computed from GOES-East Imager data (upper left), GOES-East brightness temperature difference (upper right), GOES-R Cloud Thickness of the highest liquid water cloud layer (bottom left), Suomi/NPP Day/Night band (bottom right), all from 1215 UTC on 23 July 2012.

The two images above show how the probabilities change as the predictors used change from nighttime values (at 1145 UTC) to daytime values (1215 UTC).  At 1145 UTC, probabilities over Louisiana are near 40%, and these probabilities are driven largely by model data, because of high clouds.  There are several airports reporting IFR conditions at 1200 UTC.  Probabilities jump to around 55% at 1215 UTC.

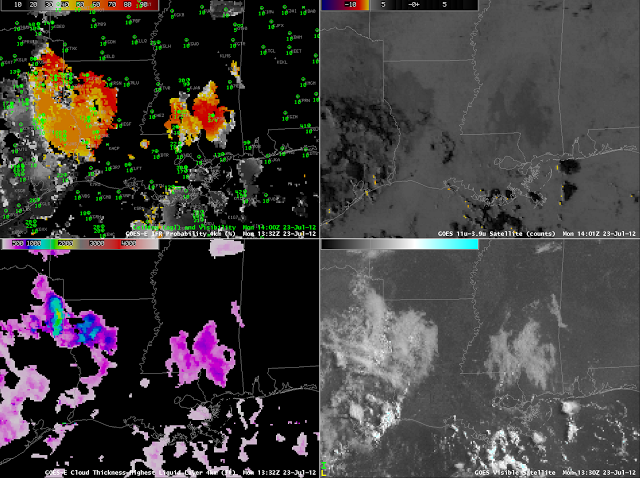
GOES-R IFR Probabilities computed from GOES-East Imager data (upper left), GOES-East brightness temperature difference (upper right), GOES-R Cloud Thickness of the highest liquid water cloud layer (bottom left), GOES-East Visible imagery (bottom right), all from around 1300 UTC on 23 July 2012.

At 1300/1400 UTC, the GOES-R IFR probabilities and cloudt thickness fields neatly overlap the visible imagery observations of cloudiness over Mississippi and over western Louisiana, with a pronounced break in central Louisiana.

Terrain

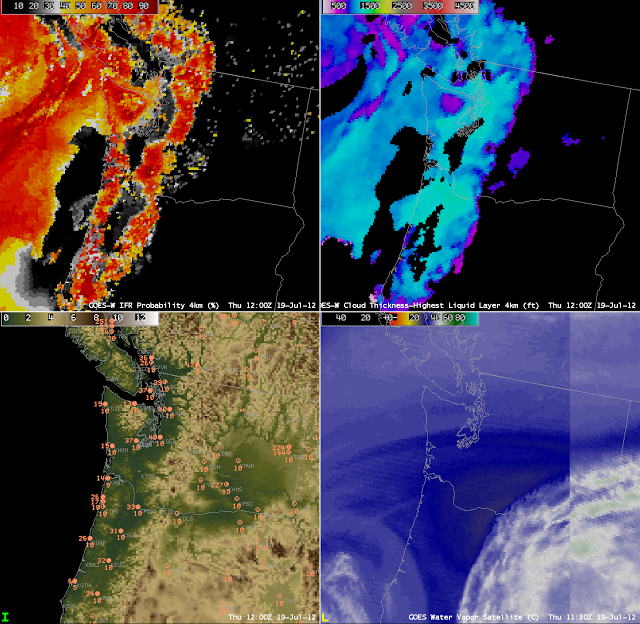
GOES-R IFR Probabilities (Upper left), GOES-R Cloud Thickness (Upper right), Terrain with surface plots of Ceiling (above MSL) and visibility (lower left) and the GOES-15/GOES-13 Water vapor imagery

When terrain rises up into the clouds, IFR conditions occur, and the GOES-R IFR product shows that effect.  These images from ~1200 UTC on 19 July 2012 show two regions of IFR conditions over the Pacific Northwest — along the spine of the coastal range from the Olympic Mountains south to the Oregon Coast Range and along the Cascades from east of Seattle southward to Oregon.  The observations shown in the lower left (with ceilings above mean sea level, plotted over topography) are consistent with the IFR probabilities:  Low probability over the region between the coastal range and the Cascades, and high probability in regions over the Cascades where the height exceeds the observed ceilings over, say, Seattle and Portland, and high probabilities along the Coastal Range where heights exceed the observed ceilings along the coast.

Model vs. Satellite Predictors in the GOES-R IFR Probability algorithm

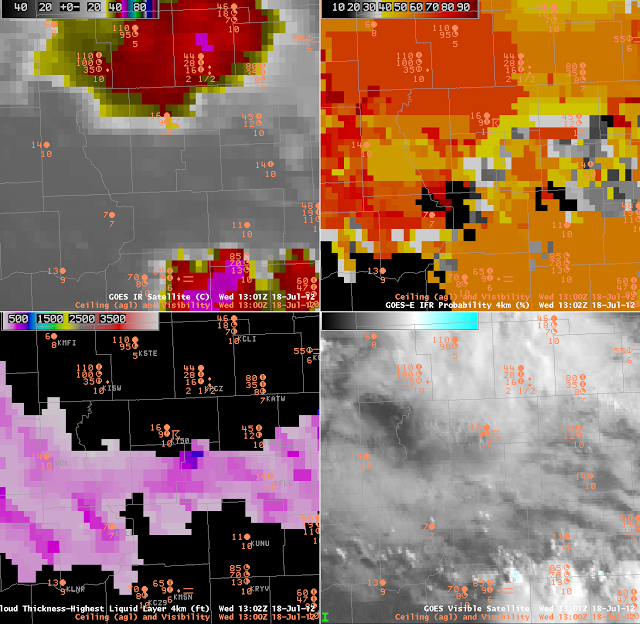
GOES-East Enhanced 10.7-micrometer imagery (Upper left), GOES-R IFR Probability (upper right), GOES-R Cloud Phase (lower left), GOES-East Visible imagery (lower right)

This blown-up version of satellite-based (and fused) products over central Wisconsin on the morning of 18 July 2012 shows how the use of different predictors in the GOES-R IFR probability field can be discerned from the character of the field produced.  This was a morning with MVFR/IFR conditions over central Wisconisin (600-foot ceilings at Marshfield (KMFI) and 700-foot ceilings at Wisconsin Dells (KDLL), for example).   IFR probabilities were high in the regions where IFR conditions were observed, but note how smooth the field is in the northwest and southeast part of the GOES-E IFR probability image.  In the regions under the anvil cirrus (cold cloud-tops as depicted in the 10.7 micrometer image, upper left), the GOES-R IFR Probability algorithm will rely on model data.  In this case, the relative humidity in the RAP forecast has more influence because the high clouds mean the satellite signal is not from a fog/low stratus layer and therefore does not influence the IFR probabiltiies.  The layer relative humidity in the model is likely higher in the northwestern part of the image (where GOES-R IFR probabilities are in the 70% range) than in the southeastern part of the image (where GOES-R IFR probabilities are in the 50% range).  Over the central part of the GOES-R IFR Probability image, the absence of high clouds allows satellite information to be used, and a more variable field results that has a mirror in the variability of the satellite observations in that area.  This region is also where Cloud Thickness diagnoses can be made.