 |
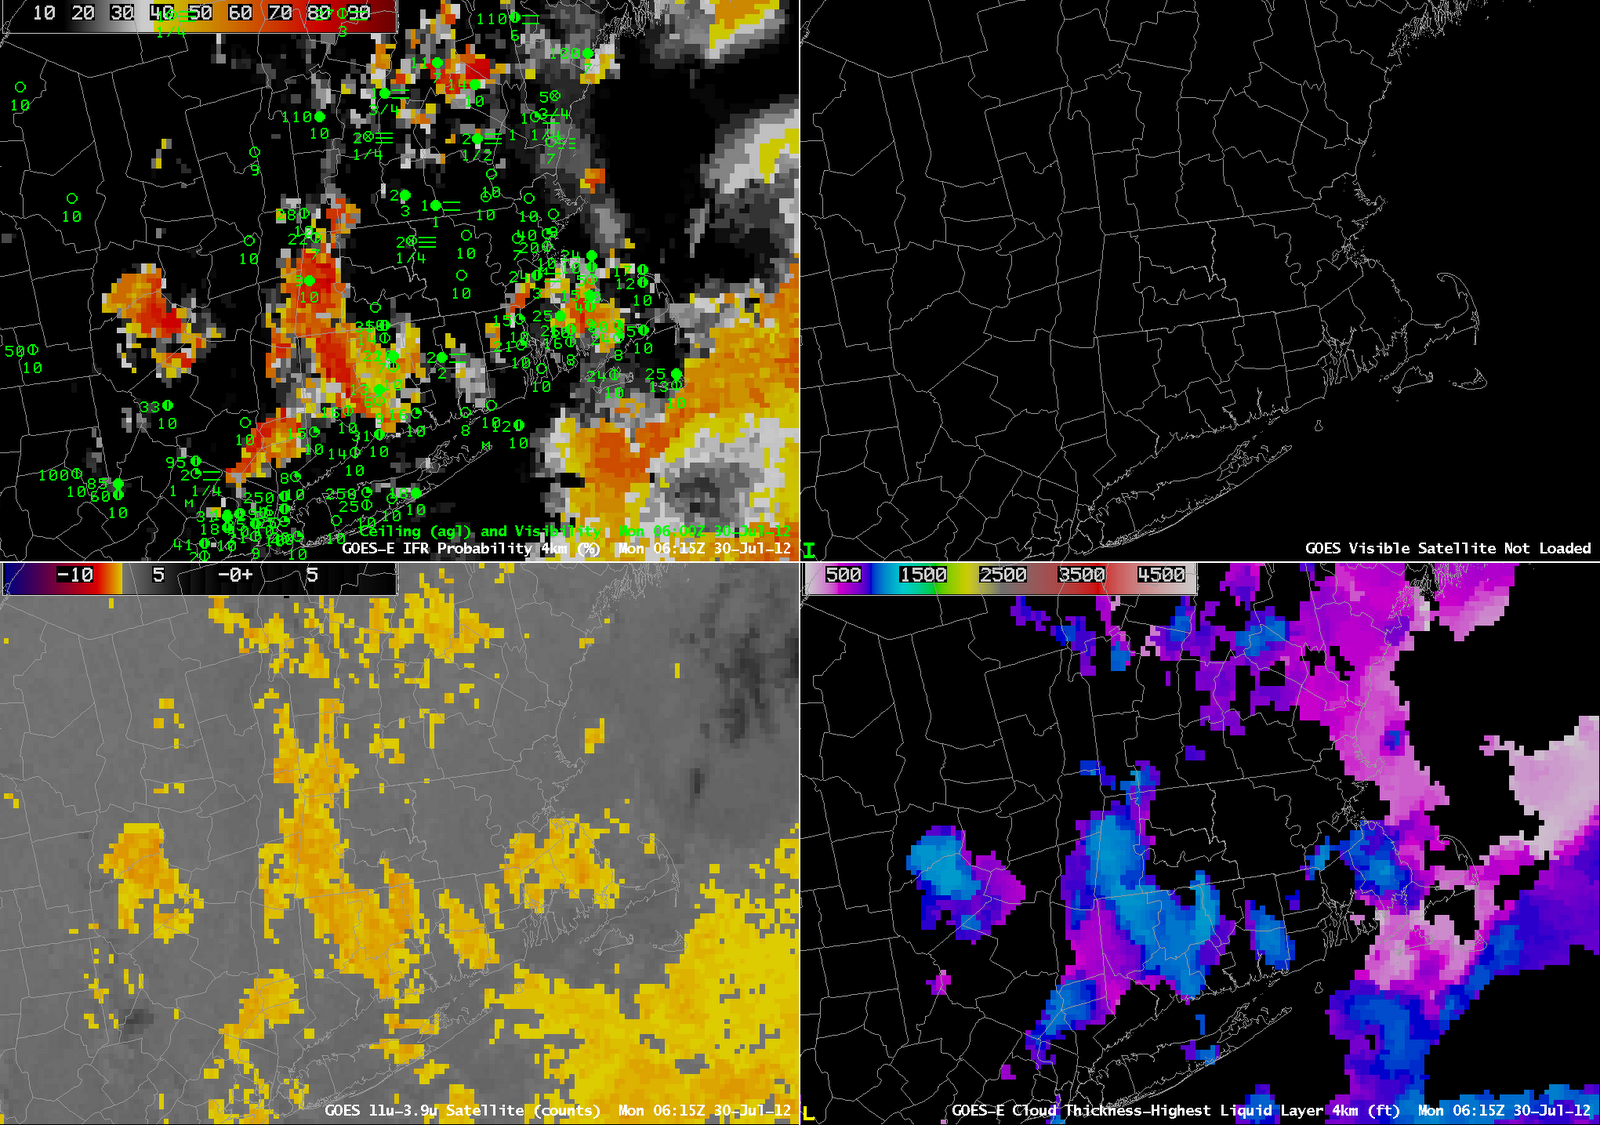
| GOES-R IFR Probabilities (upper left), GOES-East Visible imagery (upper right), Brightness temperature difference between 10.7 and 3.9 micrometers (lower left), GOES-R Cloud Thickness (lower right) |
|
The imagery above shows high IFR probabilities over western Massachusetts — where IFR conditions are not observed — and very low probabilities in central Massachusetts in and near the Connecticut River Valley where IFR conditions are observed. The brightness temperature difference in central Massachusetts is not suggestive of low clouds and fog. For the IFR probability to be high there, then, would require that the Rapid Refresh Model showed saturation in the lower part of the model atmosphere. Thus, the fused product could show higher probabilities in this region where fog is observed. However, as shown below, relative humidity in the lowest part of the model was actually a relative minimum over central Massachusetts.
 |
| Two-hour forecasts of Relative Humidity from the Rapid Refresh, all valid at 0600 UTC from the 0400 UTC model run; Lowest 30 mb of the model (upper left), lowest 60 mb of the model (upper right), lower 90 mb of the model (lower left), surface (lower right) |
 |
| Two-hour forecasts of Relative Humidity from the Rapid Refresh, all valid at 0800 UTC from the 0600 UTC model run; Lowest 30 mb of the model (upper left), lowest 60 mb of the model (upper right), lower 90 mb of the model (lower left), surface (lower right) |
By 0730 UTC, the satellite brightness temperature difference product (below) is starting to suggest that fog/low clouds are more widespread (A MODIS image at the same time tells the same tale). As that happens, the IFR probabilities start to increase.
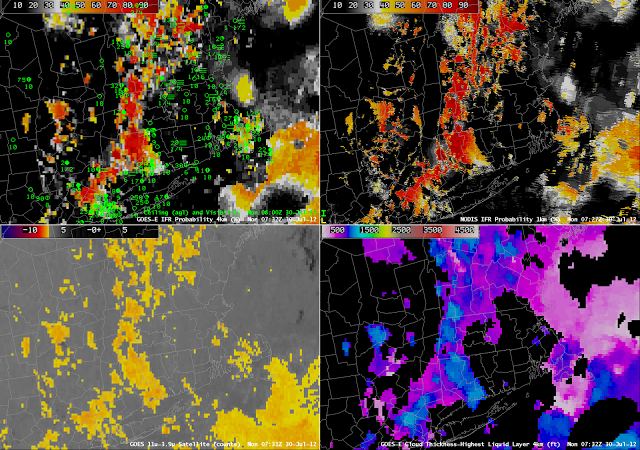 |
| GOES-R IFR Probabilities computed from GOES-East imager data (upper left), GOES-R IFR probabilities computed from MODIS data (upper right), Brightness temperature difference between 10.7 and 3.9 micrometers (lower left), GOES-R Cloud Thickness (lower right) |
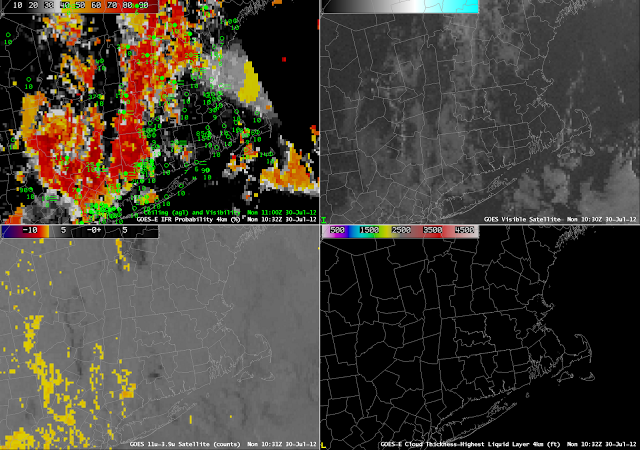 |
| GOES-R IFR Probabilities (upper left), GOES-East Visible imagery (upper right), Brightness temperature difference between 10.7 and 3.9 micrometers (lower left) at 1032 UTC, GOES-R Cloud Thickness (lower right) not shown because of twilight conditions |
The 1032 UTC imagery (above) shows the very small scale of this fog feature that is in central Massachusetts.