 |
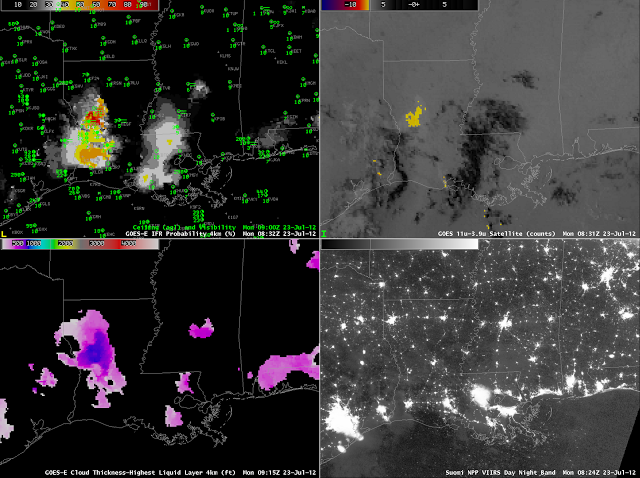
| GOES-R IFR Probabilities computed from GOES-East Imager data (upper left), GOES-East brightness temperature difference (upper right), GOES-R Cloud Thickness of the highest liquid water cloud layer (bottom left), Suomi/NPP Day/Night band (bottom right), all from 0830-0900 UTC on 23 July 2012. |
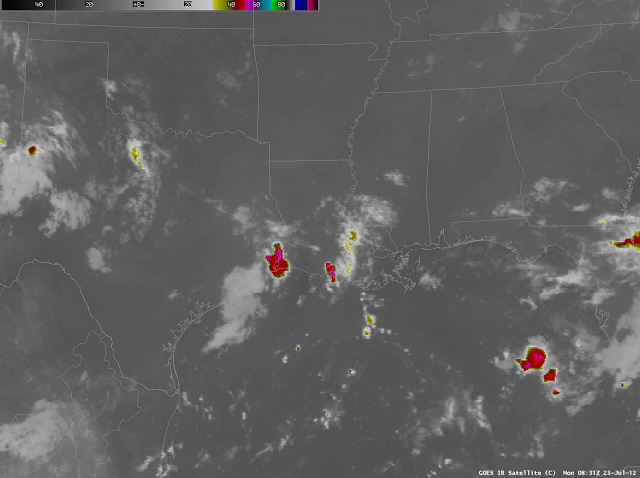 |
| Enhanced 11-micrometer imagery, 0831 UTC 23 July 2012 |
Fog formed over the southern Mississippi Valley in the early morning of July 23 in a region where high clouds associated with a westward-tracking wave made detection difficult via the traditional brightness temperature difference method. The imagery above shows relatively high IFR probabilities over southwestern Louisiana where IFR conditions are occurring. Two items should jump out. The IFR probabilities are highest where both satellite and model predictors are high, and that occurs in west-central Louisiana. In regions to the south and west, where higher clouds exist (and satellite predictors are therefore low), probabilities are a bit lower in a region where only model predictors are being used. However, IFR conditions are present. Note how the character of the IFR probability field changes from the region where satellite data are used (much more spatially variable) to the region where mostly model data are used (more spatially uniform). It is very important when interpreting the probability fields to be aware of the presence of high clouds that limit the inclusion of satellite data in the predictors.
 |
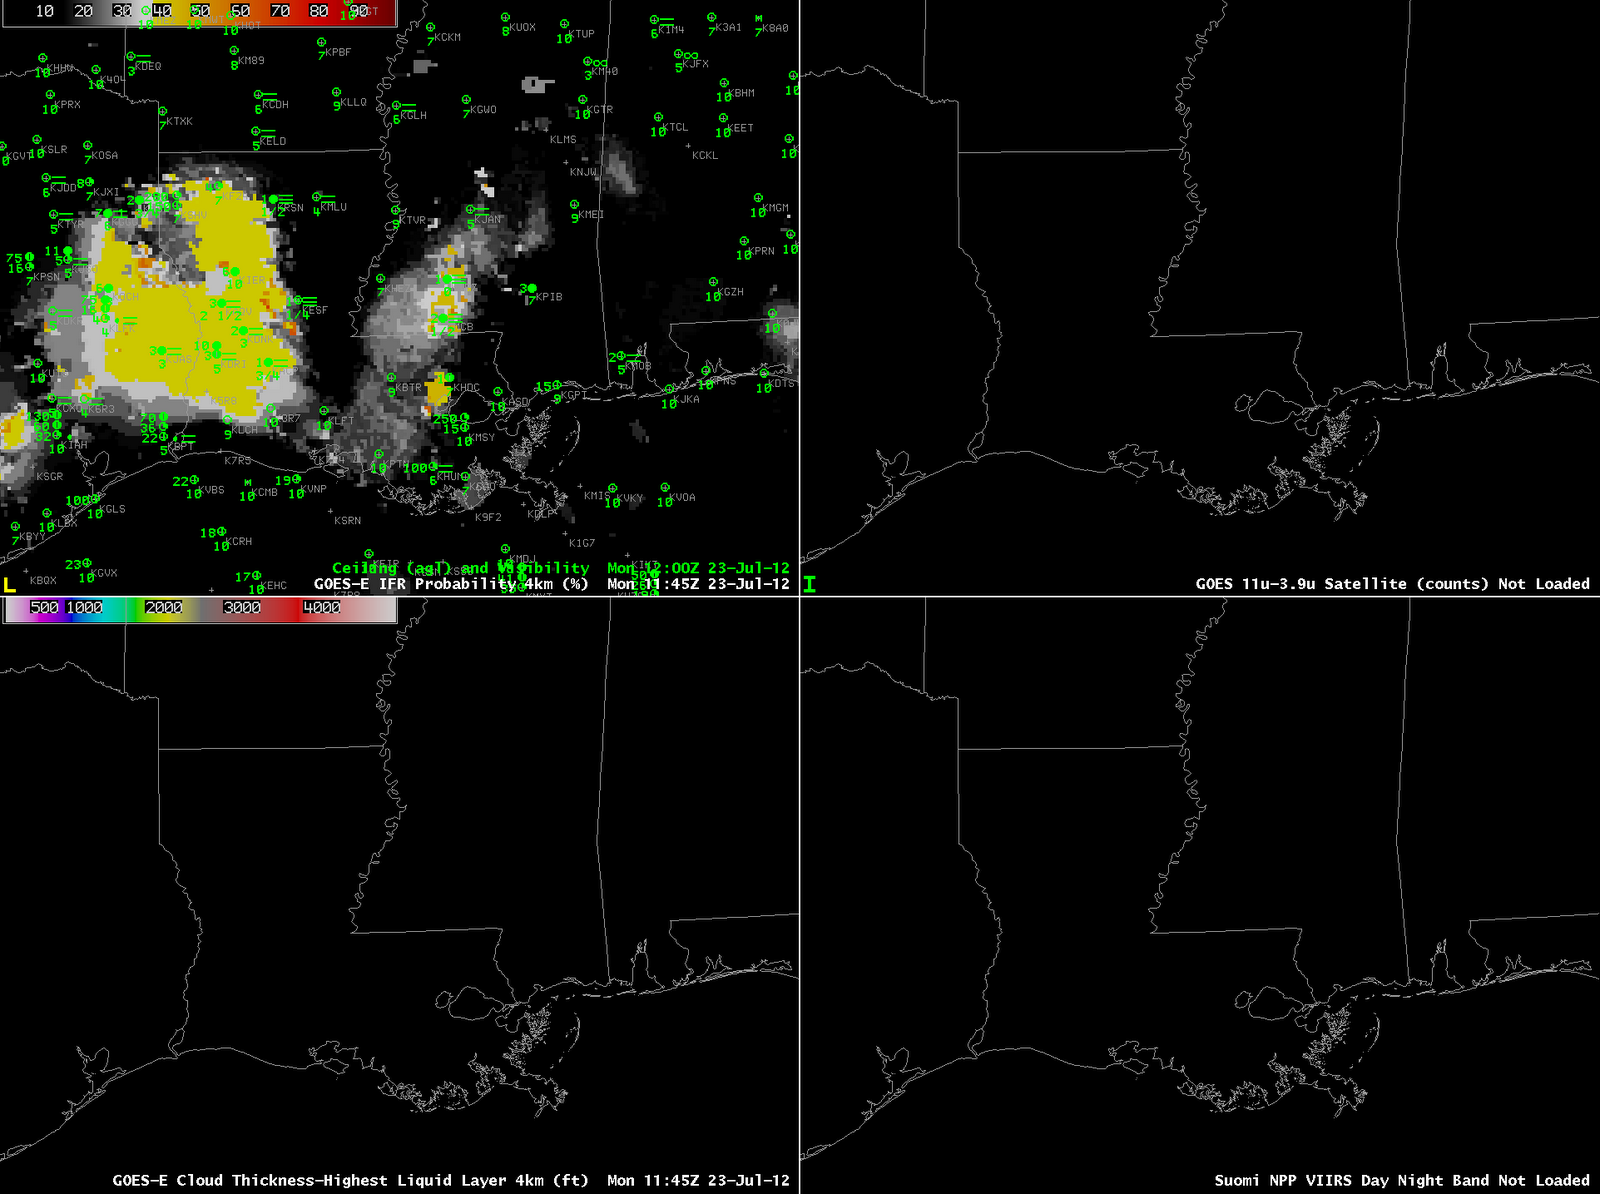
| GOES-R IFR Probabilities computed from GOES-East Imager data (upper left), GOES-East brightness temperature difference (upper right), GOES-R Cloud Thickness of the highest liquid water cloud layer (bottom left), Suomi/NPP Day/Night band (bottom right), all from 1145-1200 UTC on 23 July 2012. |
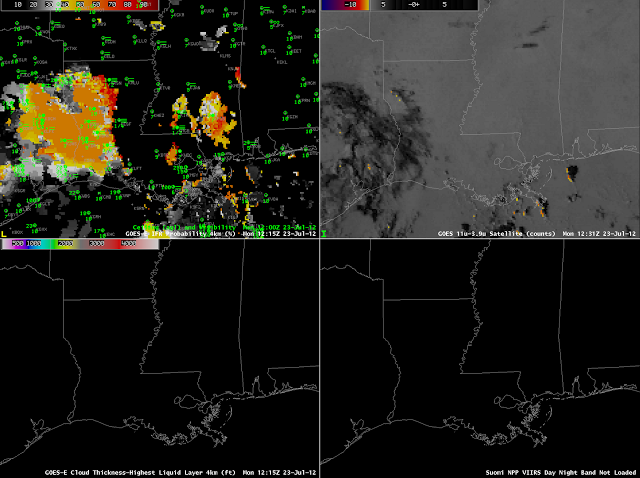 |
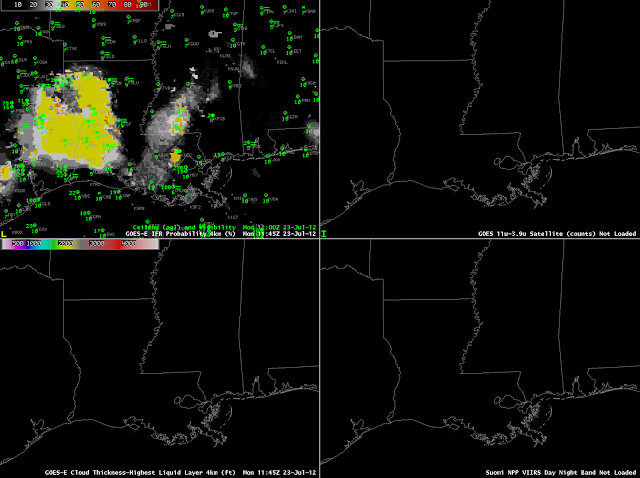
| GOES-R IFR Probabilities computed from GOES-East Imager data (upper left), GOES-East brightness temperature difference (upper right), GOES-R Cloud Thickness of the highest liquid water cloud layer (bottom left), Suomi/NPP Day/Night band (bottom right), all from 1215 UTC on 23 July 2012. |
The two images above show how the probabilities change as the predictors used change from nighttime values (at 1145 UTC) to daytime values (1215 UTC). At 1145 UTC, probabilities over Louisiana are near 40%, and these probabilities are driven largely by model data, because of high clouds. There are several airports reporting IFR conditions at 1200 UTC. Probabilities jump to around 55% at 1215 UTC.
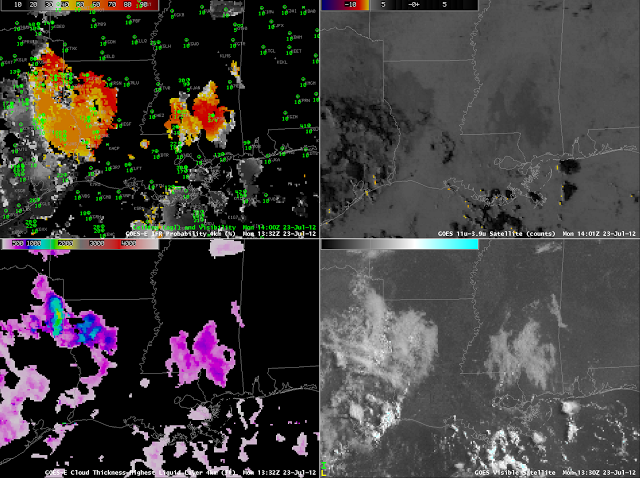 |
| GOES-R IFR Probabilities computed from GOES-East Imager data (upper left), GOES-East brightness temperature difference (upper right), GOES-R Cloud Thickness of the highest liquid water cloud layer (bottom left), GOES-East Visible imagery (bottom right), all from around 1300 UTC on 23 July 2012. |
At 1300/1400 UTC, the GOES-R IFR probabilities and cloudt thickness fields neatly overlap the visible imagery observations of cloudiness over Mississippi and over western Louisiana, with a pronounced break in central Louisiana.