Category Archives: Plains

Fog over the Ozarks and southern Plains

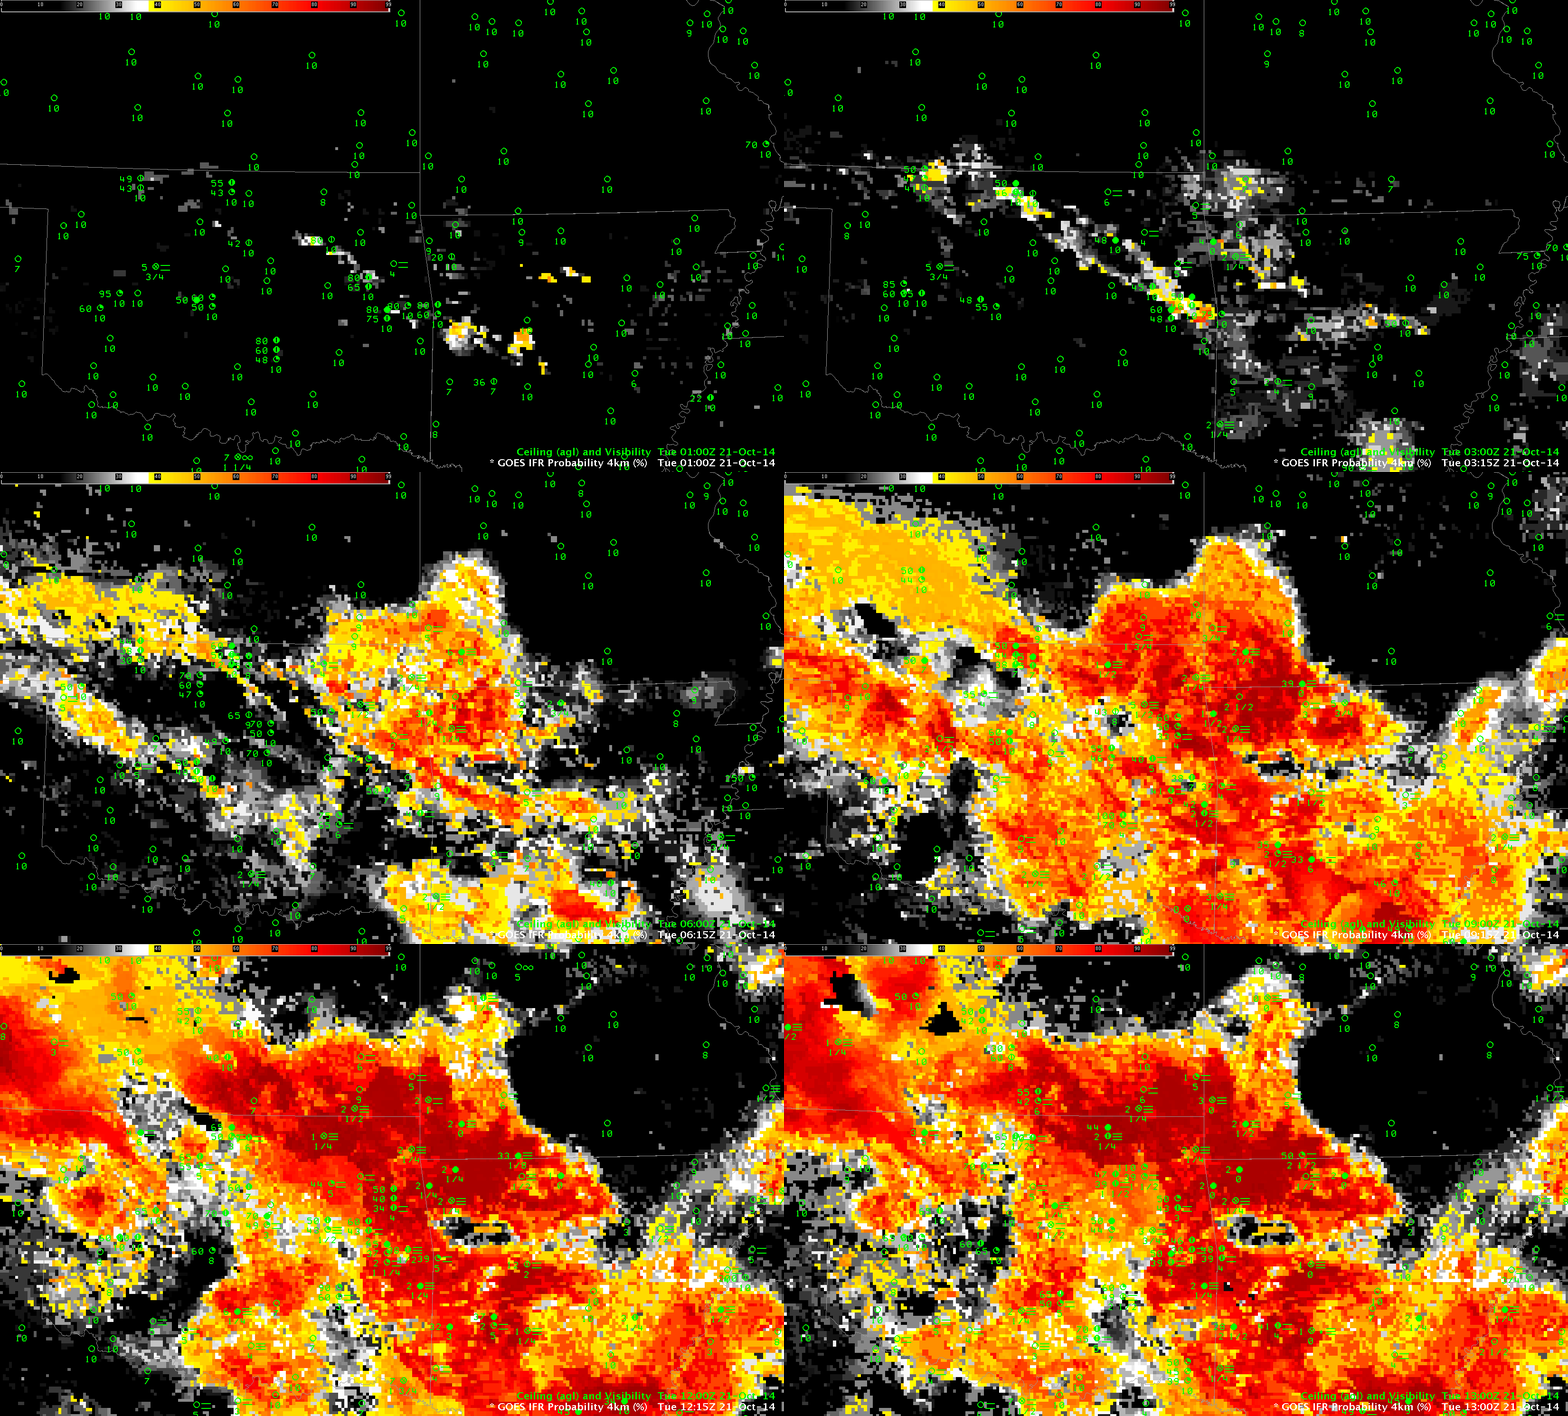
GOES_IFR_21Oct2014_01-13

GOES-IFR Probabilities, computed from GOES-13 and Rapid Refresh, hourly from 0100 through 1300 UTC on 21 October 2014 (Click to enlarge)

Fog and stratus developed overnight over the Ozark Mountains and southern Plains. The hourly loop of GOES-R IFR Probabilities shows the development and expansion of visibility and ceiling reductions over the area. How do these fields compare to other measures of fog? Brightness Temperature Difference fields, below, generally overestimate the regions of fog. The 0200 and 0800 UTC brightness temperature difference fields, below, are toggled with the IFR Probabilities; the inclusion of surface information via the Rapid Refresh Model correctly limits the positive brightness temperature difference to regions where fog and low stratus are most likely. The satellite-only signal overpredicts regions of reduced visibilities because it can only see the top of the cloudbank; this offers little information about the cloud ceilings!
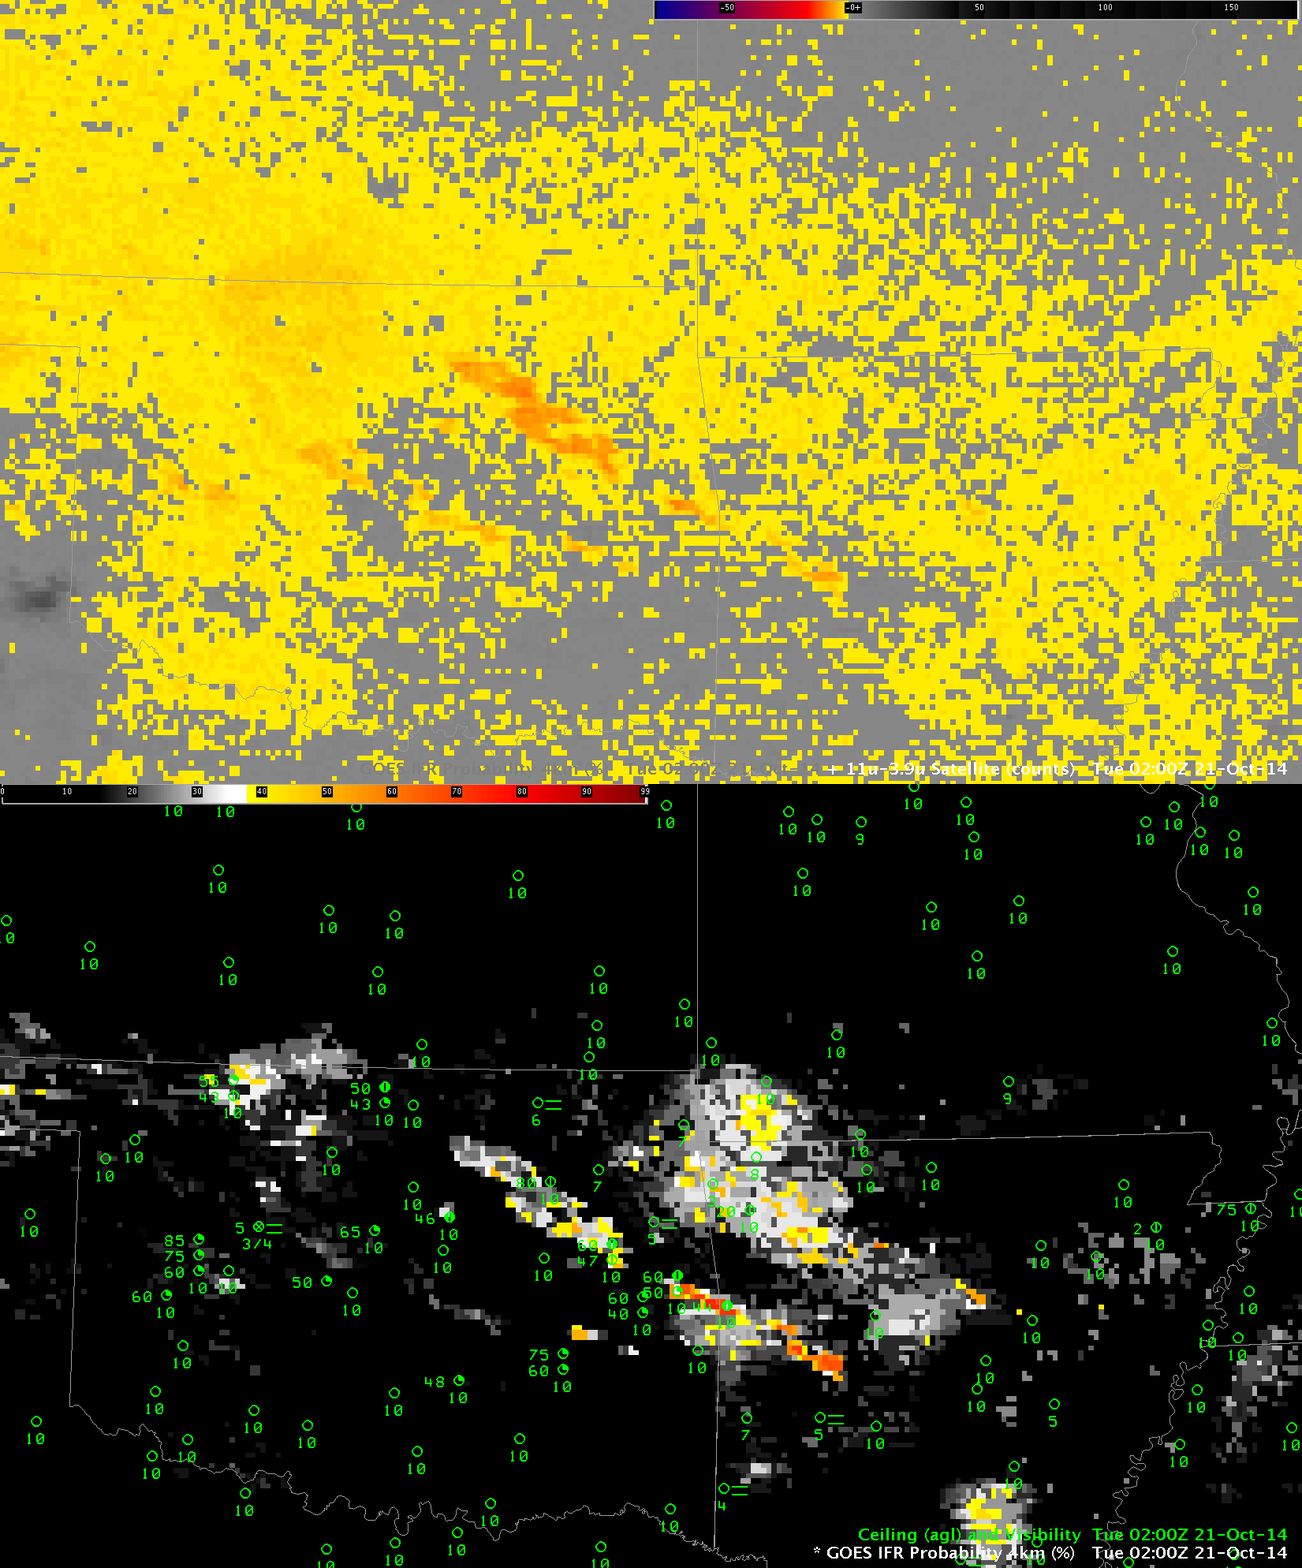
GOES_BTD_IFR_0200_21Oct2014_toggle

GOES-13 Brightness Temperature Difference (10.7 µm – 3.9 µm) and GOES-based IFR Probabilities at 0200 UTC, 21 October 2014 (Click to enlarge)
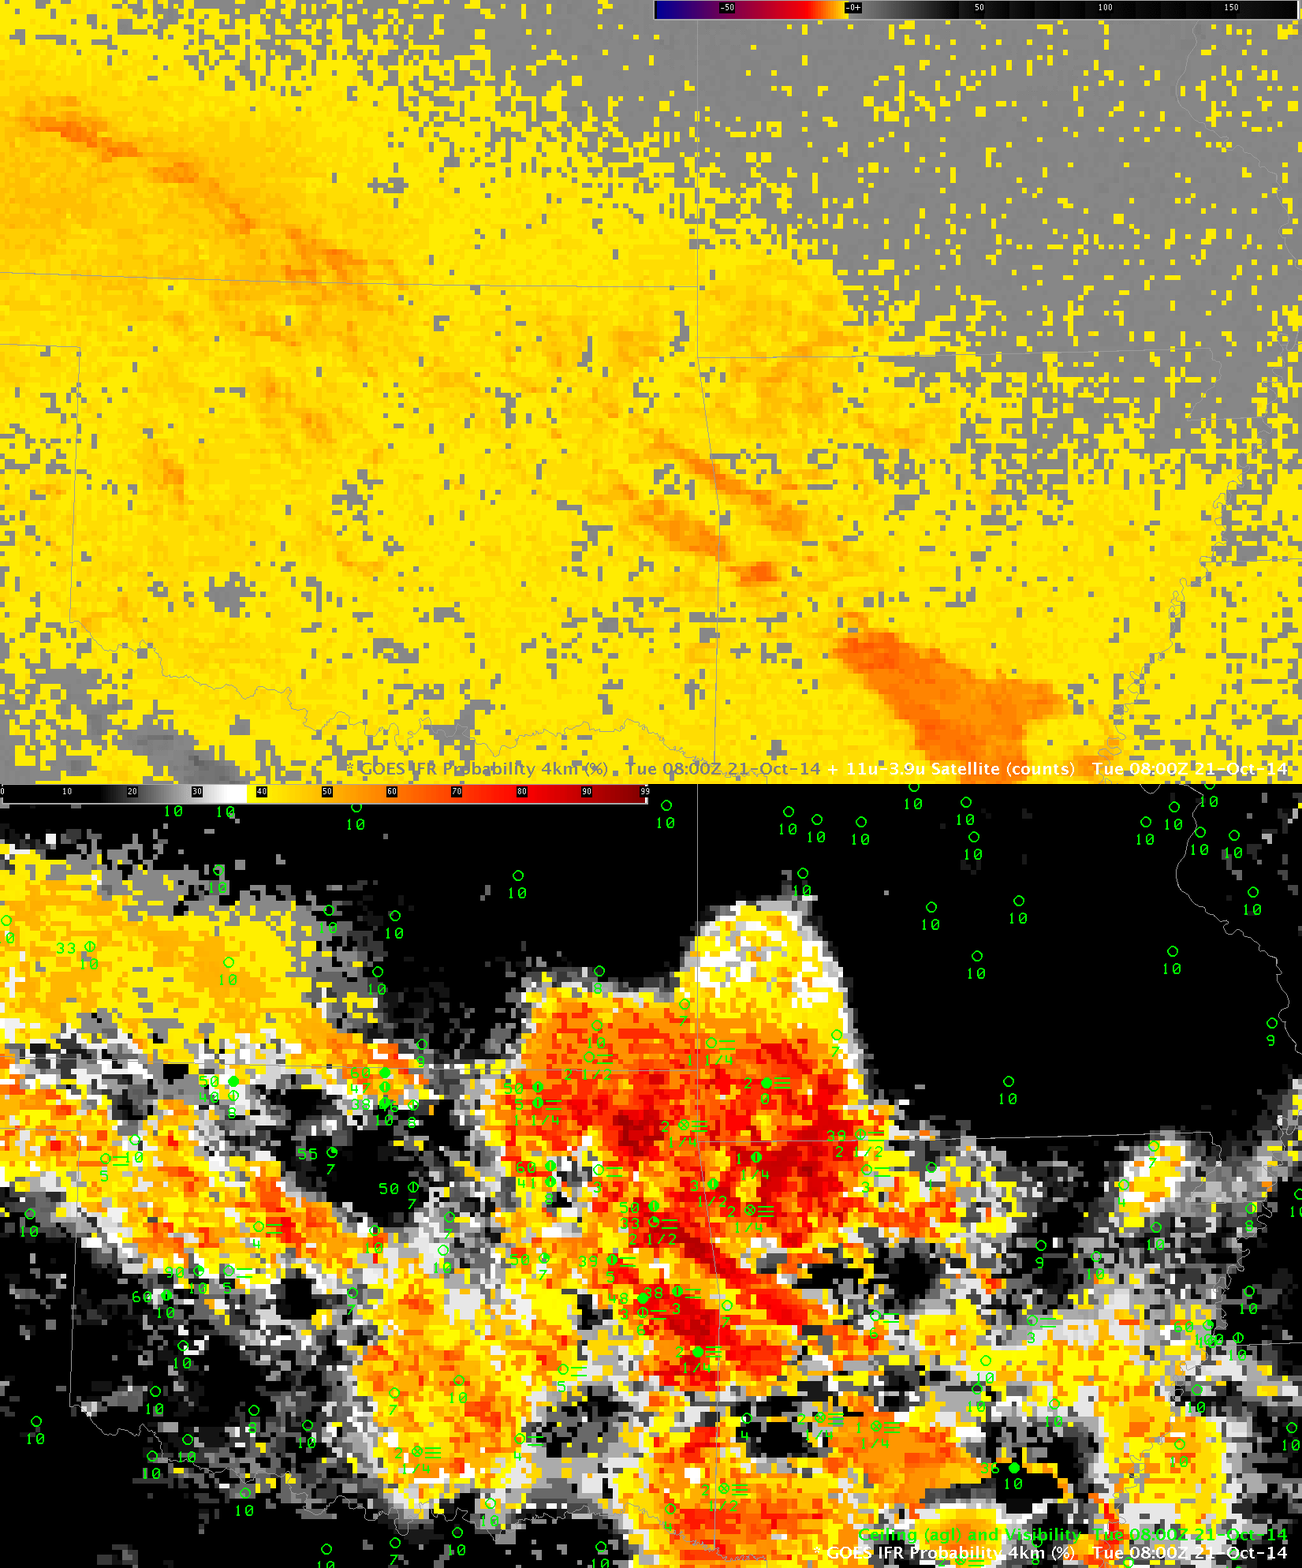
GOES_BTD_IFR_0800_21Oct2014_toggle

GOES-13 Brightness Temperature Difference (10.7 µm – 3.9 µm) and GOES-based IFR Probabilities at 0800 UTC, 21 October 2014 (Click to enlarge)

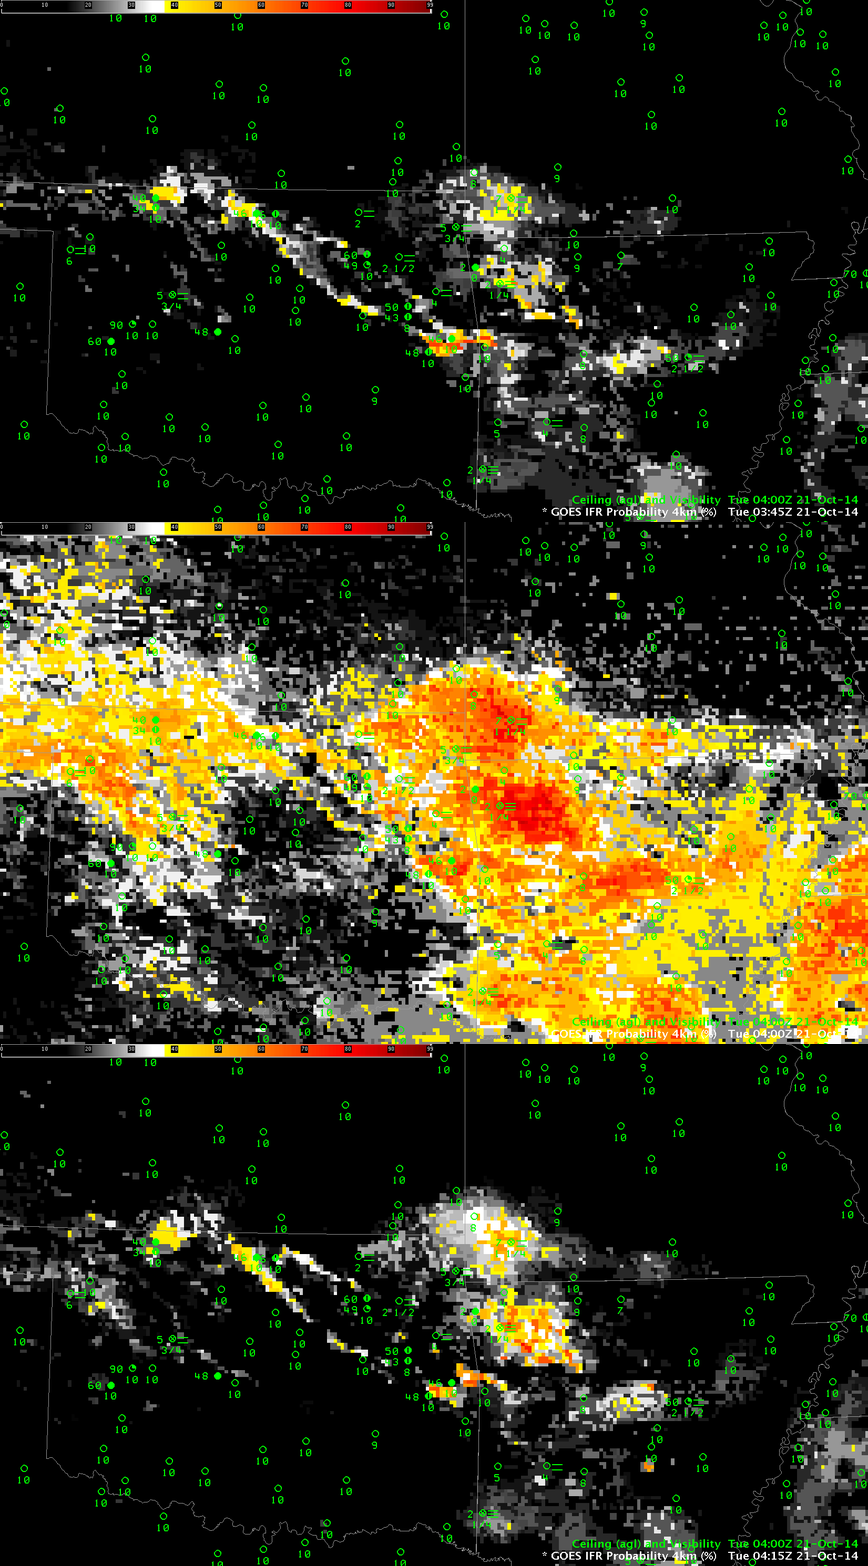
Brightness Temperature Difference fields are occasionally contaminated by stray light in the signal. This happened on 21 October at 0400 UTC. The Brightness Temperature Difference fields at 0345, 0400 and 0415 UTC are shown below, with the GOES-R IFR Probabilities for the same time follow. Note how Stray Light contamination does bleed into the GOES-R IFR Probability field; if there is a large change over 15 minutes in the IFR Probability signal, consider the possible reasons for that change. Stray light contamination is a strong candidate if the signal is near 0400-0500 UTC with GOES-East. There are regions in the IFR Probability fields where even the strong — but meteorologically unimportant — brightness temperature difference signal during stray light is not enough to overcome the information from the Rapid Refresh model that denies the possibility of low-level saturation (for example, in northern Kansas or southern Oklahoma).
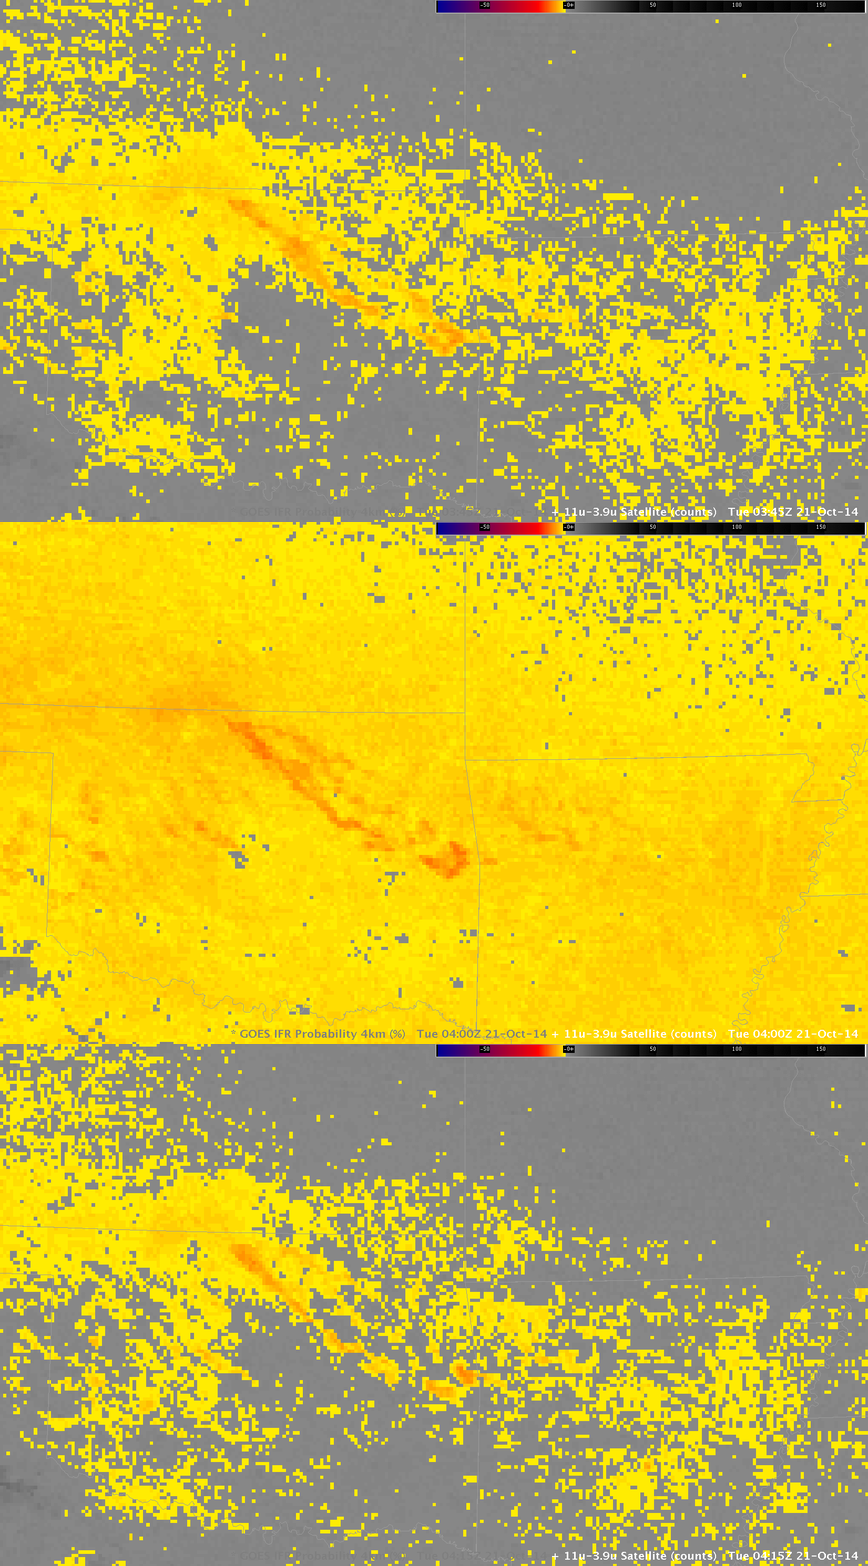
GOES_BTD_21Oct2014_0345-0415

GOES-13 Brightness Temperature Difference (10.7 µm – 3.9 µm) at 0345, 0400 and 0415 UTC, 21 October 2014 (Click to enlarge)

GOES_IFR_21Oct2014_0345-0415

GOES-based IFR Probabilities at 0345, 0400 and 0415 UTC, 21 October 2014 (Click to enlarge)

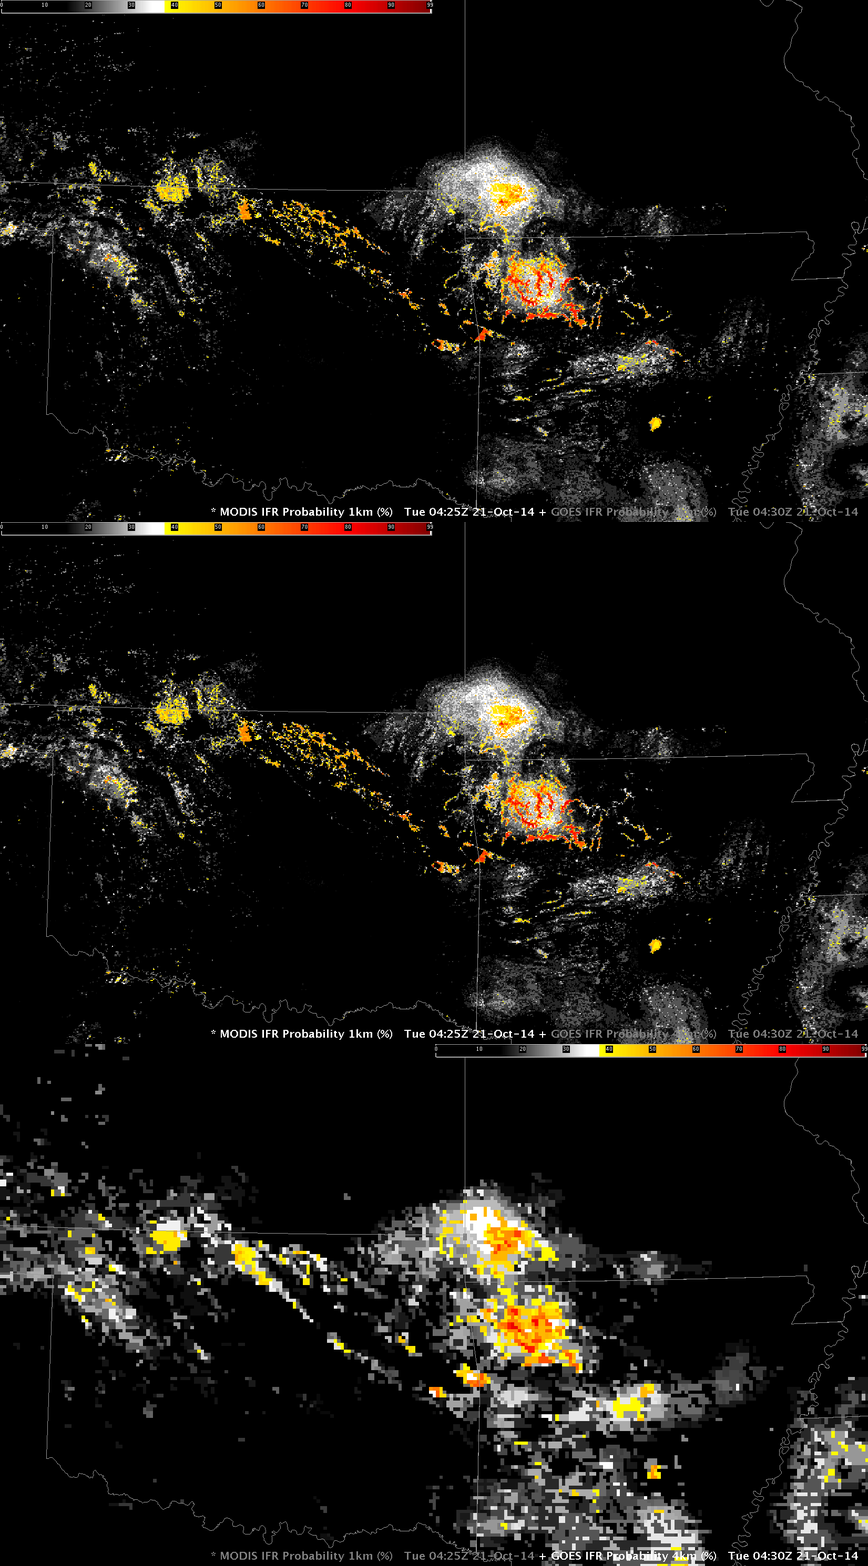
MODIS data from either Terra or Aqua can give important early alerts to the development of Fog/Low Stratus. Because of its superior resolution to GOES, the character of the developing fog can be depicted with more accuracy. The MODIS-based IFR Probability, below, in a toggle with the GOES-based IFR Probability at the same time, distinctly shows that the fog development at 0430 UTC is starting in the small valleys of the Ozarks of northwest Arkansas. GOES-based IFR Probabilities give a broader signal; certainly if you are familiar with the topography of the WFO you can correctly interpret the coarse-resolution GOES data, but the MODIS data spares you that necessity.

MODIS_GOES_IFR_21Oct2014_0430

GOES- and MODIS-based IFR Probabilities at ~0430 UTC, 21 October 2014 (Click to enlarge)

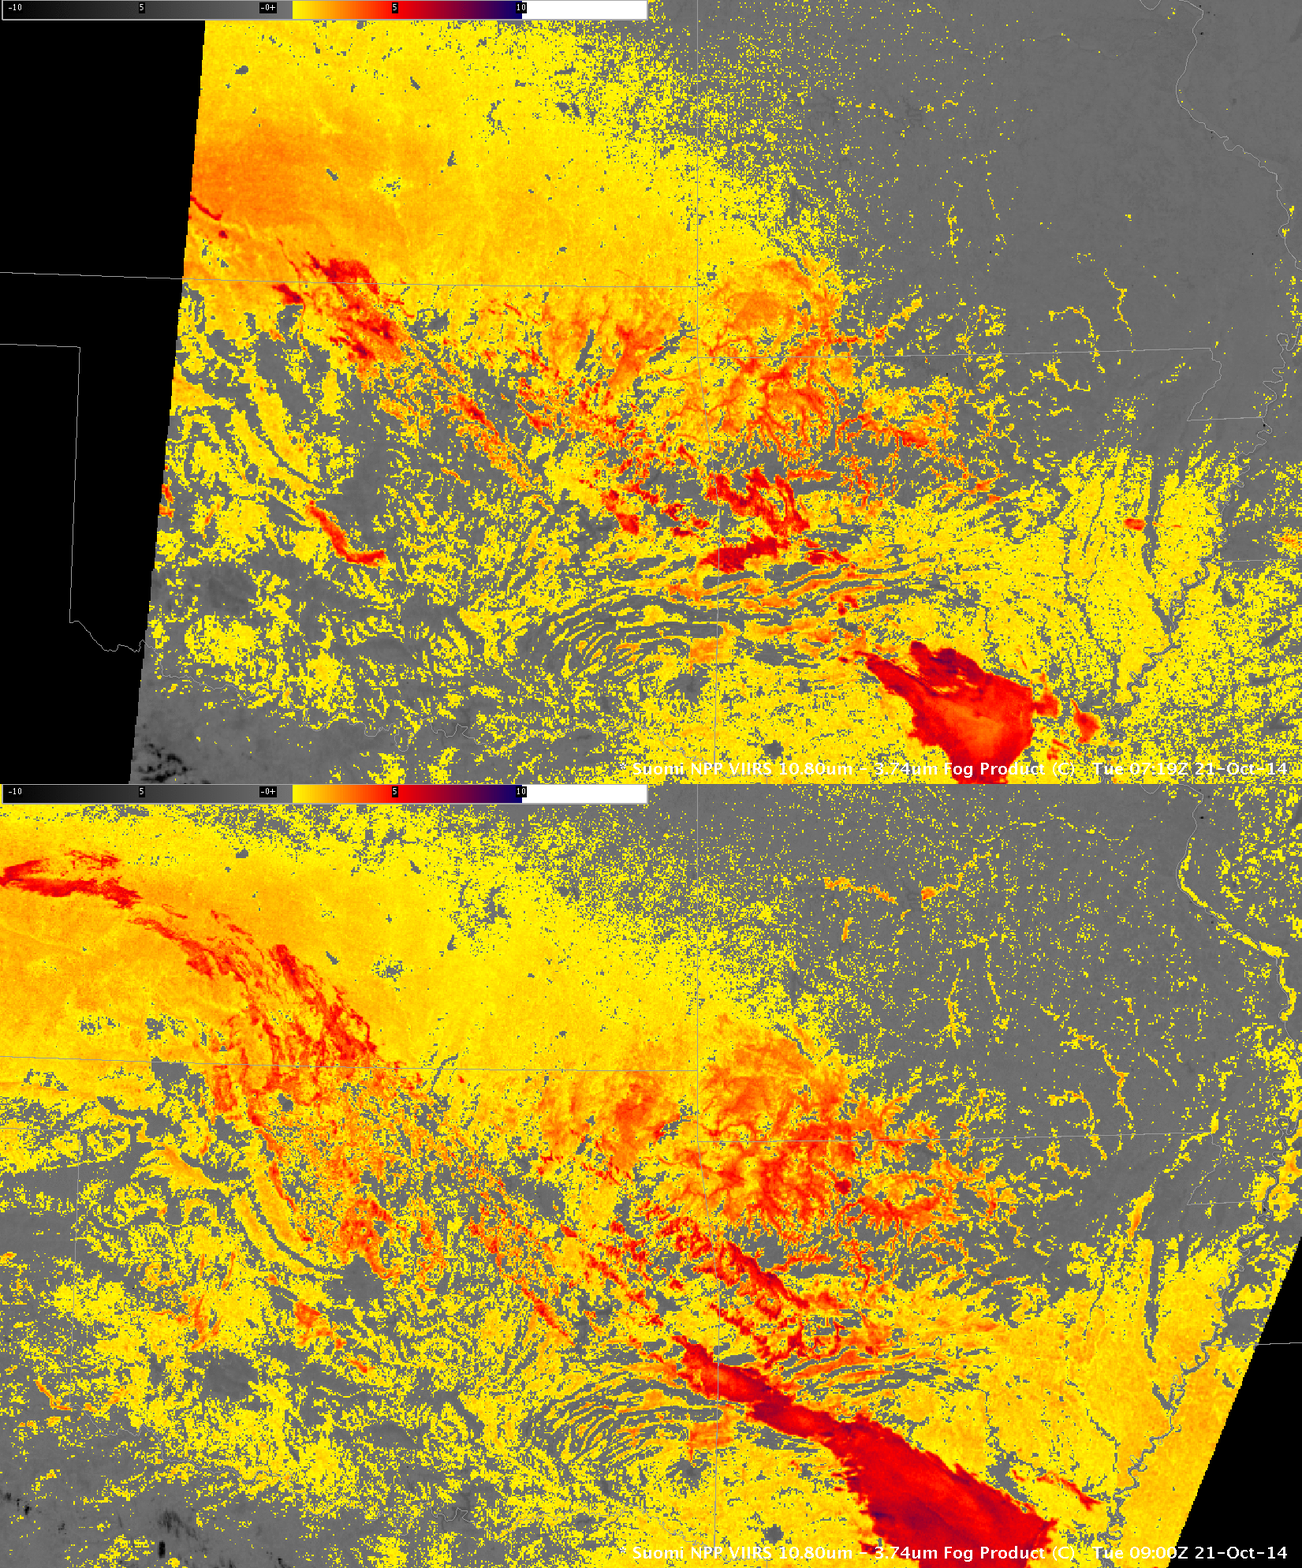
Suomi NPP data can also be used to compute IFR Probabilities, but those data are not yet computed for AWIPS. The Ozarks were properly positioned on 21 October to be scanned by two successive orbits of Suomi NPP (one of the benefits of Suomi NPP’s relatively broad scan), and the brightness temperature difference fields (11.45µm – 3.74µm) at 0715 and 0900 UTC are shown below. As with MODIS, the strong signal in the river valleys is apparent. (The Day Night band from Suomi NPP for this event does not show a strong signal because the near-new Moon provides no illumination at 0745 or 0900 UTC: it hasn’t even risen yet.)

SNPP_BTD_21Oct2014_0715-0900

Suomi NPP Brightness Temperature Difference (11.45 µm – 3.74 µm) and 0715 and 0900 UTC, 21 October 2014 (Click to enlarge)

IFR Probability when an extratropical storm passes by

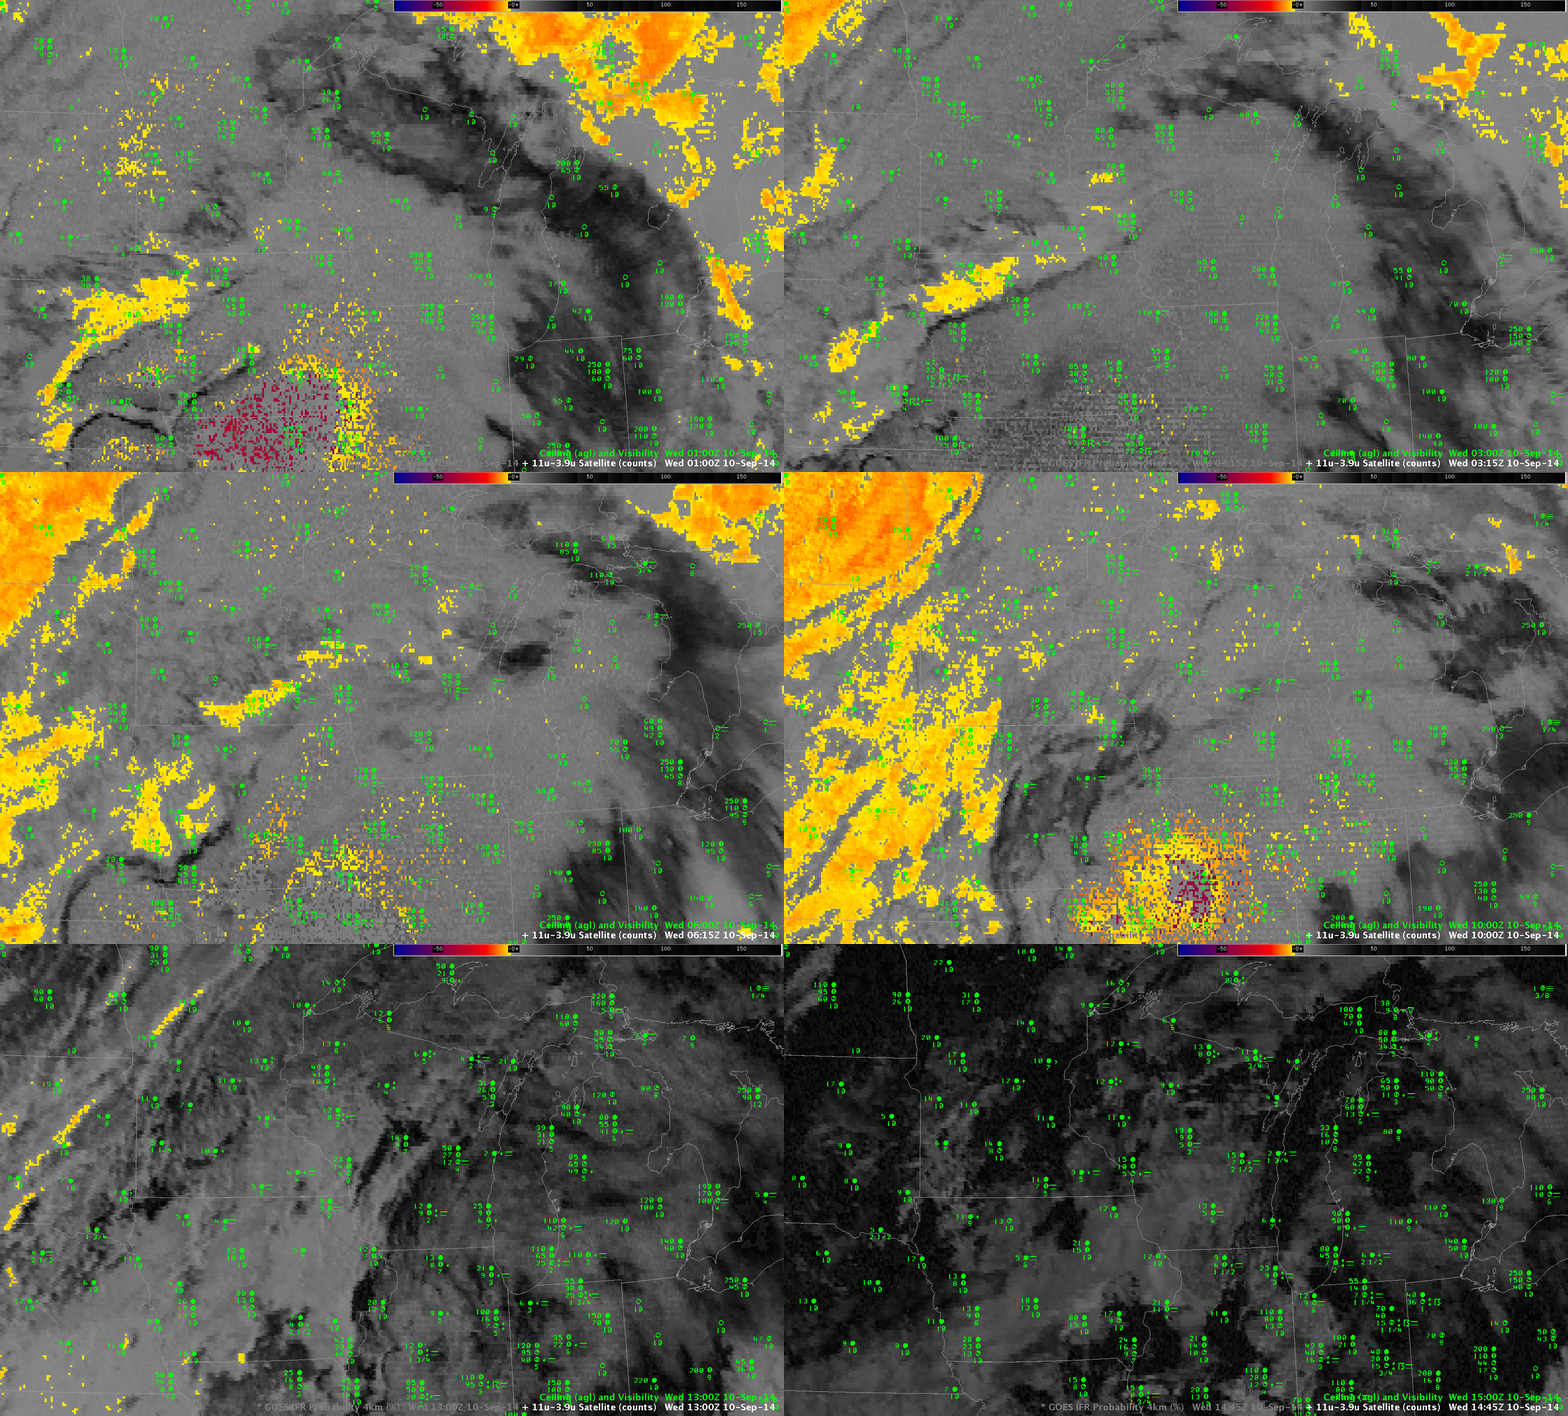
The approach of an extratropical cyclone, such as the Colorado Cyclone in this animation in the upper Midwest on 10 September 2014, will frequently result in areas of IFR or near-IFR conditions. However, the many cloud layers that accompany these baroclinic disturbances will always make difficult the task of identifying (using satellite imagery) regions of low stratus and fog. Consider the animation below of Brightness Temperature Difference (10.7µm – 3.9µm) fields (a traditional method of detecting water-based clouds) over the Upper Midwest on 10 September.

BTD_10Sep2014_02-14UTC

Color-enhanced Brightness Temperature Difference fields (10.7µm – 3.9µm), hourly from 0100 UTC to 1400 UTC on 10 September 2014 (Click to enlarge)

Interpretation of this loop is time-consuming. Not only is there little distinct signal related to observed IFR and near-IFR conditions, but the rising sun (at the end of the animation) causes the Brightness Temperature Difference to flip sign, altering the enhancement. There are regions where the Brightness Temperature Difference field detects water-based clouds that may be associated with fog or stratus, chiefly over the western third of the domain (and especially over the Dakotas) in the later half of the animation.

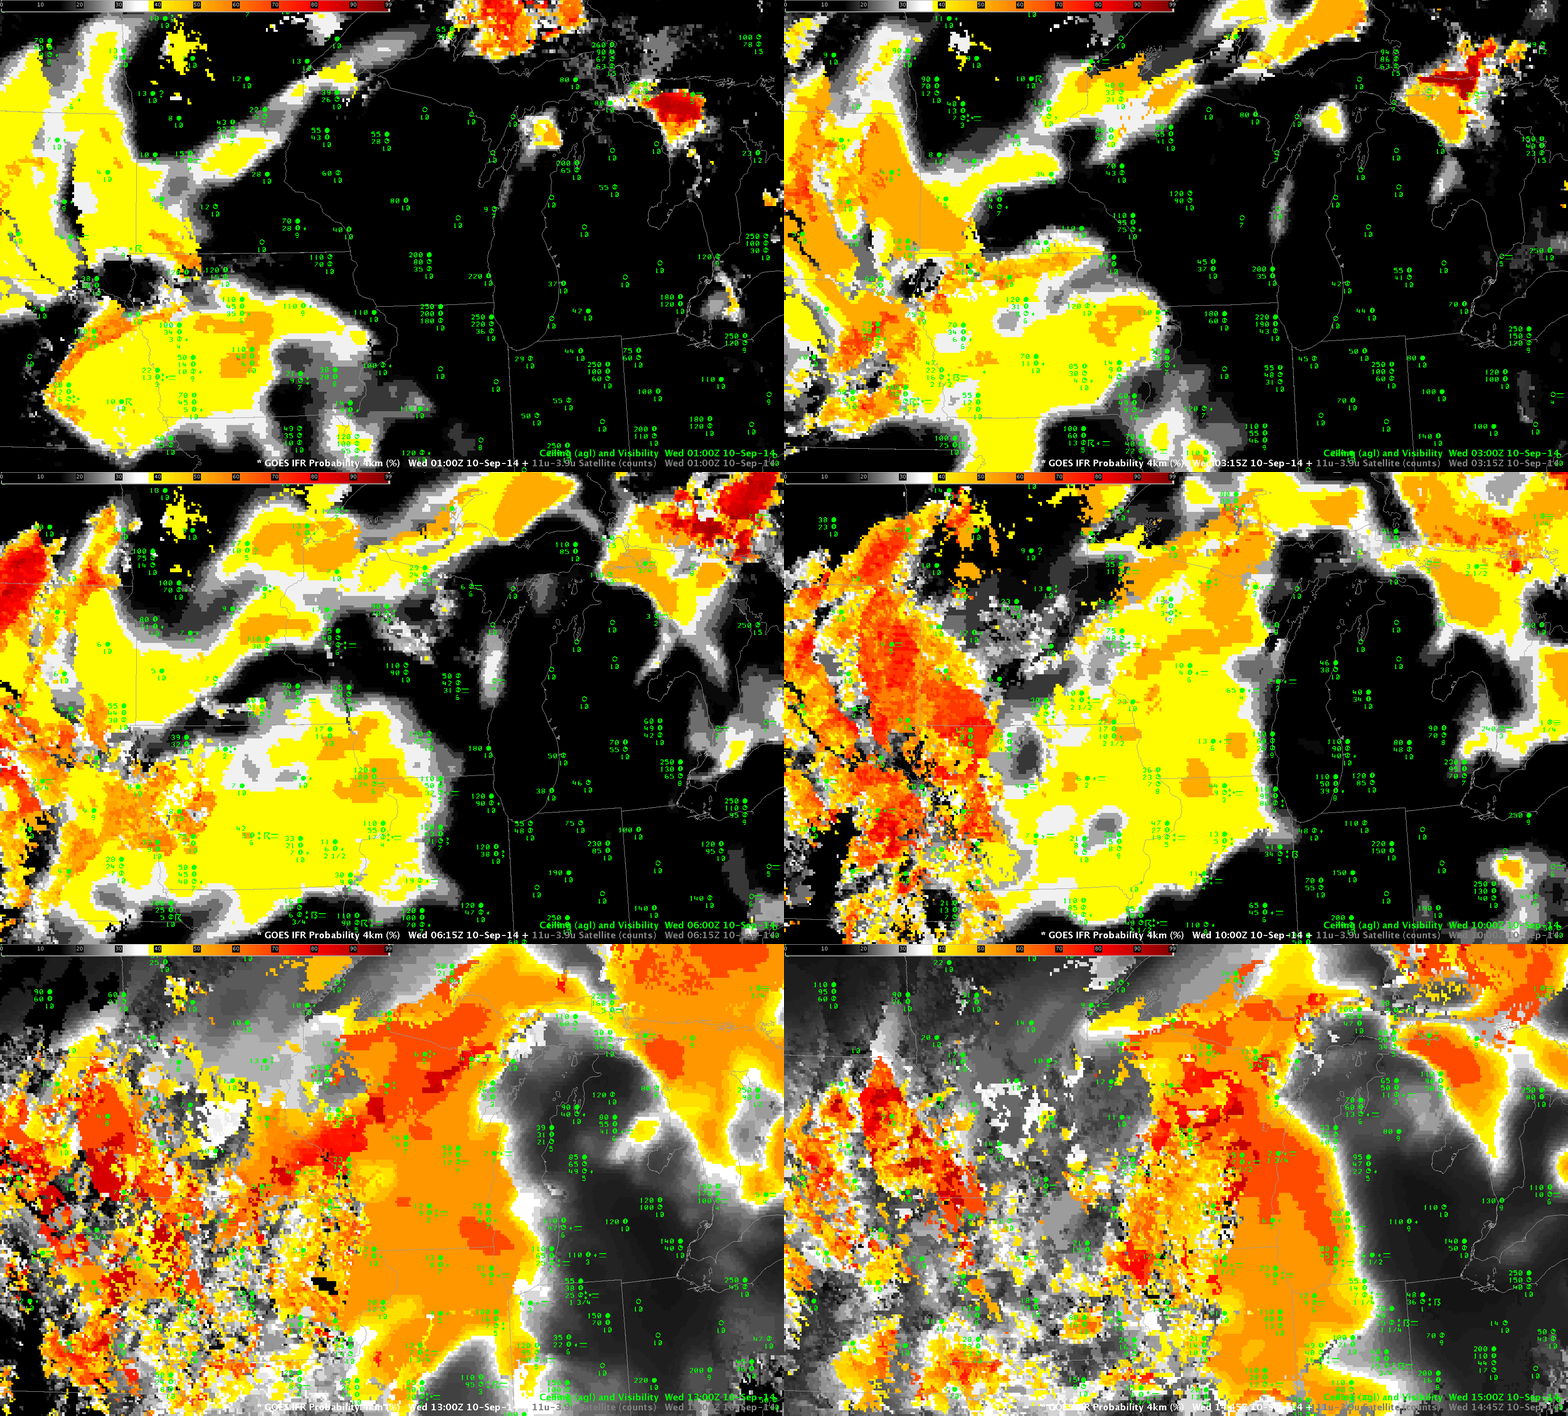
Compare the animation above to the loop of IFR Probabilities for the same time period below. IFR Probabilities are highest where near-IFR or IFR conditions are present, and the IFR Probability field screens out regions where low stratus (but not fog) is present, such as over the Dakotas at the end of the animation. Regions where IFR Probability fields have a flat character — such as over Wisconsin around sunrise — are where only Rapid Refresh model data (but not satellite data) are used as predictors, and the field does not have pixel-scale variability. Because fewer predictors are used, the magnitude of the IFR Probability is smaller than in regions where both satellite and model data can be used as Predictors. Thus, a flat field (over eastern Wisconsin at the end of the animation, or over Iowa at the beginning) has values that should be interpreted differently from similar values in regions where both satellite and model data can be used in the computation of IFR Probabilities.

IFRPROB_10Sep2014_01-14UTC

GOES-R IFR Probability fields (Computed from GOES-13 and Rapid Refresh Data), hourly from 0100 UTC to 1400 UTC on 10 September 2014 (Click to enlarge)

MODIS-based and GOES-based IFR Probabilities over the High Plains

GOES_IFR_0430_03Sep2014

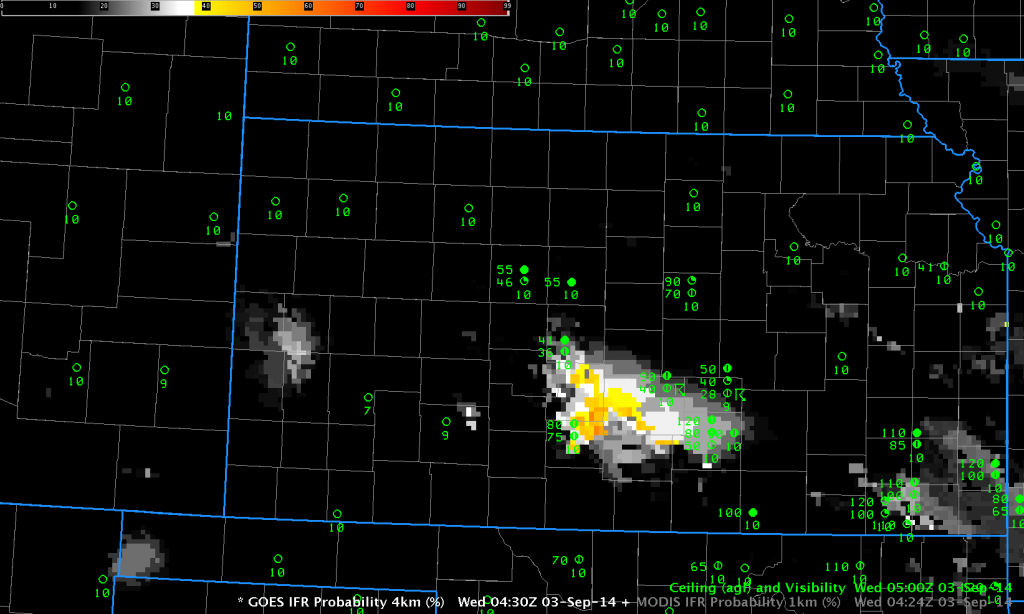
GOES-based GOES-R IFR Probabilities over Kansas and surrounding states, 0430 UTC 3 September 2014 (Click to enlarge)

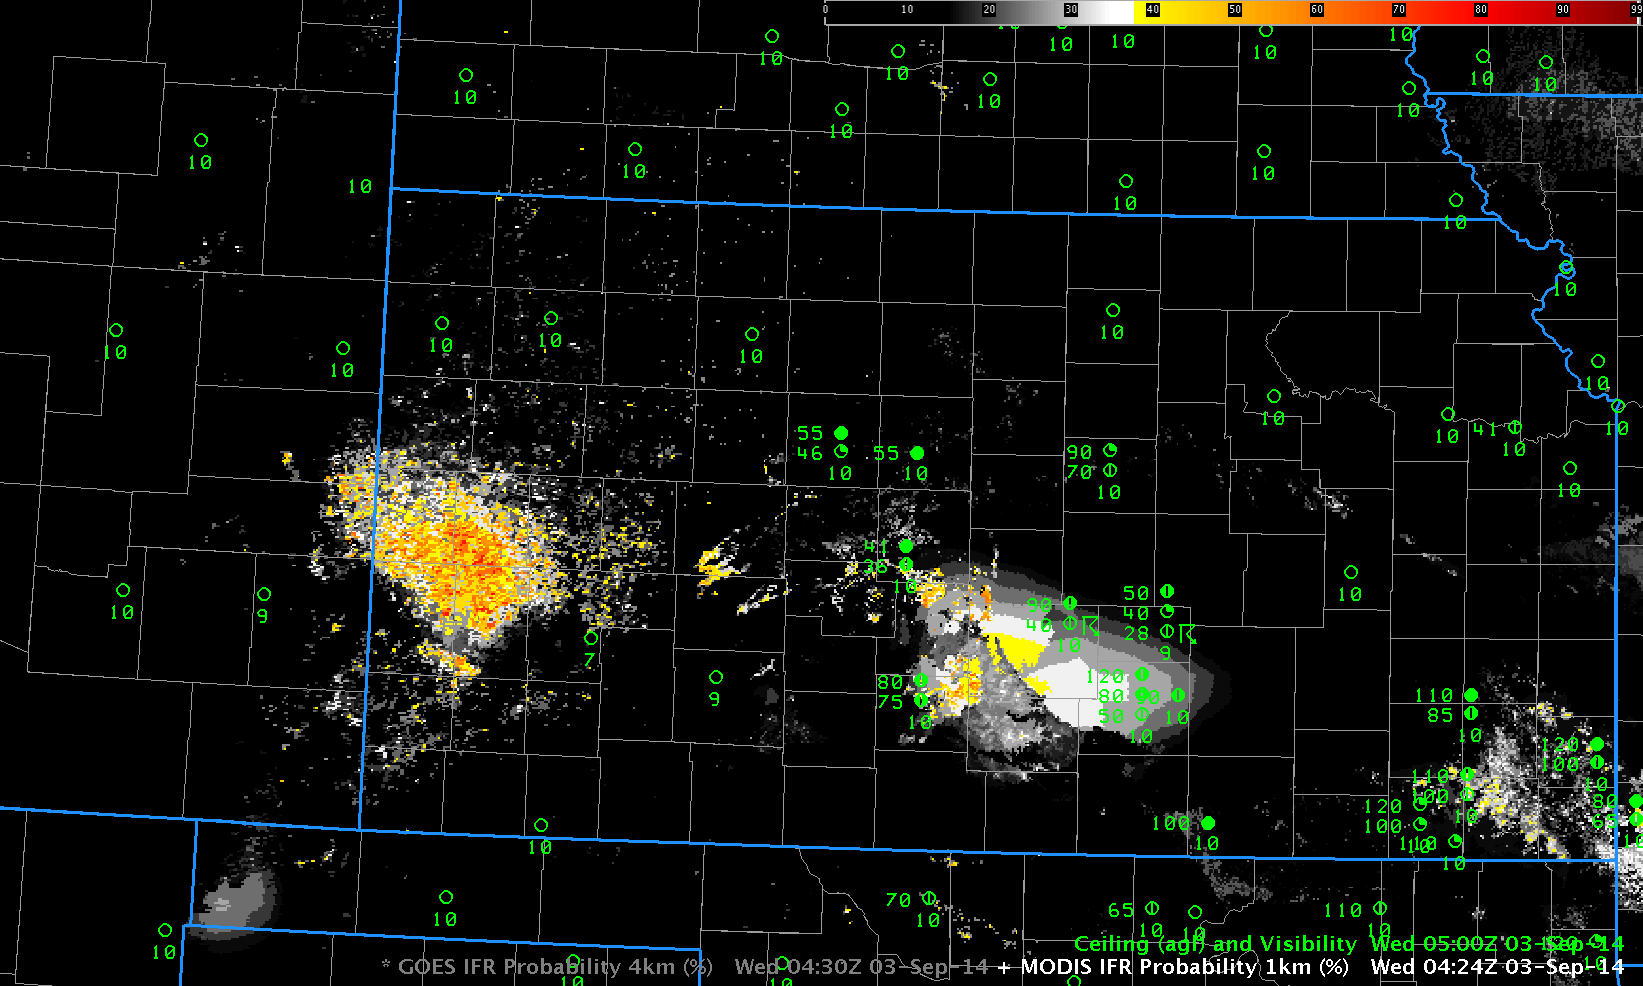
GOES-based IFR Probabilities over Kansas before midnight on 2 September highlight two regions where IFR Conditions might be developing: over western Kansas, near the Colorado border, and over south-central Kansas. These would be two places to monitor most closely over the coming hours. The MODIS-based IFR Probabilities for the same time, below, can be used to refine the interpretation of the GOES fields. IFR probabilities over western Kansas are higher with the MODIS data. IFR Probabilities from MODIS better capture the difference in the field over south-central Kansas as well: there is a more obvious distinction between IFR Probabilities influenced solely by model output (because of the multiple cloud layers associated with the thunderstorm at Hutchinson and Newton) and those controlled by both model and satellite predictors. The strength of GOES-based IFR Probabilities is temporal continuity. How do the fields evolve with time?

MODIS_IFR_0424UTC_03Sep2014

MODIS-based GOES-R IFR Probabilities over Kansas and surrounding states, 0424 UTC 3 September 2014 (Click to enlarge)

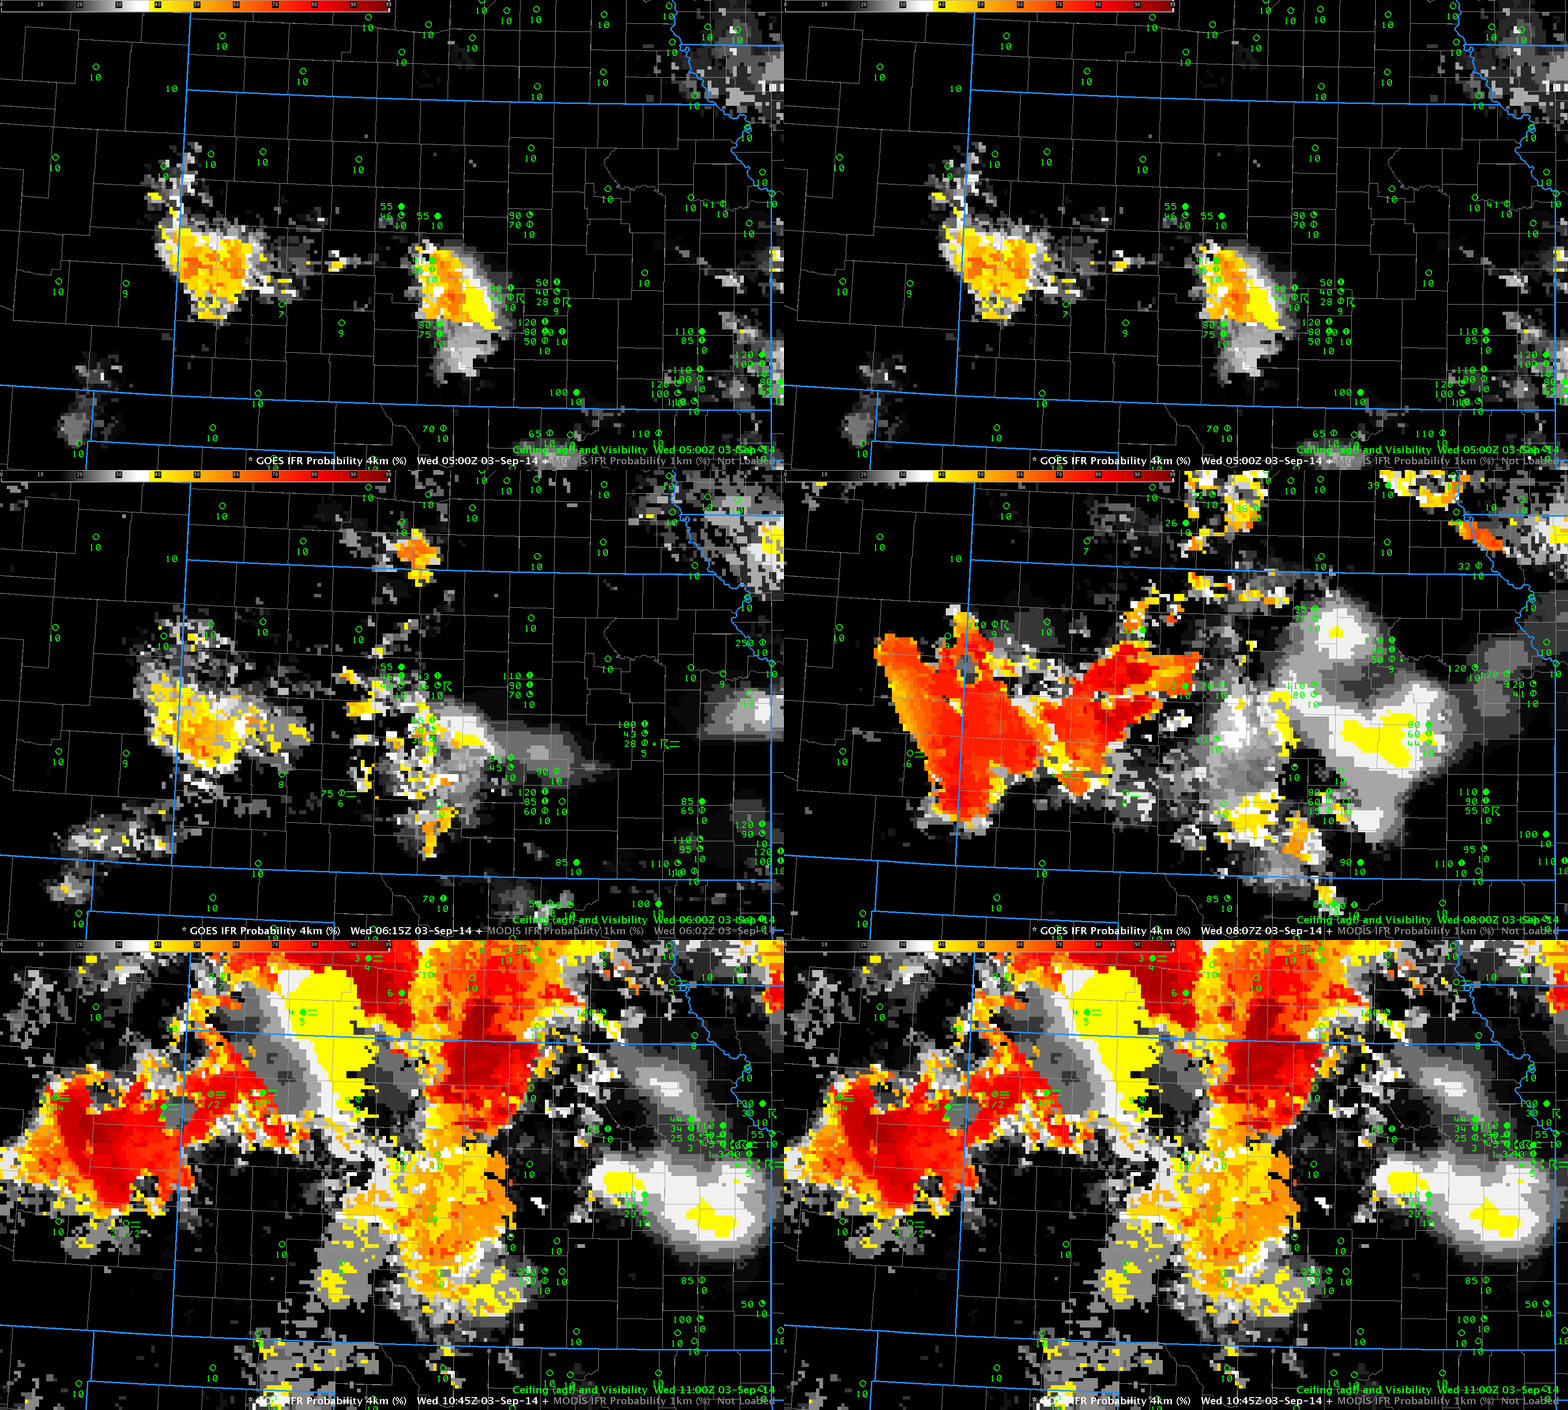
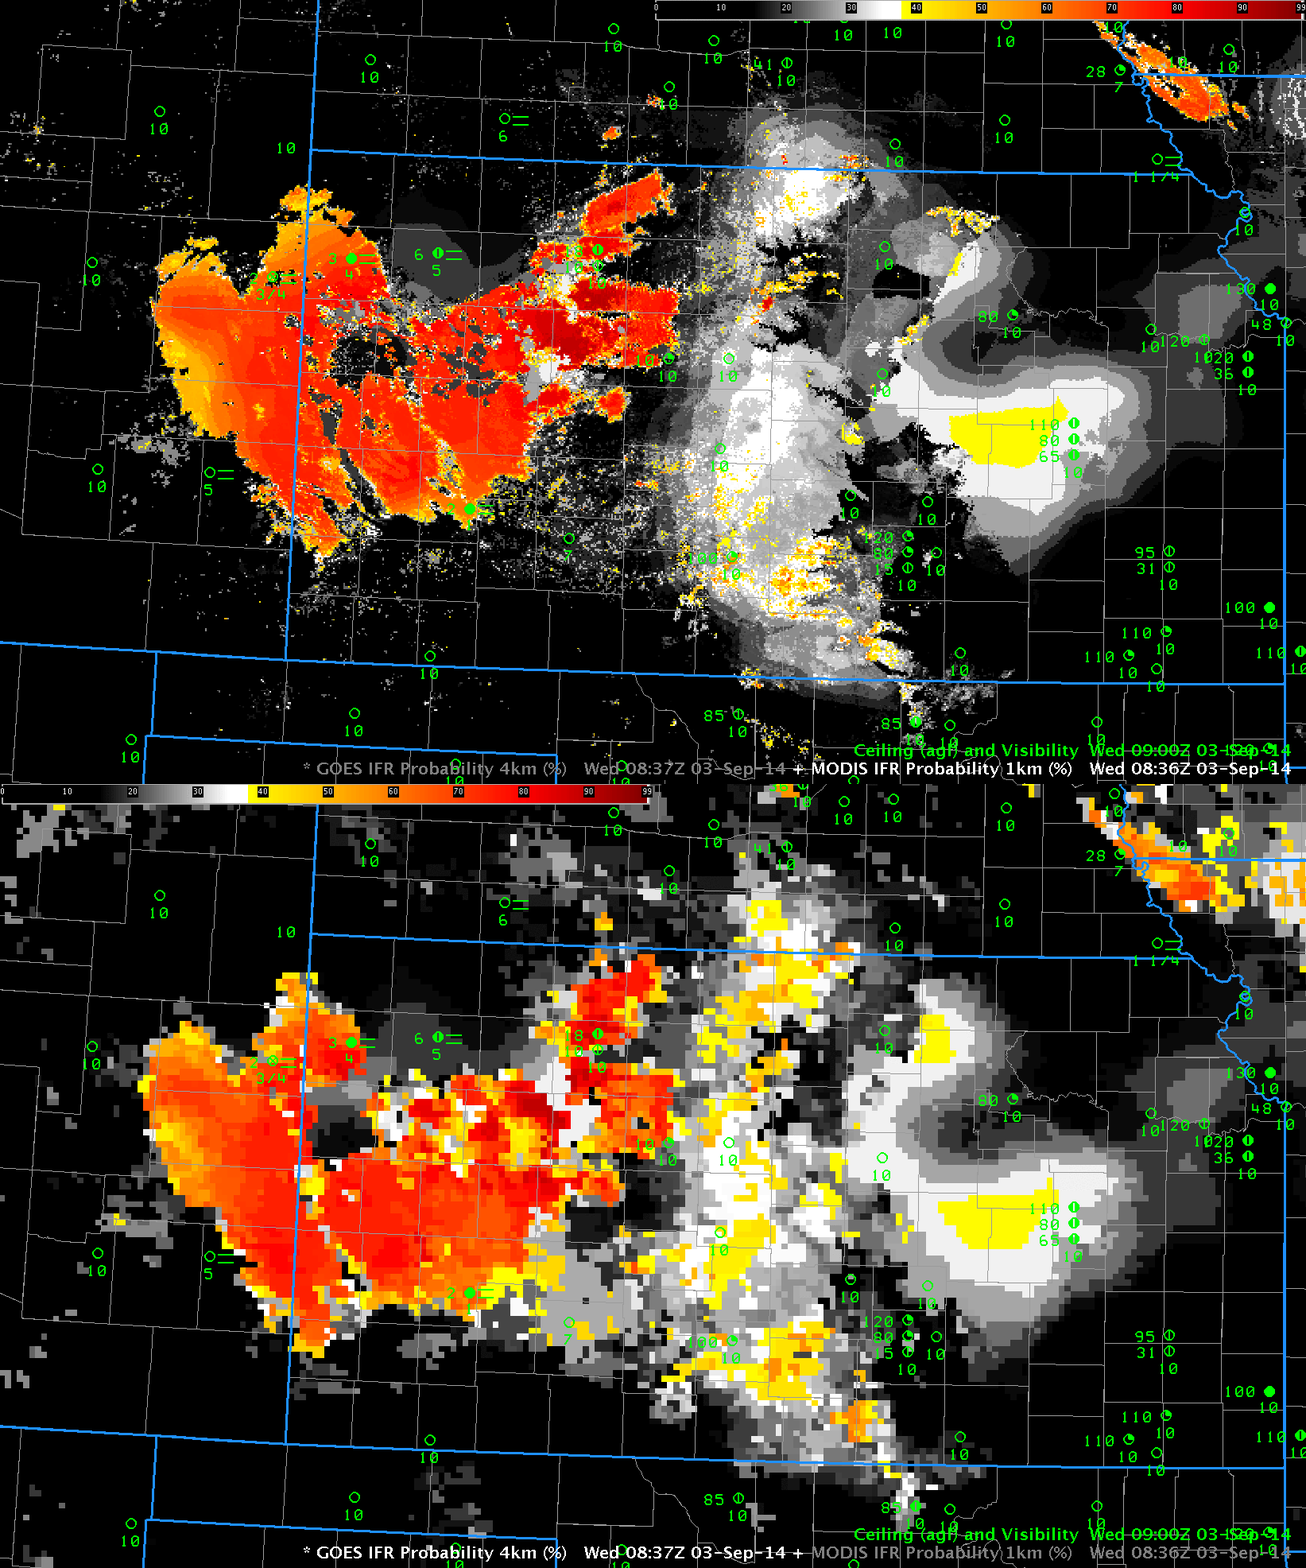
The animation below of GOES-based IFR Probabilities shows increasing values over western Kansas (the region drifts northward, as well); by 1045 UTC, at the end of the animation, IFR Probabilities are very high over western and northwestern Kansas, and IFR conditions are observed in the form of both low ceilings and reduced visibilities. This was a case where MODIS data gave an early alert to where GOES-based IFR probabilities might later become high. Fog can start at small scales and then grow in size and MODIS data offers an advantage of higher spatial resolution. A toggle between the MODIS and GOES-based IFR Probabilities at 0836 UTC is at bottom.

GOES_IFR_0500-1045UTC_03Sep2014

GOES-based GOES-R IFR Probabilities over Kansas and surrounding states, times as indicated on 3 September 2014 (Click to enlarge)

MODIS_GOES_IFR_0837UTC_3Sep2014

MODIS- and GOES-based GOES-R IFR Probabilities over Kansas and surrounding states, 0836 UTC on 3 September 2014 (Click to enlarge)

IFR Probabilities over the Texas Panhandle

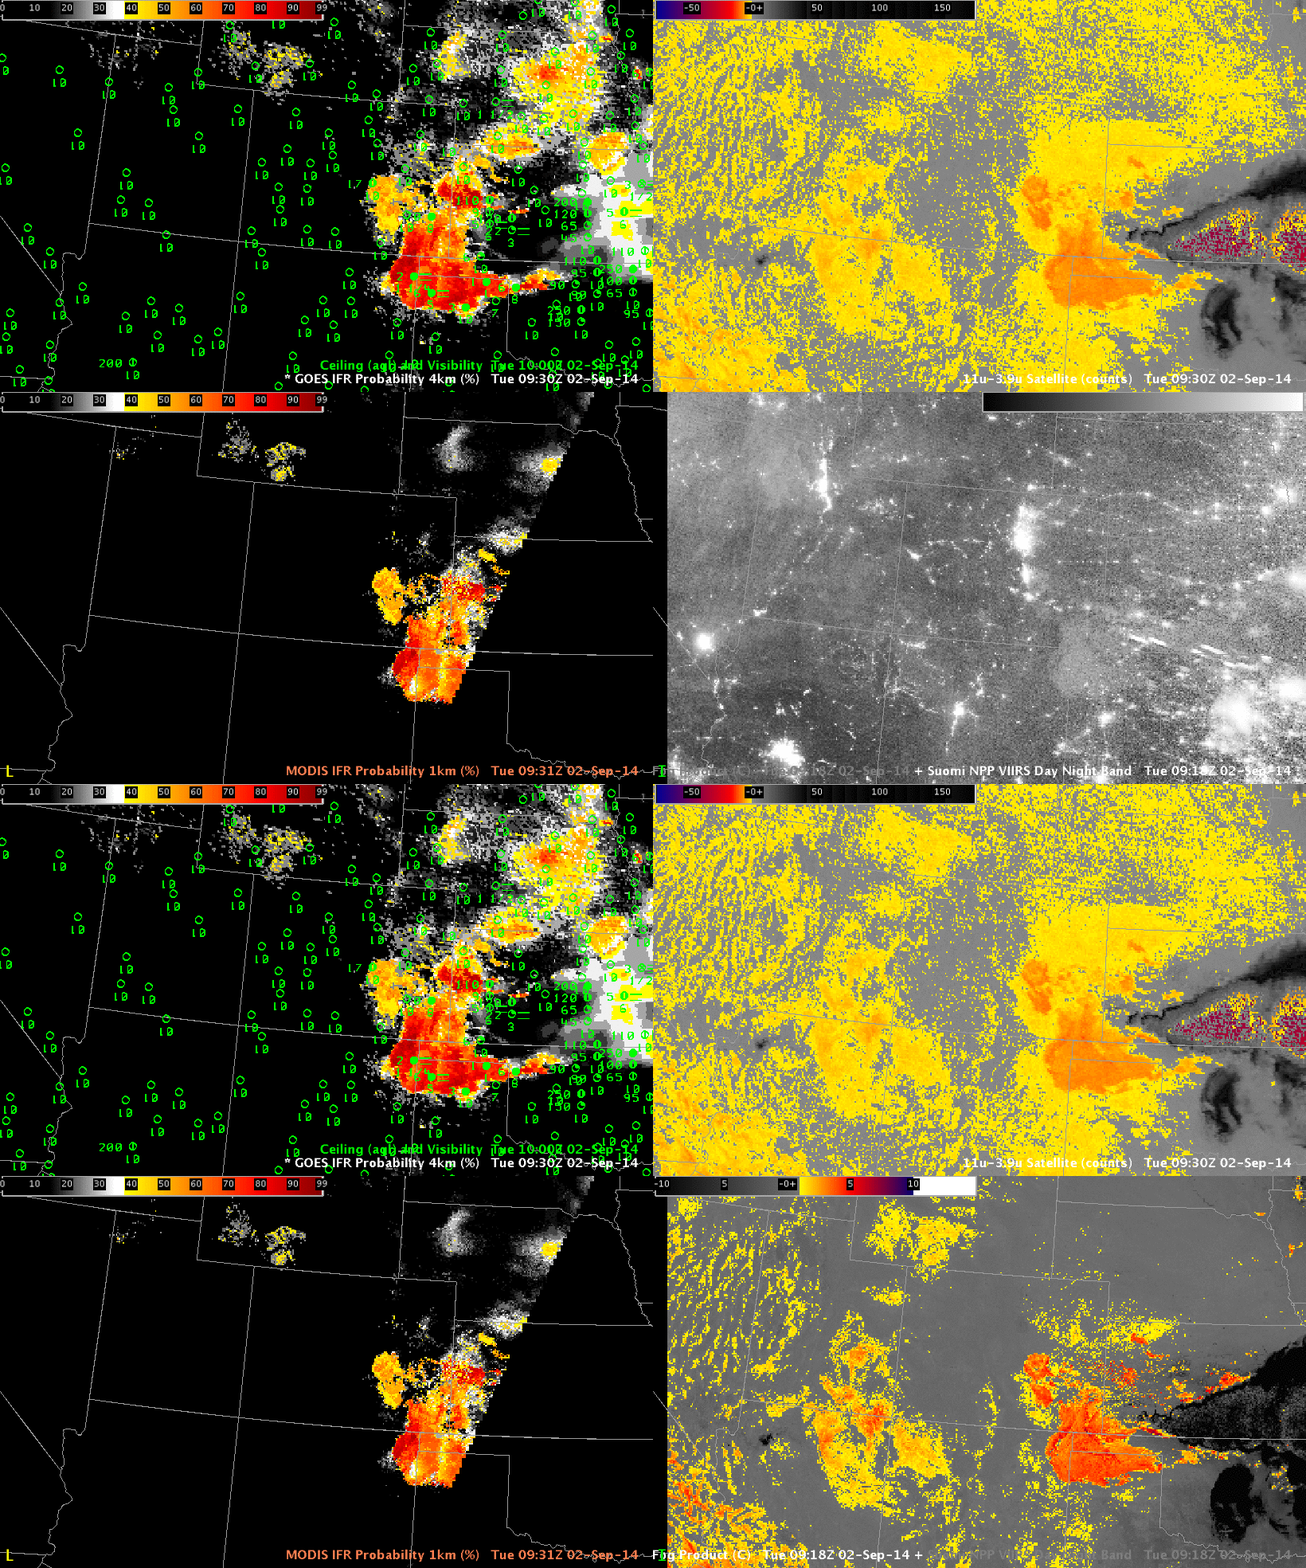
GOES_MODIS_IFR_SNPP_BTD-DNB_0930UTC_02Sep2014

GOES-R IFR Probabilities (Upper Right), GOES-13 Brightness Temperature Difference (10.7 µm – 3.9 µm) (Upper Left), MODIS IFR Probabilities (Lower Left), Suomi NPP Brightness Temperature Difference (11.35 µm – 3.74 µm) and Day Night Band (Lower Right), all near 0930 UTC 2 September 2014 (Click to enlarge)

GOES-R IFR Probabilities (from GOES and from MODIS) over the Great Plains and southern Rockies indicated one region where IFR conditions were most likely: over the Texas panhandle, where IFR conditions were reported. There is a strong signal in the GOES-based Brightness Temperature Difference field there (and in the Suomi NPP Brightness Temperature Difference field) as well. There is also a Brightness Temperature difference signal in regions where IFR conditions are not occurring; in those locations, stratus is present, or (over the Rockies) emissivity differences in the dry soil are present, both of which conditions will lead to a signal in the brightness temperature difference that is unrelated to surface visibility and ceilings. This is therefore another example showing how incorporation of model data that accurately describes saturation (or near-saturation) in the lowest model layers can help the GOES-R IFR Probability more accurately depict where IFR conditions are present.

IFR Conditions over the southern Plains

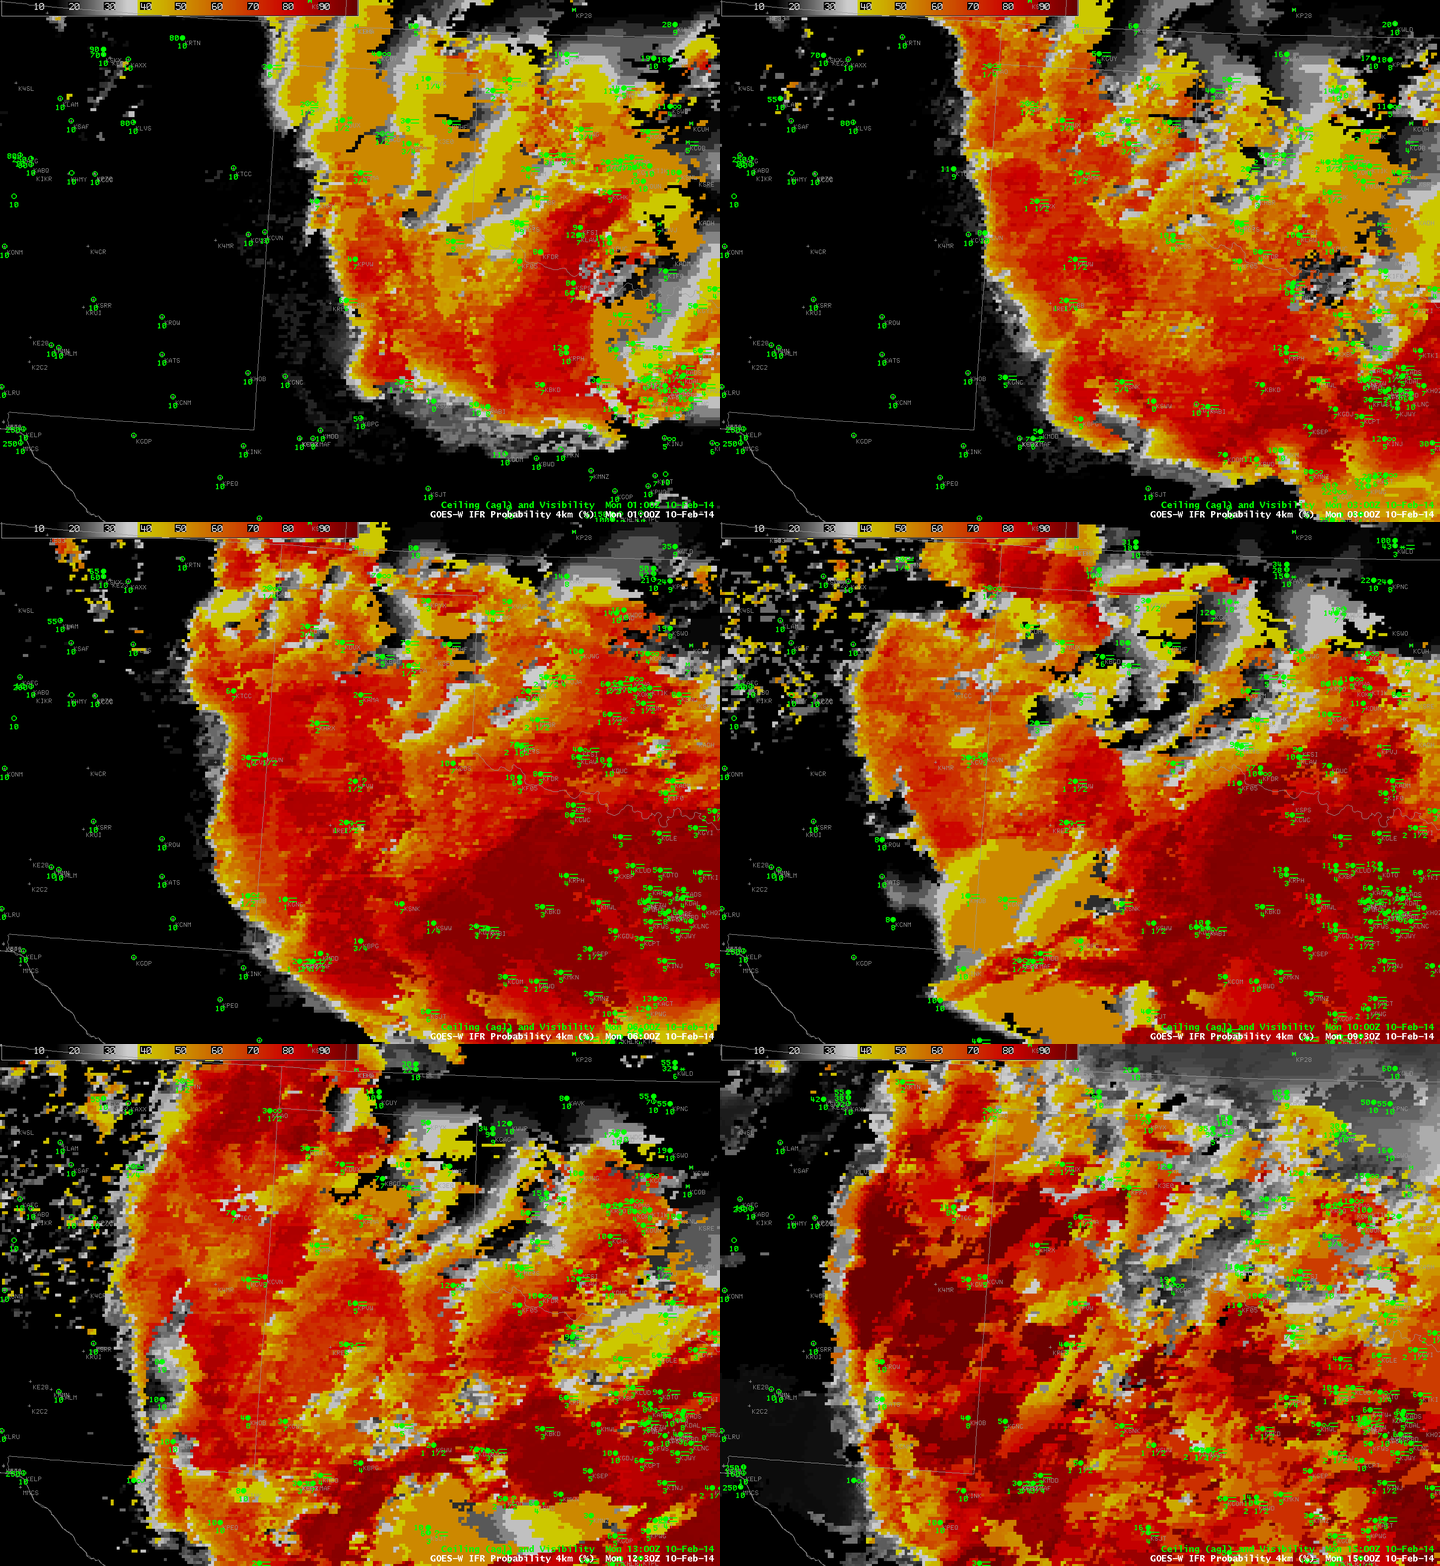
GOES_IFR_PROB_20140210loop

GOES-R IFR Probabilities from 0100 through 1500 UTC on 10 February 2014 (click image to enlarge)

Cold air dropping southward through the southern Plains is sometimes shunted westward towards higher elevation on the Equatorward side of the Polar High that anchors the cold air. That upslope flow facilitates the development of fog and low stratus. That was the case today, and the southward and westward movement of low clouds/fog is obvious in the IFR Probability field animation shown above. Much of the High Plains south of Kansas had reduced visibility and lowered ceilings, and IFR Probabilities were high.

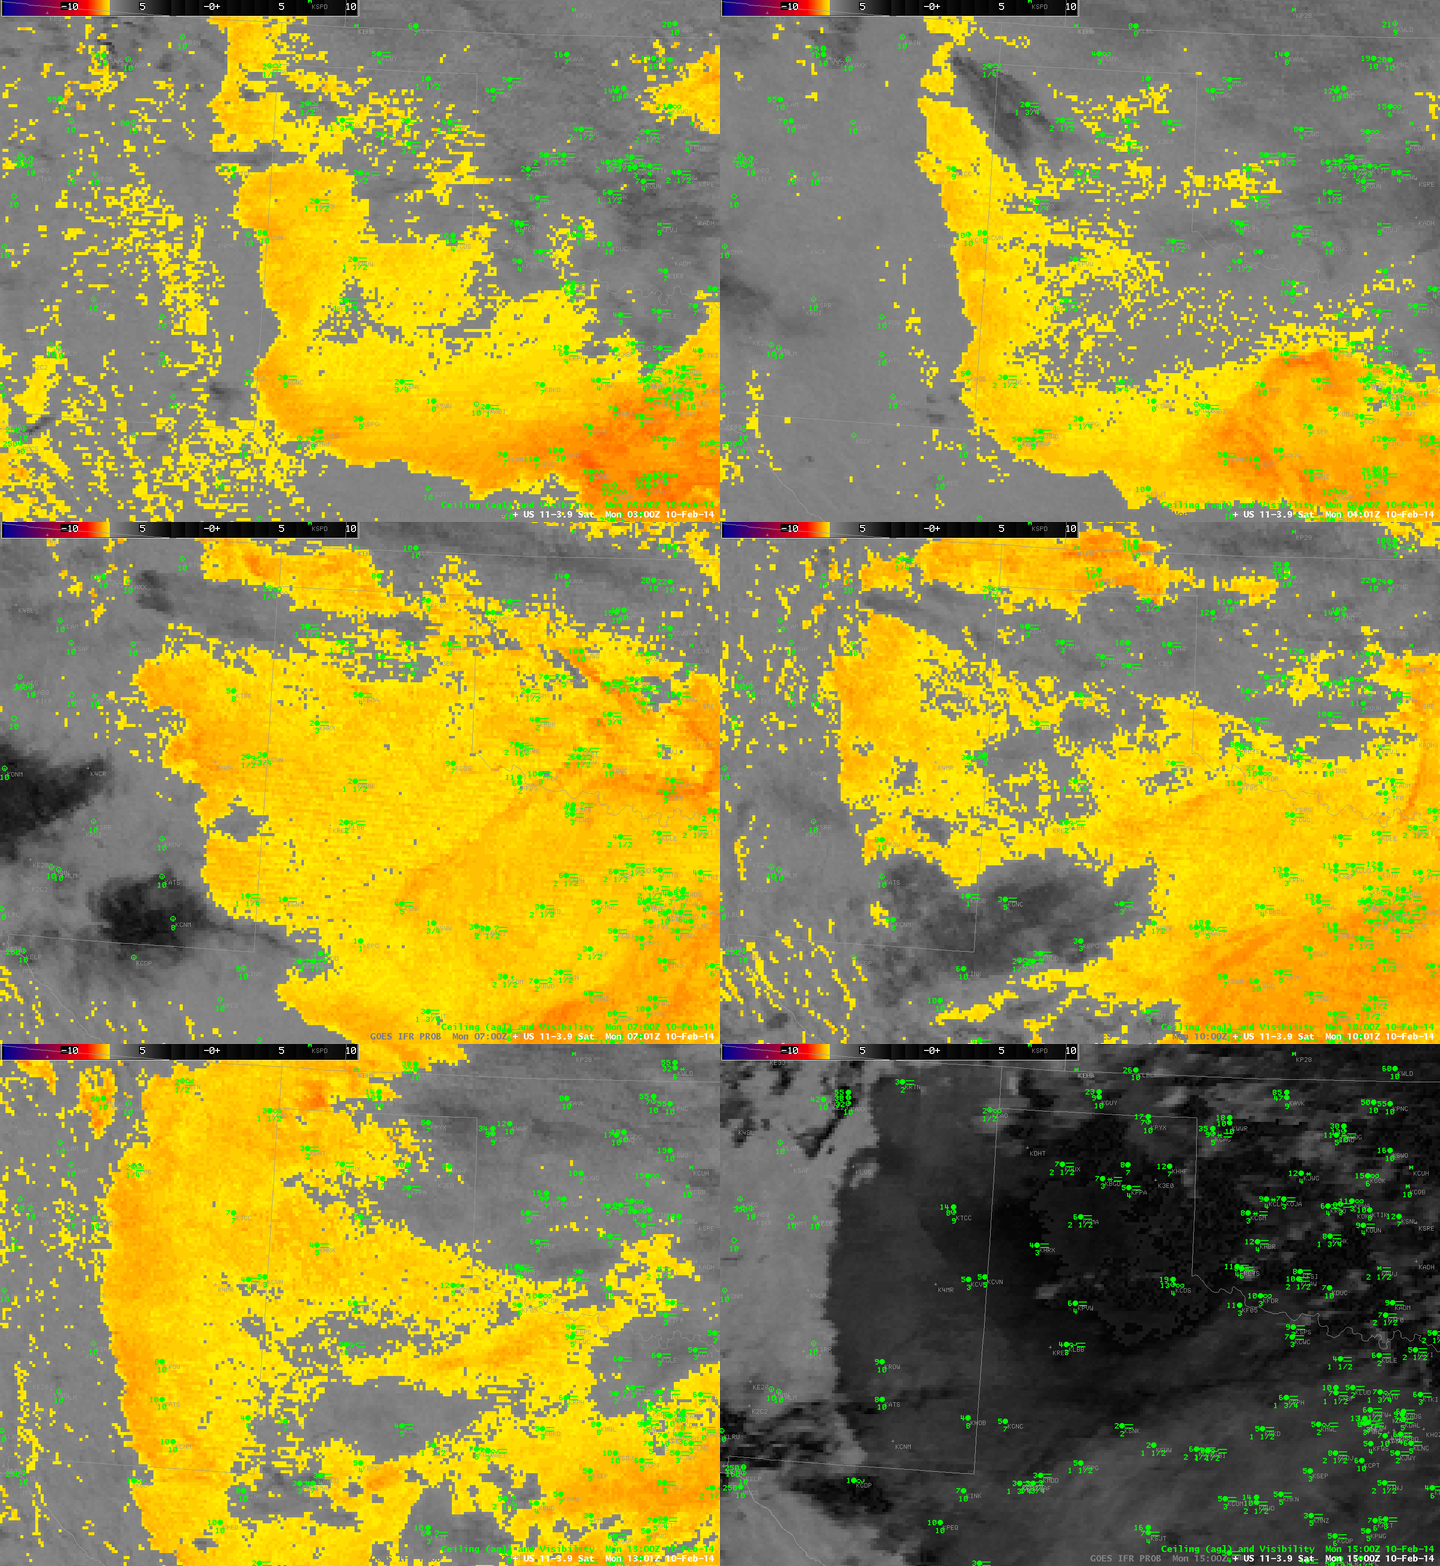
The IFR Probability field does a better job of outlining where the low clouds associated with IFR Conditions are present. Compare the half-hourly loop above to the hourly loop of the Brightness Temperature Difference (10.7 µm – 3.9 µm), below. Regions with multiple cloud layers show little signal in the brightness temperature field, and the flip in signal at sunrise — as 3.9 µm radiation from the Sun is reflected off the clouds, overwhelming the emitted signal — is obvious.

US_11-3.9_Sat_20140210loop

GOES-East Brightness Temperature Difference (10.7 µm – 3.9 µm) 0300 through 1500 UTC on 10 February 2014 (click image to enlarge)

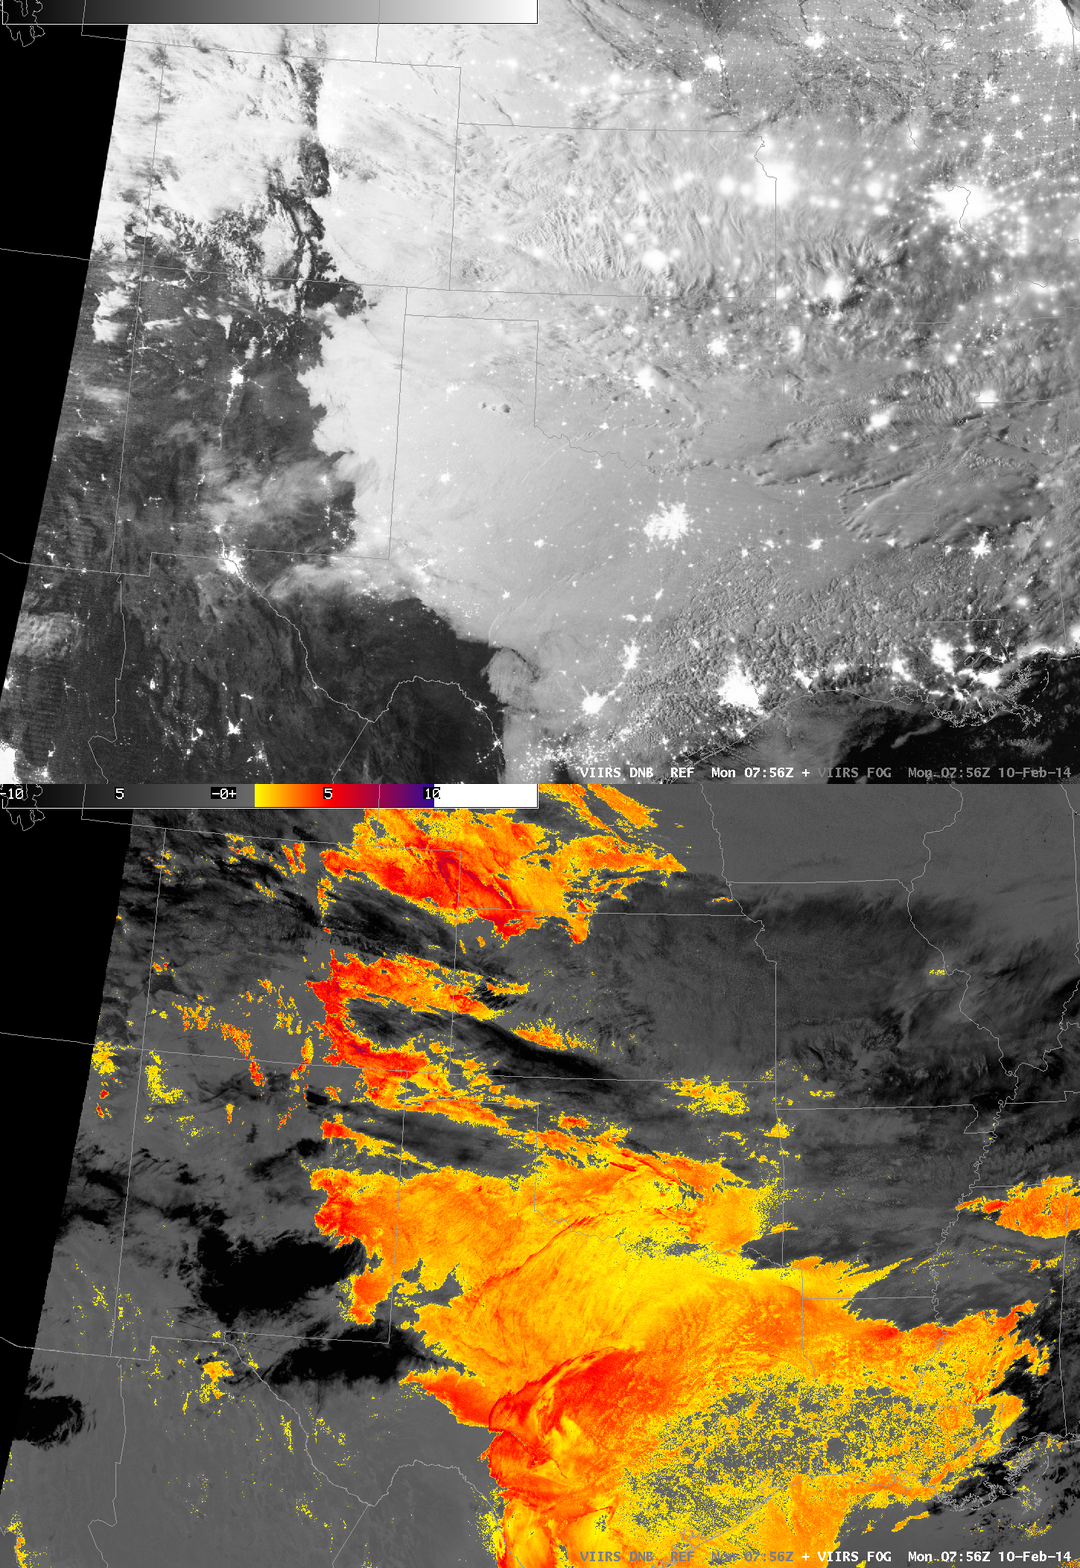
Polar-orbiting satellites can give high-resolution views of scenes. Suomi/NPP carries the VIIRS instrument, which has a Day/Night band and 11.35 and 3.74 µm channels, shown below in a toggle. Of course, these views are telling you something about the top of the clouds only. Whether of not visibility/ceiling restrictions are happening is unknown. GOES-R IFR Probability algorithms have not yet been configured for Suomi/NPP data (such a configuration is complicated by the lack of a water vapor channel on VIIRS). The characteristic signal of high clouds — dark features in the enhancement used — shows up in the VIIRS Brightness Temperature Difference field.

VIIRS_20140210_0756

Suomi/NPP VIIRS Day/Night band and Brightness Temperature Difference (11.35 µm – 3.74 µm) at 0756 UTC on 10 February 2014 (click image to enlarge)

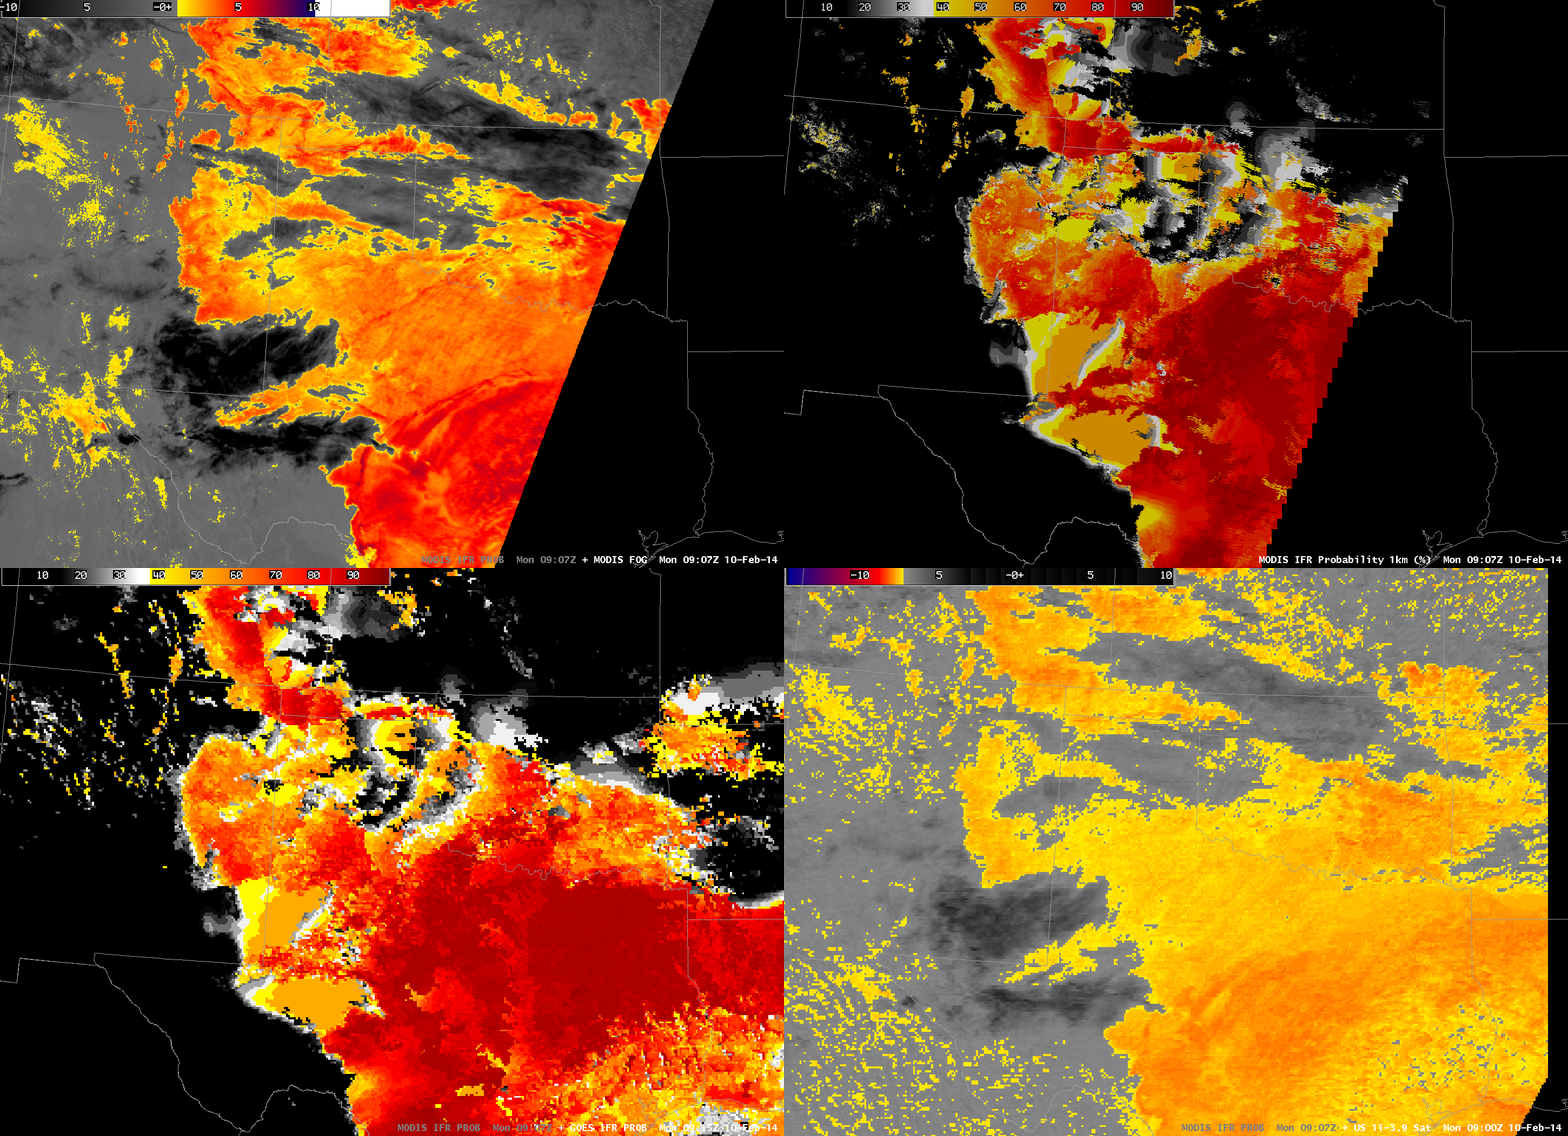
MODIS data includes water vapor imagery, and thus GOES-R IFR Probability fields can be computed using MODIS data, as shown below from 0907 UTC. This toggle includes MODIS-based Brightness Temperature Differences, MODIS-based GOES-R IFR Probabilities, GOES-based GOES-R IFR Probabilities and GOES Brightness Temperature Differences. The shortcoming of the MODIS-based data is obvious (it doesn’t view the entire scene), but its strength (excellent spatial resolution) is also apparent.

MODIS_GOES_BTD_IFR_0900

MODIS Brightness Temperature Difference (11 µm – 3.9 µm), MODIS-based GOES-R IFR Probabilities, GOES-based GOES-R IFR Probabilities and GOES-East Brightness Temperature Differences (10.7 µm – 3.9 µm) at ~0910 UTC on 10 February 2014 (click image to enlarge)

IFR Conditions over Oklahoma and Kansas

GOES_IFR_PROB_20140108_2345

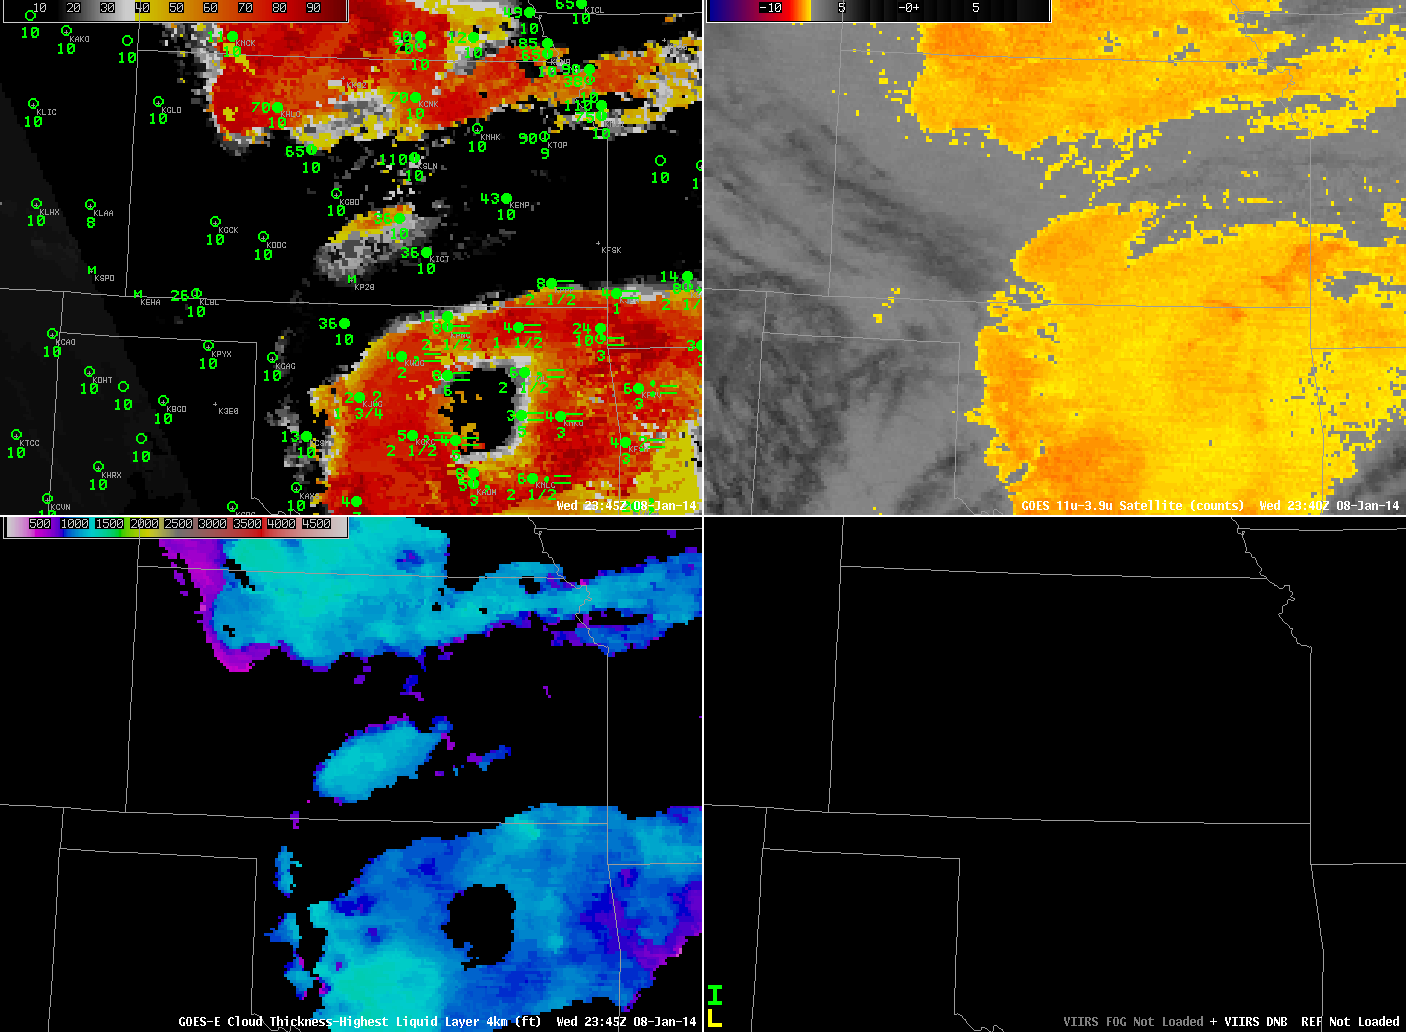
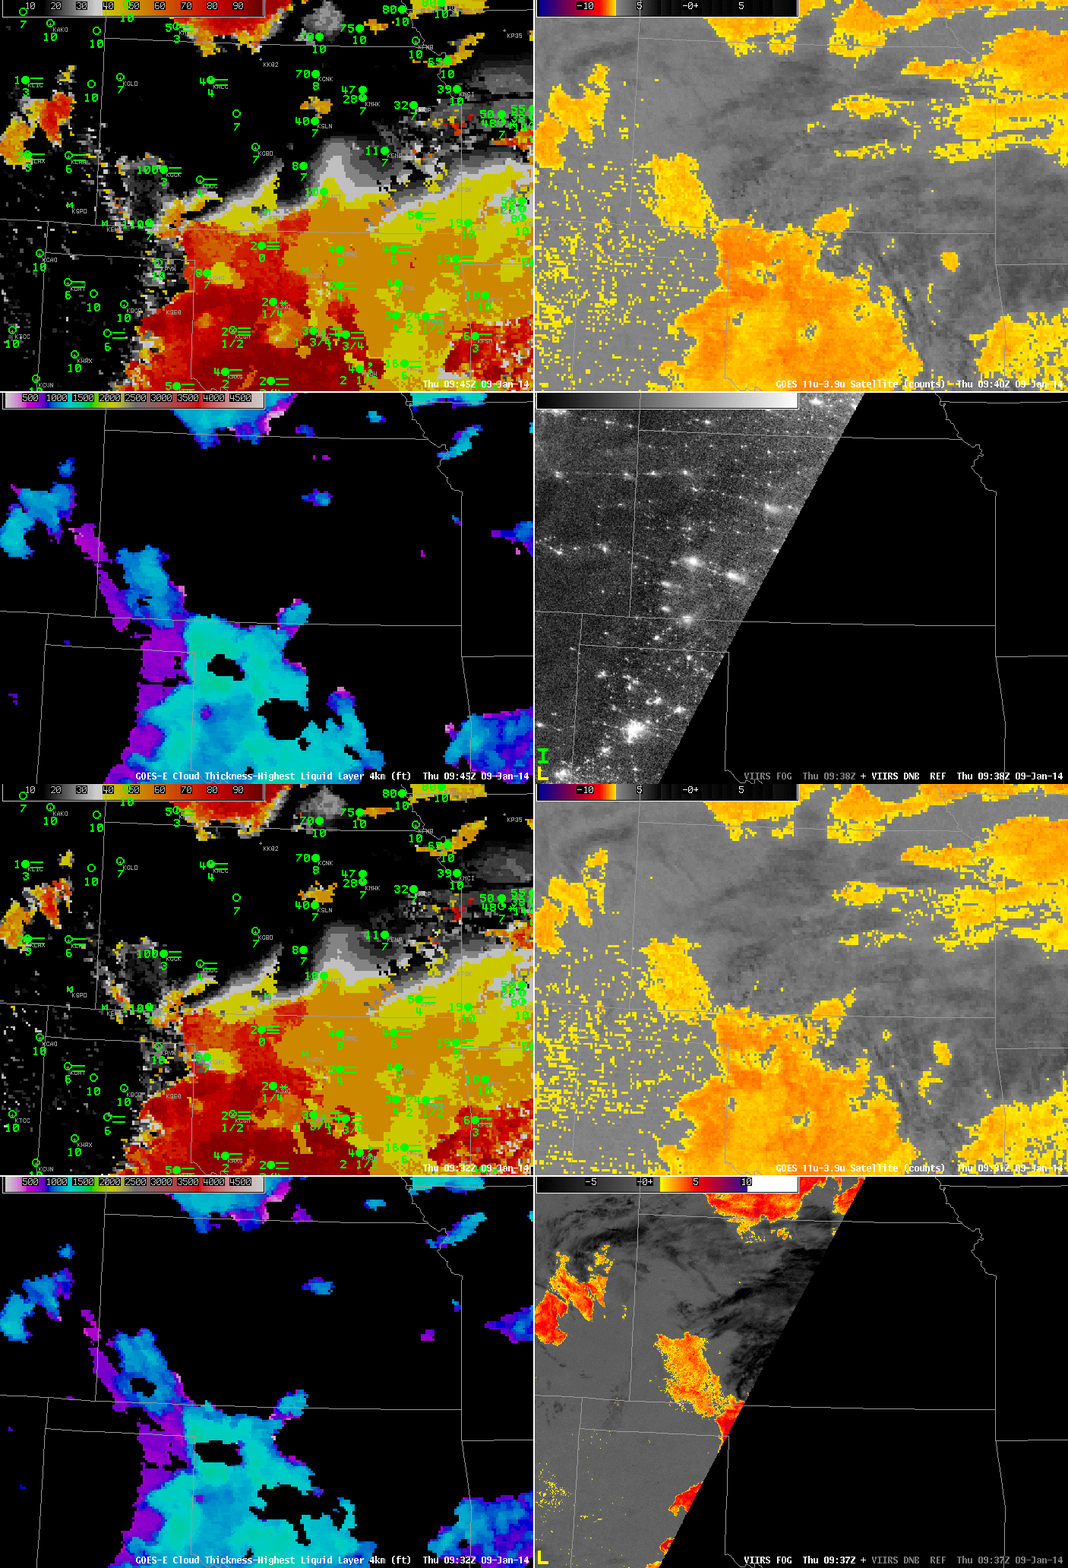
GOES-R IFR Probabilities from GOES-13 (upper left), GOES-13 Brightness Temperature Difference (10.7 µm – 3.9 µm) Fields (upper right), GOES-R Cloud Thickness from GOES-13 (lower left), Suomi/NPP Day/Night Band (lower right), ~2345 UTC 8 January 2014 (click image to enlarge)

IFR Conditions developed over portions of Kansas and Oklahoma (and adjacent states) overnight. How did the GOES-R IFR Probability field diagnose the development of this event? At ~0000 UTC, the traditional method of low stratus/fog detection (Brightness Temperature Difference) showed two regions over the Plains, one centered over Oklahoma, and one over the Kansas/Nebraska border. IFR Probabilities at the same time covered a smaller area; Wichita in particular had low IFR Probabilities despite a brightness temperature difference signal, and Wichita did not report IFR conditions at the time.

Note that high clouds are also present in the Brightness Temperature Difference field over western Kansas, the panhandles of Texas and Oklahoma, and New Mexico. In the enhancement used, high clouds are depicted as dark greys.

GOES_IFR_PROB_20140109_0202

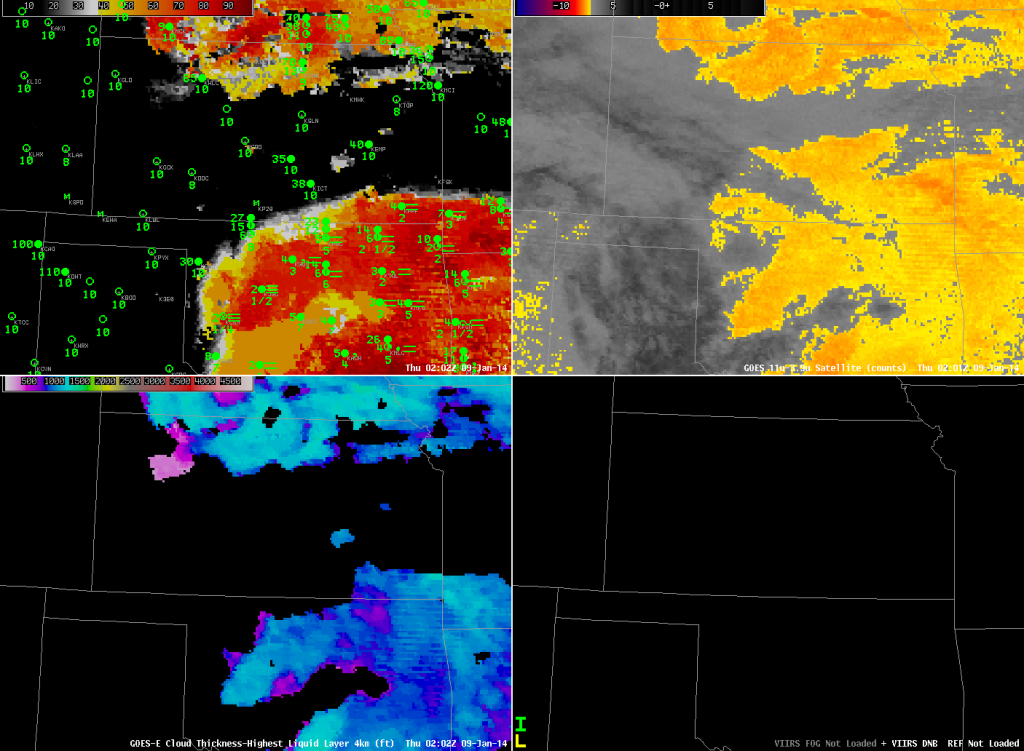
As above, but at 0202 UTC 9 January 2014 (click image to enlarge)

By 0200 UTC (above), the high clouds have moved over parts of Oklahoma and Kansas. Consequently, there are regions over central Oklahoma and south-central Kansas where the brightness temperature difference field is not useful in detecting low stratus/fog that is occurring. The IFR Probability fields suggest the presence of low clouds despite the lack of satellite data because the IFR Probability Field also uses output from the Rapid Refresh Model that suggests saturation is occurring in those regions. Model data are also used where satellite data suggest low clouds/stratus are present to delineate where surface ceilings/visibilities are congruent with IFR conditions. As at 2345 UTC, Wichita is not reporting IFR conditions, although the brightness temperature difference field suggests IFR conditions might exist. The IFR Probability field correctly shows low values there.

GOES_IFR_PROB_20140109_0802_VIIRS

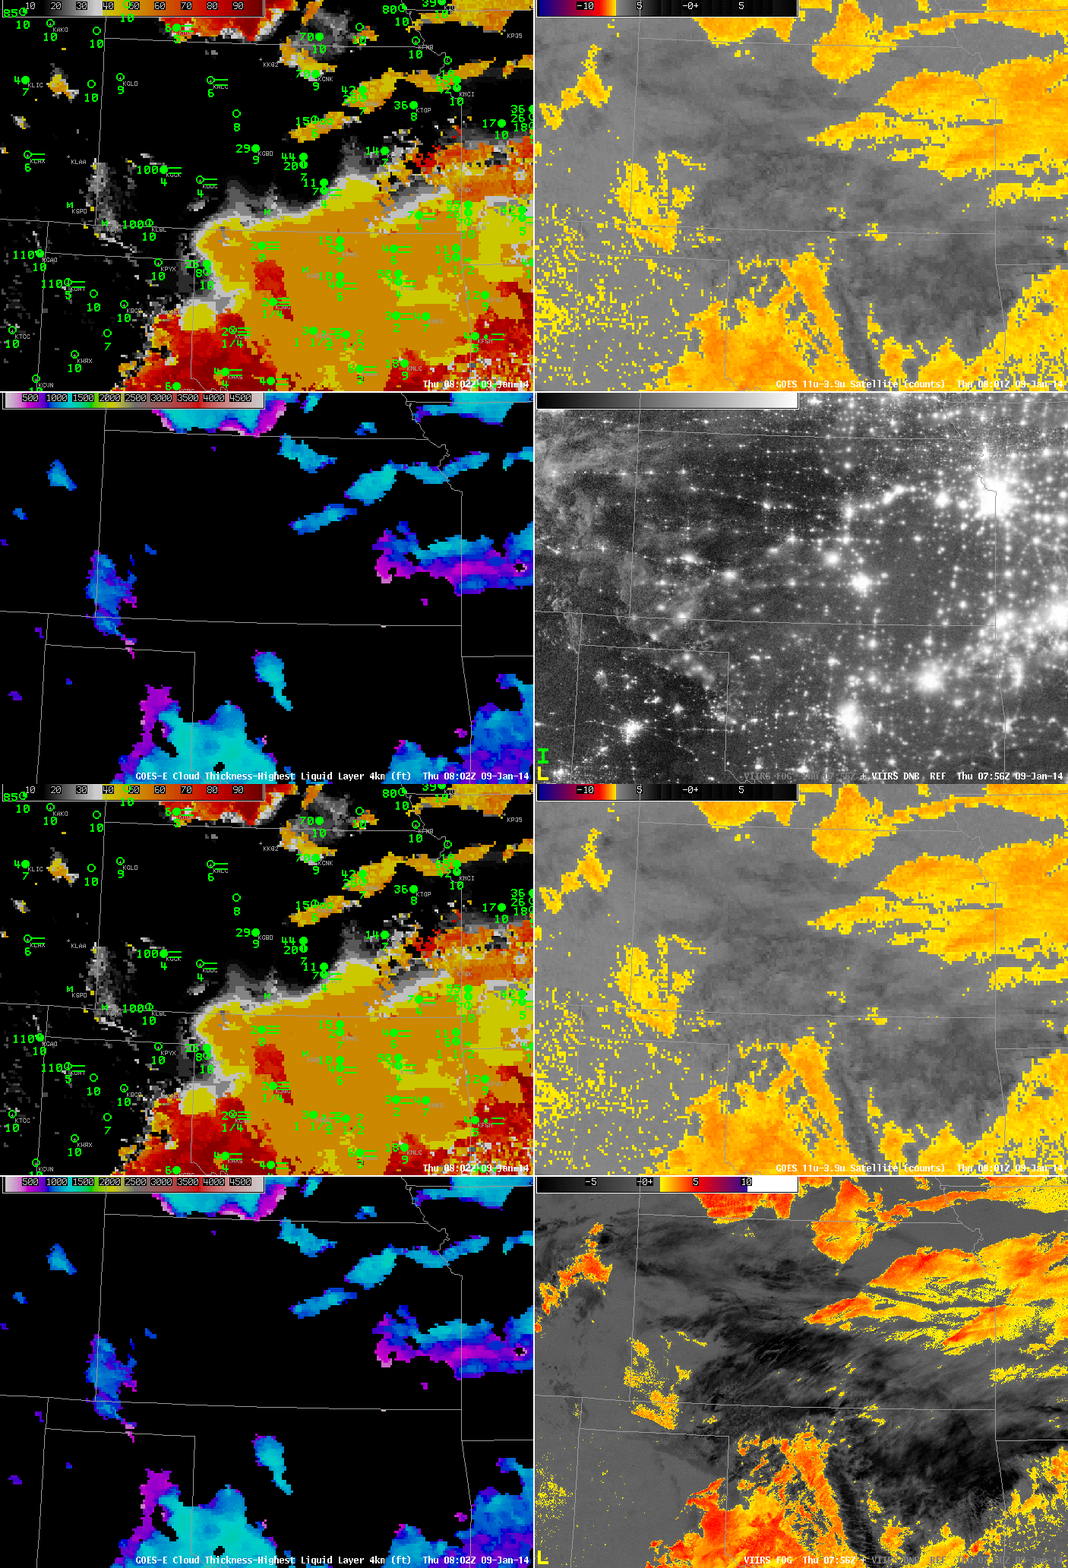
As above, but at 0802 UTC 9 January 2014. Suomi/NPP data is a toggle of Day/Night band and 11.35 µm – 3.74 µm brightness temperature difference (click image to enlarge)

By 0802 UTC, high clouds have overspread much of Oklahoma, yet IFR conditions are occurring at several locations. IFR probabilities nicely depict the widespread nature of this IFR event. Probabilities are reduced in regions where high clouds are present because the algorithm cannot use satellite predictors of low clouds/stratus there. Both the Day/Night band and the brightness temperature difference field give information about the top of the cloud deck — it’s hard to infer how the cloud base is behaving. The addition of Rapid Refresh model information on low-level saturation helps better define where IFR conditions are present.

GOES_IFR_PROB_20140109_0945_VIIRS

As above, but at 0945 UTC 9 January 2014. Suomi/NPP data is a toggle of Day/Night band and 11.35 µm – 3.74 µm brightness temperature difference (click image to enlarge)

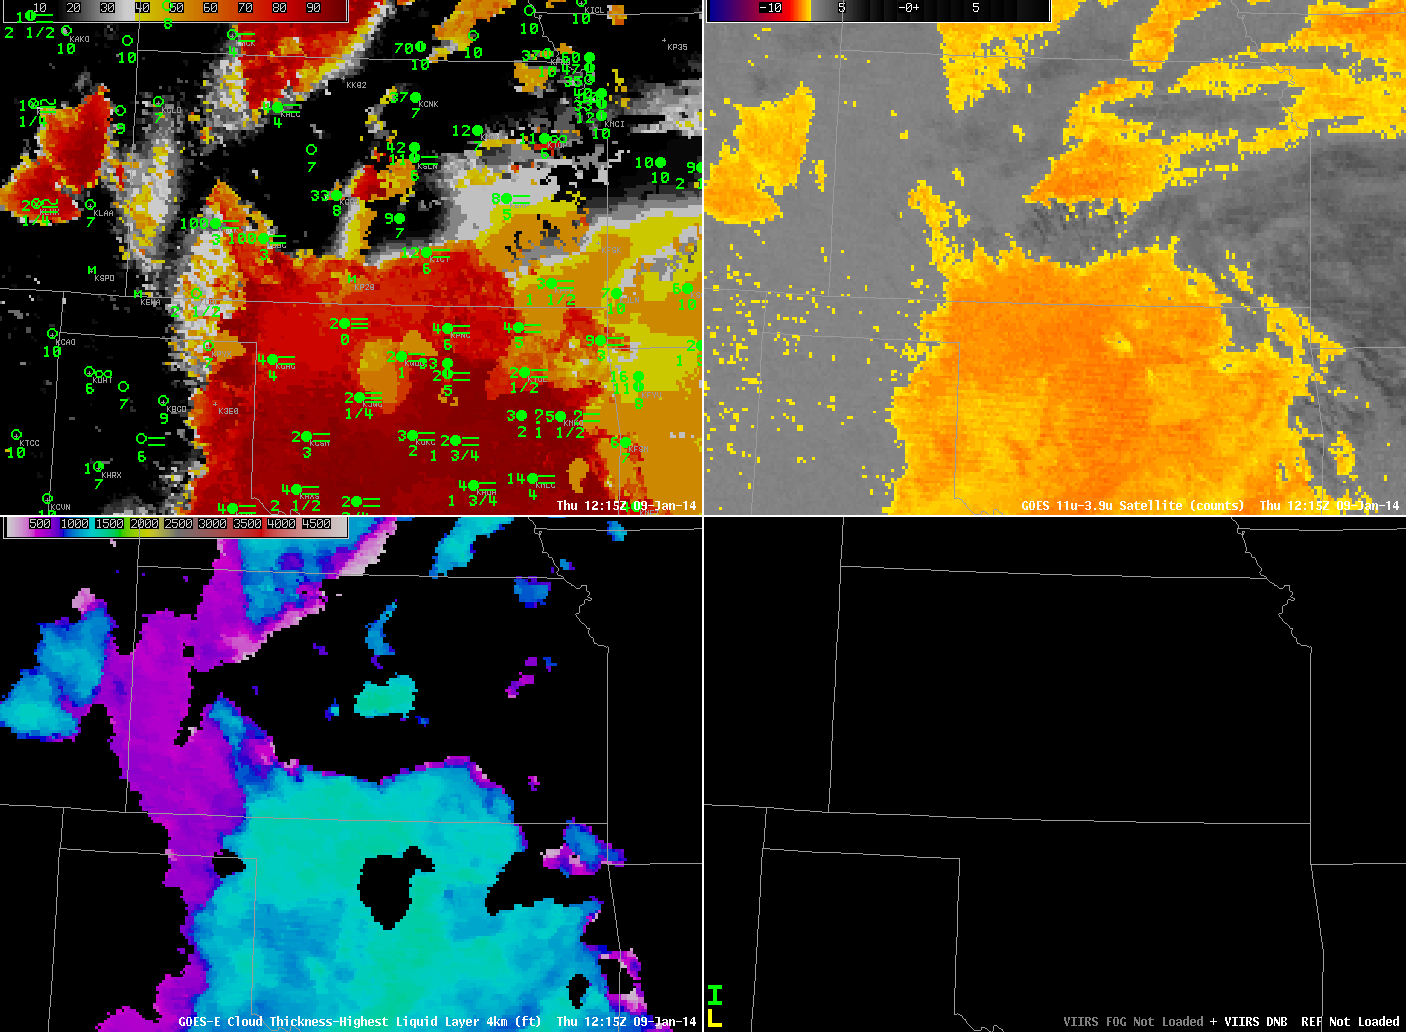
By 0945 UTC, above, the time of the next Suomi/NPP overpass, the high clouds have started to move eastward out of Oklahoma. Consequently, satellite data can be used as one of the predictors in the IFR probability field, and IFR Probabilities over Oklahoma increase. By 1215 UTC (below), higher clouds have east out of the domain, and IFR Probabilities are high over the region of reduced ceilings/visibilities over Oklahoma. The algorithm continues to show lower probabilities in regions over Kansas where the Brightness temperature difference signals the presence of low stratus/fog but where IFR conditions are not present. Again, this is because the Rapid Refresh model in those regions is not showing low-level saturation.

GOES_IFR_PROB_20140109_1215

As above, but at 1215 UTC 9 January 2014 (click image to enlarge)

Note in the imagery above how the presence of high clouds affects the GOES-R Cloud Thickness. If the highest cloud detected is ice-based, no cloud thickness field is computed. GOES-R Cloud Thickness is the estimated thickness of the highest water-based cloud detected. If ice clouds are present, the highest water-based cloud cannot be detected by the satellite. Cloud Thickness is also not computed during twilight conditions. Those occurred just before the first image, top, and about an hour after the last image, above.

Fog Detection under Cirrus

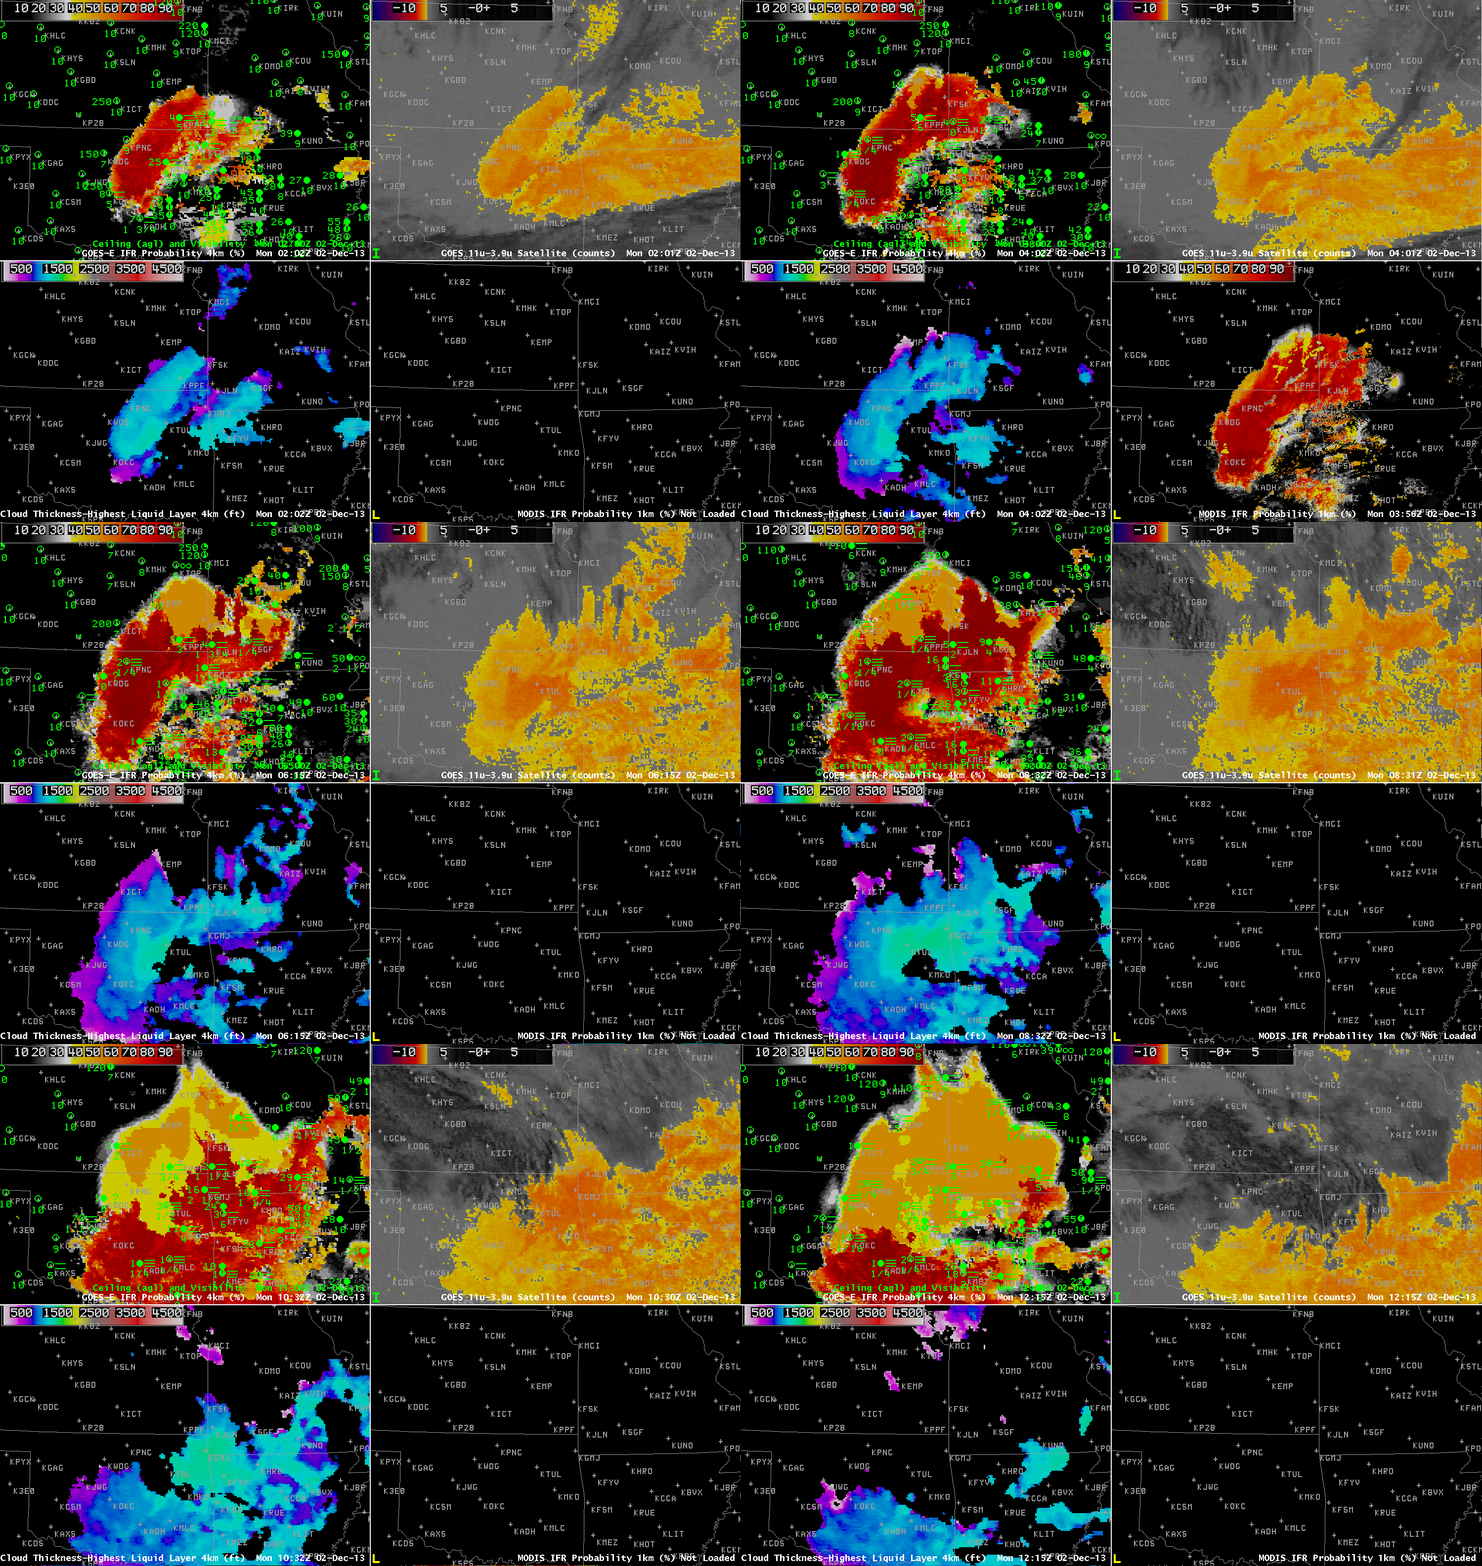
GOES_IFR_PROB_20131202loop

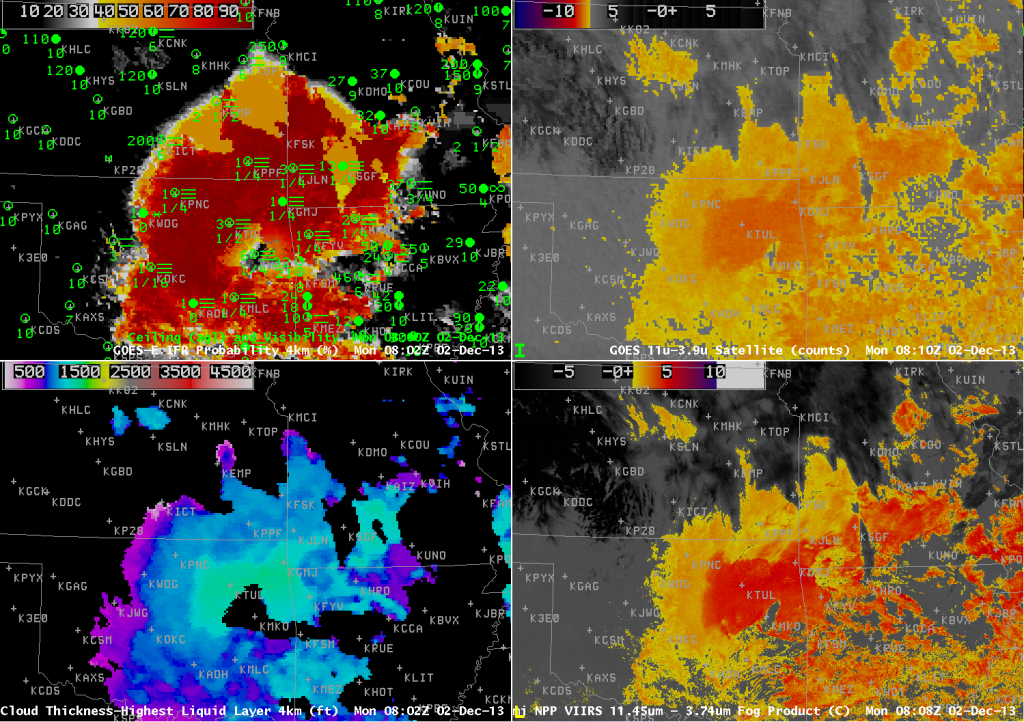
GOES-R IFR Probabilities from GOES-13 (Upper Left), GOES-13 Brightness Temperature Difference Product (10.7 µm – 3.9 µm) (Upper Right), GOES-R Cloud Thickness from GOES-13 (Lower Left), MODIS-based IFR Probabilities (Lower Right), Times as indicated (click image to enlarge)

Dense Fog developed over the southern Plains overnight, and the case demonstrates how the Fused data product is able to give a useful signal of IFR probabilities even in regions where high clouds preclude the detection of low clouds by satellite. The fog was widespread and dense enough to warrant Dense Fog Advisories from Tulsa, Norman and Topeka forecast offices. See below, for example.

000
FXUS64 KTSA 020953
AFDTSA

AREA FORECAST DISCUSSION
NATIONAL WEATHER SERVICE TULSA OK
353 AM CST MON DEC 2 2013

.DISCUSSION…
DENSE FOG CONTINUES THIS MORNING ACROSS MUCH OF THE CWA. GIVEN THE
TIME OF YEAR /LOW SUN ANGLE/ AND THE FACT THAT SOME HIGH CLOUDS ARE
STREAMING INTO THE AREA FROM THE NW /REDUCED INSOLATION AND
DELAYED MIXING/…THINK IT MAY TAKE A LITTLE LONGER THAN
PREVIOUSLY EXPECTED TO GET RID OF THE FOG. WE HAVE EXTENDED THE
DENSE FOG ADVISORY UNTIL 11 AM. ONCE THE FOG BURNS OFF…SHOULD
BE A PLEASANT DAY WITH UNSEASONABLY WARM TEMPS AND FAIRLY LIGHT
WIND. COULD BE SOME MORE FOG TUESDAY MORNING IN SOME PLACES BUT A
LITTLE MORE WIND MAY KEEP IT FROM GETTING AS DENSE AND AS
WIDESPREAD AS IT IS THIS MORNING. SLIGHTLY WARMER TEMPS IN STORE
TUESDAY WITH SOME PLACES LIKELY IN THE 70S. WARM AND WINDY
CONDITIONS WILL RESULT IN AN INCREASING FIRE WEATHER CONCERN.

Satellite detection of this fog event was constrained by the presence of two upper-level cloud decks. At the beginning of the animation, above, high clouds associated with the subtropical jet are over the southern quarter of the domain plotted. These high clouds quickly shift southward, and the region in the brightness temperature difference product that is consistent with detection of fog/low stratus (that is, low water-based clouds) expands to the south (surface observations suggest the low stratus clouds were present earlier, but masked by the higher clouds). Later in the animation, high clouds sag southward into the northern part of the domain. When this happens, low stratus/fog (indicated in observations by IFR conditions) are not detected by GOES because the higher ice clouds block the view of the scene. However, the IFR Probability fields that use both satellite data and output from the Rapid Refresh Model continue to depict a likely region (confirmed by the observations) of reduced visibilities. IFR Probabilities do drop, of course, as satellite data cannot be used to confirm the presence of low clouds. Knowledge of why the probabilities drop is vital to the interpretation of the field: You have to know that the high clouds are present, either by looking at the satellite data, or by understanding that the character of the IFR Probability field changes to one that is less pixelated when satellite data cannot be included because of ice clouds above the low stratus deck.

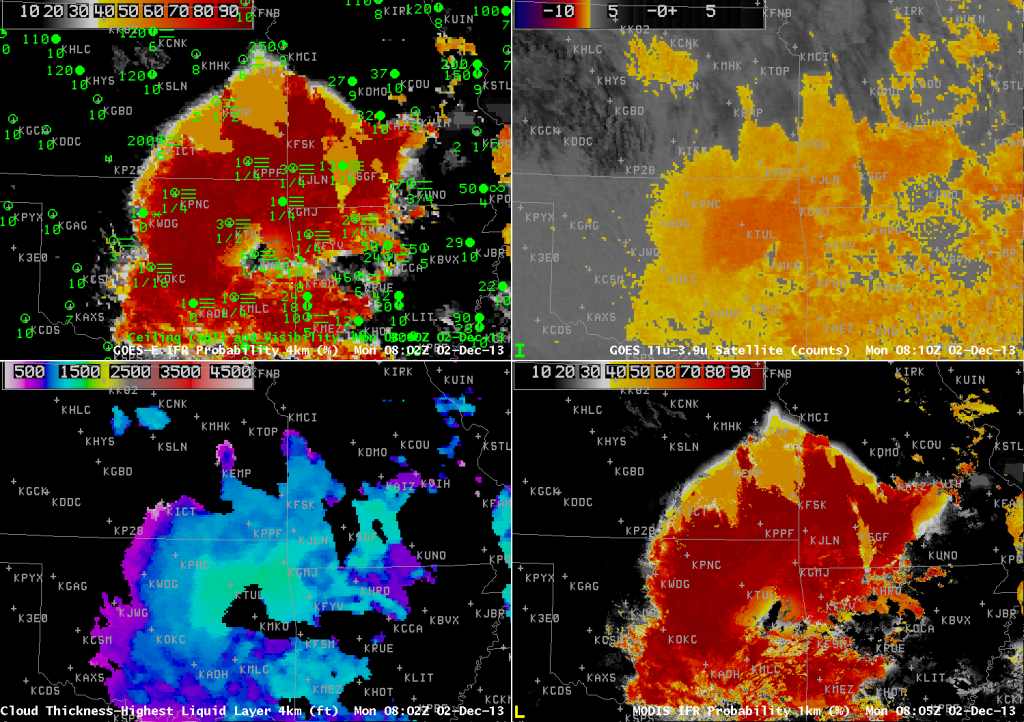
GOES_IFR_PROB_20131202_0802

GOES-R IFR Probabilities from GOES-13 (Upper Left), GOES-13 Brightness Temperature Difference Product (10.7 µm – 3.9 µm) (Upper Right), GOES-R Cloud Thickness from GOES-13 (Lower Left), MODIS-based IFR Probabilities (Lower Right), Times near 0802 UTC as indicated (click image to enlarge)

For a large-scale event like this, MODIS-based IFR Probabilities overlap well with GOES-Based IFR Probabilities, as shown in the image above. In cases like this sometimes individual river valleys will show up with slightly elevated IFR Probabilities (or cloud thicknesses).

The GOES-R Cloud Thickness field is computed for the highest water-based cloud detected (during non-twilight conditions — that is, not during the hour or so surrounding sunrise and sunset). Note how well the thickest clouds — over northeast OK, surrounding Tulsa — correlate with the strongest Brightness Temperature Difference, both in GOES and in Suomi/NPP data (below). Note also how the Cloud Thickness field is not computed in regions where higher ice-based clouds are present.

VIIRS_FOG_20131202_0808

GOES-R IFR Probabilities from GOES-13 (Upper Left), GOES-13 Brightness Temperature Difference Product (10.7 µm – 3.9 µm) (Upper Right), GOES-R Cloud Thickness from GOES-13 (Lower Left), Suomi/NPP Brightness Temperature Difference from VIIRS (10.35 µm – 3.74 µm) (Lower Right), Times near 0802 UTC as indicated (click image to enlarge)

Cloud Thickness can be used to predict the time of fog dissipation, using this scatterplot/relationship. If sun angle is limited by the season, or if solar insolation is limited by higher clouds, you might adjust the first guess for dissipation to a later time.

How accurate are GOES-R Cloud Thickness Fields?

GOES_IFR_PROB_20131111_1145

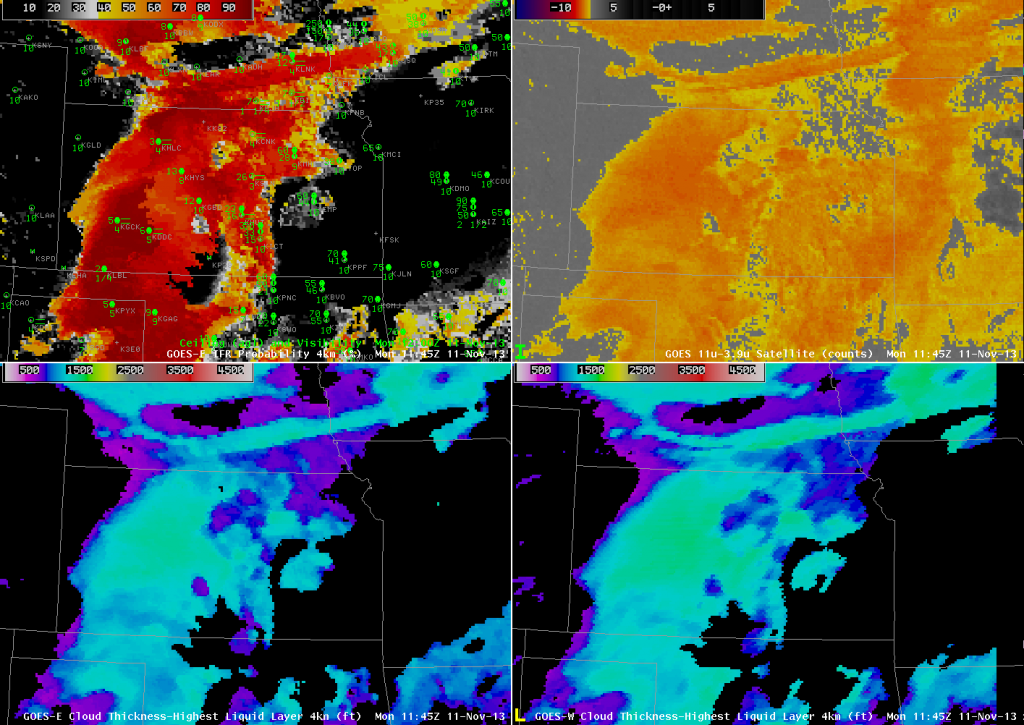
GOES-13-based GOES-R IFR Probabilities (Upper Left), GOES-13 Brightness Temperature Difference Product (10.7 µm – 3.9 µm) (Upper Right), GOES-R Cloud Thickness from GOES-East (Lower Left), GOES-R Cloud Thickness from GOES-West (Lower Right), all times as indicated (click image to enlarge)

GOES-R IFR Probabilities over the Central Plains from just before sunrise on 11 November 2013 are displayed above. The IFR Probabilities accurately depict the region of lower stratus and fog with reduced visibilities, separating that region from the mid-level stratus over eastern Kansas and western Missouri. In contrast the brightness temperature difference field (10.7 µm – 3.9 µm) highlights the entire region as one of interest.

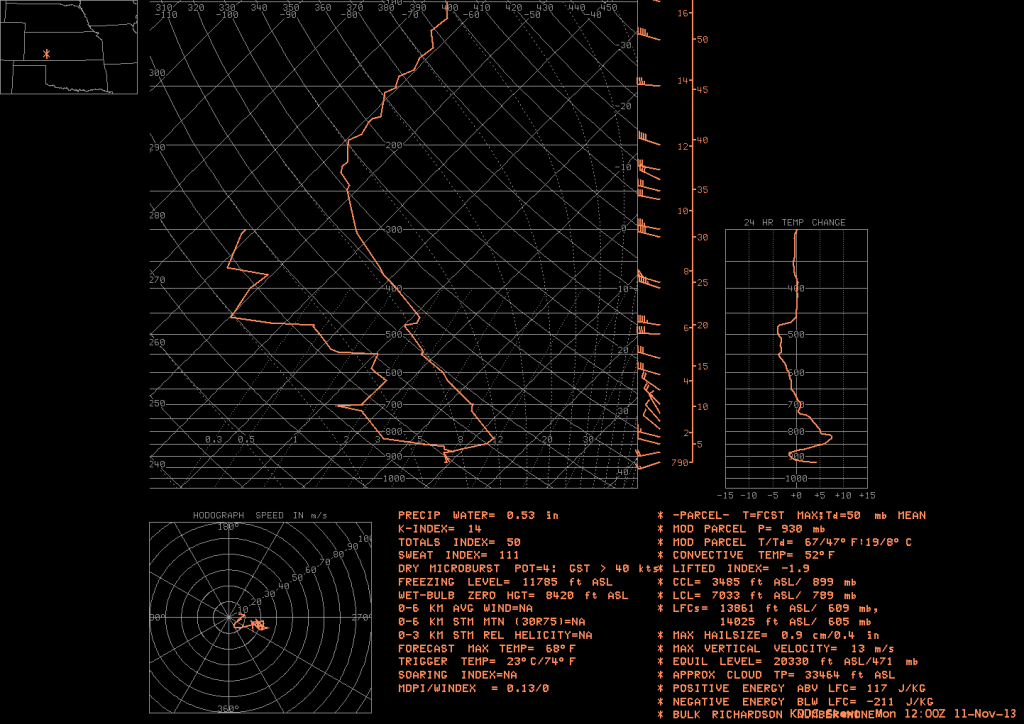
The GOES-R Cloud Thickness from GOES-East (bottom left) and from GOES-West (bottom right) show cloud thickness over Dodge City at just under 1200 feet. Note that the values computed with GOES-West are somewhat larger because of the oblique view angle from GOES-West. The 1200 UTC sounding from Dodge City, below, shows a fog/stratus deck from the surface (928 mb, 2652 feet ASL) to 880 mb (4075 feet ASL), a thickness of 1423 feet. Given that the sounding is not saturated at the surface, that 1423 foot thickness is likely a slight overestimate. It is very close to the GOES-R Cloud Thickness estimate of 1200 feet, however.

KDDC_20131111_1200

1200 UTC Sounding at Dodge City, Kansas, 11 November 2013 (click image to enlarge)

Stratus/Low Clouds with developing Storms on the Plains

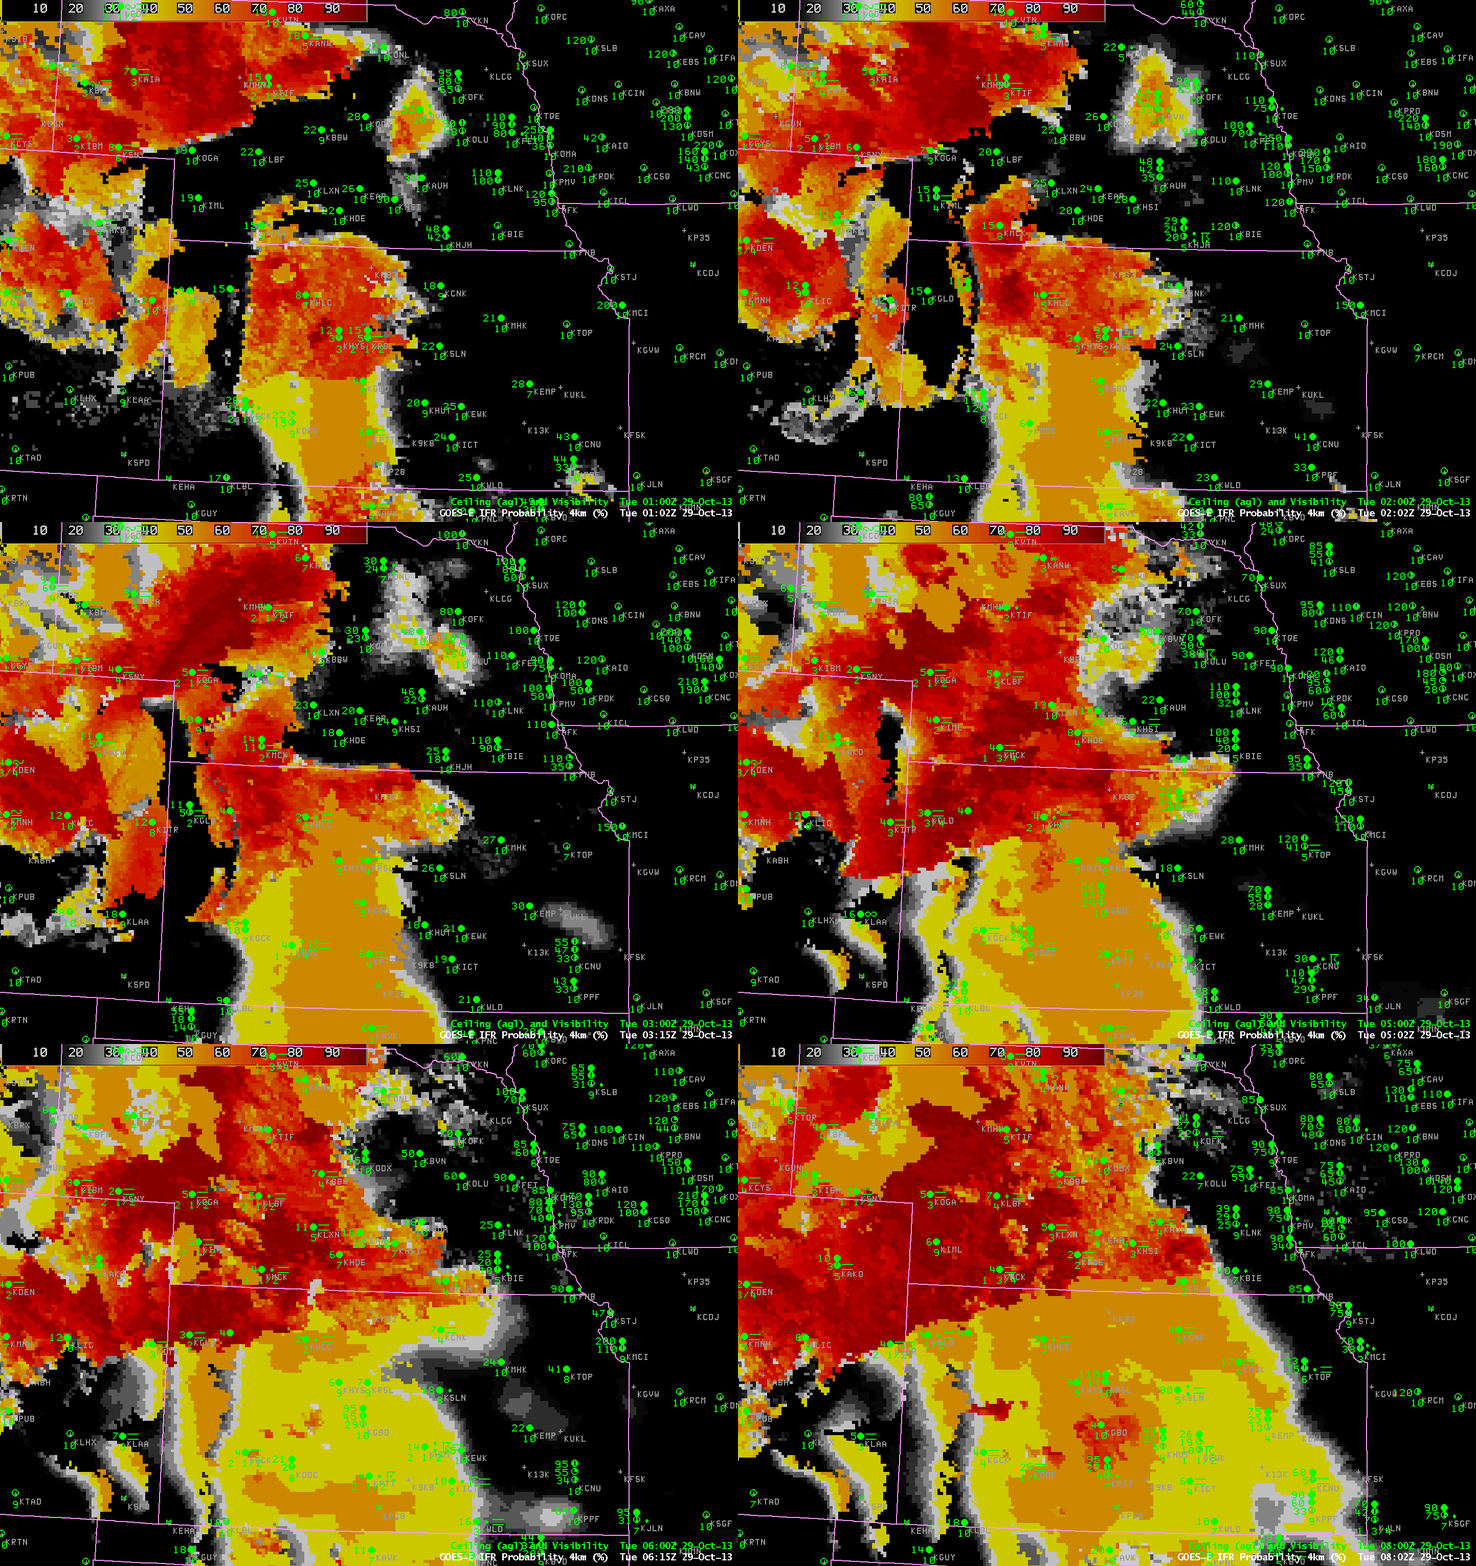
GOES_IFR_PROB_20131029loop

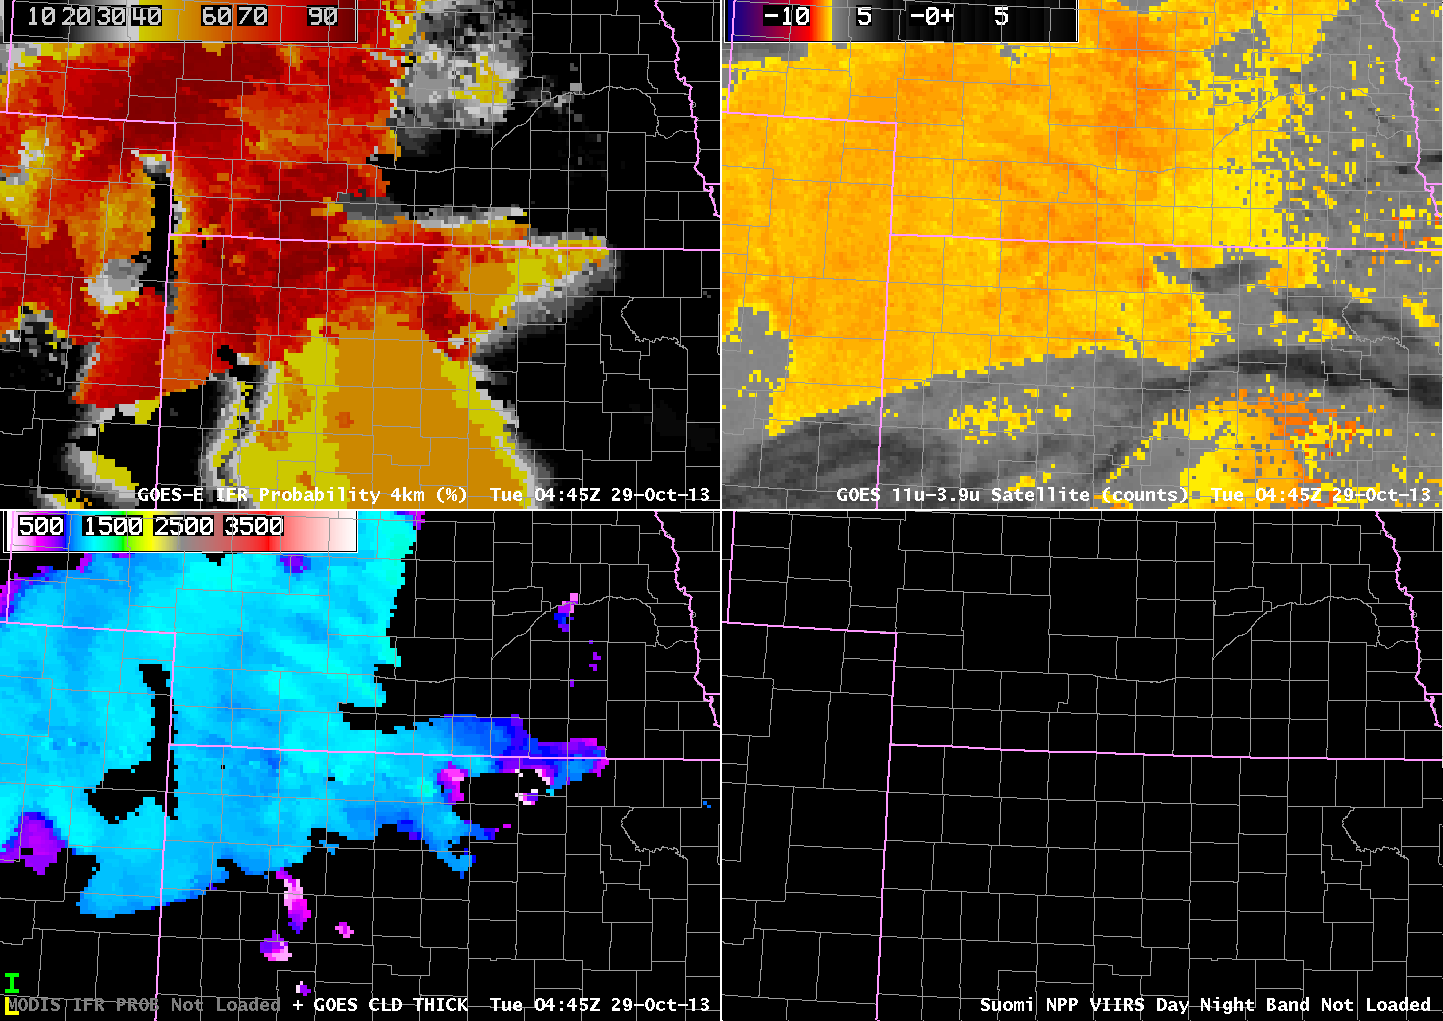
GOES-13-based GOES-R IFR Probabilities (Upper Left), GOES-13 Brightness Temperature Difference Product (10.7 µm – 3.9 µm) (Upper Right), GOES-R Cloud Thickness (Lower Left), Suomi-NPP Day/Night band (Lower Right), all times as indicated (click image to animate)

The ongoing change of seasons means that stronger large-scale weather systems are more likely. When something like a Colorado Cyclone moves from the Rockies and emerges into the central part of USA, it brings multiple cloud layers with it, and those many cloud layers make detection of fog and low stratus difficult. The animation above shows GOES-R IFR Probabilities and Cloud Thicknesses as well as the color-enhanced GOES-13 Brightness Temperature Difference (BTD) field. Note the characteristic signal in the BTD field of jet-level cirrus over Kansas. In these regions, BTD fields cannot be used to diagnose regions of low-level clouds because the upper-level clouds block the satellite view of lower clouds.

IFR Probability does have a signal over Kansas, however (where IFR conditions are present — see the animation below). Rapid Refresh data are being used under the cirrus to diagnose the probability of IFR conditions. Thus, IFR Probability fields are filled in under regions of high cirrus. Because only model data are being used to diagnose IFR Probability fields over central and southern Kansas, the characteristic of the field is different. Where satellite and model data are used, as over western Nebraska, the IFR Probability field has a pixelated appearance; where only model data are used, as over southern Kansas, the IFR probability field has a very smooth appearance. In model-only regions, in addition, IFR Probabilities are smaller because the number of predictors available to the algorithm is smaller.

The BTD field highlights regions in eastern Nebraska as having water-based clouds? Are these clouds causing low ceilings and reduced visibilities? No, and IFR probabilities in that region are low. In this region, Rapid Refresh data do not show low-level saturation, and thus the IFR Probabilities are correctly small, despite the strong satellite signal.

GOES_IFR_PROB_20131029withobs_loop

GOES-13-based GOES-R IFR Probabilities and surface visibilities/ceilings, all times as indicated (click image to enlarge)

GOES-R Cloud Thickness, shown at top, is only computed in regions where the highest cloud detected by the satellite is water-based; the algorithm considers includes information from a cloud-typing algorithm, and if clouds are ice phase (or mixed phase) as is likely in the case of jet stream cirrus, cloud thickness is not computed. (Cloud Thickness is also not computed during times of twilight — that is, an hour or so on either side of sunrise and sunset).

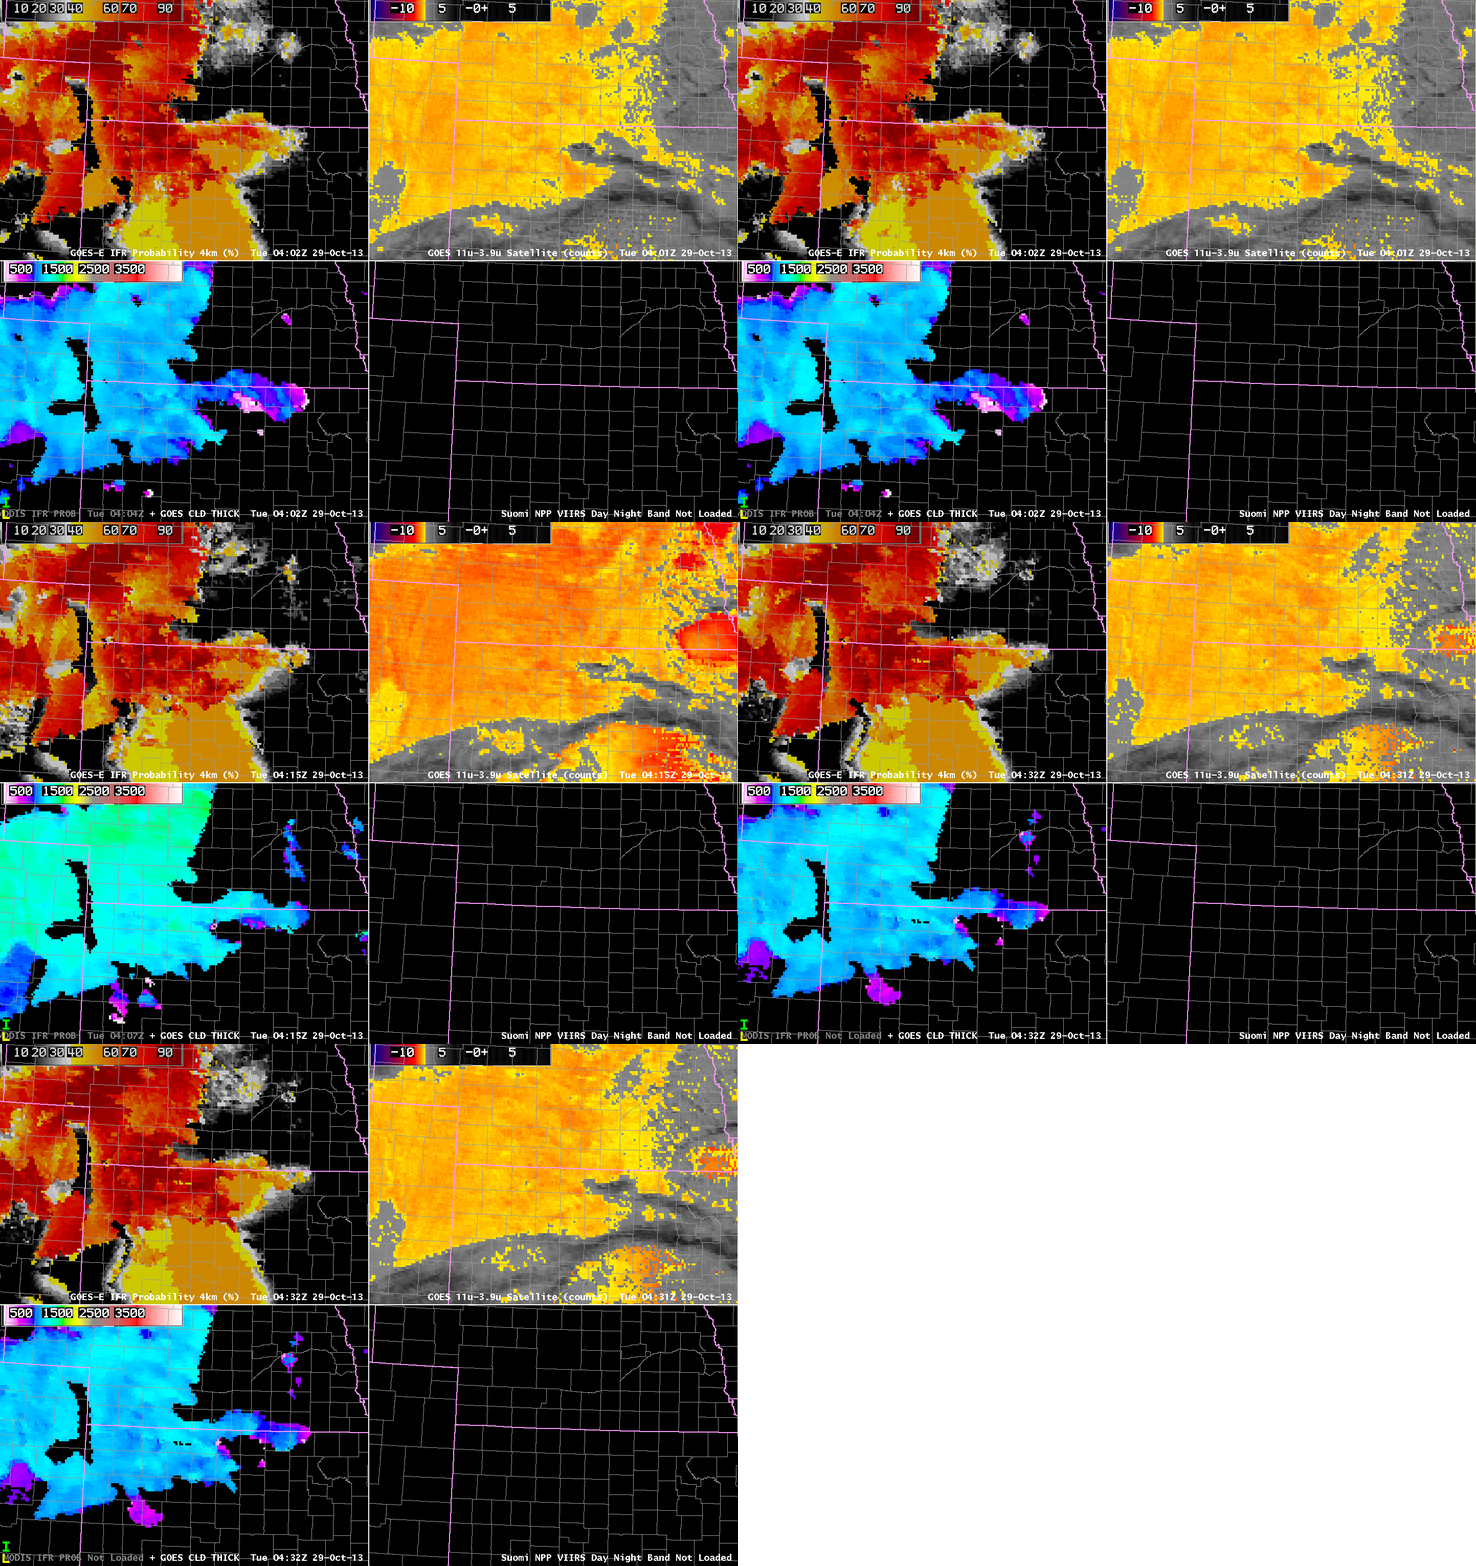
GOES_IFR_PROB_20131029_straylightloop

As above, but for a case of Stray Light, all times as indicated (click image to enlarge)

There are still cases at night when Stray Light will contaminate/enhance the 3.9 µm signal on GOES-13, and this contamination can propagate into the GOES-R IFR Probability of Cloud Thickness Fields. In this case, only the Cloud Thickness Fields are affected (below); Cloud thickness jumps about 500 feet for one time period (0415 UTC).

Fog and Stratus under high clouds in the Southern Plains

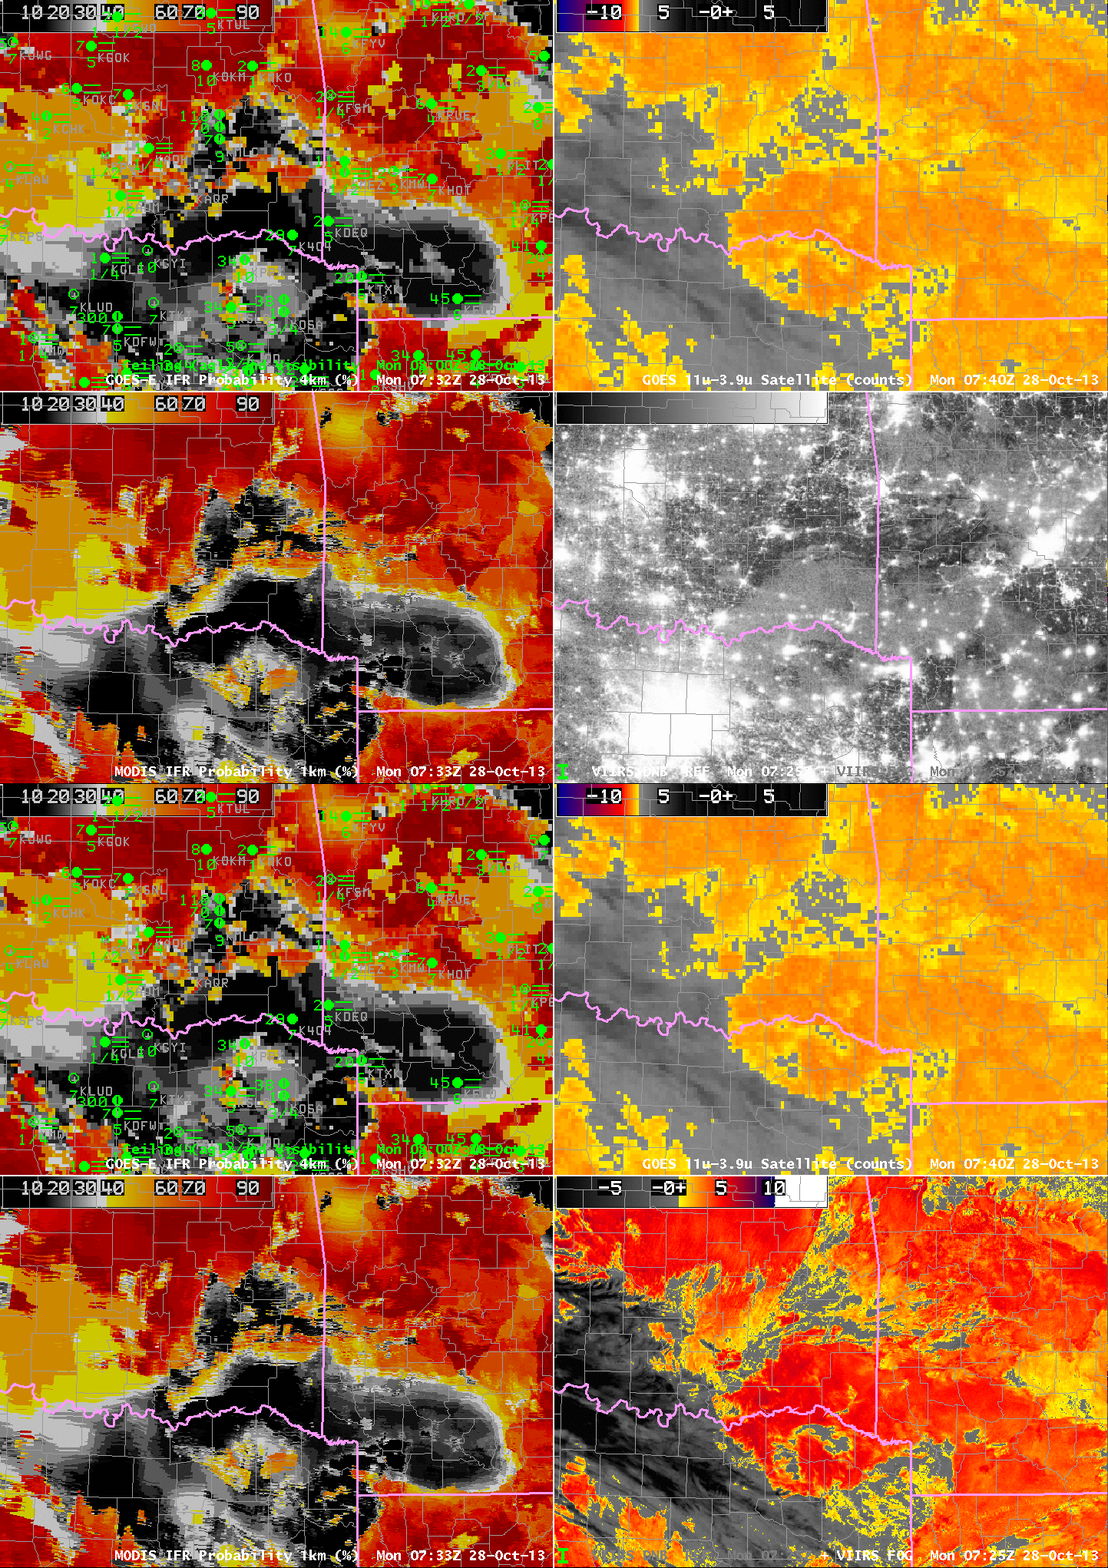
VIIRSFOG_DNBtoggle_20131028_0725

GOES-13-based GOES-R IFR Probabilities (Upper Left), GOES-13 Brightness Temperature Difference Product (10.7 µm – 3.9 µm) (Upper Right), MODIS-based GOES-R IFR Probabilities (Lower Left), Suomi-NPP Brightness Temperature Difference (11.35 µm – 3.74 µm) and Day/Night band (Lower Right), all times as indicated (click image to enlarge)

Fog and low stratus developed over the Southern Plains during the morning hours of 28 October 2013. The imagery above, from near 0730 UTC, demonstrates strengths of the IFR Probability fields and inherent limitations to the traditional methods of detecting fog and low stratus: the brightness temperature difference between 10.7 µm and 3.9 µm data. For example, note the elevated stratus over the Red River Valley in southeastern OK. Both GOES and VIIRS Brightness Temperature Difference fields there show a strong signal (and the day/night band also suggest clouds are present); IFR Probabilities are low, however, and are in good agreement with the observed ceilings and visibilities that show MVFR conditions.

The brightness temperature difference fields from both Suomi/NPP and from GOES show high clouds over south-central OK, in a region where IFR Conditions are observed. Rapid Refresh model data are being used in this region to diagnose — accurately — the presence of visibility-restricting fog and low stratus. As is typical when Rapid Refresh data are the primary means of diagnosing IFR Probabilities (because high clouds prevent the satellite from seeing water-based clouds near the surface), the IFR probability field is smooth.