Category Archives: Plains

Fog over Nebraska under high clouds

GOES_RIFRProb5May2015_0300_1200

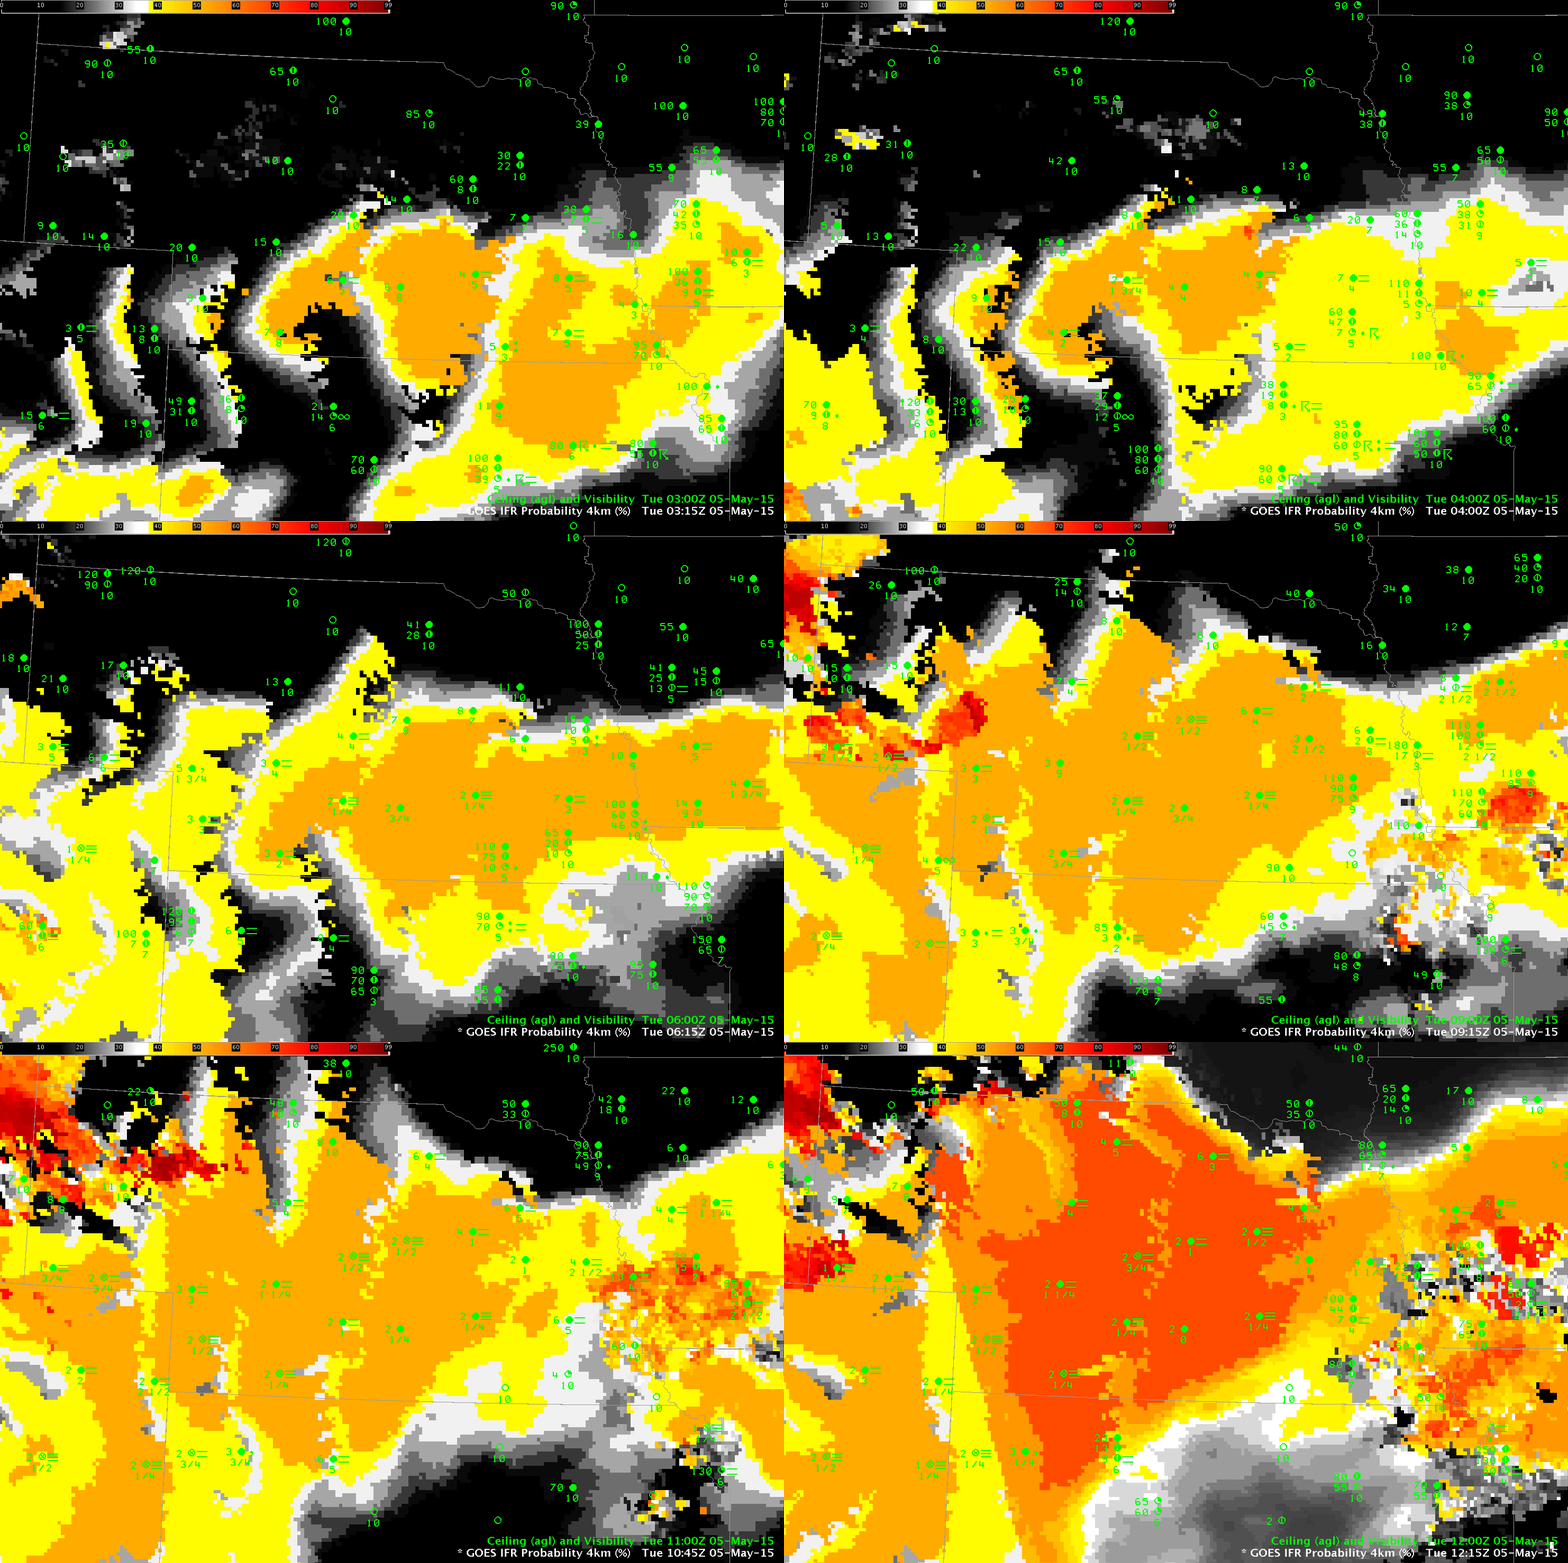
GOES-R IFR Probabilities, 0315-1215 UTC, 5 May 2015 (Click to enlarge)

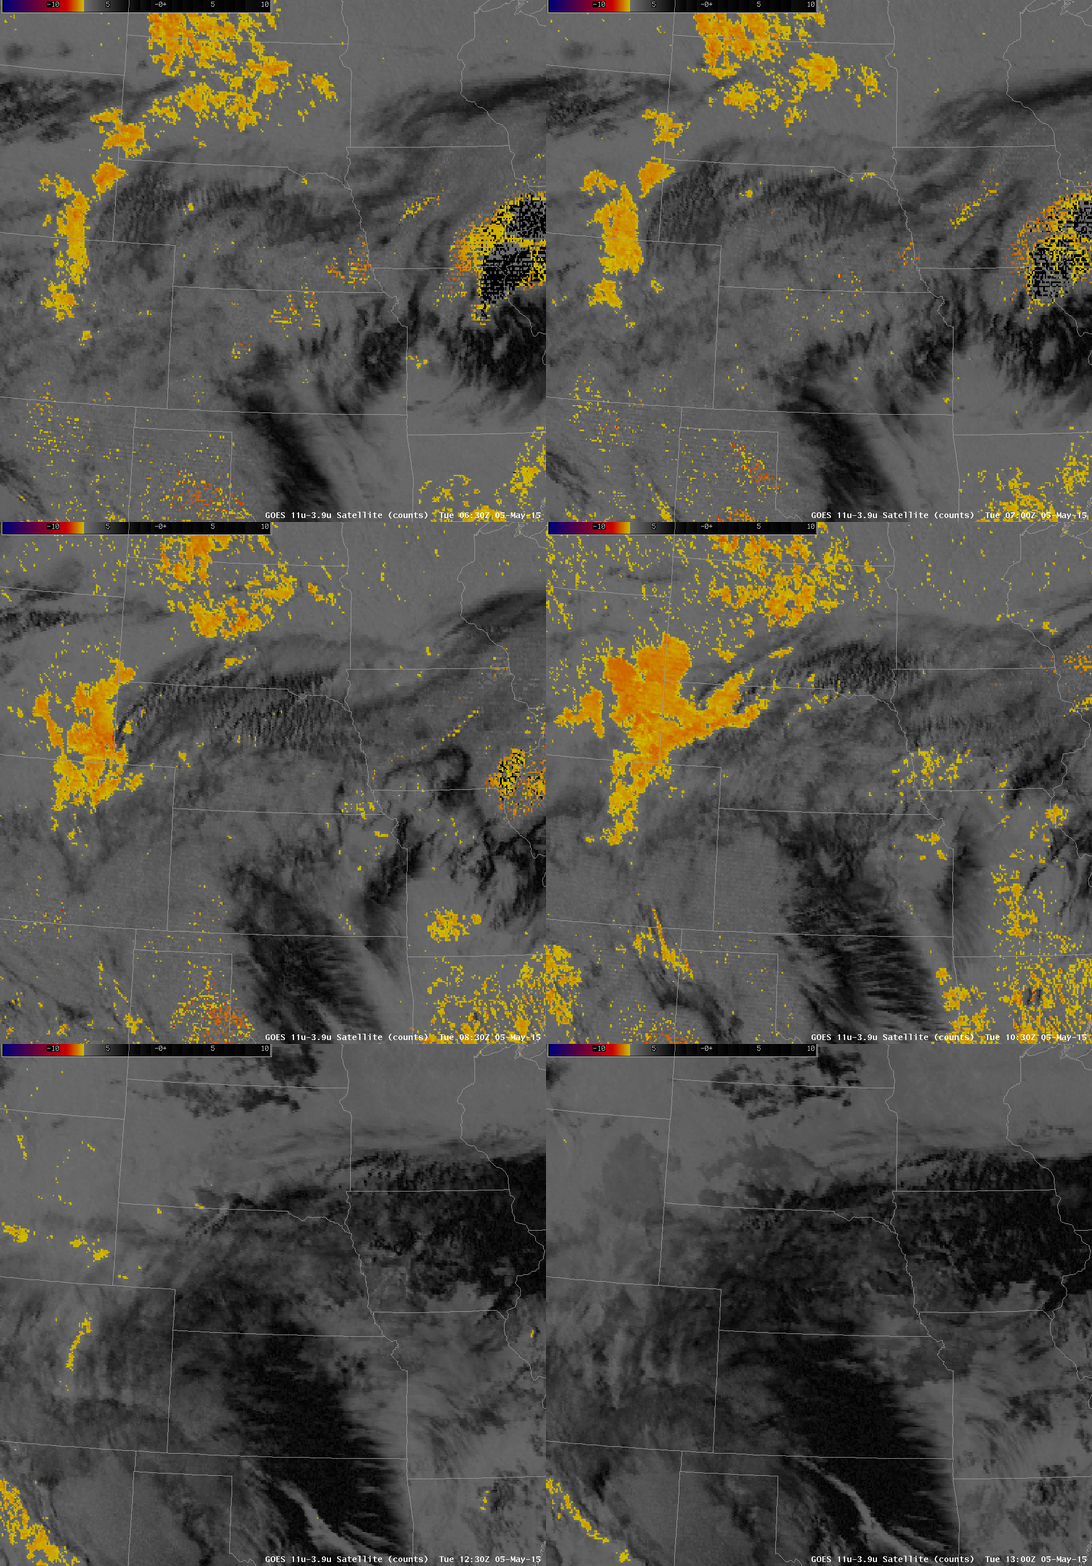
Dense Fog developed over the Hastings, Nebraska WFO overnight, leading to the issuance of Dense Fog Advisories. The GOES-R IFR Probabilities, above, show a steady increase in probabilities over the night as the fog develops. The relatively flat nature of the IFR Probability field is characteristic of GOES-R IFR Probabilities that do not include information from satellite (that is, only model fields are being used here to educe IFR probabilities). IFR Probability fields are a fused product, typically blending information from model fields and from satellite data. However, this was a case of fog developing under an extensive cirrus shield so that satellite data were not used as a predictors. The 10.7µm – 3.9µm Brightness Temperature Difference field, shown below, gives no information about surface conditions. That the IFR Probability fields neatly overlap the region of developing IFR conditions is testimony to the accuracy of the model field in simulating the lower part of the troposphere.

When only model data are used, as above, features in the field that are parallel to surface topography contours can become evident in the GOES-R IFR Probability fields. This is related to interpolation of the lowest 1000 feet of model relative humidity fields (moisture information that is used as a predictor in the computation of the IFR Probability) in regions of sloping topography.

In the animation above, note that the IFR Probabilities increase in the final frame. Over most of the scene, at 1215 UTC, the sun has risen and Daytime Predictors are being used to compute IFR Probabilities. (The dividing line between Daytime — to the east — and nighttime — to the west — is visible stretching north-northwest to south-southeast from the extreme northeast corner of Colorado). IFR Probabilities are somewhat higher during the day (compared to night) because visible imagery is incorporated into the satellite predictors; more accurate cloud clearing means that IFR Probabilities increase just a bit.

US_11-3.9_Sat_20150505_0630_1300anim

GOES-13 Brightness temperature difference fields (10.7 µm – 3.9 µm) over the Great Plains, 0630-1300 UTC, 5 May 2015 (Click to enlarge)

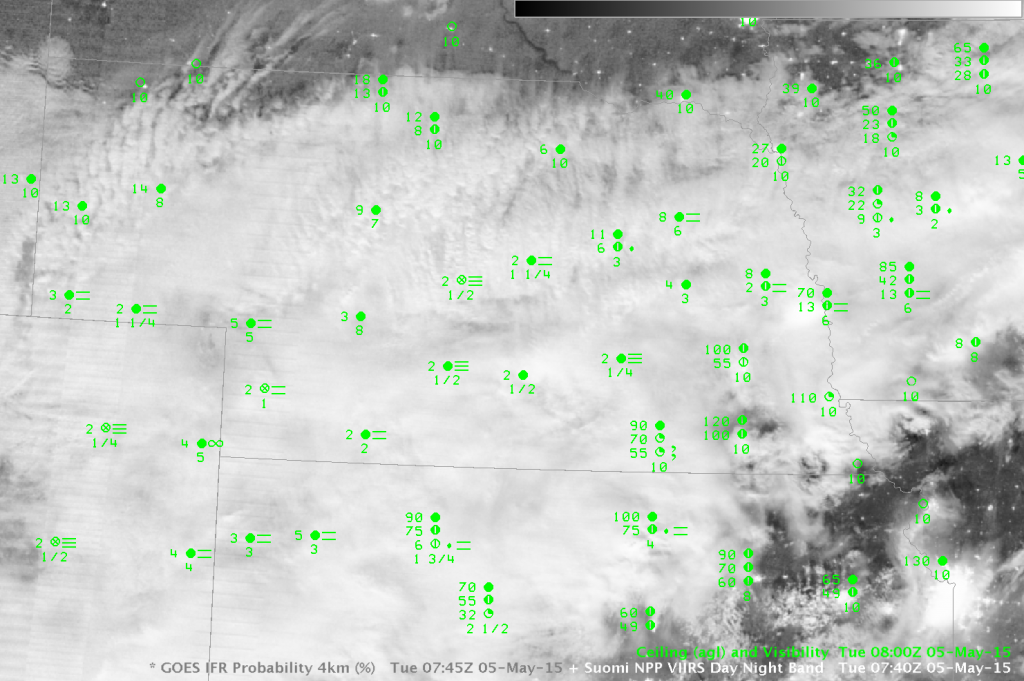
Suomi NPP overflew Nebraska, giving a view of the extensive cirrus shield. The Day Night Band gave crisp imagery as the Moon was very nearly full.

DNB_OBS_0740

Suomi NPP Day Night Band Visible Imagery (0.70 µm) at 0740 UTC on 5 May 2015 (Click to enlarge)

Use moving IFR Probability Fields as a forecast aid

Denver_IFR_02_13_07Apr2015

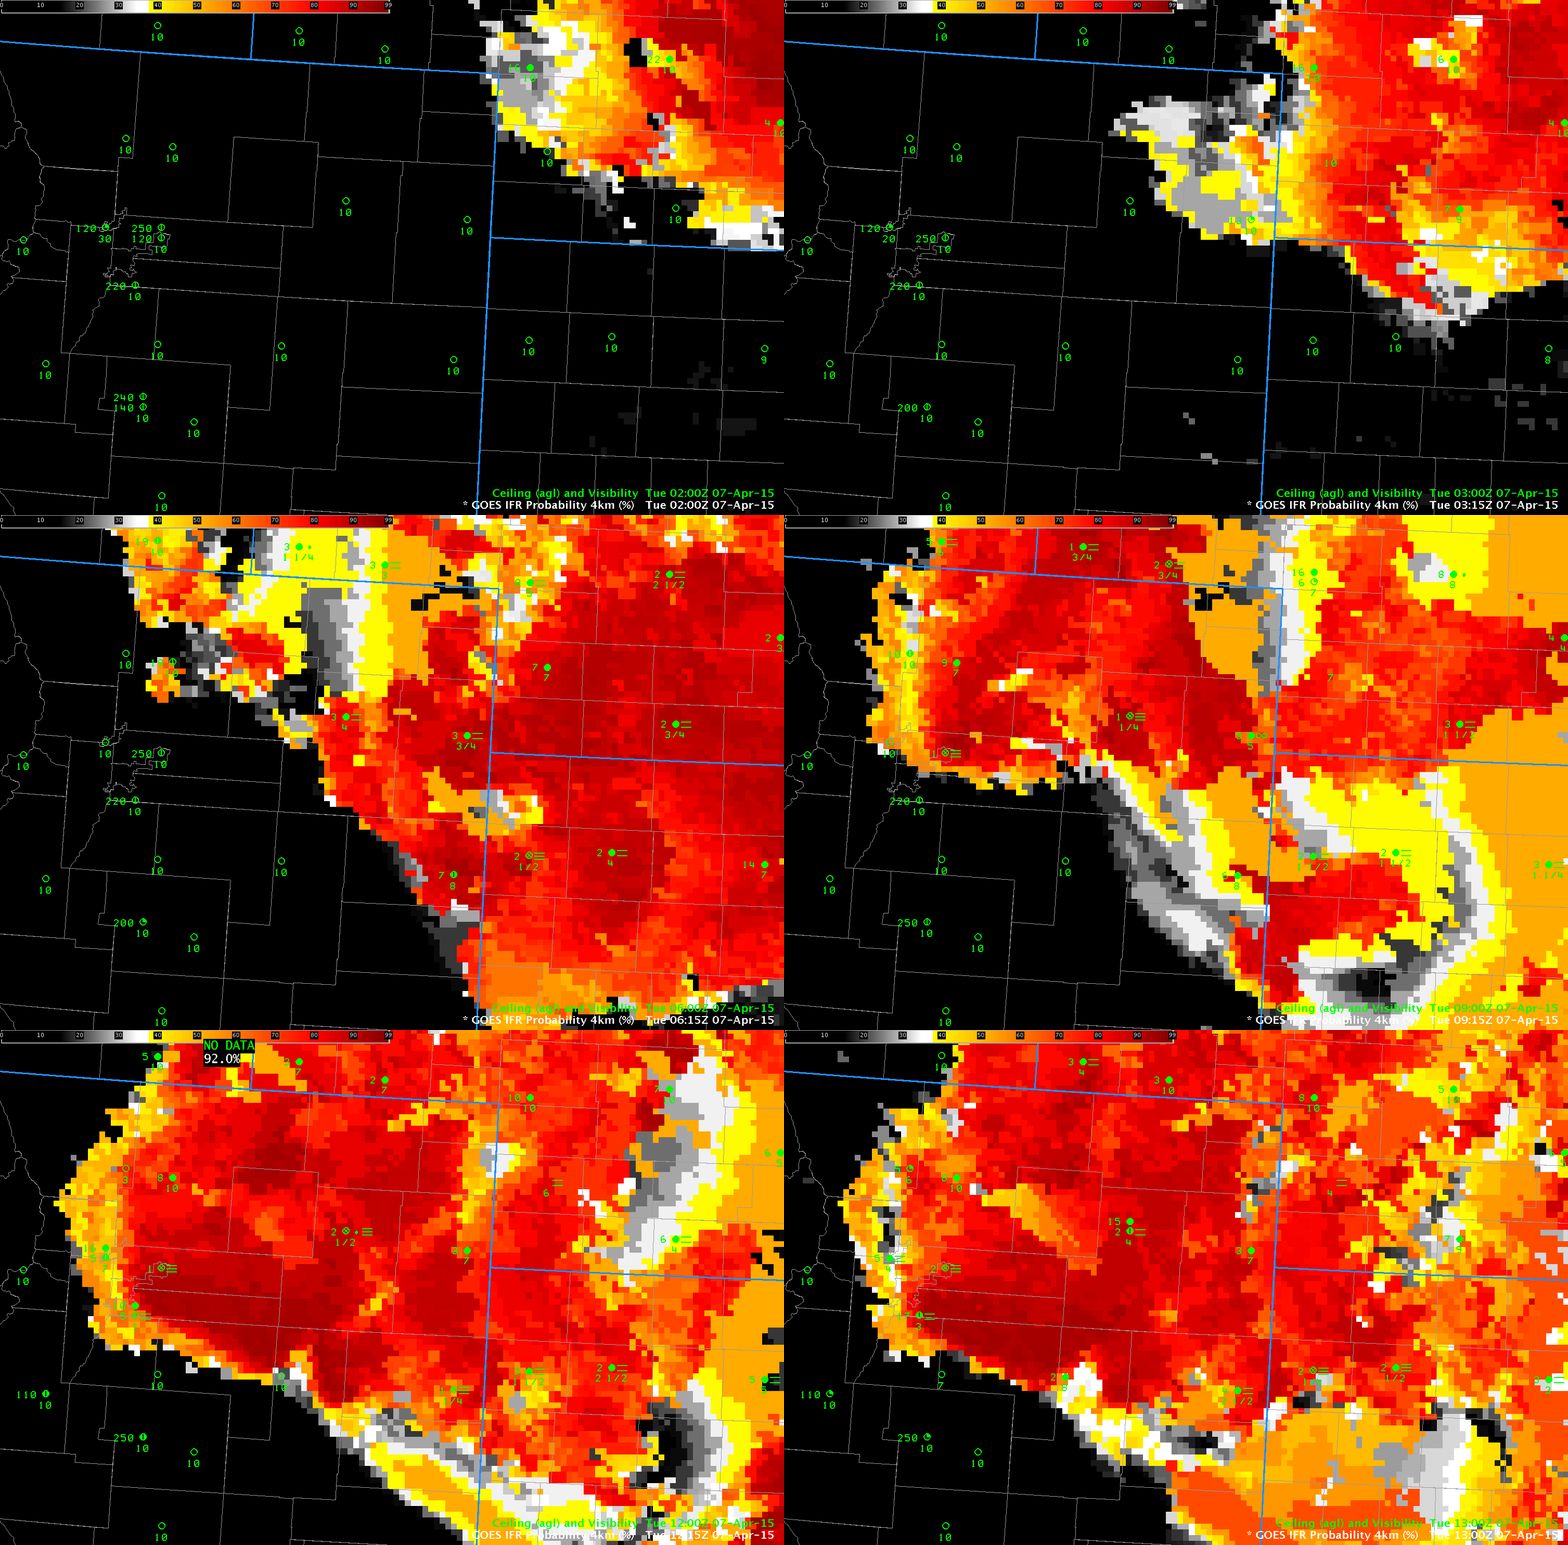
GOES-R IFR Probabilities, hourly from 0200 through 1300 UTC on 7 April 2015 (Click to enlarge)

Denver International Airport had a period of restricted visibility during the morning of 7 April, starting around 0830 UTC, when northeast winds ushered in low ceilings and reduced visibilities. High Probabilities in the IFR Probability fields shift west and south with time, demonstrating how the fields can be used to anticipate the development of IFR conditions.

Low Clouds and Fog over Oklahoma and Arkansas

BTD_1000UTC_6Apr2015

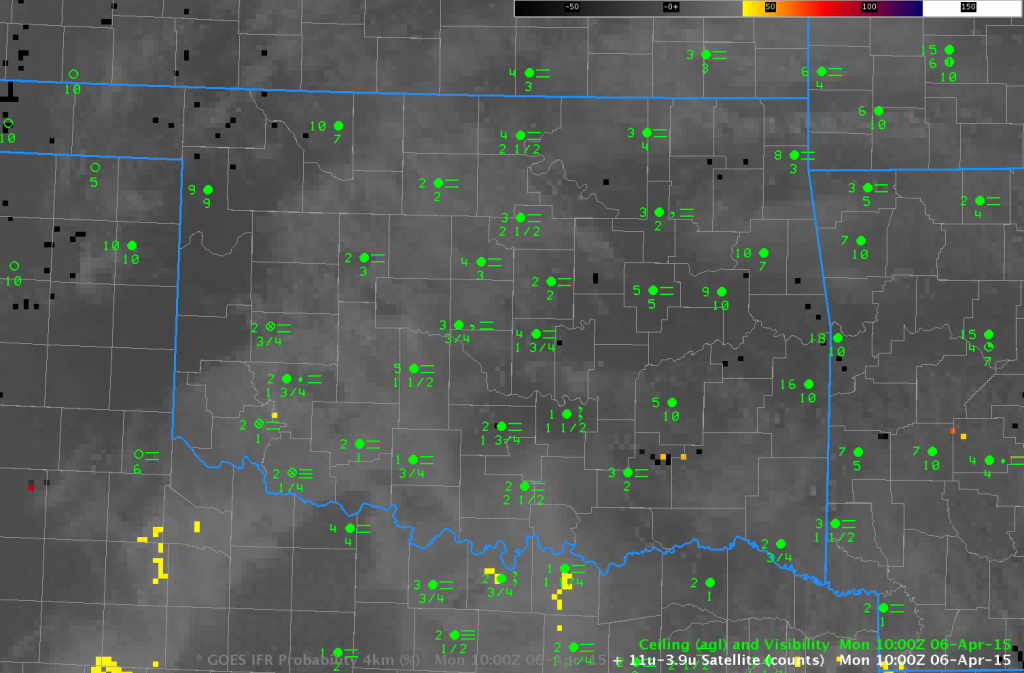
Brightness temperature Difference field (10.7µm – 3.9µm) from GOES East over the southern Plains, 1000 UTC on 6 April 2015 (Click to enlarge)

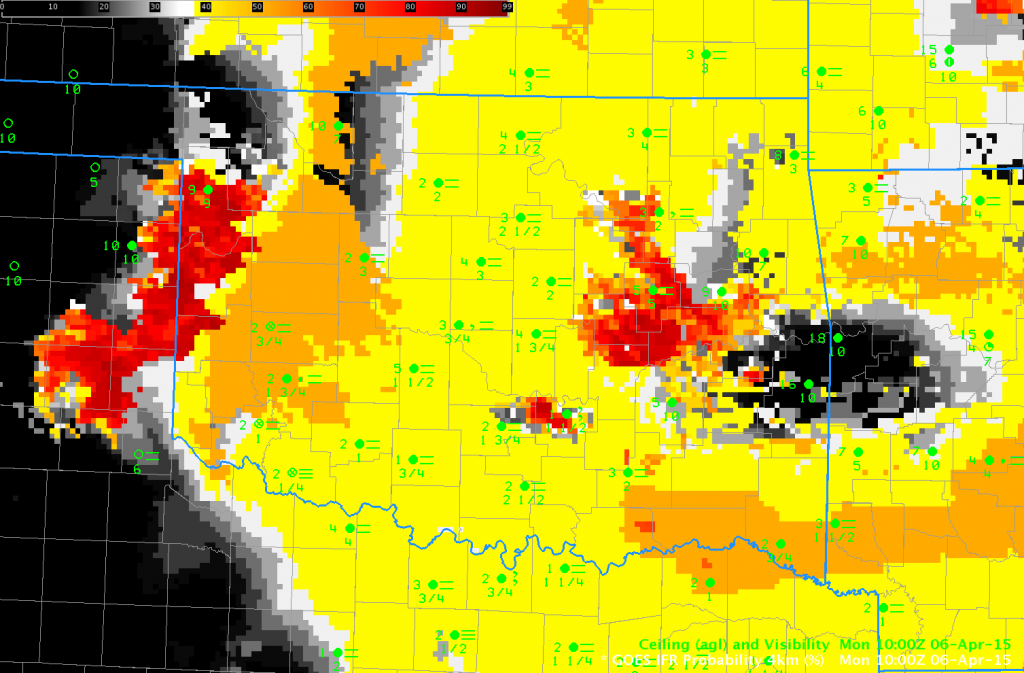
The heritage, traditional method for detecting fog and low stratus is the brightness temperature difference product, seen above (with an enhancement) at 1000 UTC on 6 April. It is difficult to discern a difference in the field over regions where IFR conditions are reported versus regions where IFR conditions are absent. In contrast, the IFR Probability Field from the same time, below, neatly outlines the regions of IFR conditions, and, importantly, does not highlight regions — such as Fort Smith AR and Poteau, OK — where IFR conditions are not present.

IFRPROB_1000UTC_6Apr2015

GOES-R IFR Probability Fields, 1000 UTC on 6 April 2015 UTC (Click to enlarge)


Fog over the High Plains of Texas

GOES_IFR_PROB_20150303_0400_1000

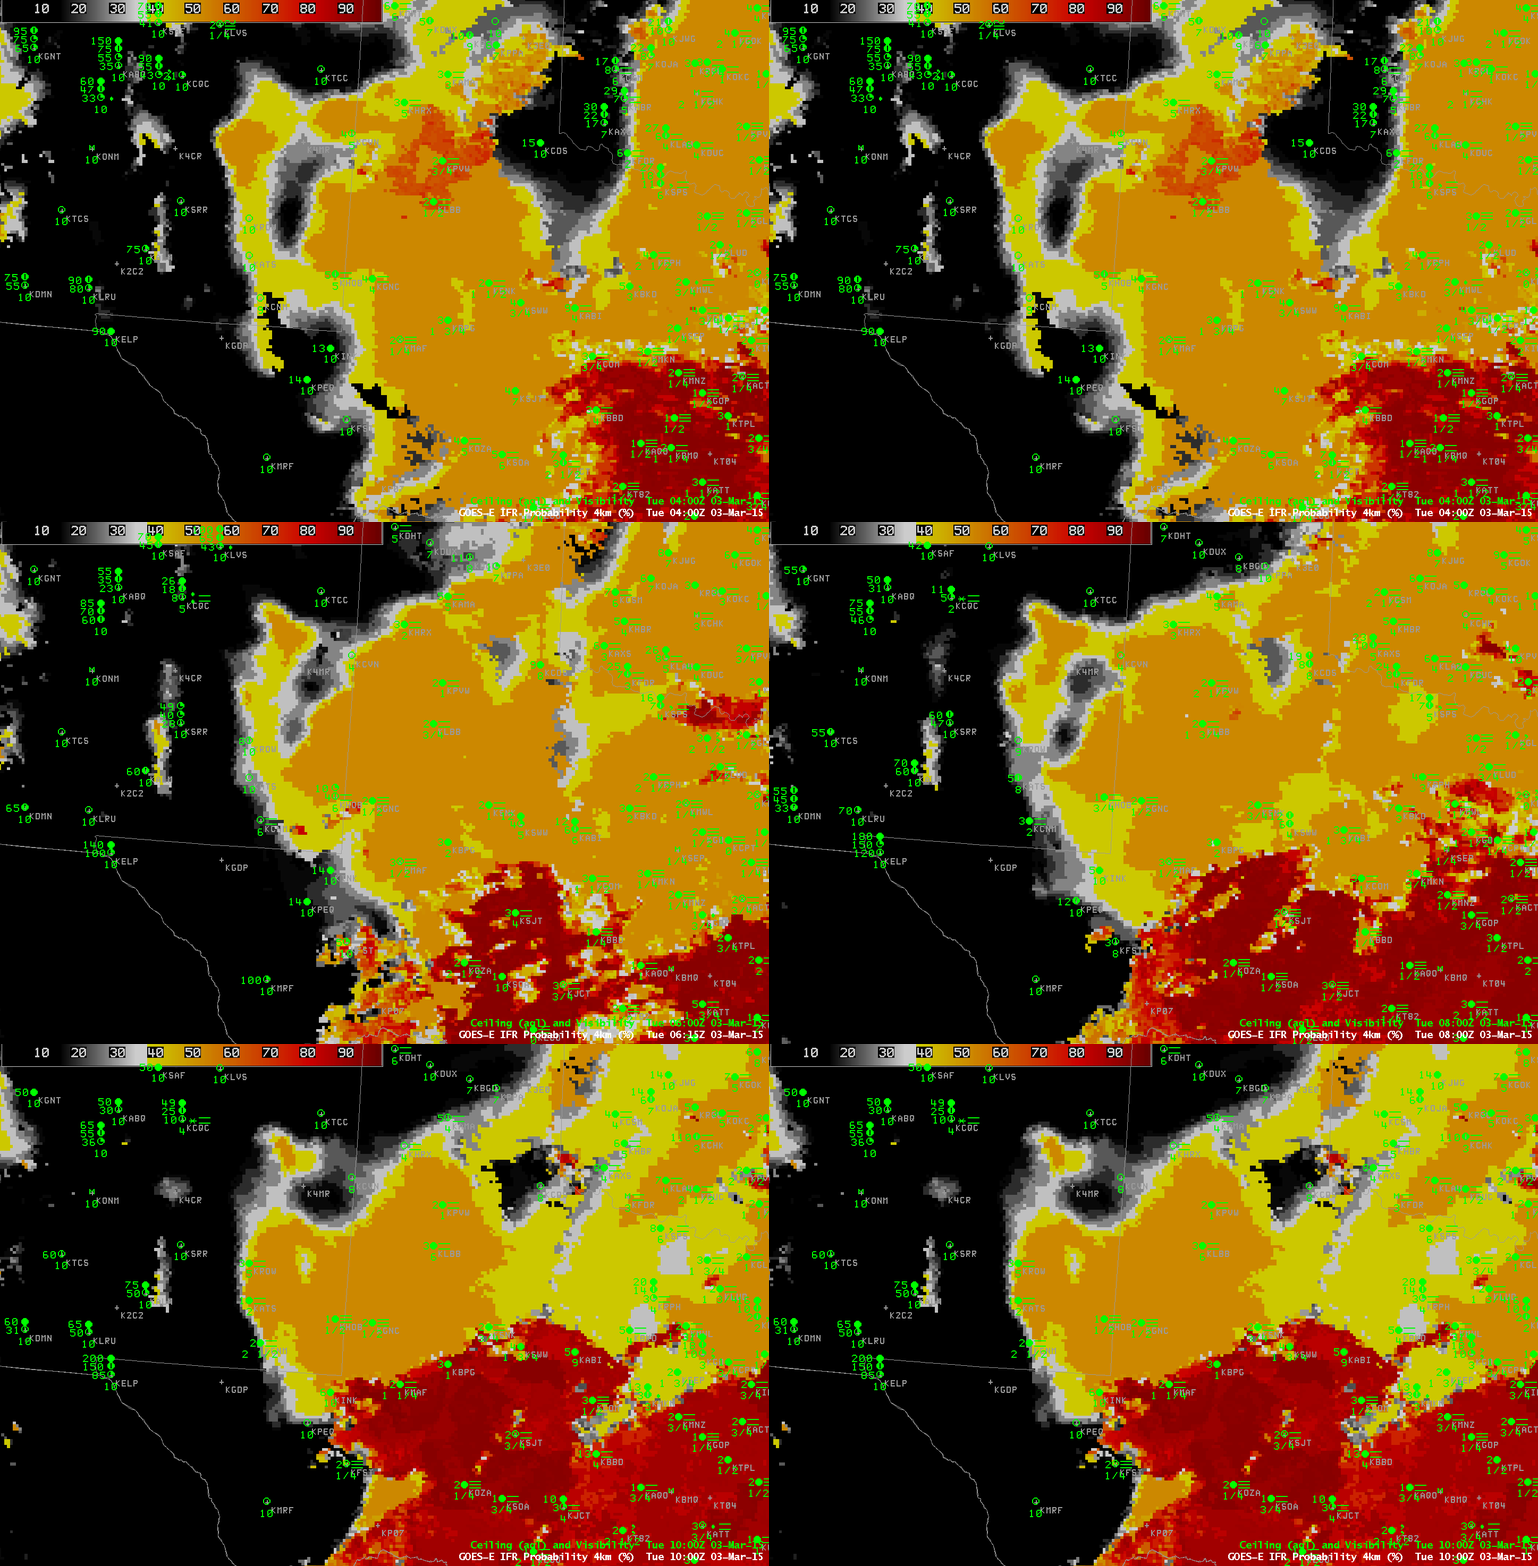
GOES-R IFR Probability Fields, hourly from 0400 through 1000 UTC on 3 March 2015 (Click to enlarge)

Persistent fog has shrouded the High Plains of Texas for the past couple days.  GOES-R IFR Probability fields, above, from 0400 to 1000 UTC on 3 March, show the widespread nature of the fog.  There are regions in the animation (north and west of San Angelo at the start of the loop and north and west of Midland at the end of the loop) where the character of the IFR Probability field (a uniform value with a flat field and orange color) suggests high clouds are present and that fog detection with the product is relying on Rapid Refresh model output.  That the GOES-R IFR Probability fields align well with observations of IFR or near-IFR conditions is testimony to the accuracy of the Rapid Refresh Model. In the southern part of the domain, where GOES-R IFR Probability values are larger (the field is red), satellite data are also used in the computation of the IFR Probability field. Because satellite predictors can also be used there, confidence that fog/low stratus exists is greater, and the IFR Probability field values are larger. Note that the IFR Probability field there is also pixelated, reflecting the small pixel size (nominally 4 km) of the GOES Imager.

VIIRS_DNB_FOG_20150303_0905

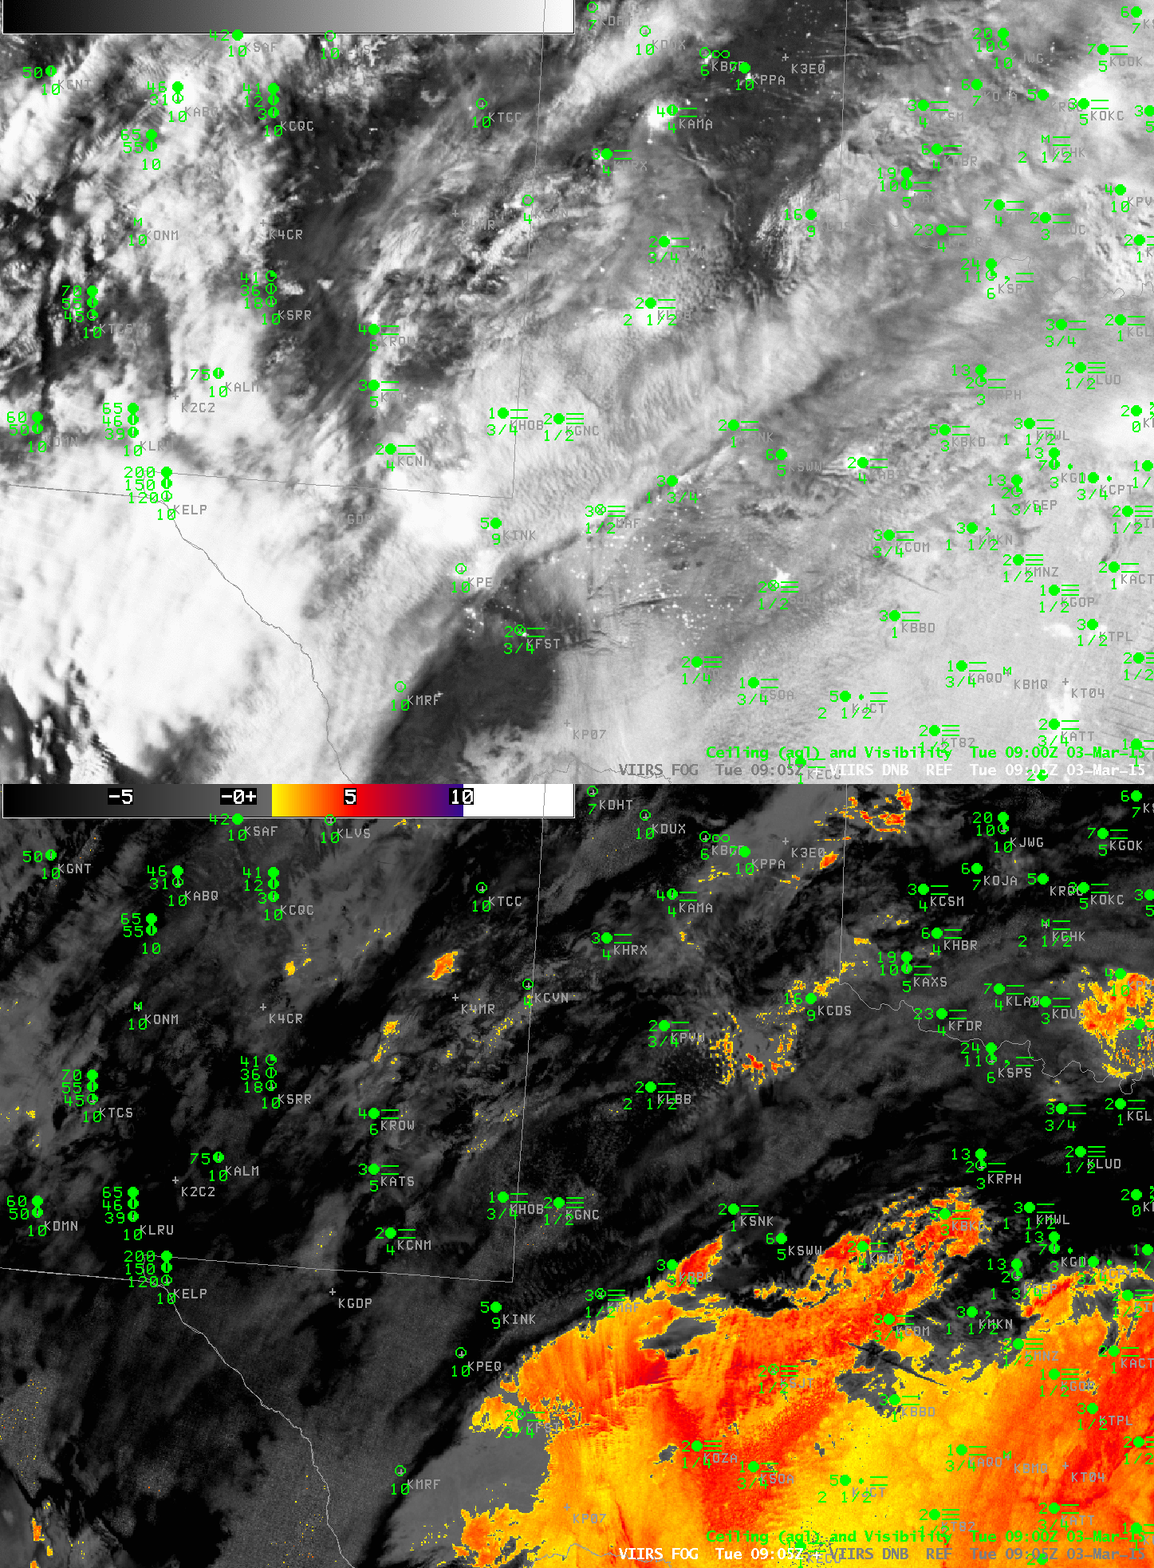
Suomi NPP Brightness Temperature Difference Field (11.35 µm – 3.74 µm) and Day Night Band (0.70 µm) at 0905 UTC on 3 March 2015 (Click to enlarge)

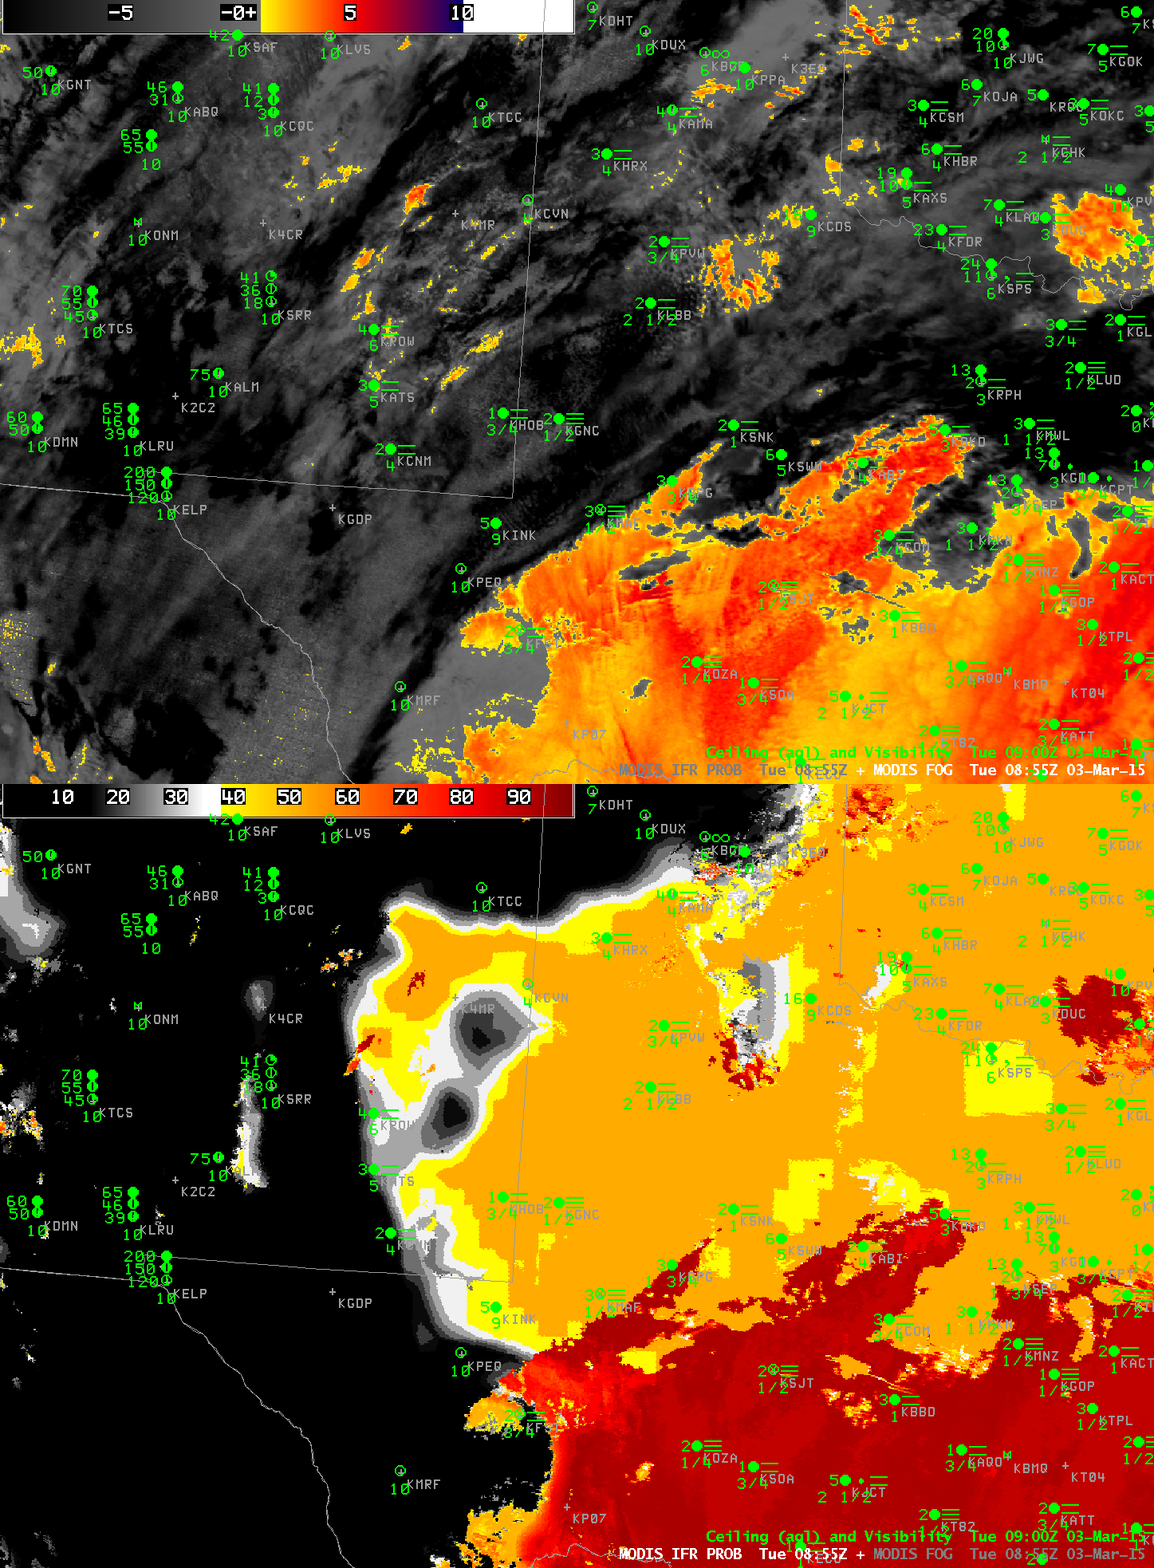
Suomi NPP and Aqua both overflew the region around 0900 UTC on 3 March, and the high-resolution snapshots from Suomi NPP (above) and MODIS (below) show scenes that agree with the GOES Imagery. The Brightness Temperature Difference Fields show middle and high clouds over the Texas Panhandle. The Day Night band shows clouds over most of Texas — but it is difficult to distinguish high clouds and low clouds from the imagery. Shadows can be used to infer differences in cloud height — but that requires a knowledge of where the Moon sits in the sky relative to Texas at this time: to the east, or to the west?

The MODIS-based GOES-R IFR Probability field at ~0900 UTC, below, again shows how model data is helpful in filling in regions where high clouds or mid-level clouds obscure the satellite-view of low clouds/stratus.

MODIS_FOG_IFR_PROB_20150303_0855

MODIS-based GOES-R IFR Probability and Aqua Brightness Temperature Difference Fields (11 µm – 3.9 µm) at 0855 UTC, 03 March 2015 (Click to enlarge)

Fog in the Pecos River valley of New Mexico

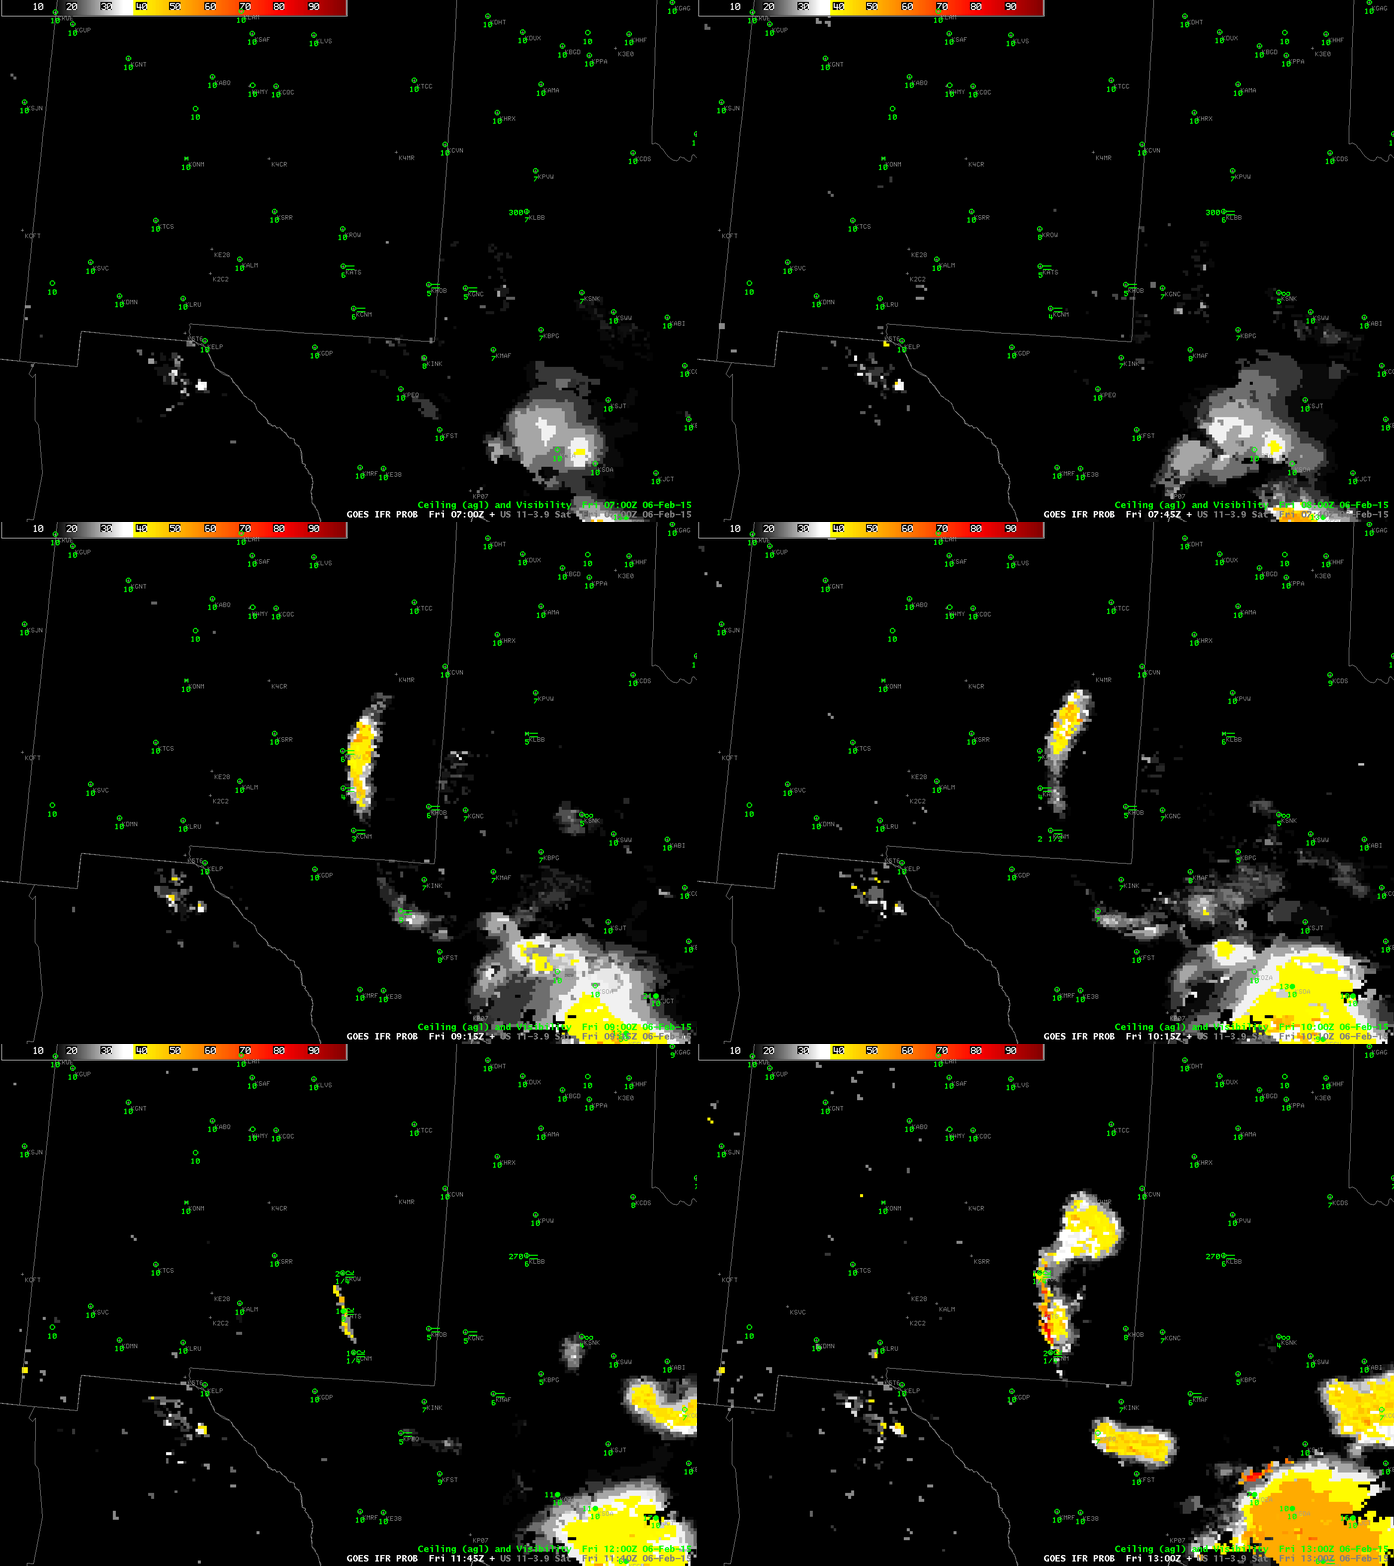
GOES_IFR_PROB_20150206_0700_1300

GOES-R IFR Probabilities computed from GOES-13 and Rapid Refresh Data, 0700-1300 UTC, 6 February 2015 (Click to enlarge)

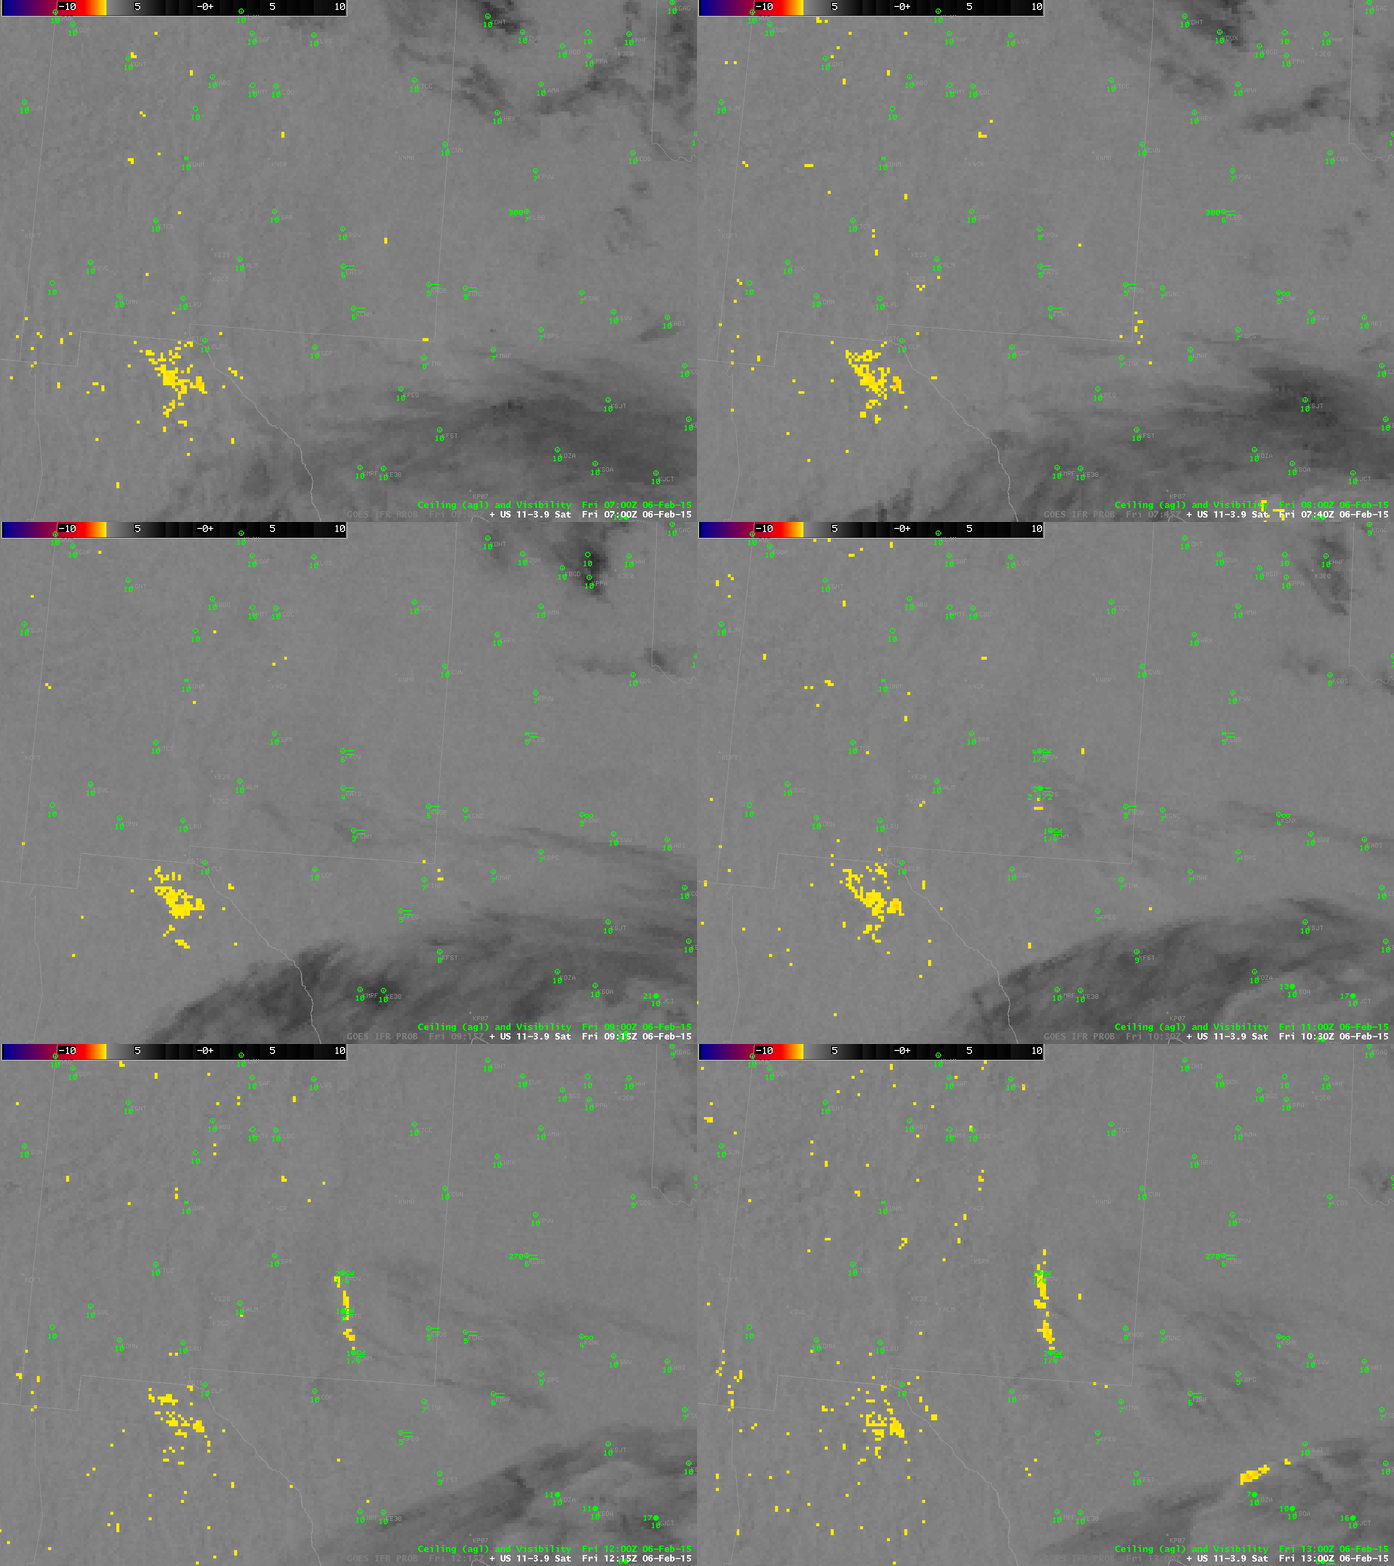
Fog developed over the Pecos River valley in southeastern New Mexico early on the morning of 6 February. This small-scale feature was captured well by the GOES-R IFR Probability fields, shown above. Probabilities increased quickly between 0745 and 0800 UTC. In contrast, the brightness temperature difference product, below, showed little signal until around 1000 UTC. GOES-R IFR Probability fields responded more quickly to the possible development of fog and in this case could have alerted any forecaster to its imminent formation. IFR conditions were present at Carlsbad (KCNM), Artesia (KATS) and Roswell (KROW) by 1100 UTC.

US_11-3.9_Sat_20150206_0700_1300

GOES-13 Brightness Temperature Difference fields, 0700 through 1300 UTC, 6 February 2015 (Click to enlarge)

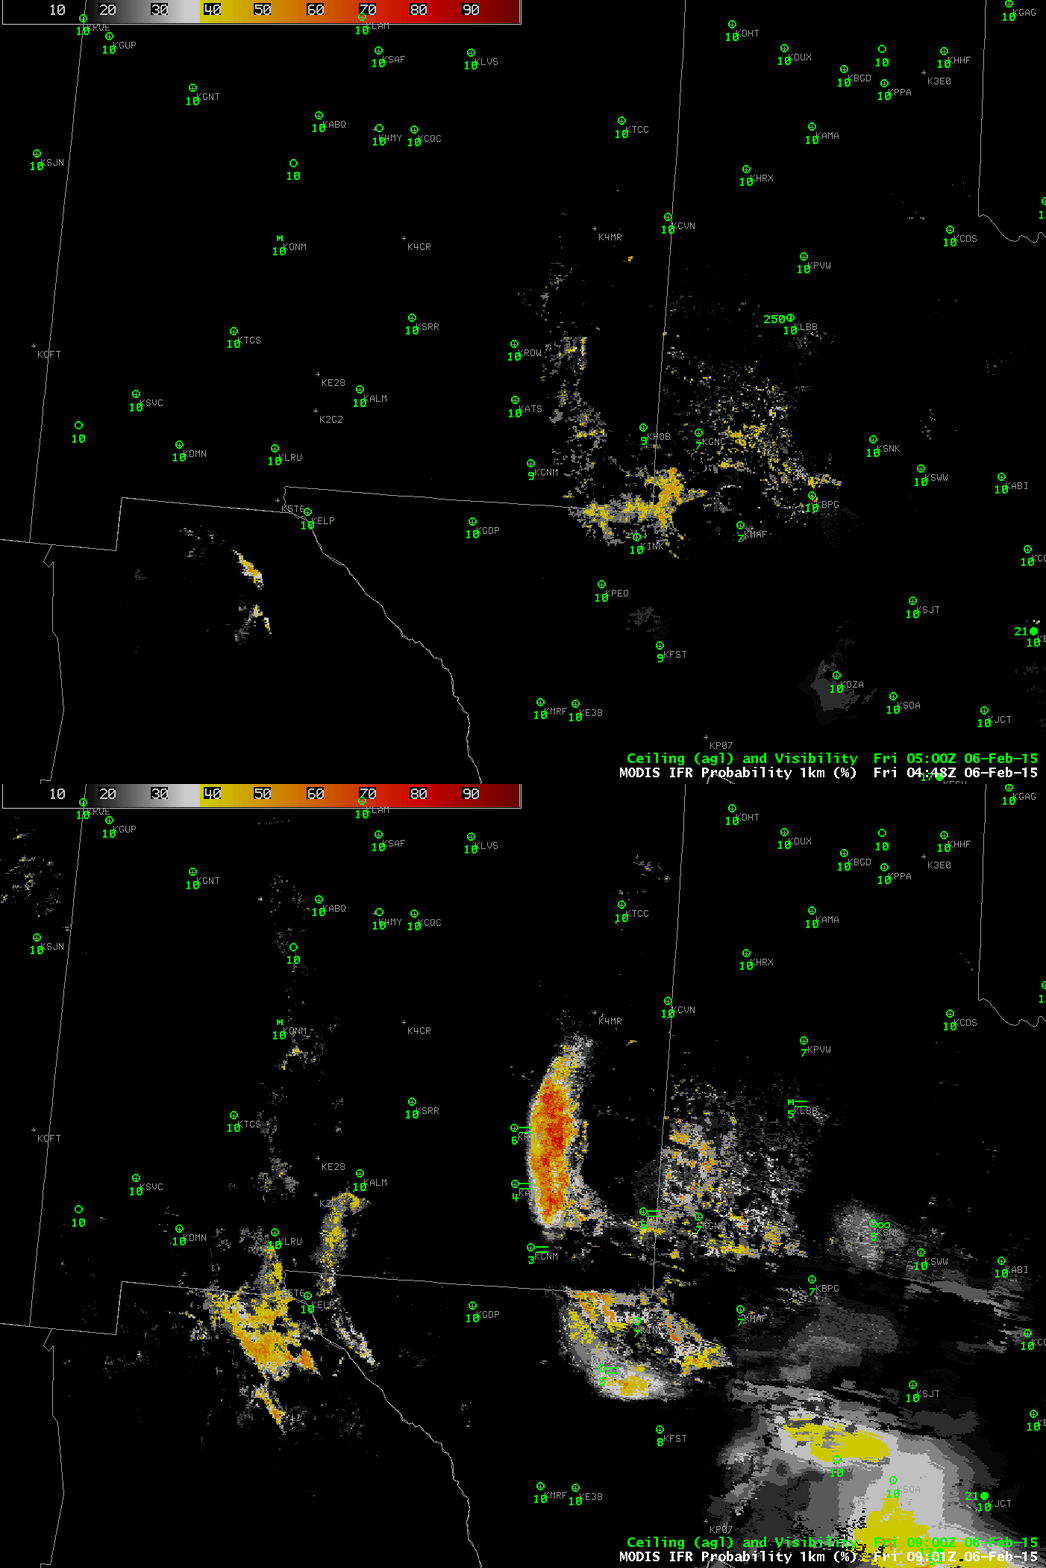
MODIS data from Terra and Aqua, and VIIRS data from Suomi NPP give occasional snapshots (at high resolution) of conditions. Terra (just before 0500 UTC) and Aqua (around 0900 UTC) data were used to compute IFR Probabilities, and the high resolution data, below, is consistent with the development of fog over night. The 0900 UTC image especially suggests the possibility of fog.

MODIS_IFR_PROB_20150206_0448_0901

MODIS IFR Probability from Terra (0448 UTC) and Aqua (0901) UTC on 6 February 2015 (Click to enlarge)

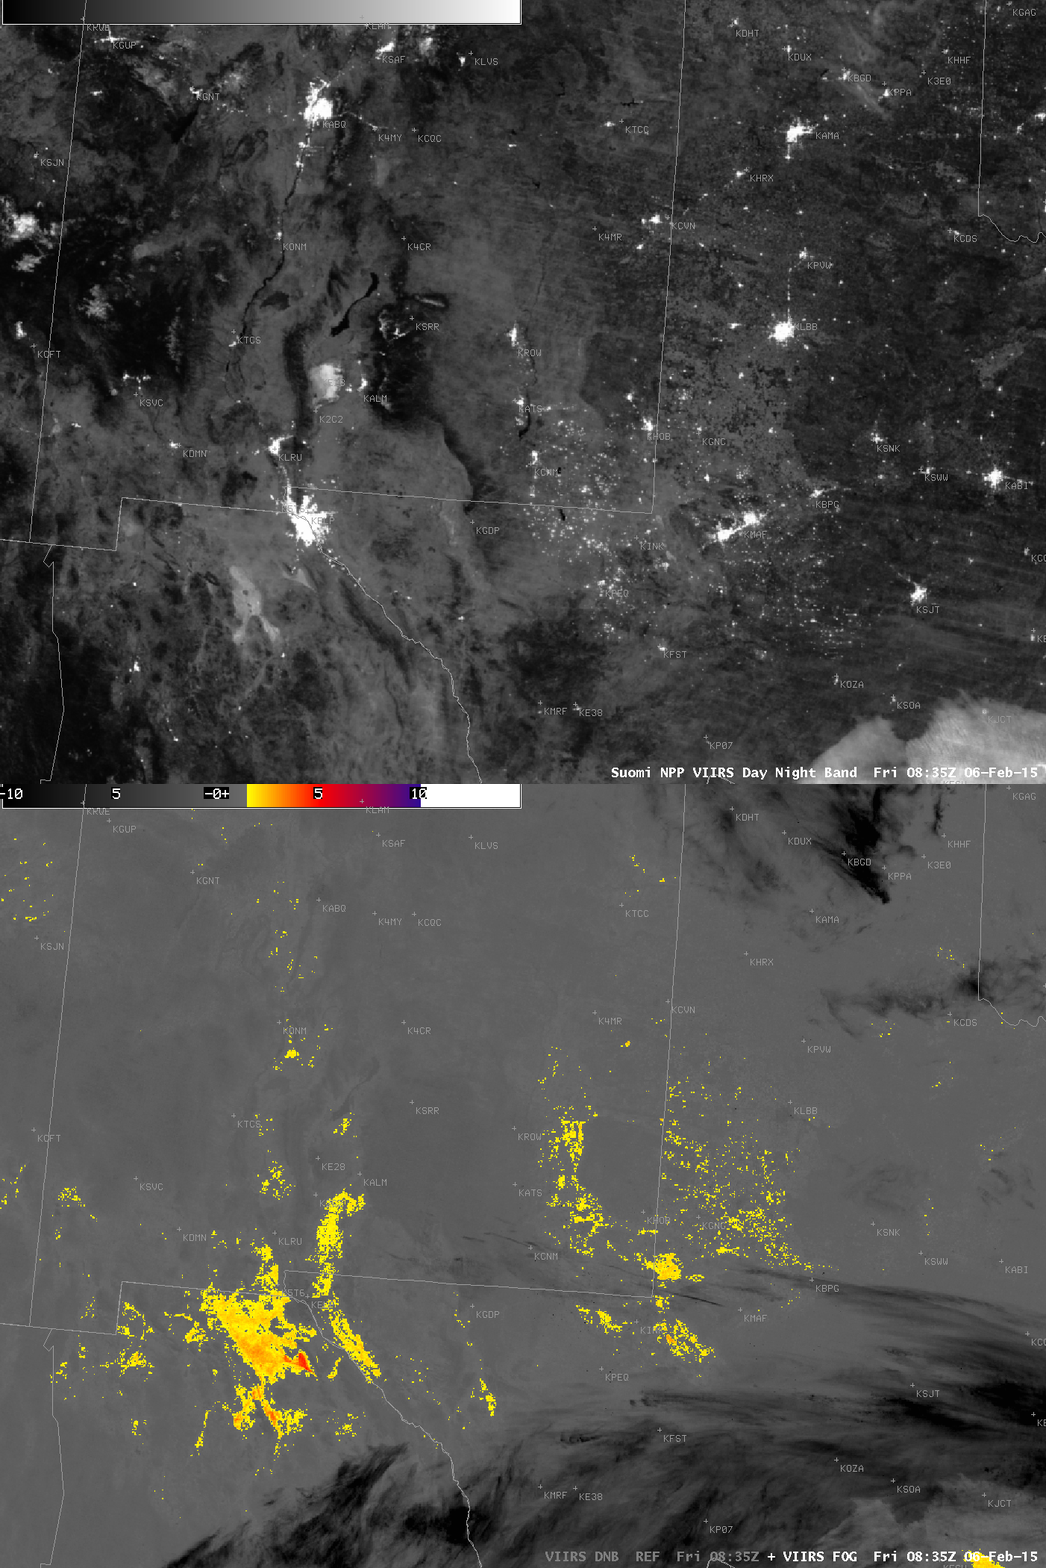
Suomi NPP data are not yet used to compute IFR Probabilities. The toggle, below, of the Day Night Band and the Brightness Temperature Difference at 0835 UTC does not show convincing evidence of fog at that time. The Day Night Band is very crisp because of the near Full Moon that provided ample lunar illumination.

VIIRS_DNB_FOG_20150206_0835

Suomi NPP Day Night Band and Brightness Temperature Difference, 0835 UTC, 6 February 2015 (Click to enlarge)

The imagery above all suggest that the presence of model data — from the Rapid Refresh — enhanced the satellite data as far as suggesting IFR conditions.

Fog over the Southern Plains

Fog developed over Texas, Oklahoma and Arkansas early in the morning of 9 December 2014. Multiple cloud layers made traditional satellite detection (that is, using brightness temperature difference field (10.7µm – 3.9µm)) problematic. How did the fused product, GOES-R IFR Probability perform? The animation below shows the hourly evolution of IFR Probability from 0215 UTC through 1415 UTC.

IFR_09Dec2014_02_14anim

GOES-R IFR Probabilities, hourly from 0215 through 1415 UTC on 9 December 2014, along with surface plots of ceilings and visibilities (Click to enlarge)

There are widespread reports of IFR conditions over southeast Oklahoma and northern Texas, as well as over Arkansas in the Arkansas River Valley. IFR Probability fields generally overlap the region of reduced ceilings and visibilities.

Note that the probabilities increased over west Texas between 1315 and 1415 UTC. The boundary between day and night predictors is also apparent at 1415 UTC as a SW to NE line over the Texas Panhandle. Probabilities change as night switches to day because different combinations of satellite predictors can be used. In particular, the use of visible imagery improves cloud clearing and therefore IFR Probabilities increase in regions where low clouds exist (because the possibility of clouds being present is more easily detected).

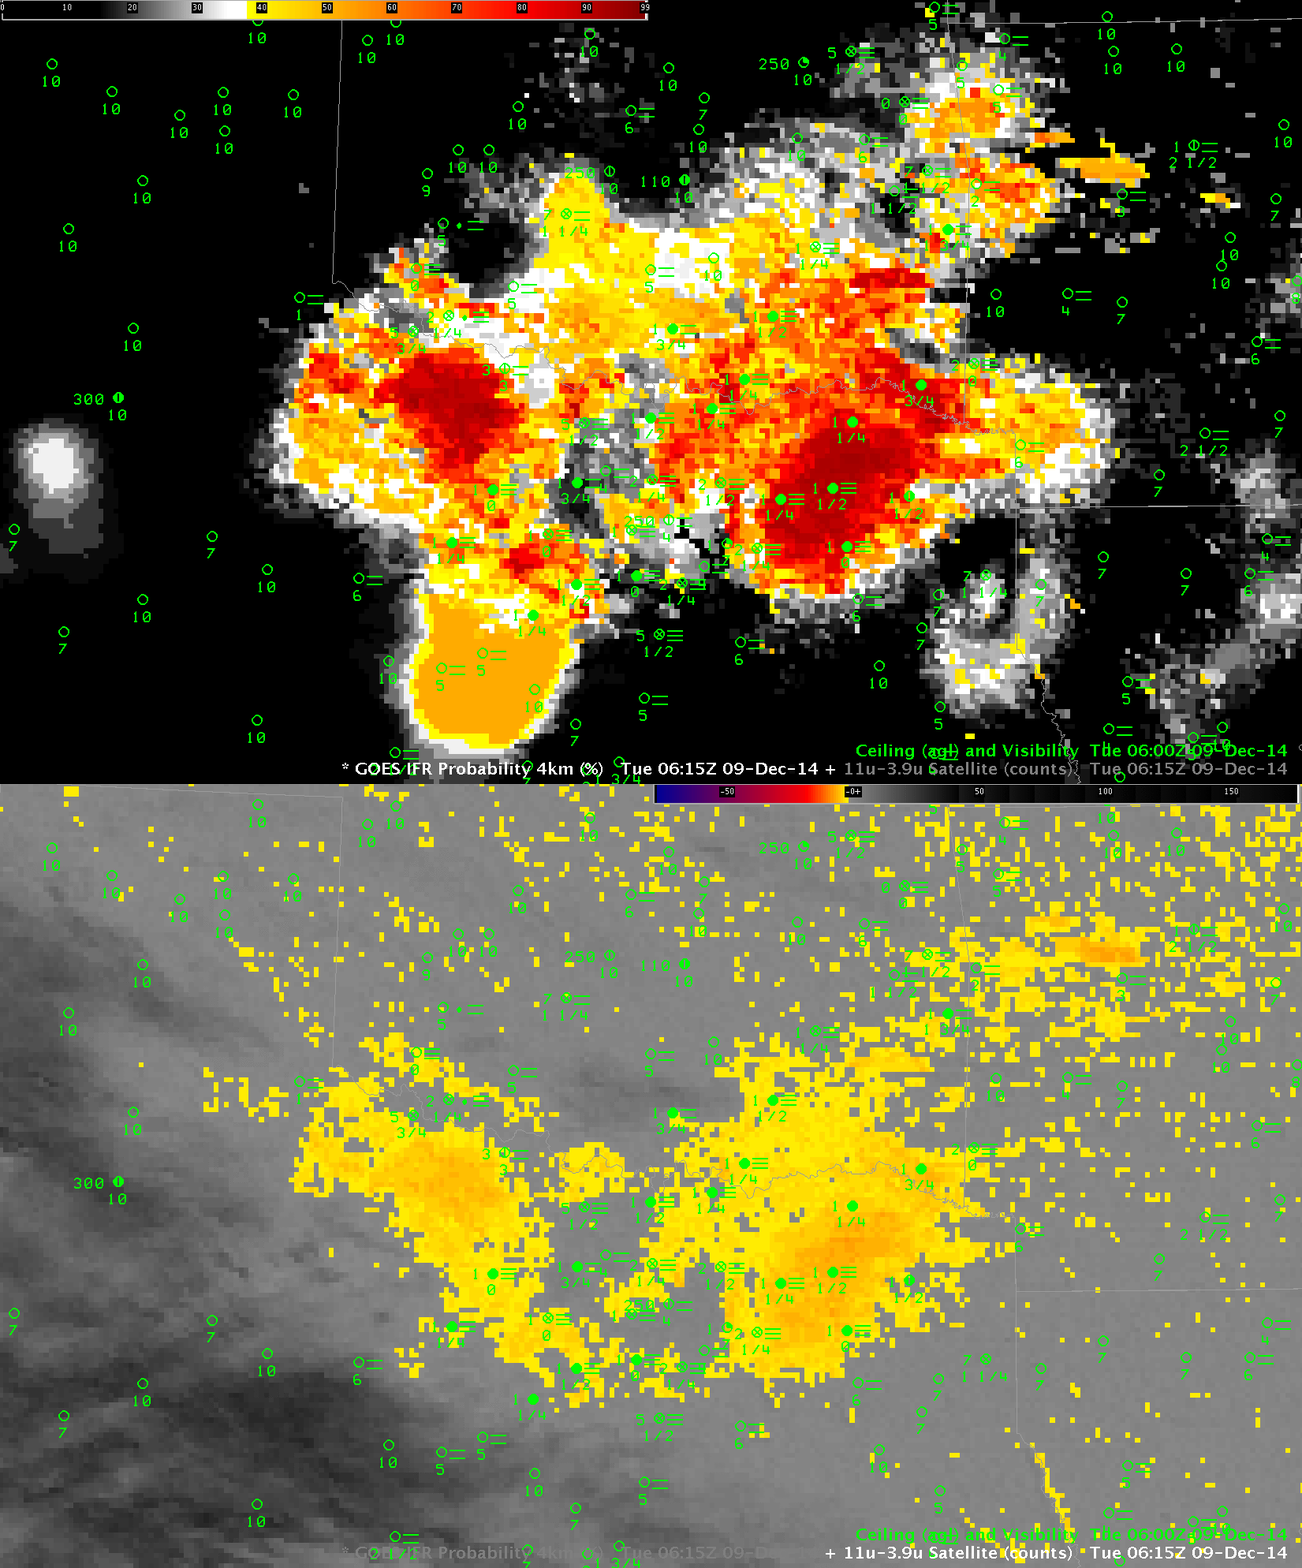
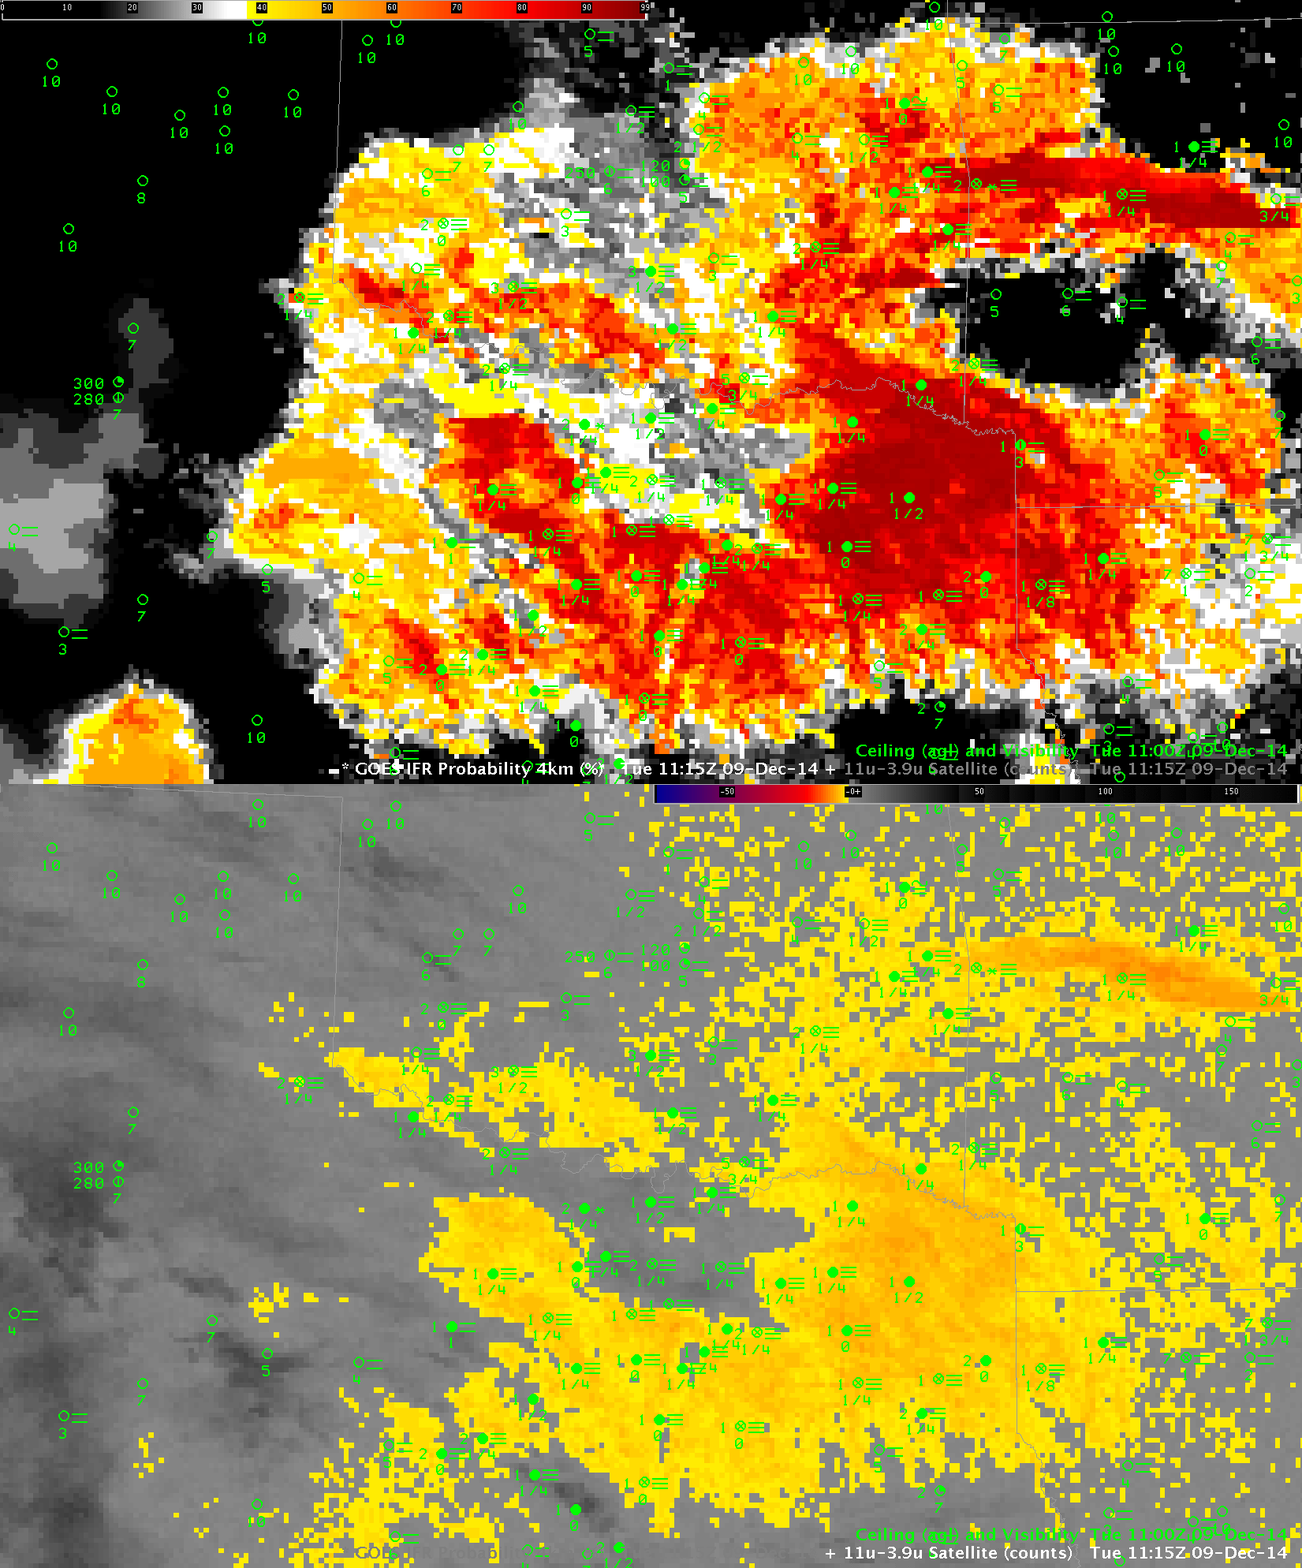
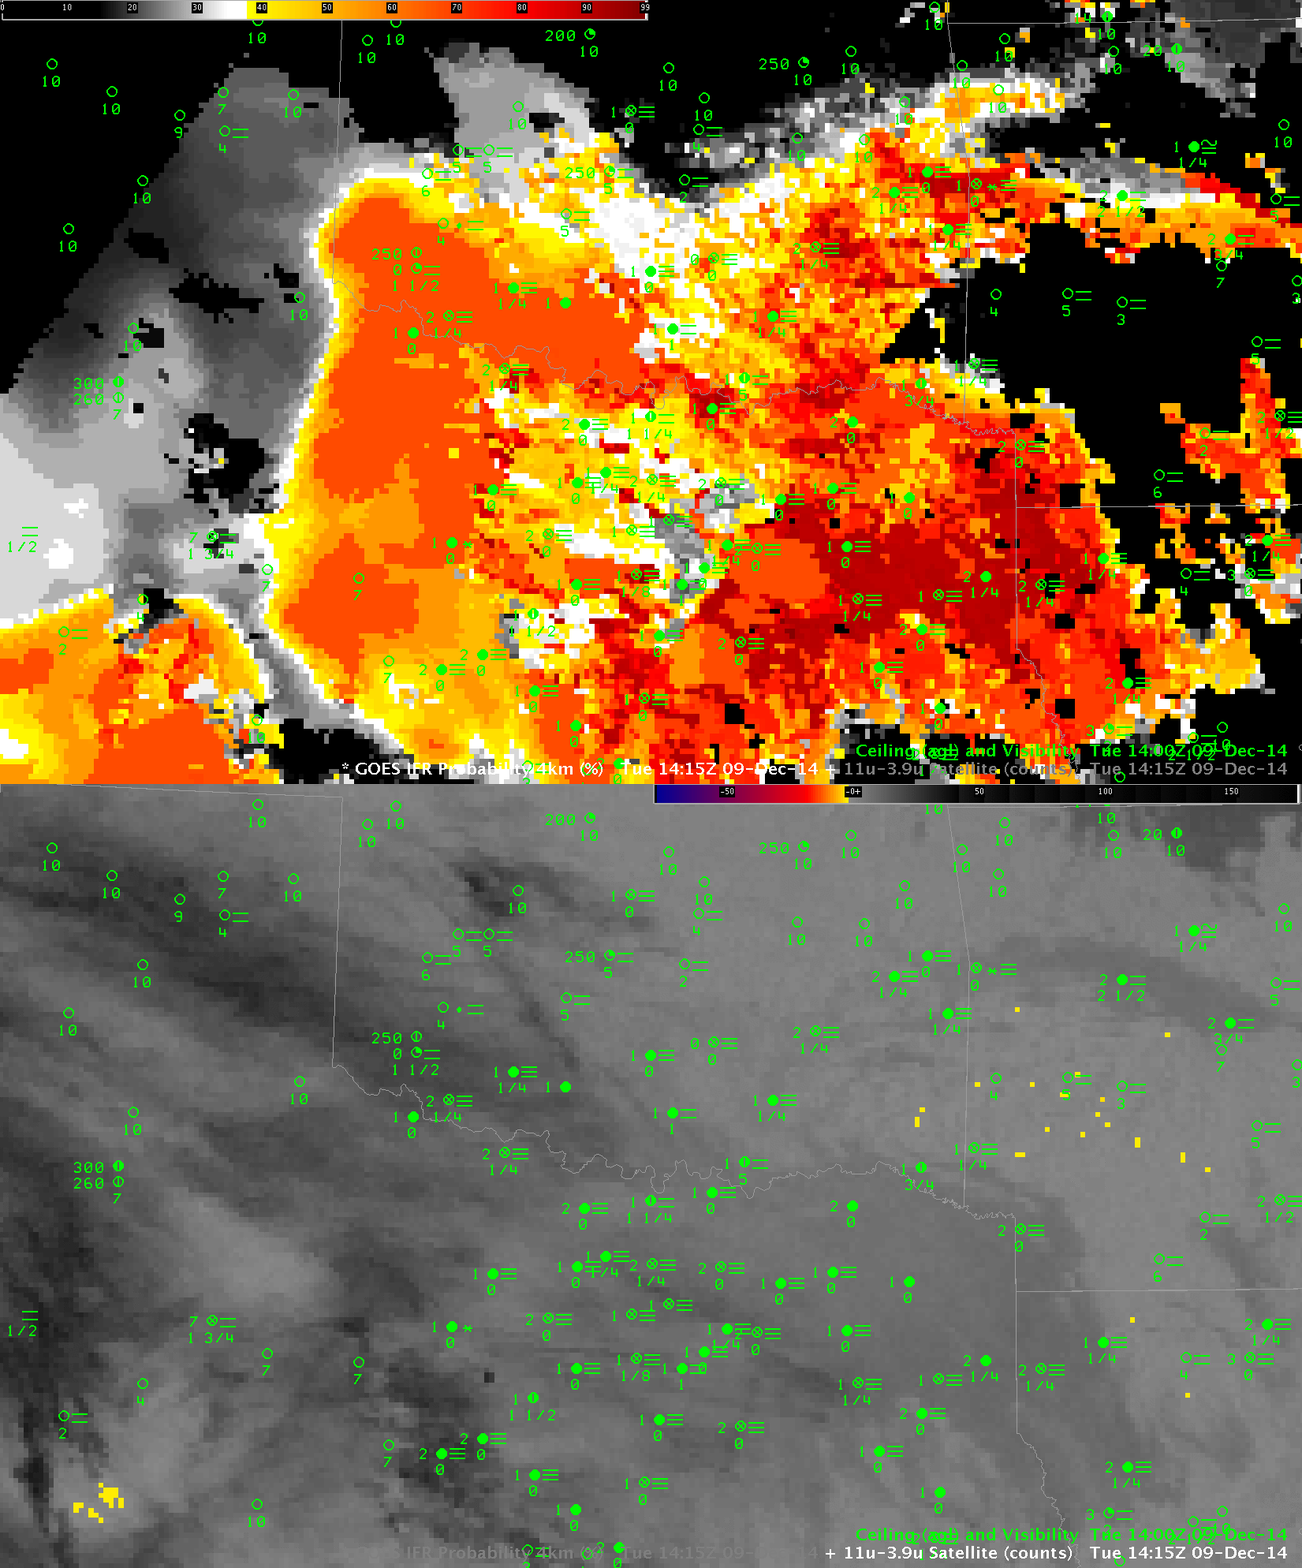
The toggles below show data from 0615, 1115 and 1415 UTC and demonstrate why a fused product can give better information than a satellite-only product. Intermittent high clouds over the southern Plains prevented GOES-13 from identifying regions of low clouds (Cirrus clouds in the enhancement below appear as dark regions). IFR Probabilities can give valid information in these regions because the Rapid Refresh Model gives information about the possibility of low-level saturation. There are large regions at 1415 UTC over west Texas that are covered by cirrus clouds; despite the inability of the satellite to detect low clouds, IFR Probability maintains a strong signal there where IFR Conditions are occurring. The 1415 Brightness Temperature Difference field, in contrast to the IFR Probability field, gives very little information because increasing amounts of solar radiation are changing the relationship between 10.7µm and 3.9µm radiation at 1415 UTC.

IFRPROB_BTD_0615_9Dec2014

GOES-R IFR Probabilities and GOES-13 Brightness Temperature Difference Fields (10.7µm – 3.9µm), 0615 UTC on 9 December 2014, along with surface observations of ceilings and visibilities (Click to enlarge)

IFRPROB_BTD_1115_9Dec2014

As above, but at 1115 UTC (Click to enlarge)

IFRPROB_BTD_1415_9Dec2014

As above, but at 1415 UTC (Click to enlarge)

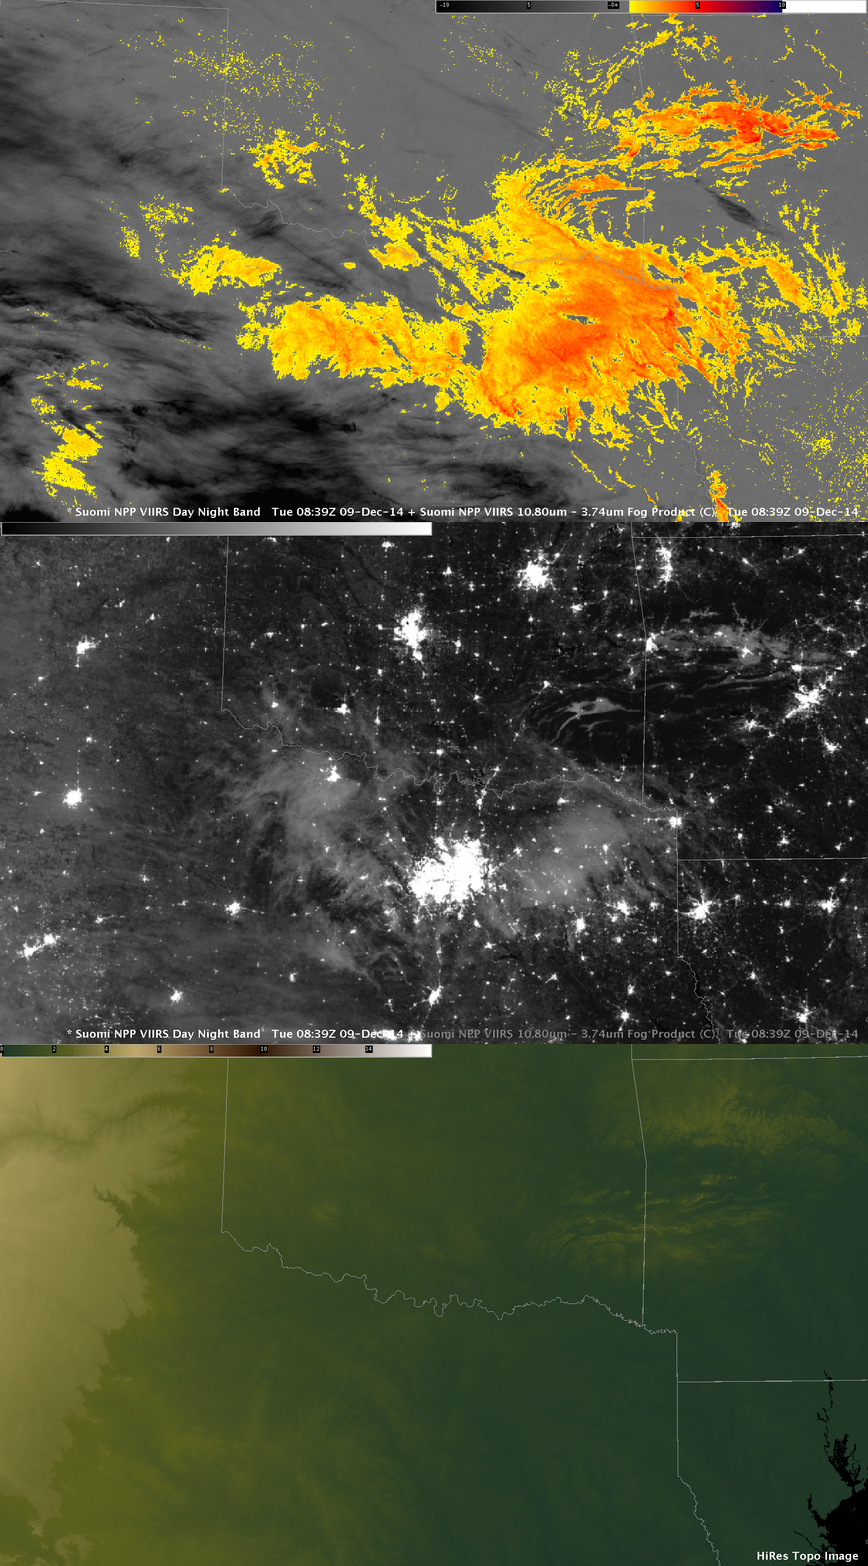
A near-Full Moon on 9 December means that the Day Night Visible imagery from Suomi NPP produced great imagery of the clouds over the southern Plains. The toggle below shows the Day Night band, the brightness temperaure difference field (11.35µm – 3.74µm) and the topography. Very narrow fog banks are apparent over southeast Oklahoma and over Arkansas, nestled into narrow valleys. The Brightness Temperature Difference field distinguishes between water-based clouds (presumably low stratus or fog) in orange and ice clouds (cirrus) in black.

SNPP_BTD_DNB_0839UTC_09Dec2014

Suomi NPP Brightness Temperature Difference (11.35µm – 3.74µm) fields, Day Night band imagery and Color-shaded topography, 0839 UTC 9 December 2014 (Click to enlarge)

The fog event over Dallas was photographed from the air: Link.

Ice Fog causes Flight Diversions at Denver International

Ice Fog at Denver International Airport on Sunday 30 November resulted in the diversion of almost 50 flights. (News Link) From the link:

Sunday morning fog caused about 46 flights scheduled to land at Denver International Airport to be diverted, airport officials said.

GOES_R_IFRProb_30Nov2014_anim

GOES-R IFR Probability Fields, every 15 minutes, from 0500 UTC through 2200 UTC on 30 November 2014, along with surface reports of ceilings and visibility (Click to enlarge)

The GOES-R IFR Probability field gave useful anticipatory information for this event. The animation above shows a line of high IFR Probability moving southward and westward. Stations within the highest IFR Probability reported freezing fog (e.g. Sidney Nebraska (KSNY) at 0800 UTC, Akron, CO (KAKO) at 1200, 1300 and 1400 UTC and Kit Carson Airport in Burlington CO (KITR) at 1400 UTC). When the region of higher IFR Probability abuts up against Denver International (KDEN), then, at 1600 UTC, the Freezing Fog that occurred should not surprise. This region of enhanced IFR Probability persisted near Denver International through 2200 UTC.

The METARS, listed below, show the onset of the freezing fog (FZFG). Note that times are boldface in black, and fog-related observations are boldfaced in red:

KDEN 301353Z 13005KT 10SM FEW110 BKN220 07/M13 A2981 RMK AO2
SLP068 T00721128 $=
KDEN 301453Z 17007KT 10SM FEW110 SCT220 06/M11 A2984 RMK AO2
SLP082 FG BANK DSNT NW-SE T00561111 51034 $=
KDEN 301539Z 07016KT 1/2SM R35L/P6000FT FZFG FEW001 FEW110
SCT220 M06/M08 A2988 RMK AO2 WSHFT 1505 FG FEW001
T10611078 $=
KDEN 301542Z 07017KT 1/4SM R35L/P6000FT FZFG FEW001 FEW110
SCT220 M06/M07 A2989 RMK AO2 WSHFT 1505 FG FEW001 VIS W
1/2 T10611072 $=
KDEN 301553Z 07019KT 1/4SM R35L/2200VP6000FT FZFG VV002
M06/M07 A2991 RMK AO2 WSHFT 1505 PRESRR SLP131 FROPA
I1000 T10611072 $=
KDEN 301630Z 07020KT 1/8SM R35L/1400V2200FT FZFG VV001
M06/M07 A2993=
KDEN 301637Z 08019KT 1/4SM R35L/1400V2400FT FZFG VV001
M06/M07 A2994 RMK AO2 PK WND 07026/1633 TWR VIS 1/4
I1004 T10611072 $=
KDEN 301651Z 08021G28KT 1/4SM R35L/1000V1600FT FZFG VV002
M07/M07 A2995 RMK AO2 PK WND 07028/1643 I1004 $=
KDEN 301653Z 08023KT 1/4SM R35L/1000V1400FT FZFG VV002
M07/M07 A2996 RMK AO2 PK WND 07028/1643 SLP145 I1004
T10671072 $=

(Click here to see a more English Language Listing; Click here to see a meteorogram)

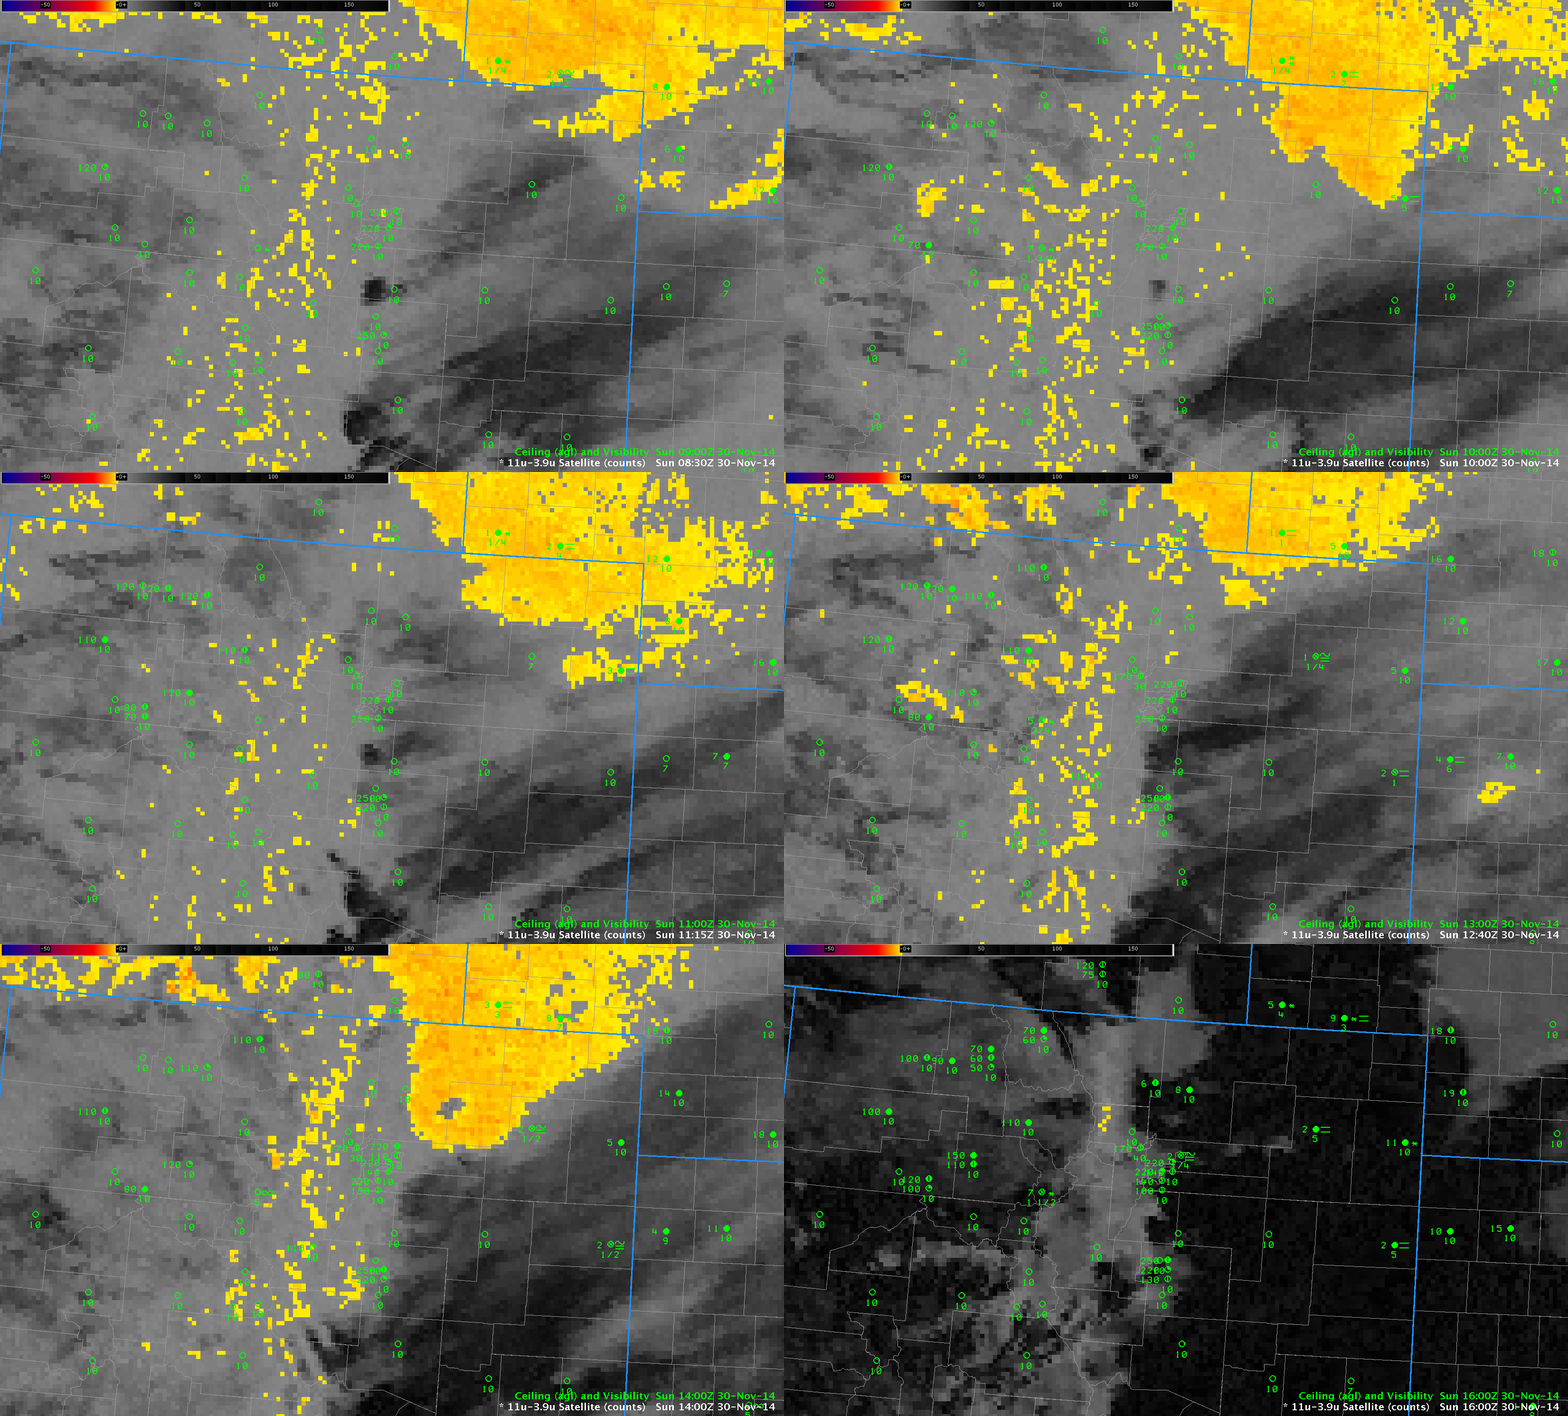
GOES_BTD_30Nov2014_anim

GOES-13 Brightness Temperature Difference fields (10.7µm – 3.9µm) from 0800 through 1600 UTC on 30 November 2014 (Click to enlarge)

For comparison, the Brightness Temperature Difference Field is shown above. Terrain-induced cirrus clouds largely obscured the view of low clouds from satellite in this case. Thus, the incorporation of surface information via the Rapid Refresh model was key to producing an IFR Probability field with useful content.

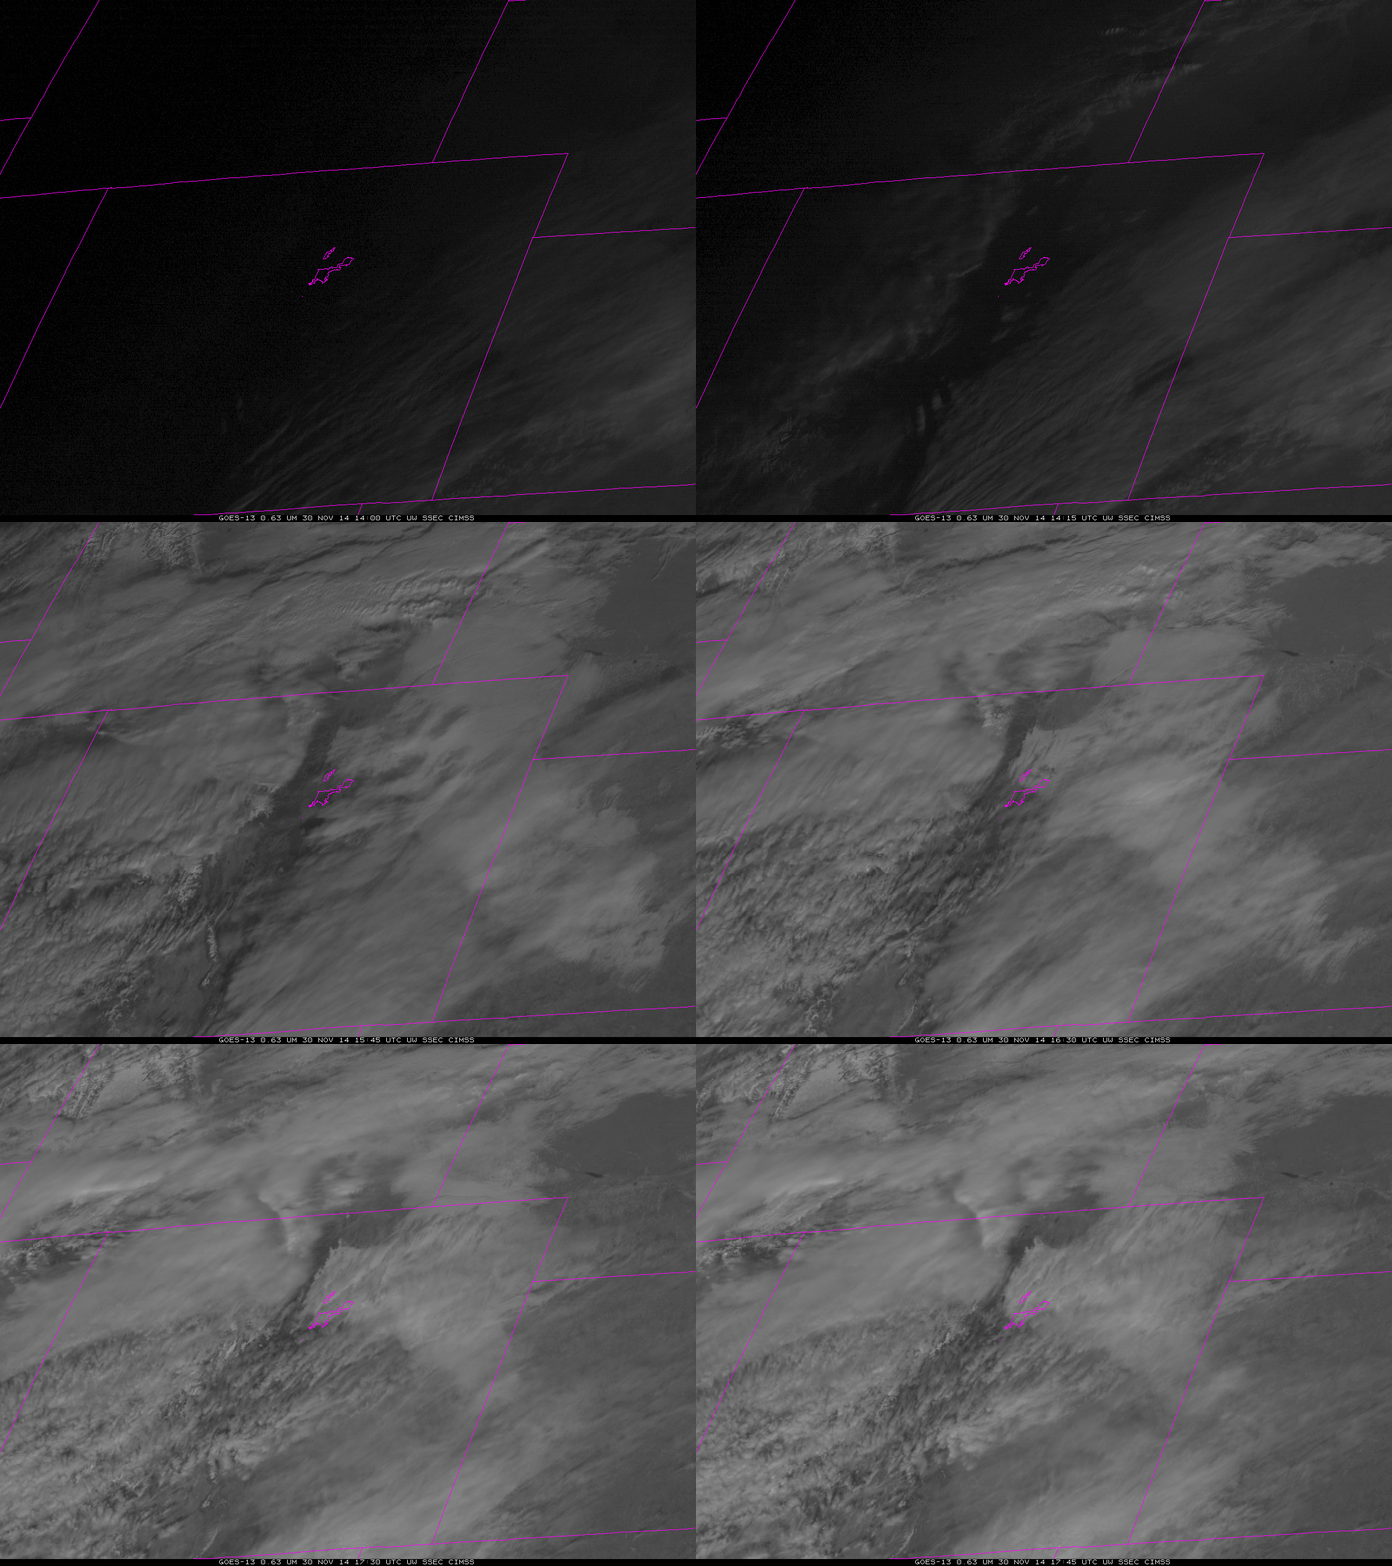
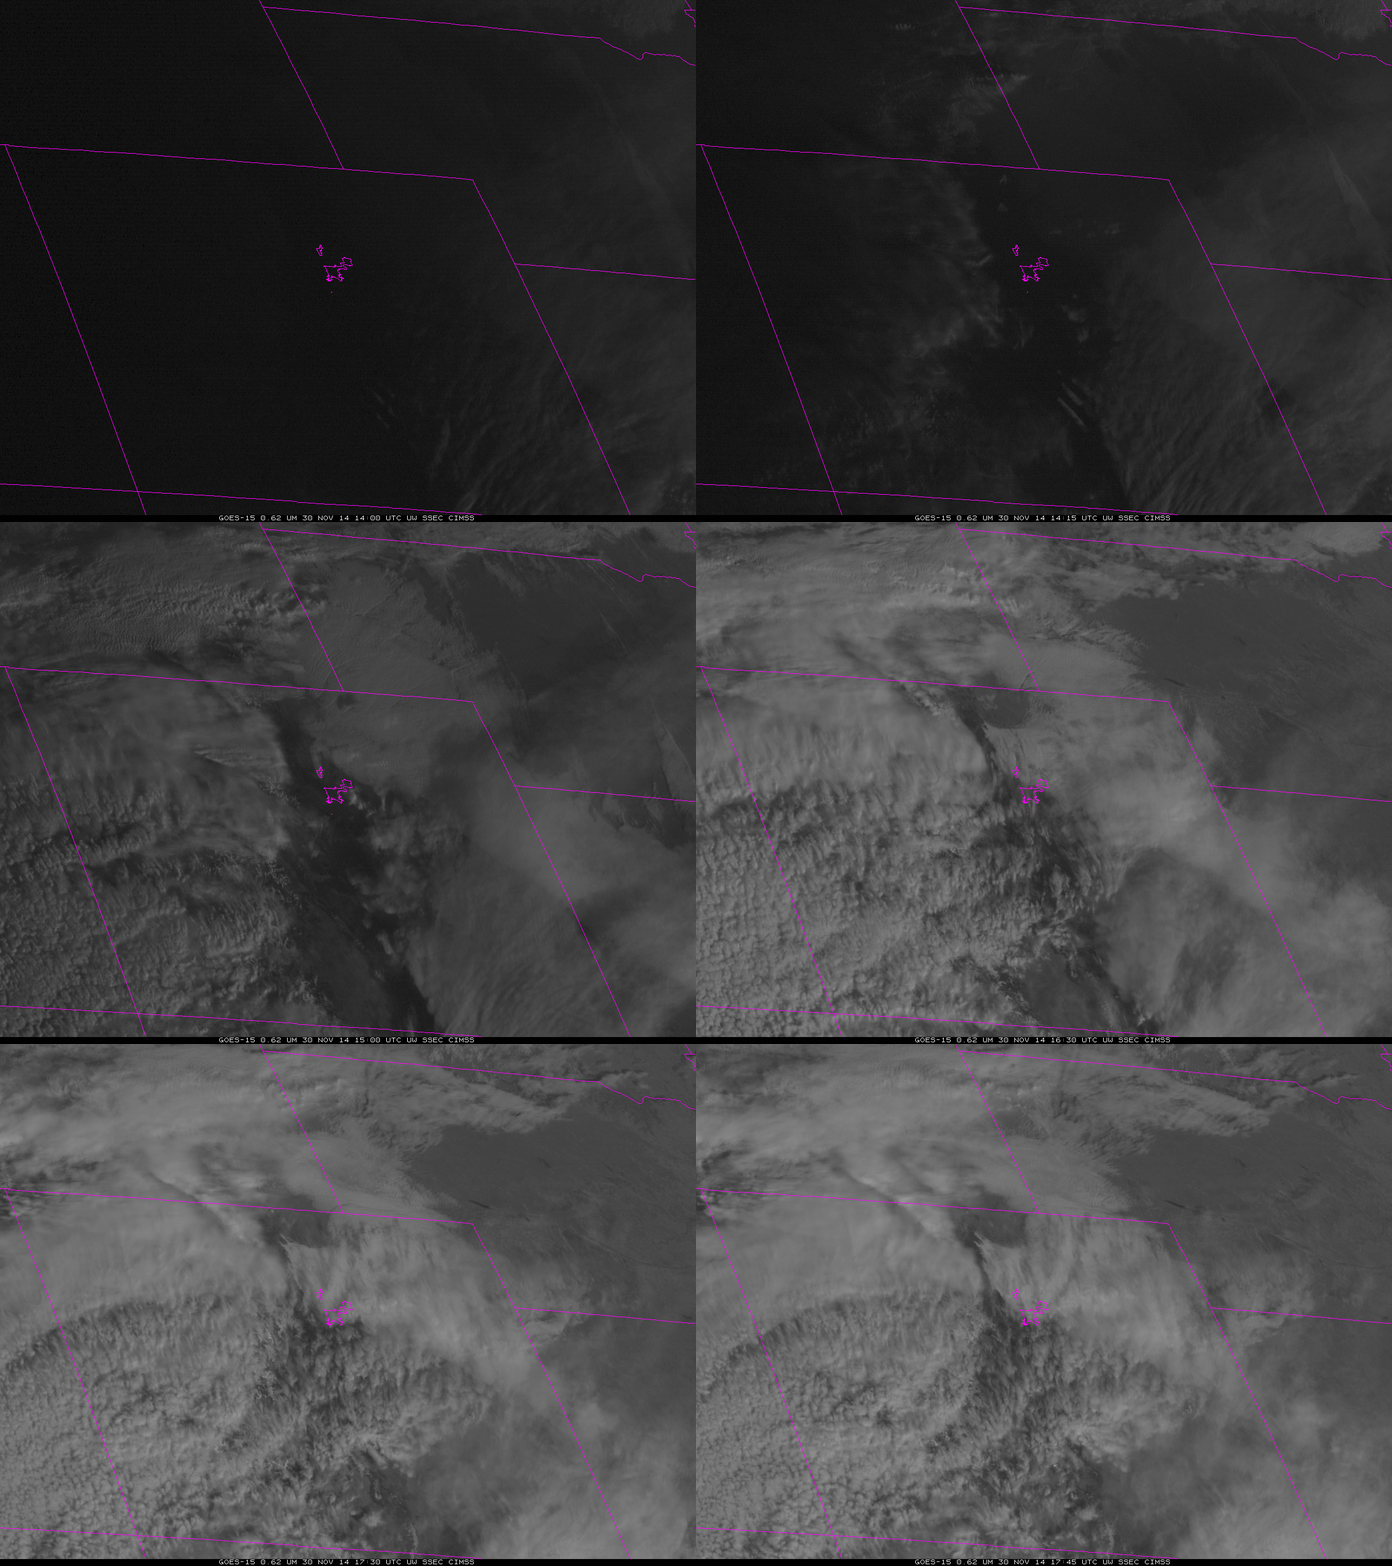
Visible Imagery from GOES-13 (below) and GOES-15 (bottom) show the cirrus and the underlying low clouds. The steady southward advancement of the low clouds is consistent with the motion of the IFR Probability fields.

GOES13_DENVER_ICE_30Nov2014anim

GOES-13 Visible Imagery (0.63µm) animation, 1400-1800 UTC on 30 November 2014 (Click to enlarge)

GOES15_DENVER_ICE_30Nov2014anim

GOES-15 Visible Imagery (0.62µm) animation, 1400-1800 UTC on 30 November 2014 (Click to enlarge)

Fused Products yield better Output

GOES_IFR_US_11-3.9_Sat_20141121_1100toggle

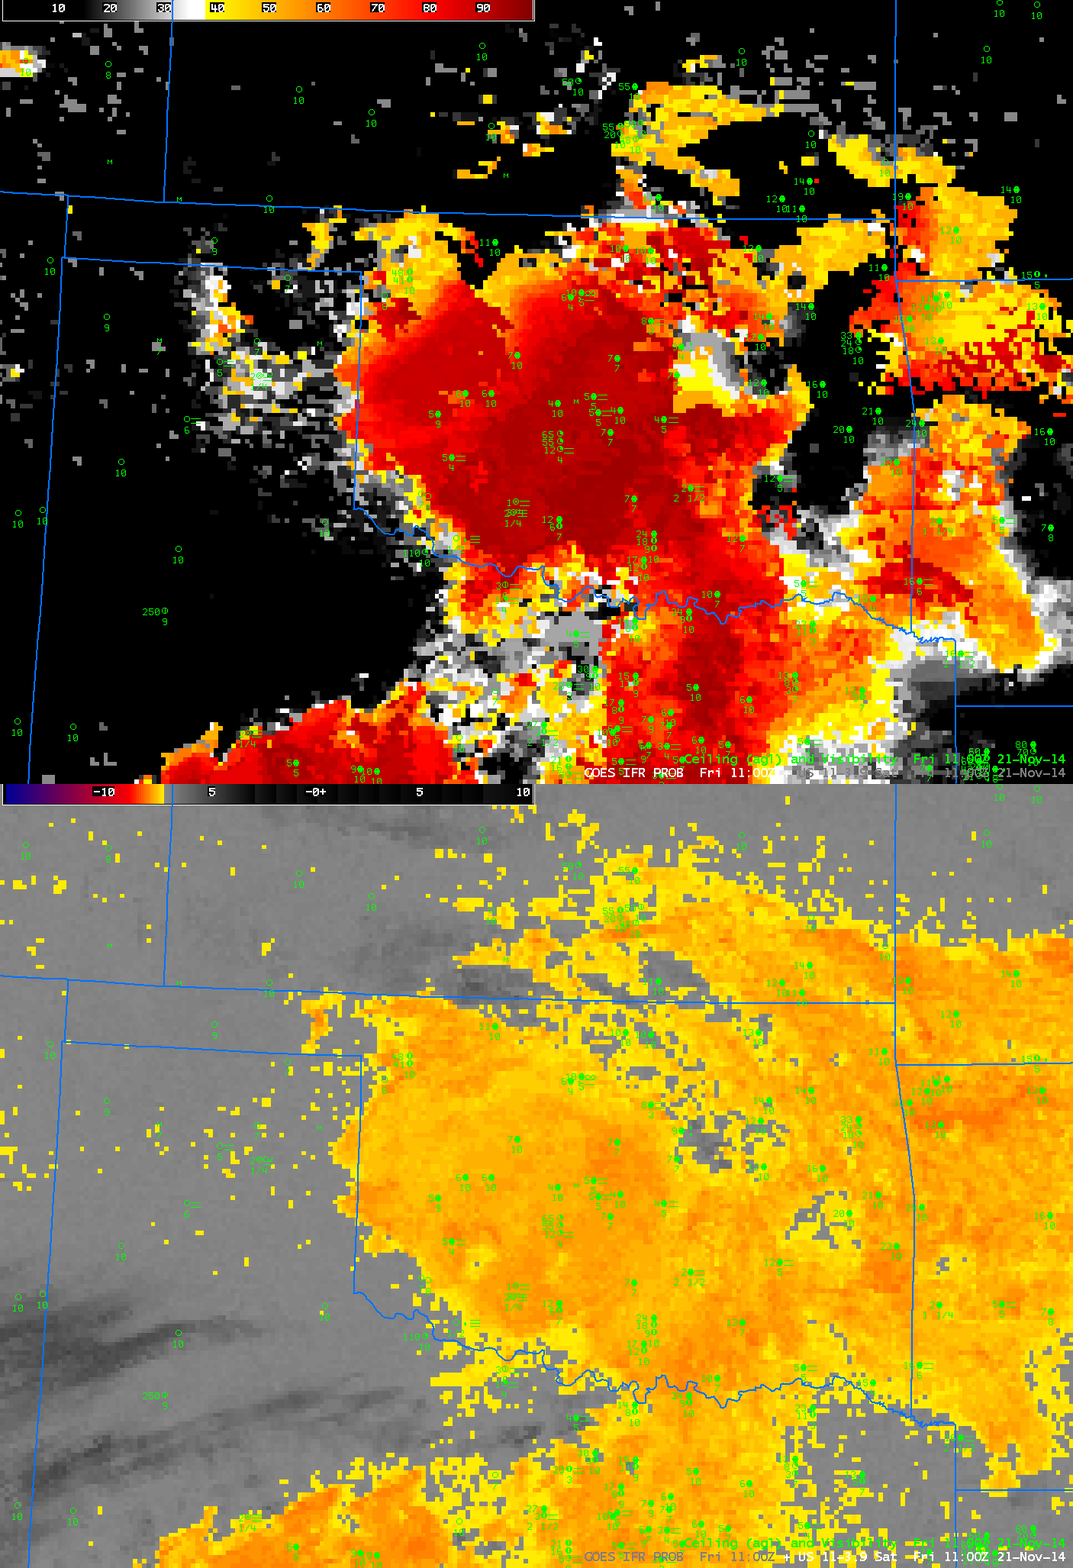
GOES-R IFR Probabilities computed from GOES-East, and GOES-East Brightness Temperature Differences (10.7 µm – 3.9 µm), 1100 UTC on 21 Nov 2014 (Click to enlarge)

The traditional method of detecting fog/low stratus from satellite data, the brightness temperature difference between the longwave and shortwave infrared channels (10.7 µm – 3.9 µm on GOES) can overpredict regions of reduced ceilings and visibilities because satellites see only the top of the cloud. GOES-R IFR Probabilities, in contrast, incorporate surface-based information into a fog/low stratus predictive algorithm. As a result, regions with elevated stratus (such as eastern/northeastern Oklahoma in the toggle above) that should not affect transportation (for example) can be screened out of a field meant to diagnose regions of reduced visibilities.

GOES-R IFR Probabilities as a Weather System Moves Out

GOES_WV_BTD_IFR_23Oct2014_0615

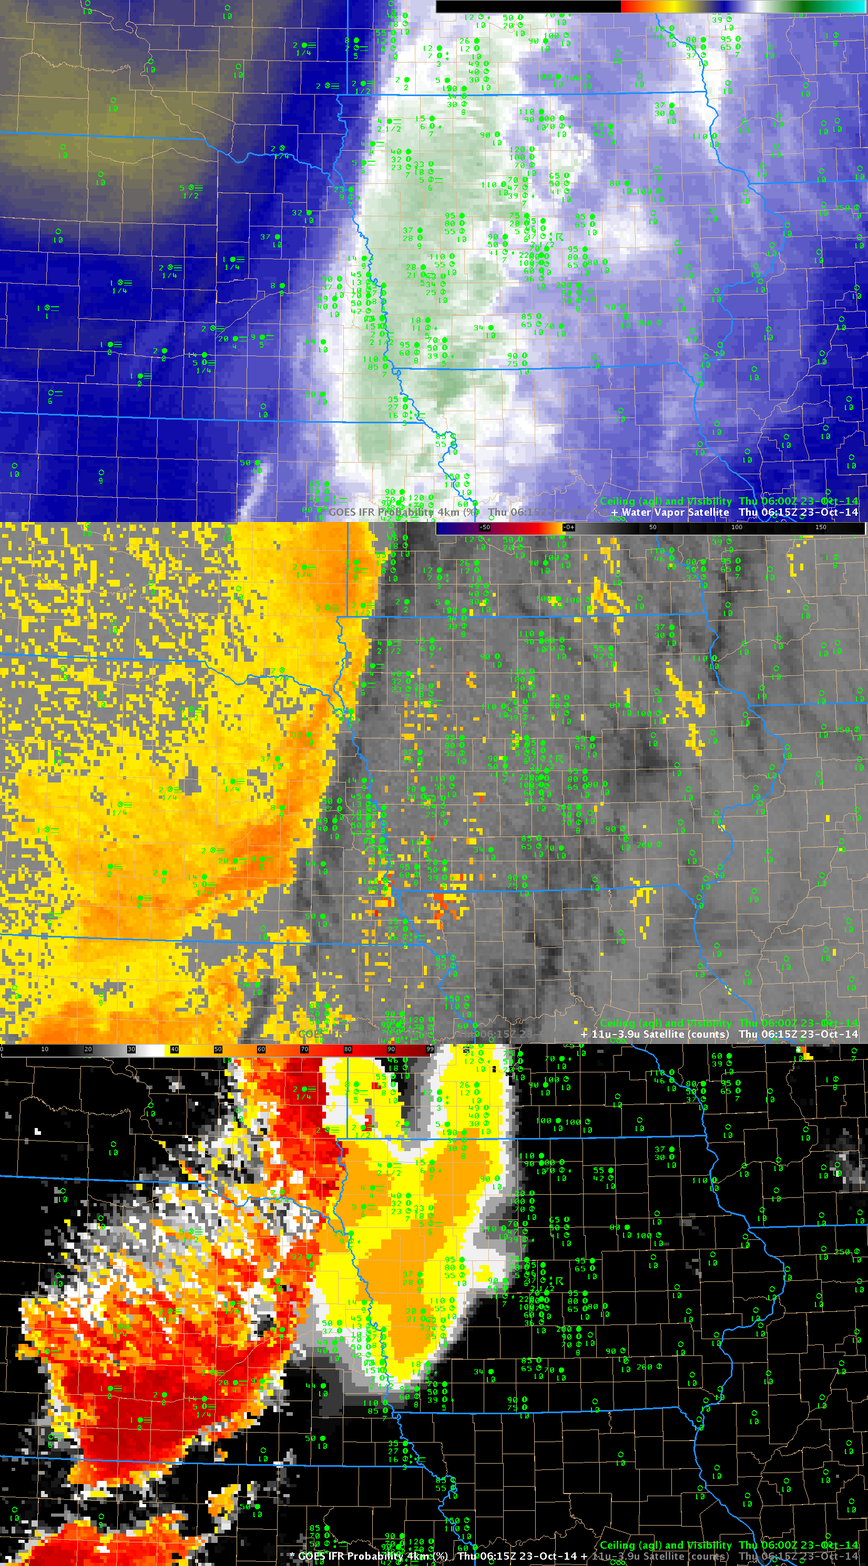
GOES-13 Water Vapor (6.5µm), Brightness Temperature Difference (10.7µm – 3.9µm) and GOES-based IFR Probabilities, all at 0615 UTC 23 October 2014, with surface observations of ceilings and visibilities (click to enlarge)

When a baroclinic system moves through a CWA, drops precipitation and then exits after sunset, the stage is often set for the development of radiation fog. The animation above cycles through the 0615 UTC imagery: GOES-13 Water Vapor (6.5 µm), GOES-13 Brightness Temperature Difference (10.7µm – 3.9µm) and GOES-based GOES-R IFR Probabilities. The upper-level reflection of a surface cold front moving through eastern Nebraska and western Iowa (link) is obvious in the (infrared) water vapor imagery, and also in the brightness temperature difference field.

The difficulty that arises with multiple cloud layers that invariably accompany these systems is that the mid- and high-level clouds do not allow for an accurate satellite-only-based depiction of low stratus and fog. GOES-R IFR Probabilities allow for that kind of depiction because near-surface saturation is considered in the computation of IFR Probabilities (using data from the Rapid Refresh Model). Thus, IFR Probabilities correctly suggest the presence of reduced visibilities over extreme northwestern Iowa and they alert a forecasters to the possibility of fog over much of western Iowa.
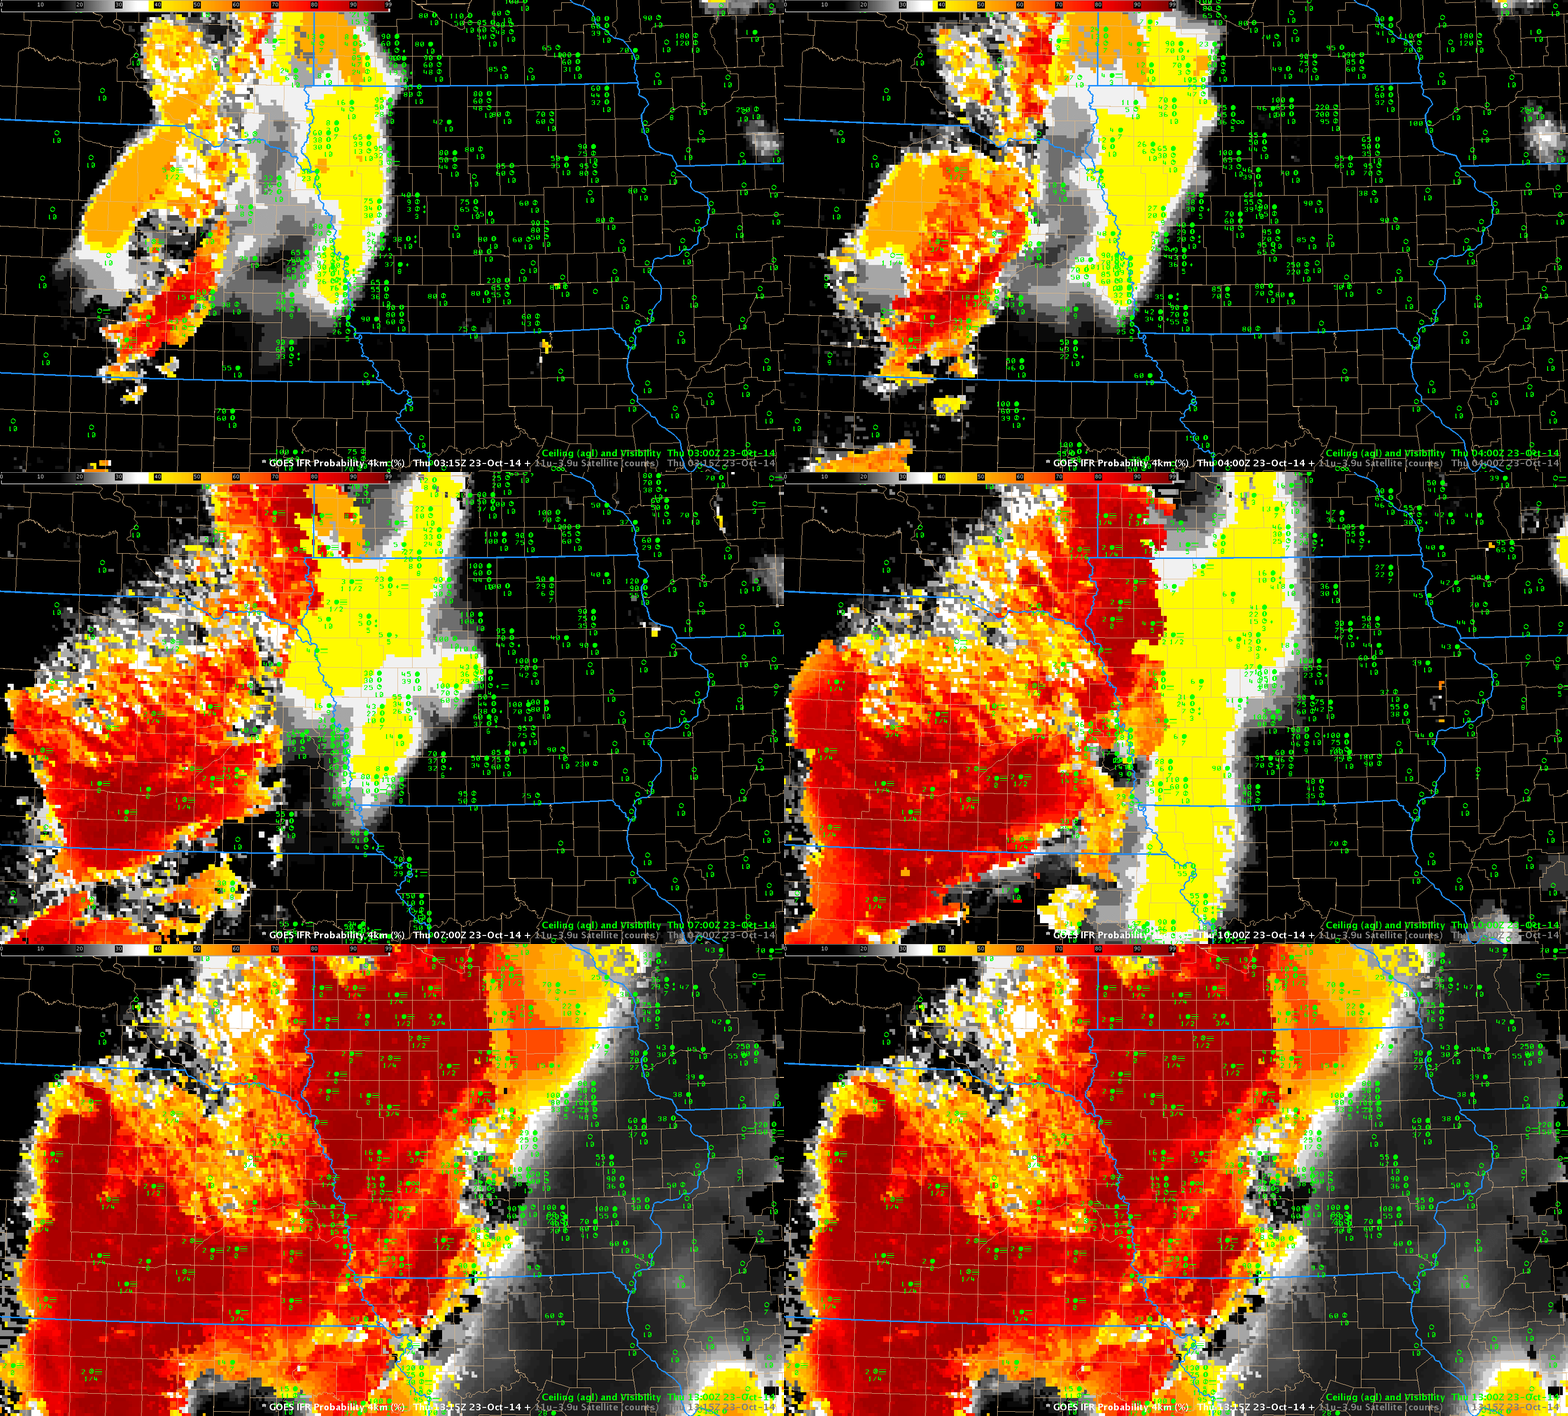
GOES_IFR_23Oct2014_03-13

GOES-based IFR Probabilities, 03-13 UTC 23 October 2014 (Click to enlarge)

The animation of GOES-R IFR Probability fields, above, shows the steady increase in probability that accompanied the reduction in ceilings and visibilities. The character of the IFR Probability fields is testimony to the data that are used to create them. The fairly flat fields over Iowa early in the animation mean that satellite data cannot be used as a predictor (because of the multiple cloud levels that are present there, as apparent in the animation below). Instead, the model fields (that are fairly flat compared to satellite pixels) are used and horizontal variability in the field is small. In addition, IFR Probability values themselves are somewhat smaller because fewer predictors can be used.

IFR Probabilities are more pixelated in nature over southern Nebraska where satellite-based predictors could be used. IFR conditions are widespread in that region where IFR Probabilities exceed 90%. Note how IFR probabilities are smaller over Kansas, in a region of mid-level stratus (but not fog). The brightness temperature difference field there maintains a strong signal. IFR probability fields do a superior job of distinguishing between mid-level stratus and low stratus/fog (compared to the brightness temperature difference field). This is because a mid-level stratus deck and a fog bank can look very similar from the top, but an accurate Rapid Refresh model simulation of that atmosphere will have starkly different humidity profiles.
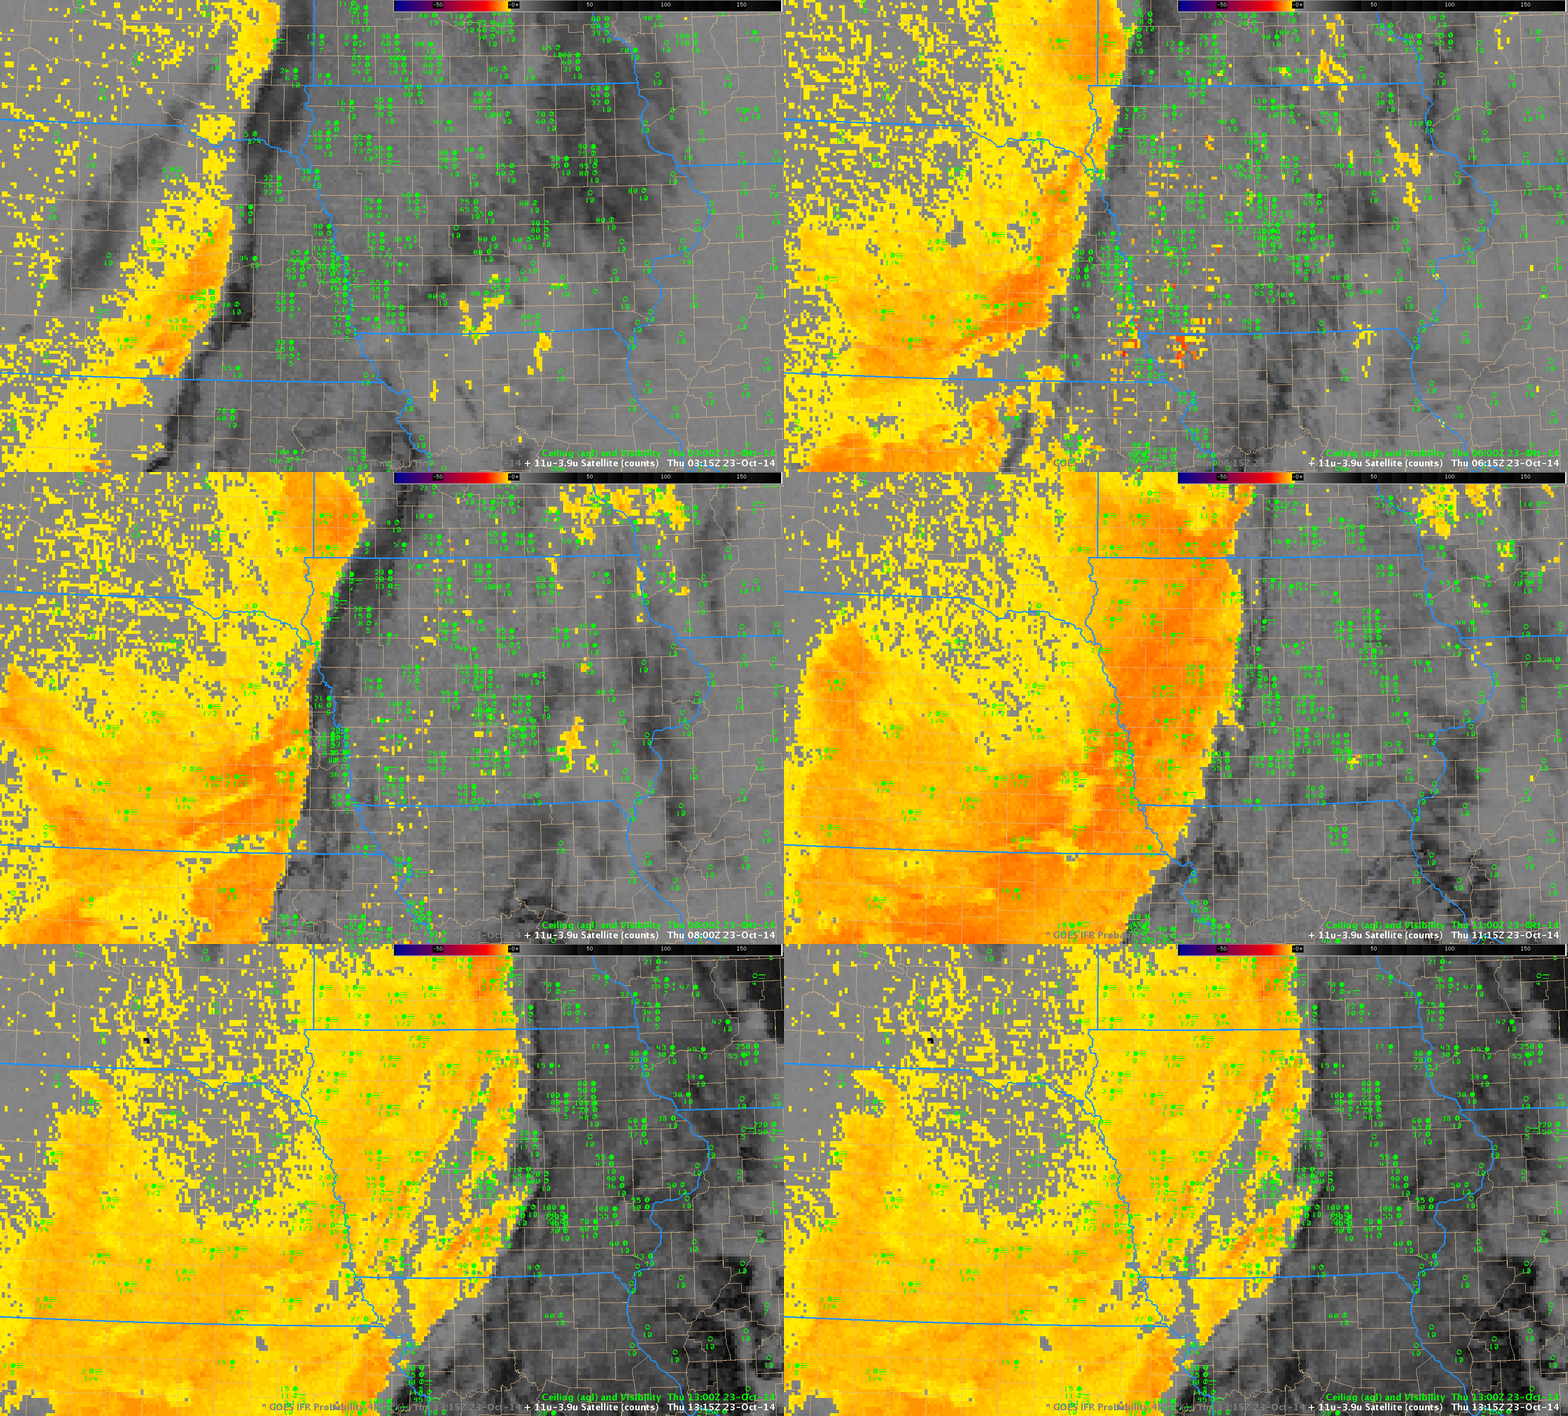
GOES_BTD_23Oct2014_03-13

GOES-13 Brightness Temperature Difference (10.7µm – 3.9µm) Fields hourly from 0300 through 1300 UTC 23 October, including surface observations of ceilings and visibilities (Click to enlarge)

At 1400 UTC (below), the rising sun (and its abundant 3.9 µm energy that can be easily scattered off clouds) causes the sign of the brightness temperature difference field to flip. (Compre the 1400 UTC Brightness Temperature Difference Field below to the final Brightness Temperature Difference field (1300 UTC) in the animation above!) However, the IFR Probability field maintains its character through sunrise.
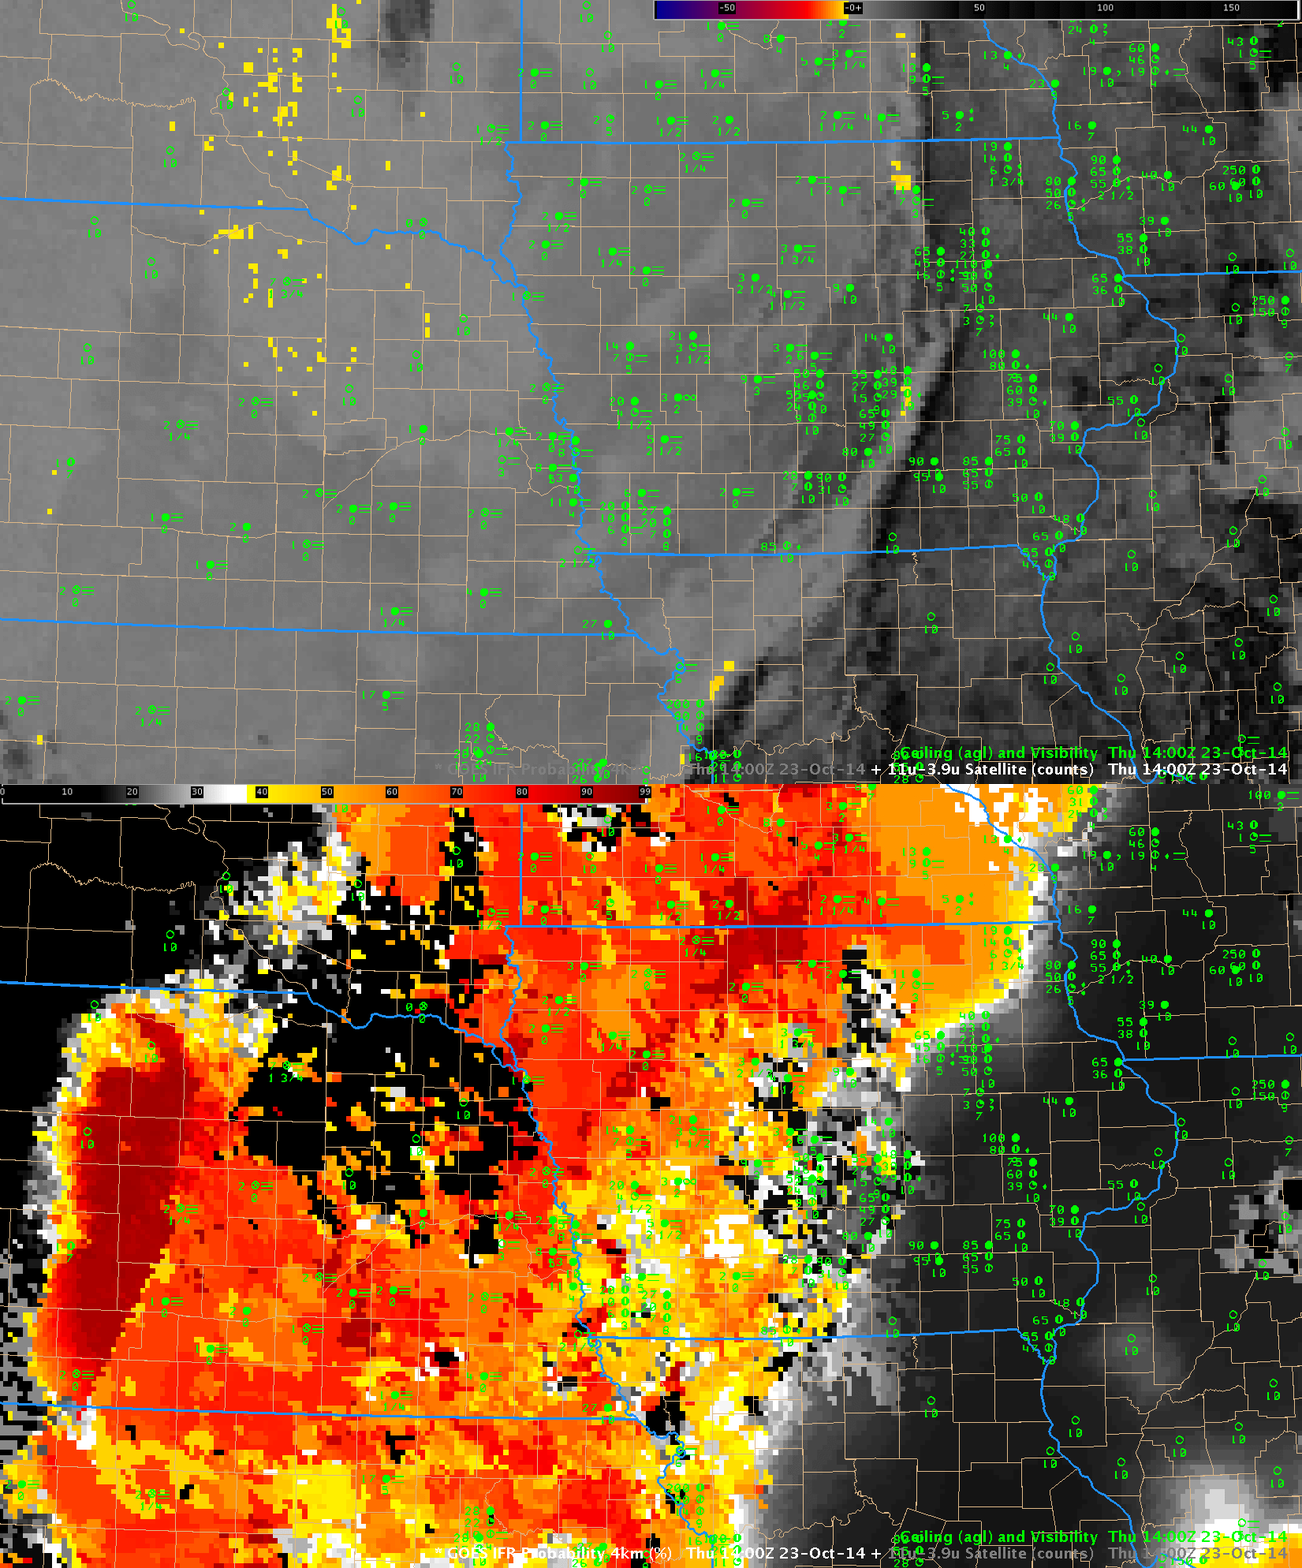
GOES_BTD_IFR_23Oct2014_14z

GOES-13 Brightness Temperature Difference (10.7µm – 3.9µm) and GOES-based IFR Probabilities, all at 1400 UTC 23 October 2014, with surface observations of ceilings and visibilities (click to enlarge)

The NSSL WRF accurately suggested that fog/low stratus was possible. The brightness temperature difference field from the model run, below, at 0900 UTC, shows a strong signal of low water-based clouds over western Iowa and Nebraska. (This link shows the latest model run (initialized at 0000 UTC) of Brightness Temperature Difference fields, with output from 0900 through 1200 UTC of the following day)
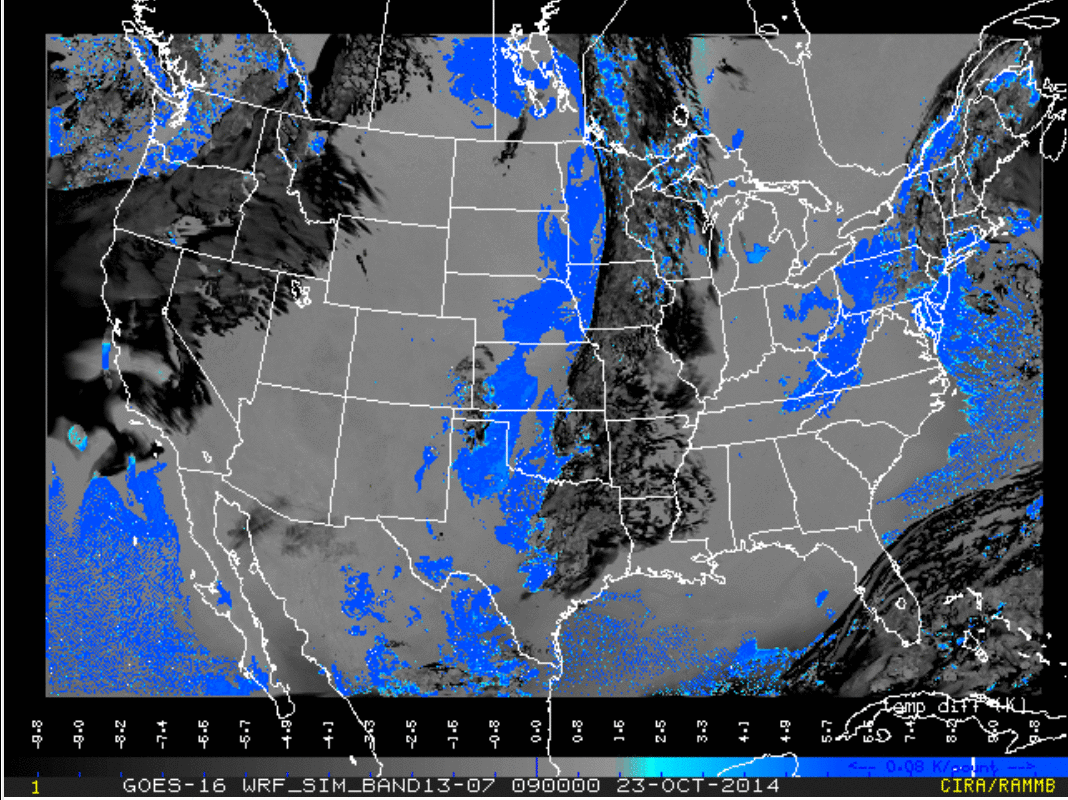
NSSL_WRF_BTD_0900_23Oct2014

Simulated Brightness Temperature Difference fields, 0900 UTC 23 October 2014, from the 0000 UTC NSSL WRF Model Run (Click to enlarge)

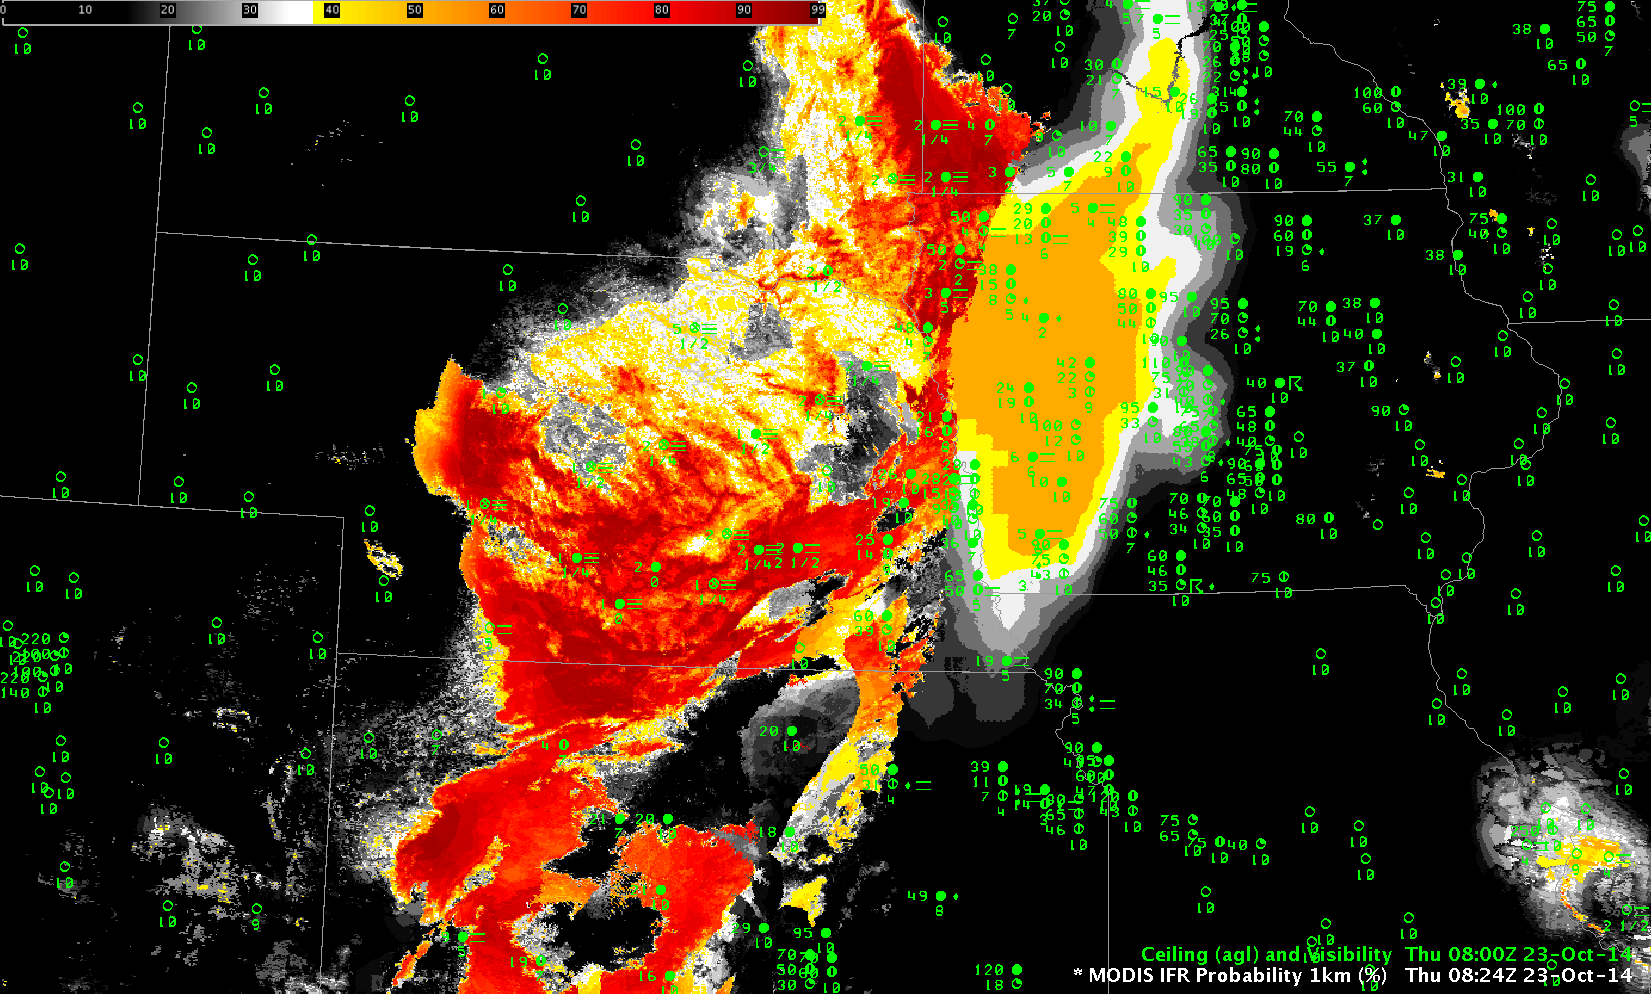
MODIS-based IFR Probability Fields were also available for this event, at 0824 UTC, below. As with the GOES, there is a noticeable (very!) difference between regions where Satellite Predictors are being used in the computation of IFR Probabilities (Nebraska) and regions where Satellite Predictors are not being used in the computation of IFR Probabilities (Iowa). The superior resolution of the MODIS data also suggests that River Valleys in eastern Nebraska are more likely foggy than adjacent land. The Elkhorn River between Norfolk and O’Neill, for example, shows up in the MODIS-based IFR Probability field as a thread of higher IFR Probability.
MODIS_IFR_23Oct2014_0824

MODIS-based IFR Probability at 0824 UTC, 23 October 2014 (Click to enlarge)
GOES-R IFR Probabilities refine the Brightness Temperature Difference Signal

GOES_BTD_IFR_23Oct2014_1100

Toggle of GOES Brightness Temperature Difference (10.7µm – 3.9µm) and GOES-R IFR Probabilities computed from GOES data, 1100 UTC 23 October 2013, with surface observations of ceilings and visibilities (Click to enlarge)
The toggle above, of Brightness Temperature Difference and GOES-R IFR Probabilities, shows how the traditional method of fog/low stratus detection — brightness temperature difference fields — can overpredict where fog and low stratus are actually observed. There are two main reasons for this: First, in regions of dry soil (over the Desert Southwest, for example), emissivity differences in soil can trigger a large difference in satellite-perceived brightness temperature at 10.7µm and 3.9µm that leads to a fog-like signal; second, in regions of water-based clouds, the signal is for the cloud top only. The satellite signal gives little information about the thickness of the cloud or of the cloud base. In the example above, mid-level stratus over central Kansas southward through central Oklahoma into central Texas yield a brightness temperature difference signal similar to regions of low clouds over the northern Texas panhandle. Compare the observations at Dalhart TX (KDHT) and Alva, OK (KAVK), for example.

The fused product (GOES-R IFR Probabilities) yields a statistically superior picture of the region of low stratus and fog because of the use of Rapid Refresh Data. These model data include the effects of surface-based observations and can therefore screen regions where low clouds are not actually present. GOES-R IFR Probabilities therefore give a better estimate of exactly where the low clouds present a hazard to — for example — aviation.