Category Archives: Pacific Northwest

Fog over Western Oregon

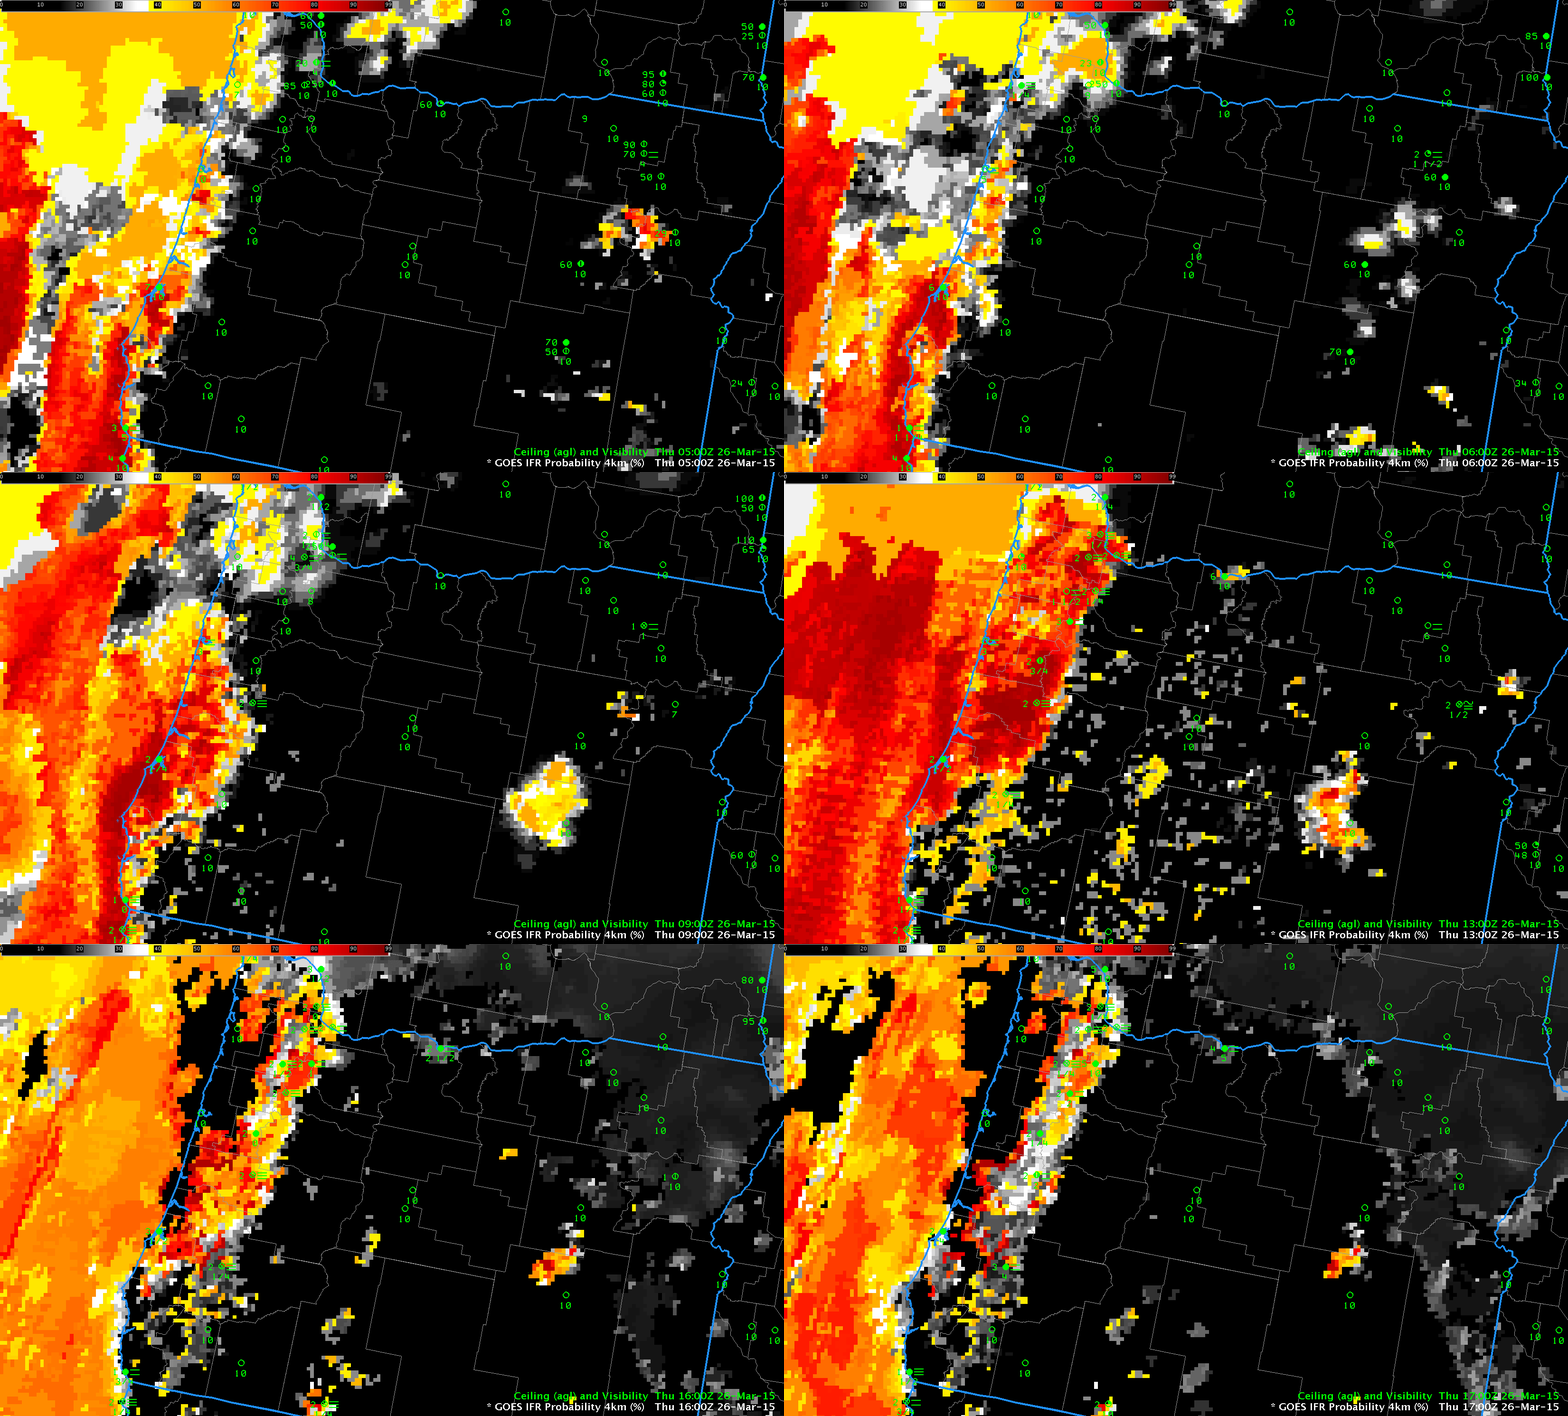
GOES_IFR_26March2015_05to17z

GOES-R IFR Probabilities computed from GOES-15, hourly from 0500 through 1700 UTC, 26 March 2015 (Click to enlarge)

GOES-R IFR Probabilities during the morning of 26 March 2015 expanded eastward from the Pacific Ocean as fog and IFR conditions developed over the western quarter of Oregon. At sunrise, IFR Probabilities dropped along the coast in Northwest Oregon, and IFR conditions were not reported at either Tillamook or Newport, but IFR Probabilities remained high in the Willamette and Umpqua River Valleys, where IFR conditions persisted.

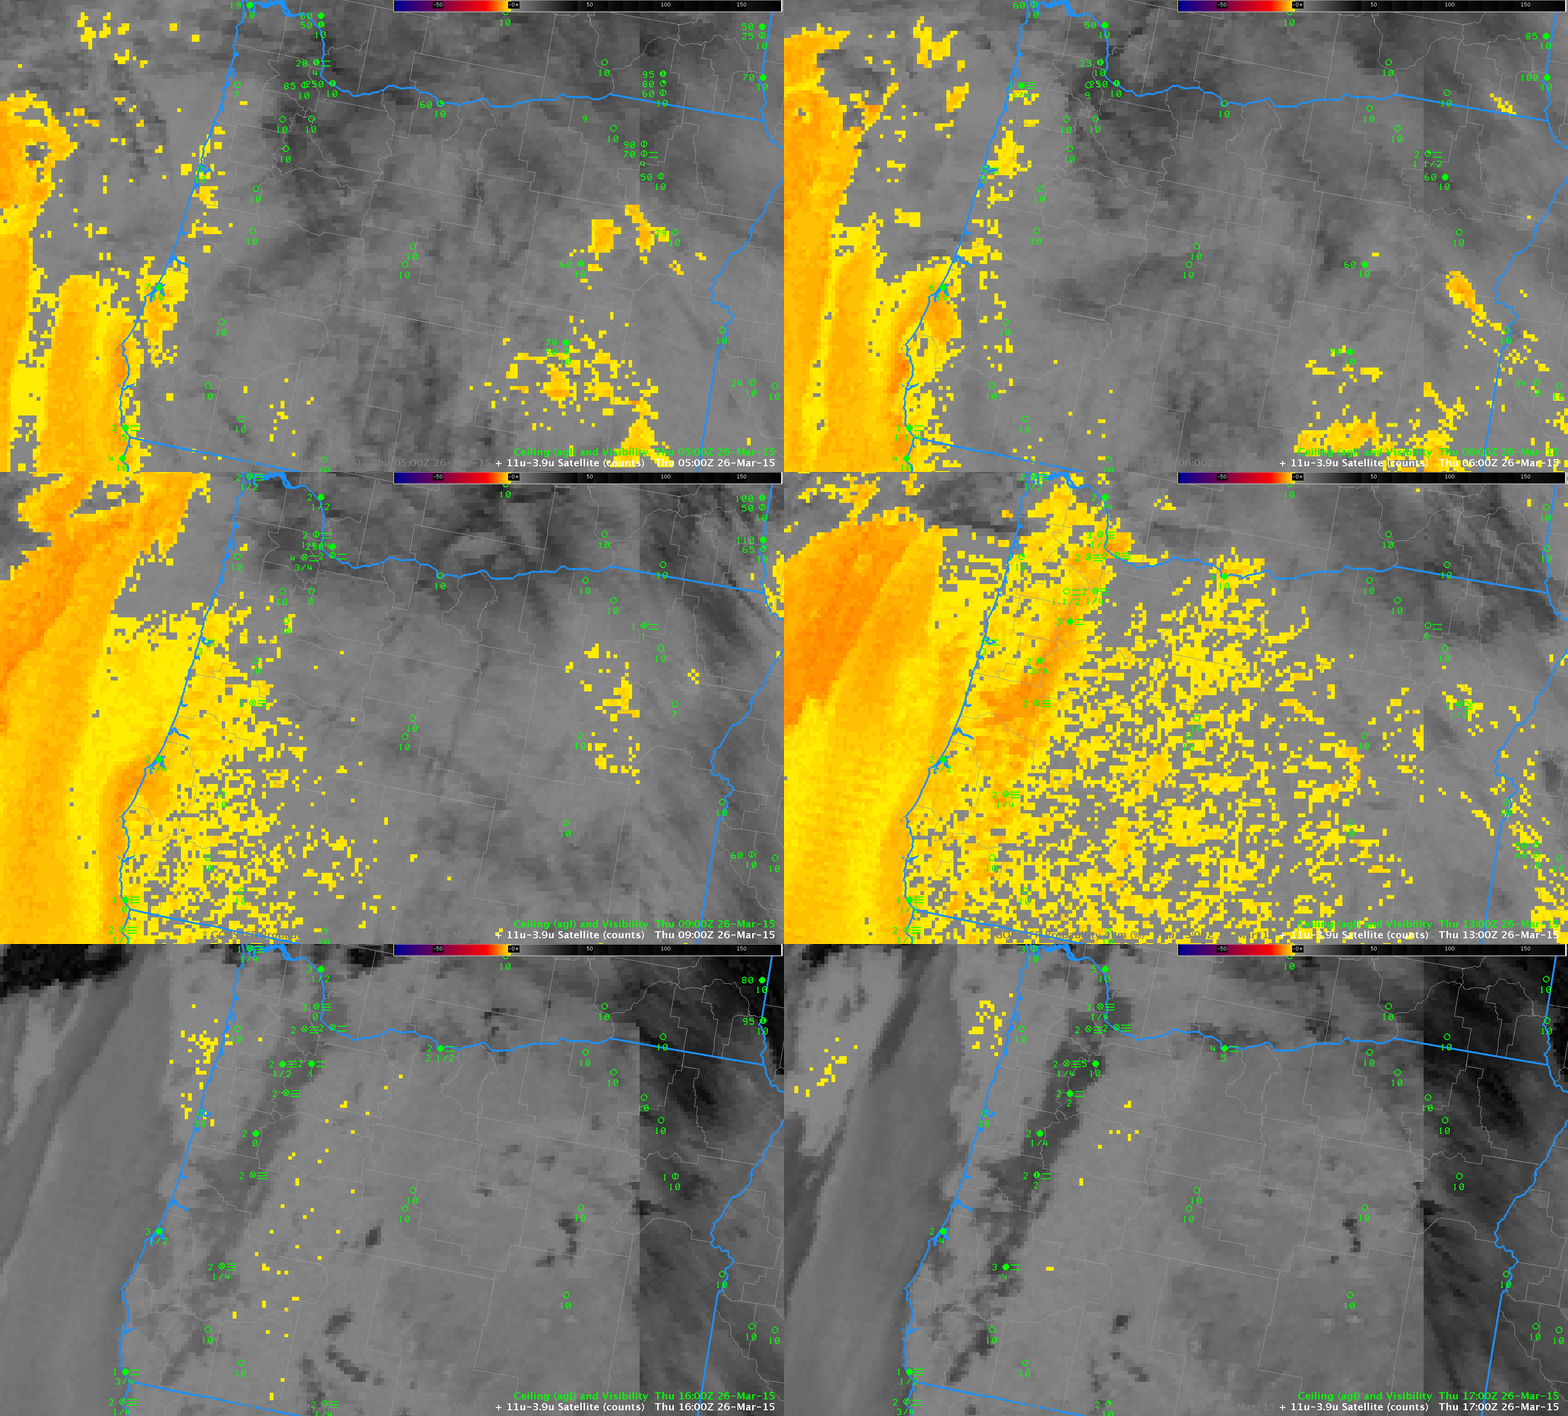
The Brightness Temperature Difference Product, below, for the same time shows a signal in regions where fog/IFR conditions were not reported. The use of model data (Rapid Refresh) in the GOES-R IFR Probability algorithm helps screen out regions where low-level saturation is not occurring — either because the clouds detected by the brightness temperature difference are mid-level, or because the brightness temperature difference field is driven by soil-based emissivity differences at 3.9µm and 10.7µm and not cloudiness at all. The brightness temperature difference signal vanishes near sunrise as solar 3.9µm radiation starts to be reflected off clouds; the sign flips after sunrise and the low clouds appear dark.

GOES_BTD_26March2015_05to17z

GOES-15 Brightness Temperature Difference (10.7µm – 3.9µm), hourly from 0500 through 1700 UTC, 26 March 2015 (Click to enlarge)

Both IFR Probabilities and Brightness Temperature Difference fields largely miss the isolated IFR conditions over northeast Oregon, around Baker and Meacham.

Successive Suomi NPP Scans Show Stratus/Fog movement

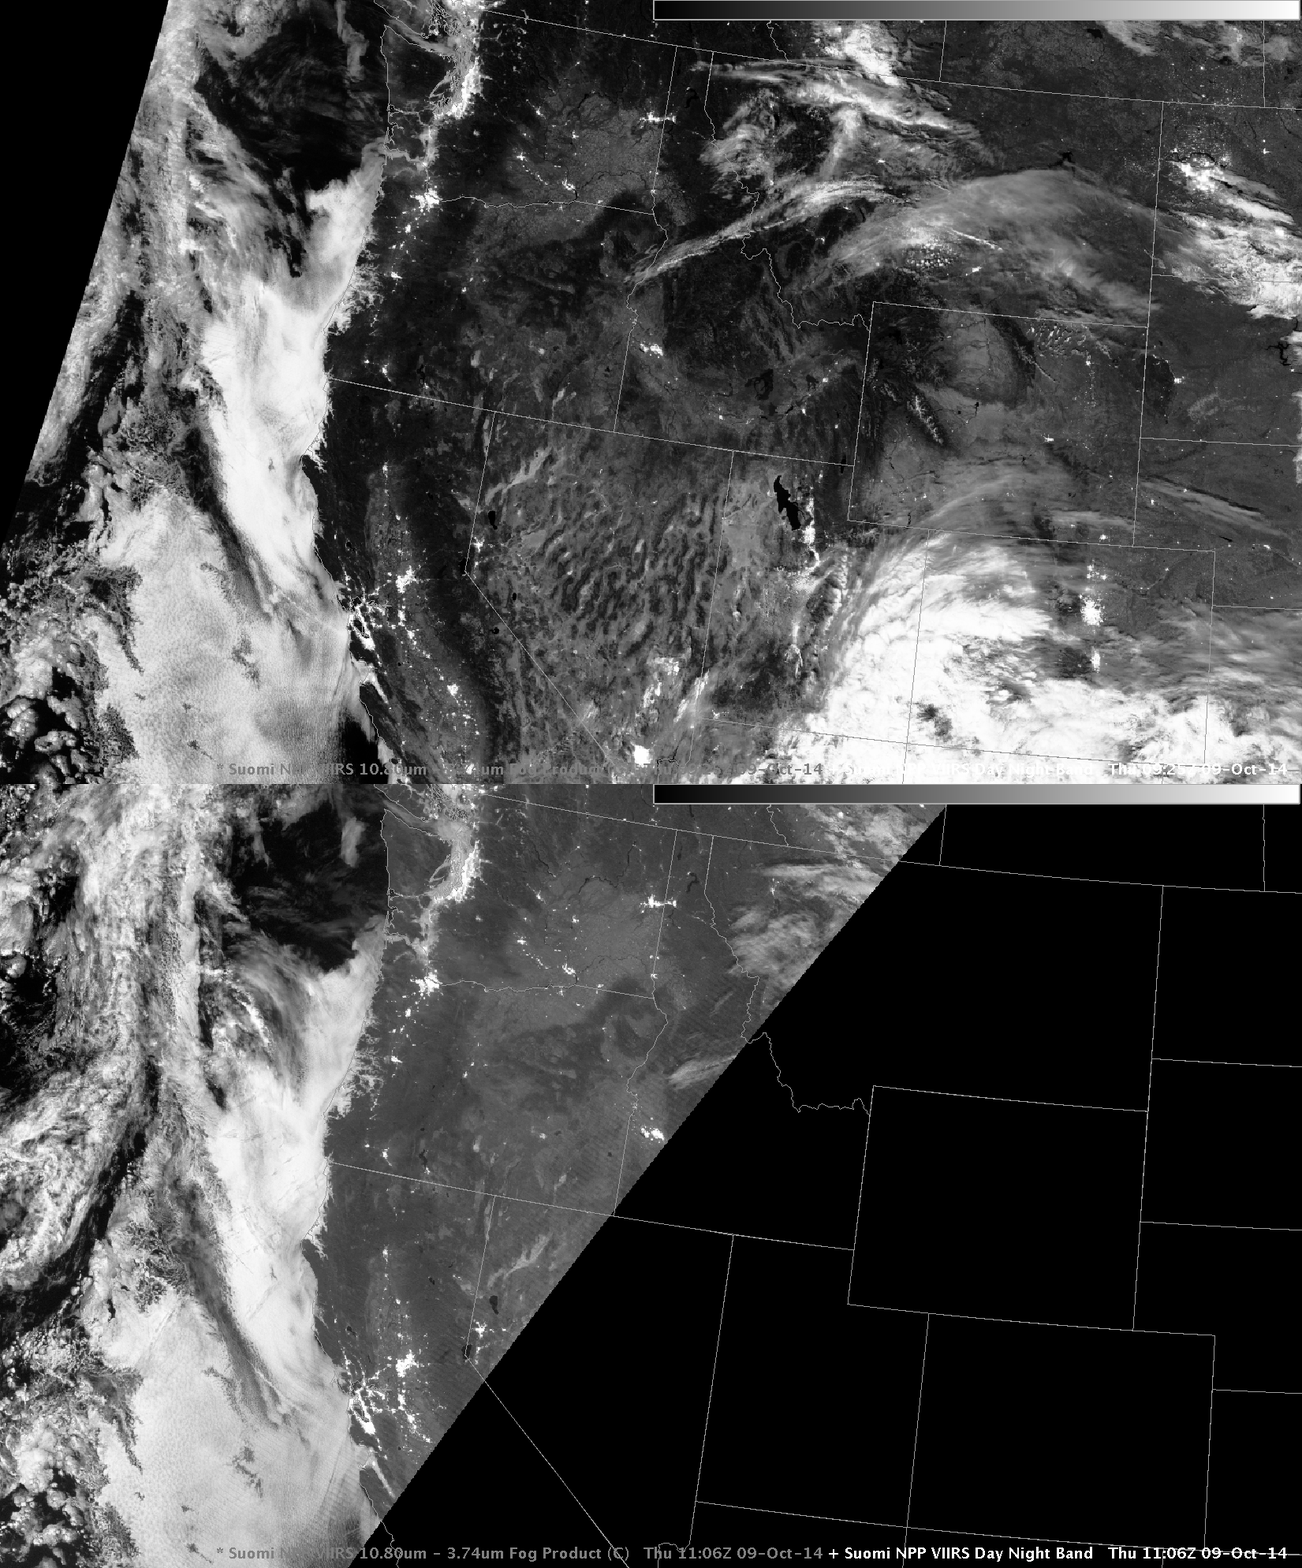
SNPP_DNB_0926-1106_09Oct2014

Suomi NPP Day/Night Band at 0926 and 1106 UTC on 9 October 2014 (Click to enlarge)

(A Blog post on Suomi NPP Imagery over the western US from 10 October is available here).

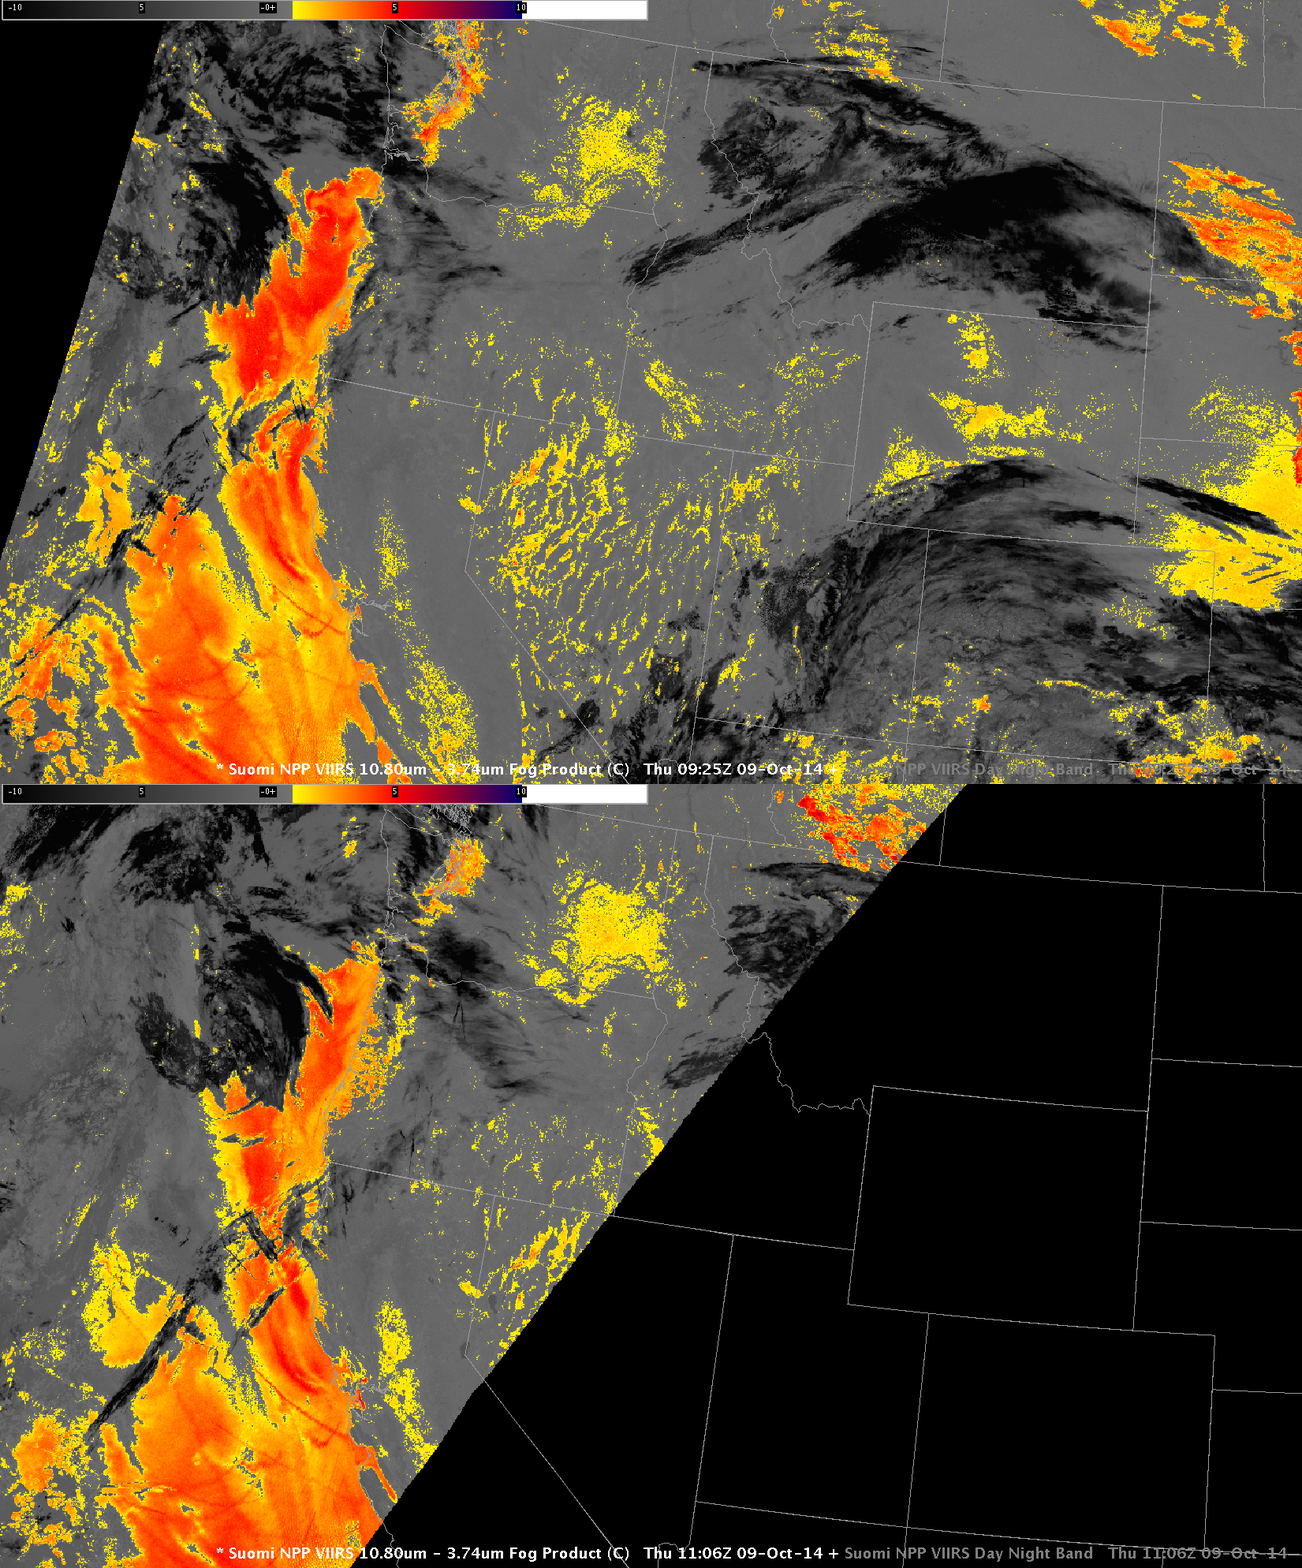
Polar orbiters typically don’t give good temporal resolution, especially near the Equator. In mid-latitudes, however, Polar Geometry can yield views over a wide area on two successive scans. This happened along the West Coast early in the morning on 9 October. Two regions show noticeable changes in stratus between the two times: stratus/fog extends farther down the Salinas Valley at the southern edge of image, and stratus/fog expands over southwestern Puget Sound in Washington. The Brightness Temperature Difference field (11.35µm – 3.74µm) from Suomi NPP for the same times shows a similar evolution over the Salinas Valley, but the view of Washington is obscured by thin cirrus. These cirrus (that show up as black enhancements below) are mostly transparent in the Day Night Band but not in the infrared bands.

SNPP_BTD_0926-1106_09Oct2014

Suomi NPP Brightness Temperature Difference (11.35µm – 3.74µm) at 0926 and 1106 UTC on 9 October 2014 (Click to enlarge)

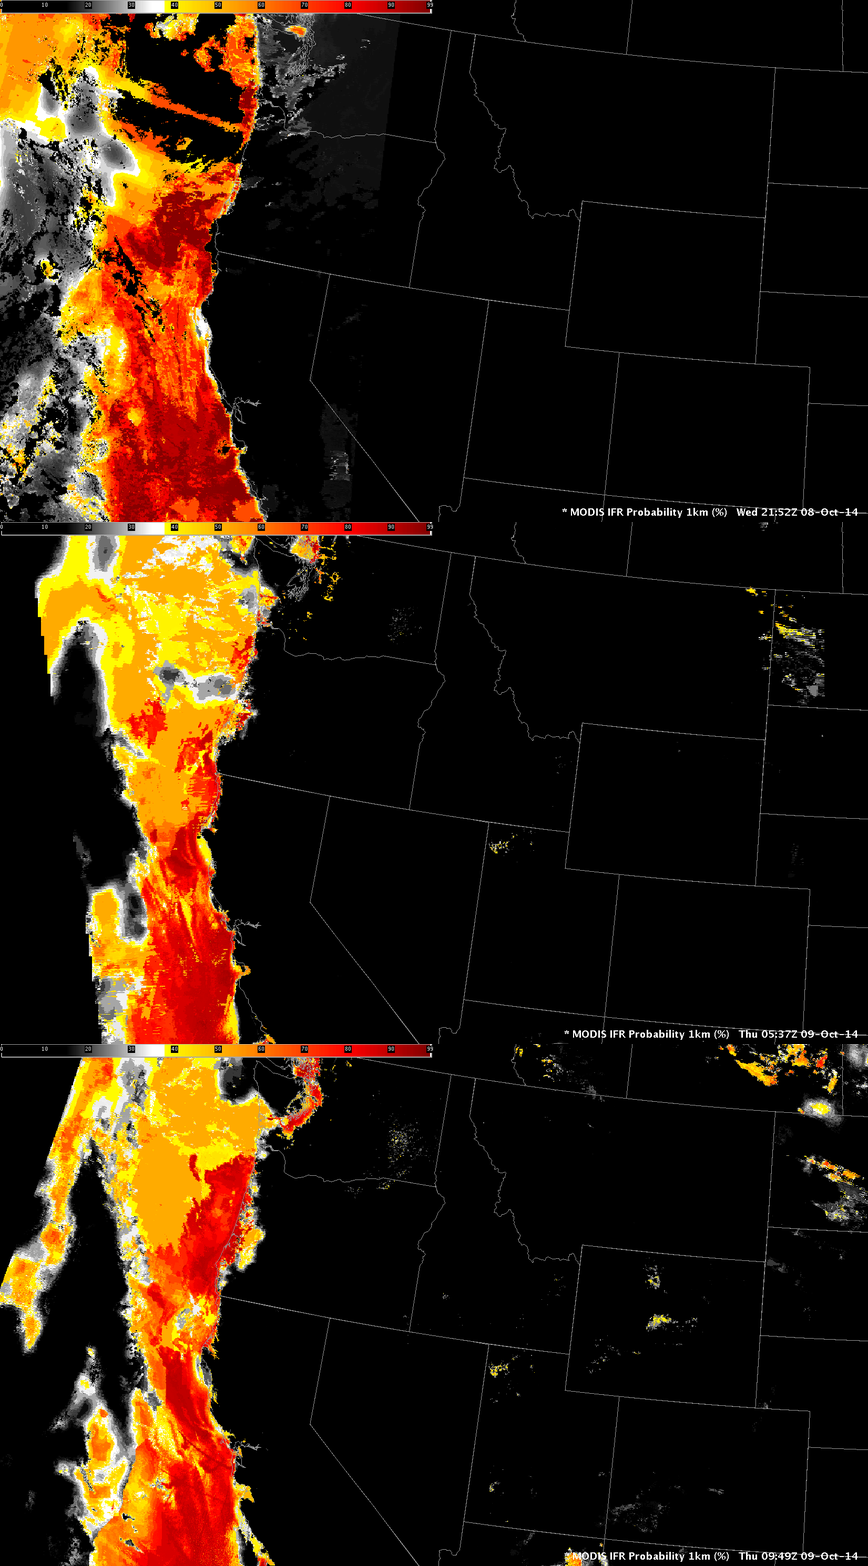
MODIS instruments onboard Terra and Aqua yield spectral data that can be used to generate GOES-R IFR Probability Fields. The animation below shows high-resolution imagery of where IFR Probabilities are highest, but only at three distinct times: 2152 UTC on 8 October and 0537 and 0949 UTC on 9 October. An increase in IFR Probabilities around Monterey Bay is apparent (and consistent with the Suomi NPP Observations above); IFR Probabilities also increase along the Oregon Coast and around Puget Sound.

MODIS_IFR_2152-0949UTC_09Oct2014

MODIS-based GOES-R IFR Probabilities at 2152 UTC 8 October, 0547 UTC 9 October and 0949 UTC 9 October (Click to enlarge)

How do GOES-based observations complement the Polar Orbiter data above?

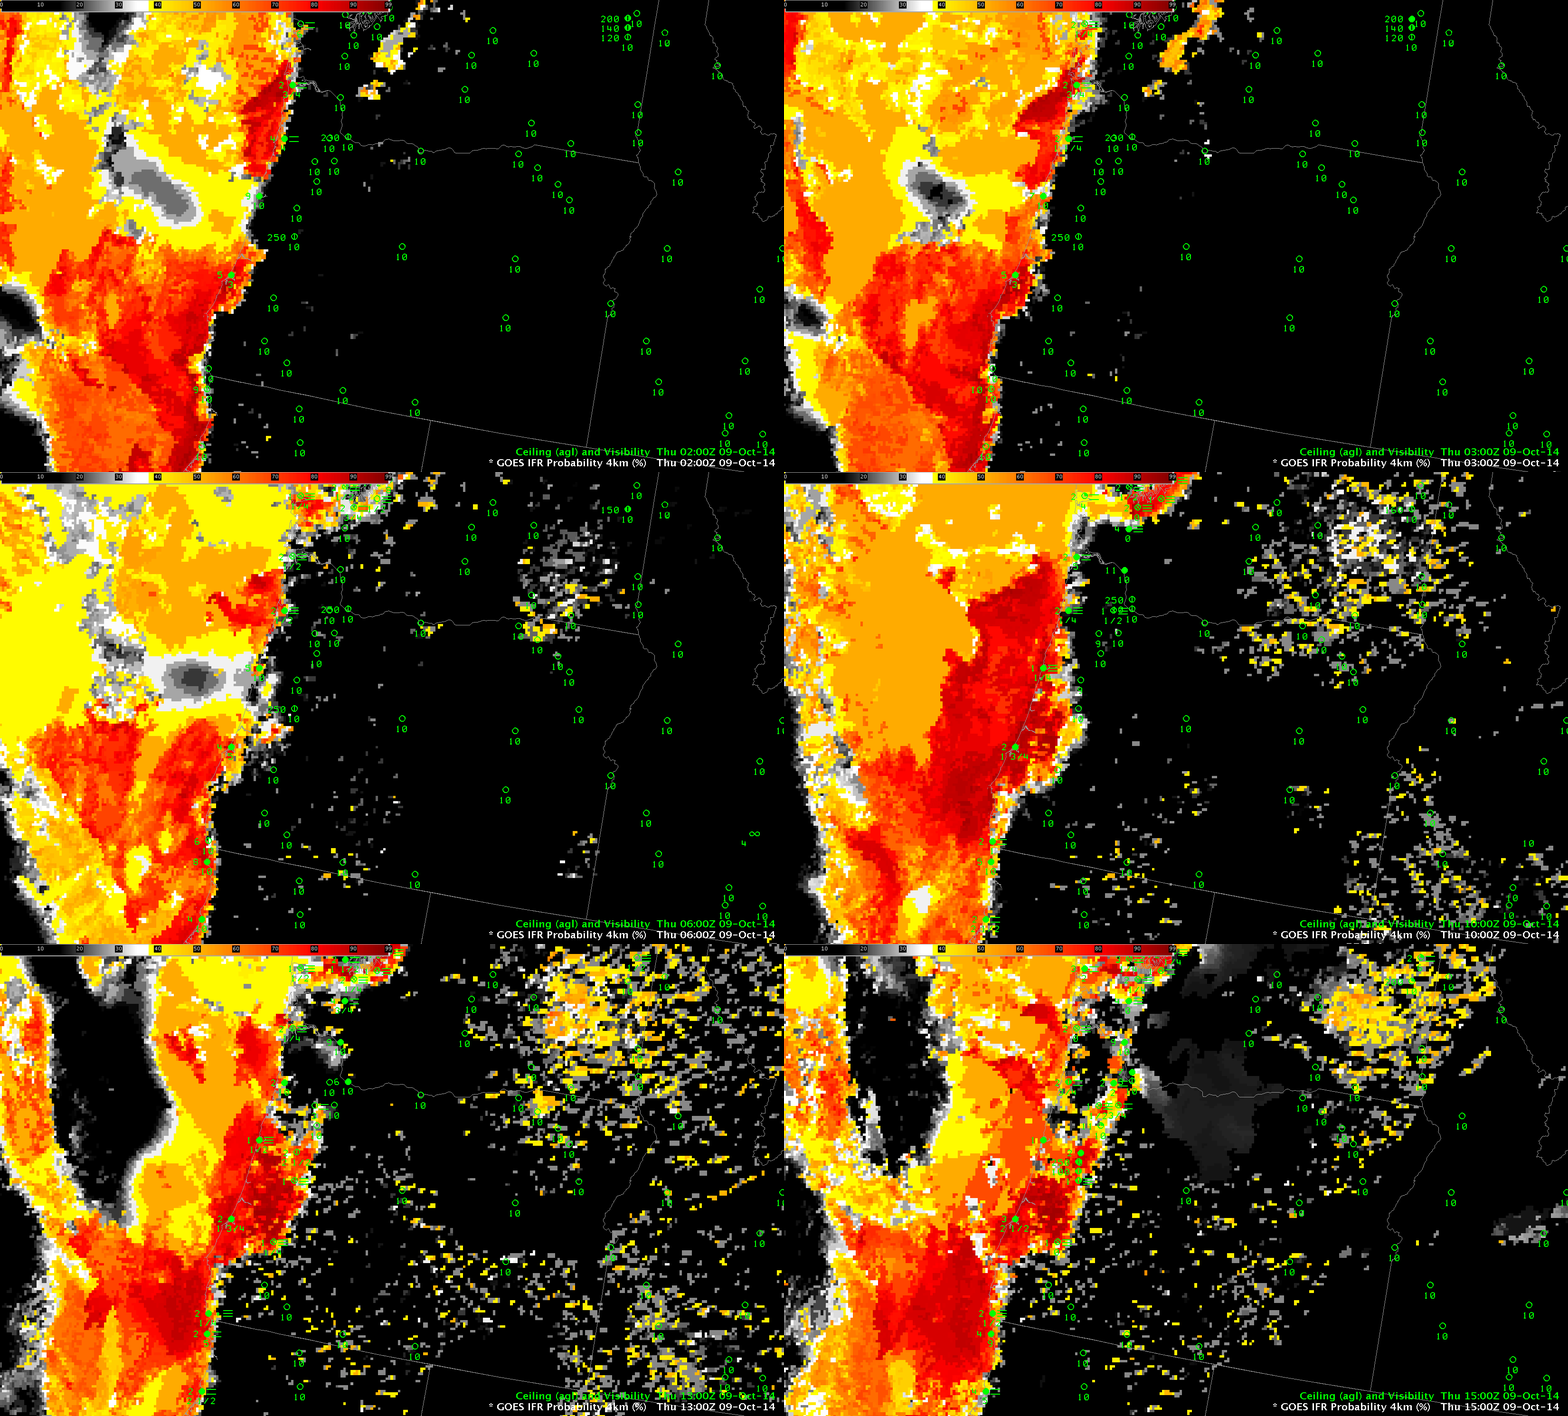
GOES_IFR_09Oct2014_02-14

GOES-15 based GOES-R IFR Probabilities, hourly from 0200 through 1400 UTC, 9 October 2014 (Click to enlarge)

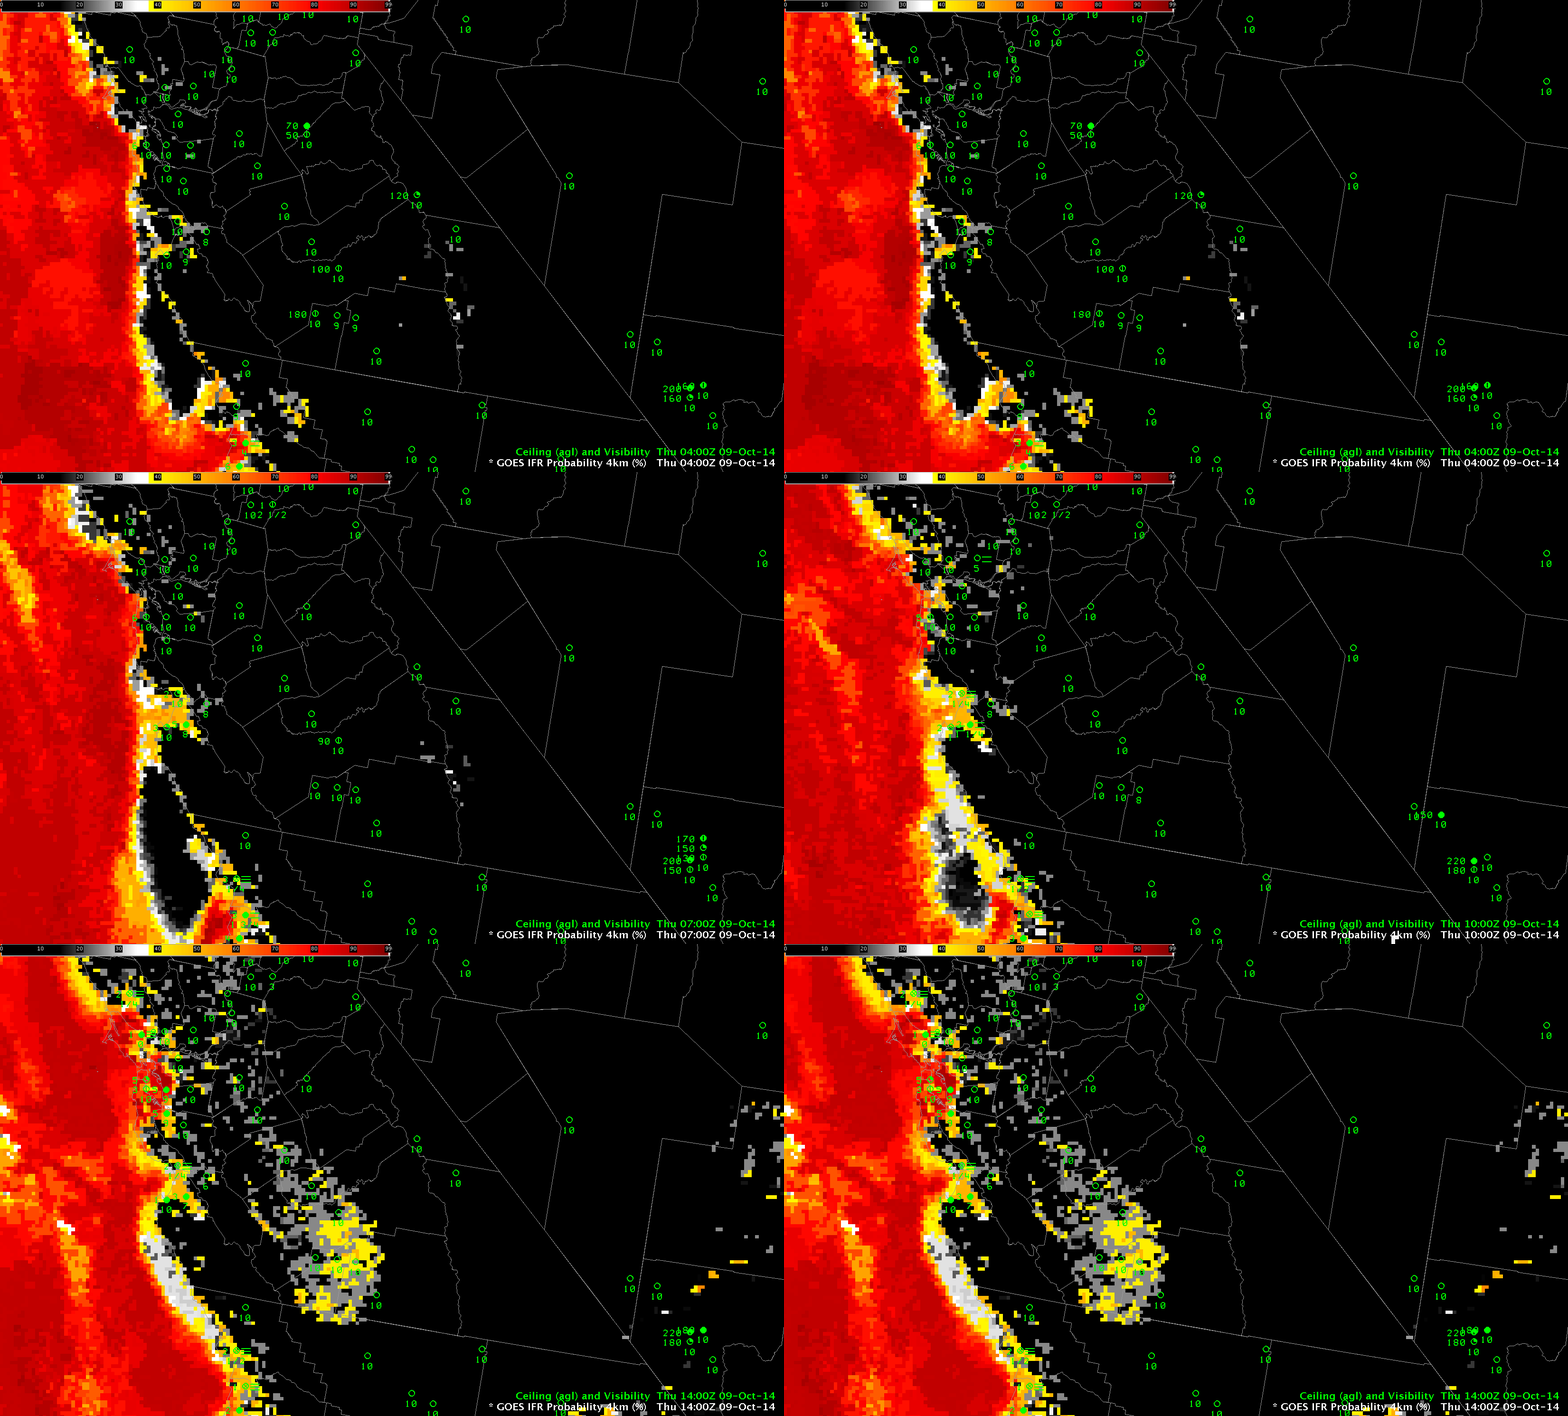
The hourly animation above shows the slow increase of IFR Probability in/around Monterey Bay, and also a push of higher IFR Probability onto the Oregon Coast that occurs after the last MODIS-based IFR Image shown farther up. (Higher IFR Probabilities also spill into San Francisco Bay). Do surface observations of ceilings and visibilities agree with the IFR Probability fields? The loops below, from Oregon (below) and Monterey Bay (bottom) suggest that they do. For example, Eugene OR (and stations north and south of Eugene) show IFR conditions as the high IFR Probability field moves in after 1100 UTC. GOES-based data is valuable in monitoring the motion of IFR Probability fields; keep in mind, though, that small-scale features may be lost. For example, it is difficult for GOES to resolve the Salinas Valley.

OREGON_GOES_IFR_02-15UTC_09Oct2014

GOES-15 based GOES-R IFR Probabilities, hourly from 0200 through 1500 UTC, 9 October 2014, with surface and ceiling observations superimposed (Click to enlarge)

CALI_IFR_0400-1400_09Oct2014

GOES-15 based GOES-R IFR Probabilities from 0400 through 1400 UTC, 9 October 2014, with surface and ceiling observations superimposed (Click to enlarge)

MODIS and GOES IFR Probabilities in the Pacific Northwest

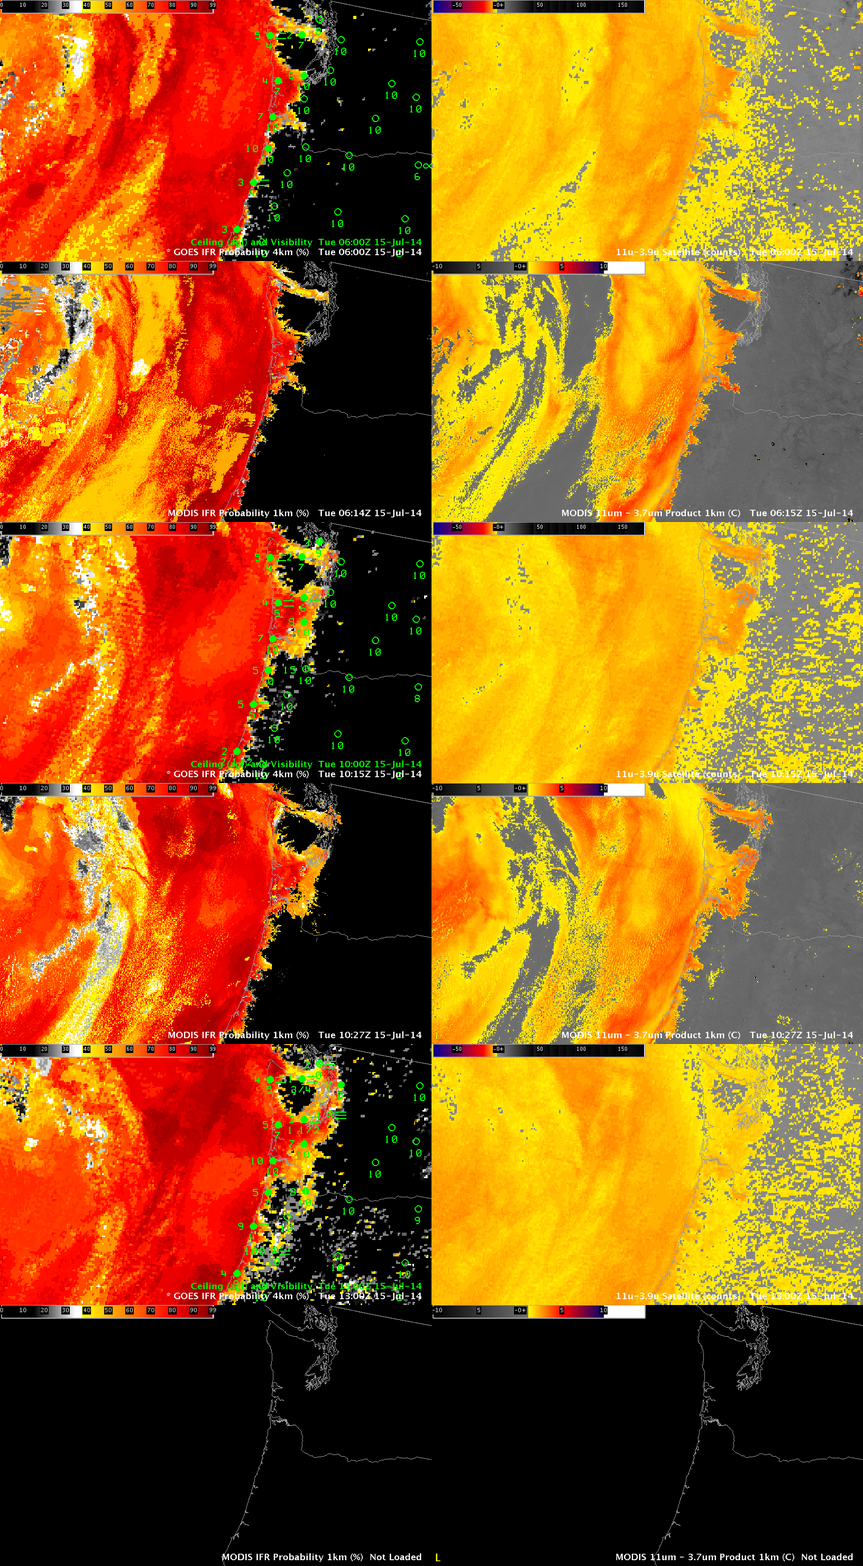
PacNW_15Julyloop

IFR Probabilities (Left) from GOES-15 Imager (Upper Left) and MODIS (Lower Left), Brightness Temperature Difference (11 µm – 3.9 µm) (Right) from GOES-15 Imager (Upper Right) and MODIS (Lower Right). Terra data used at 0614 UTC, Aqua data used at 1027 UTC. All times as indicated. (Click to enlarge)

The Pacific Northwest is far from the sub-satellite point of GOES-West. Pixel size there is therefore greater than the nominal 4-km size at the sub-satellite point: Pixel size is more like 8 kilometers in the north-south by 5 kilometers in the east-west. The animation above shows GOES- and MODIS-based IFR Probabilities and Brightness Temperature Difference Products.

Both GOES and MODIS IFR Probabilities show an expansion (as observed) of reduced ceilings and visibilities as marine stratus penetrates inland over coastal Washington and Oregon. The visibility at Seattle drops as the high probabilities overspread the region. MODIS resolution is better able to depict the fingers of fog/stratus that penetrate up river valleys along the coast. GOES Temporal resolution, however, means that frequent updates are available. (Note the lack of MODIS data at 1300 UTC).

The brightness temperature difference fields from GOES and MODIS are different. The GOES field has a considerable false signal (as far as fog is concerned) related to changes in surface emissivity that occur in the arid intermountain west during summer. MODIS fields show less of this false signal because of differences in the spectral width of the channels.

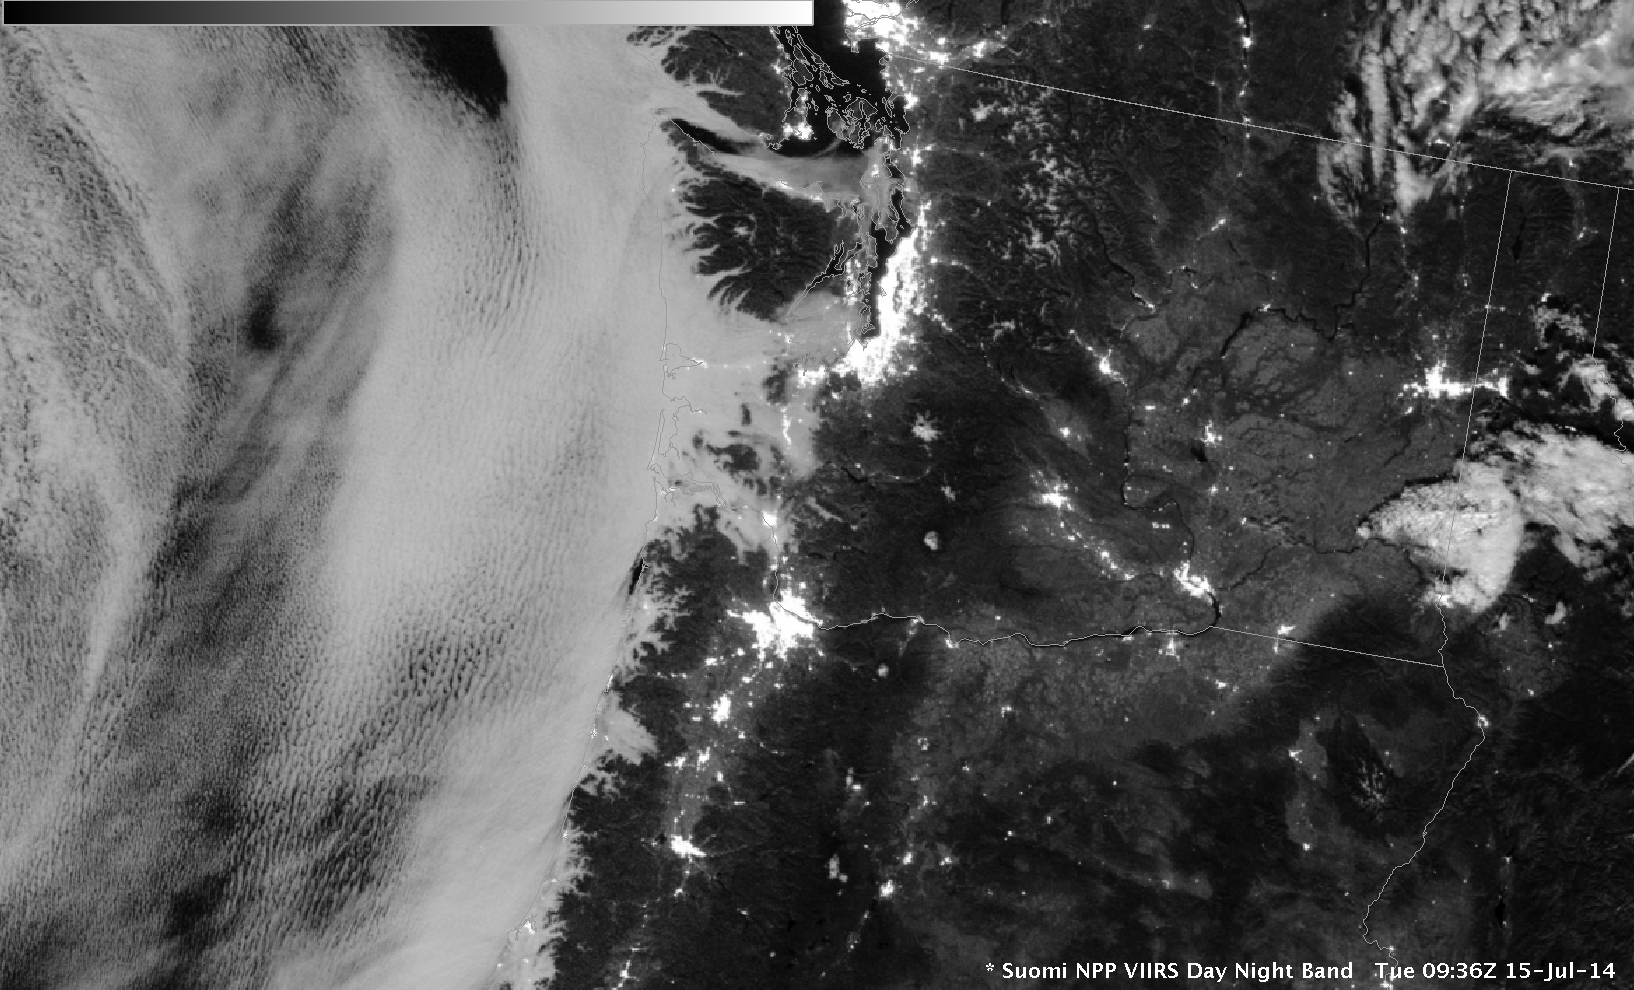
The Day/Night band on Suomi NPP, below, also shows the extent of stratus over coastal Oregon and Washington. This visible image uses reflected lunar light for illumination.

SNPP_DNB_0936UTC_15July2104

Suomi NPP VIIRS Day Night Band, 0936 UTC, 15 July 2014

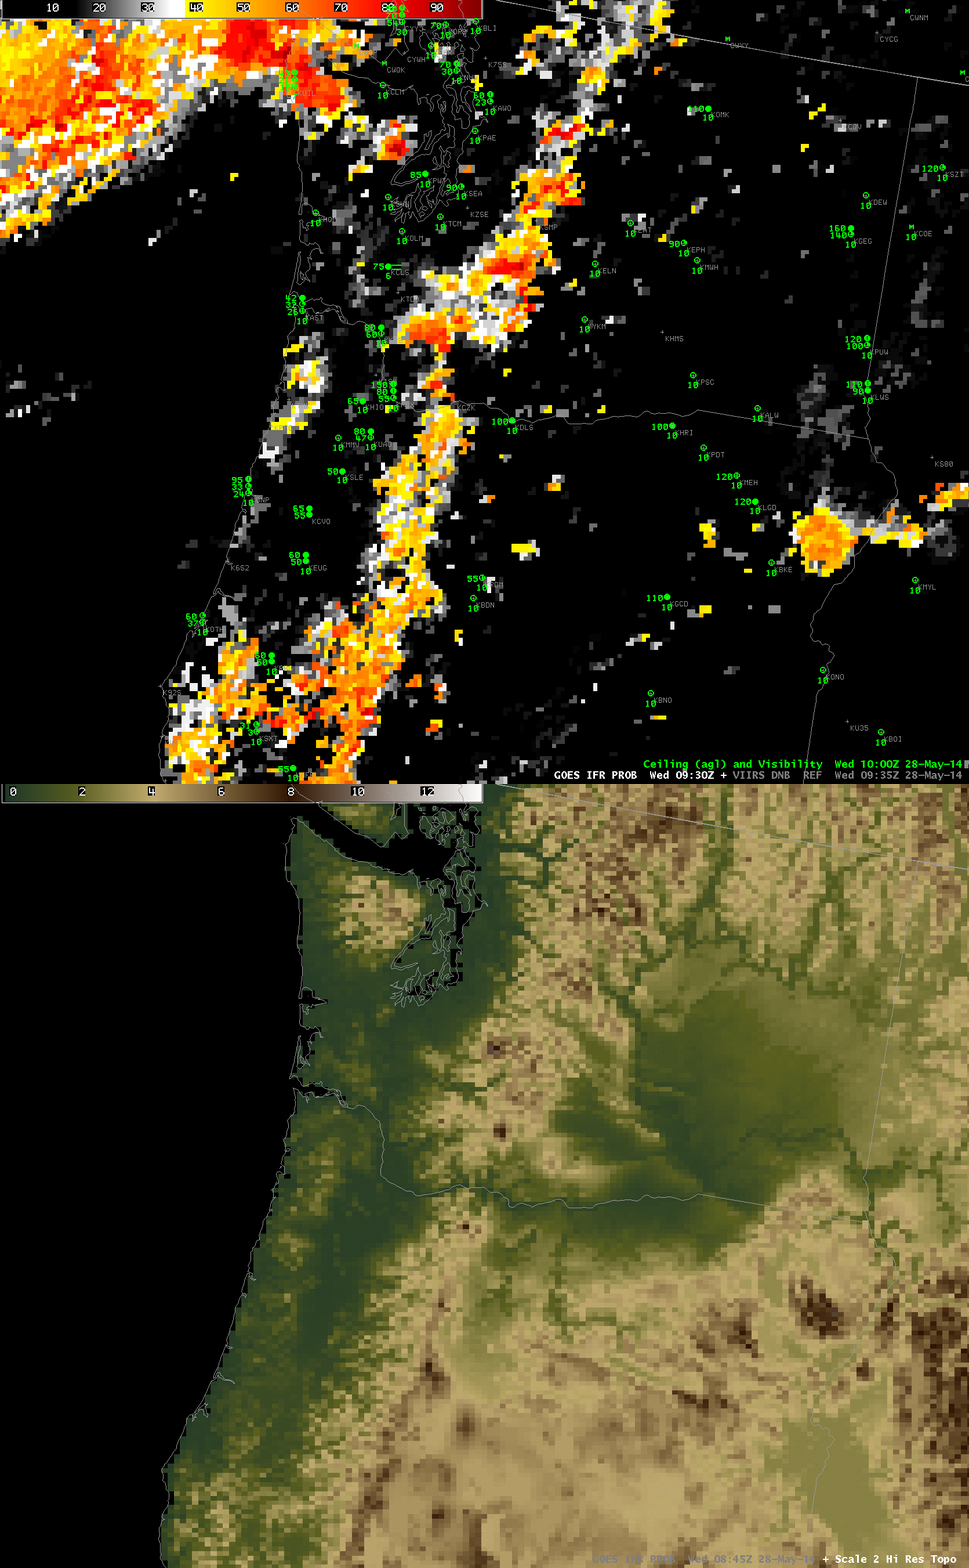
Terrain and IFR Probabilities

GOES_IFR_PROB_20140528_0930_terrain

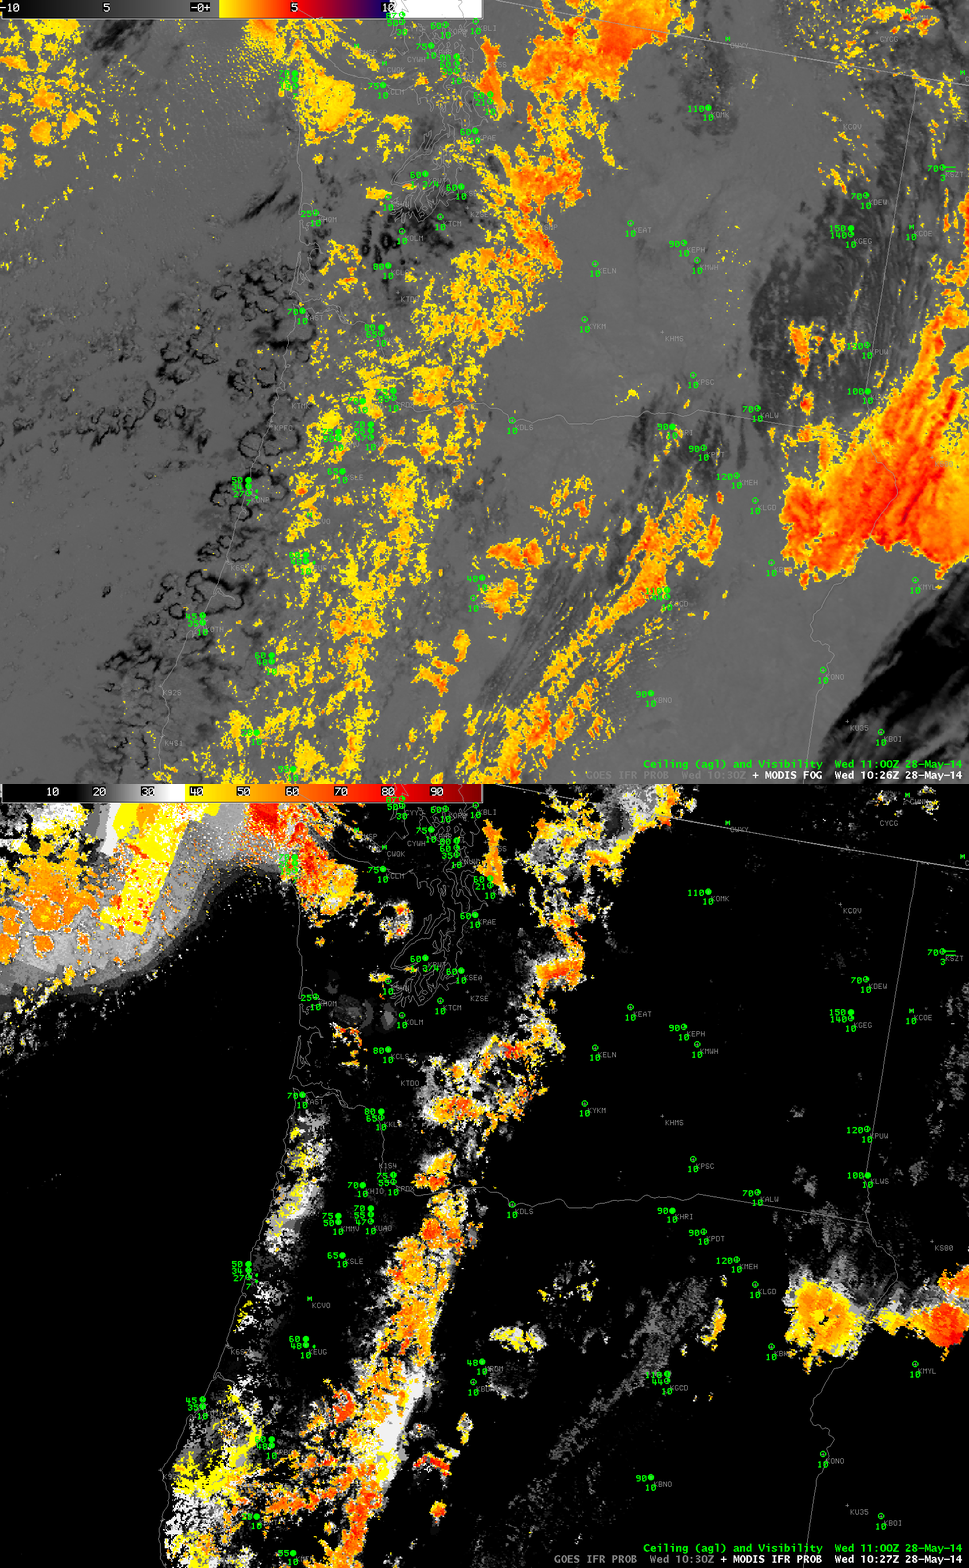
GOES-R IFR Probabilities computed from GOES-West at 0930 UTC on 28 May, and Color-enhanced terrain (Click image to enlarge)

When IFR Probabilities are enhanced over high terrain, how confident can you be that IFR conditions are occurring? Surface observations are rare on mountain tops. It’s possible that clouds occurring are at one level as the terrain rises up into the clouds, and ceilings at adjacent stations can give an indication of the cloud base (in the present case, ceilings are about 9000 feet above sea level at Seattle, for example).

Suomi/NPP Day/Night band imagery can verify that clouds exist in the region where IFR Probabilities are elevated. The toggle below, of Day/Night band and Brightness Temperature Differences, shows compelling evidence (even in low light conditions) of clouds along the spine of the mountains in central Washington and Oregon.

VIIRS_DNB_FOG_20140528_0935

Suomi/NPP VIIRS Day/Night Band and Brightness Temperature Difference (11.45 µm – 3.74 µm), 0935 UTC on 28 May (Click to enlarge)

High-resolution MODIS data are also used to produce IFR Probabilities, and they can be used to deduce the presence of low ceilings/reduced visibilities as well. The toggle below, from 1027 UTC, shows the brightness temperature difference field (11.0 – 3.9) from MODIS and the IFR Probability field. It is likely in this case that high clouds were shrouding the higher peaks of the Cascade Mountains.

MODIS_FOR_IFR_PROB_20140528_1027

Fog in Idaho, Oregon and Washington over three days

VIIRS_DNB__REF_20140121loop

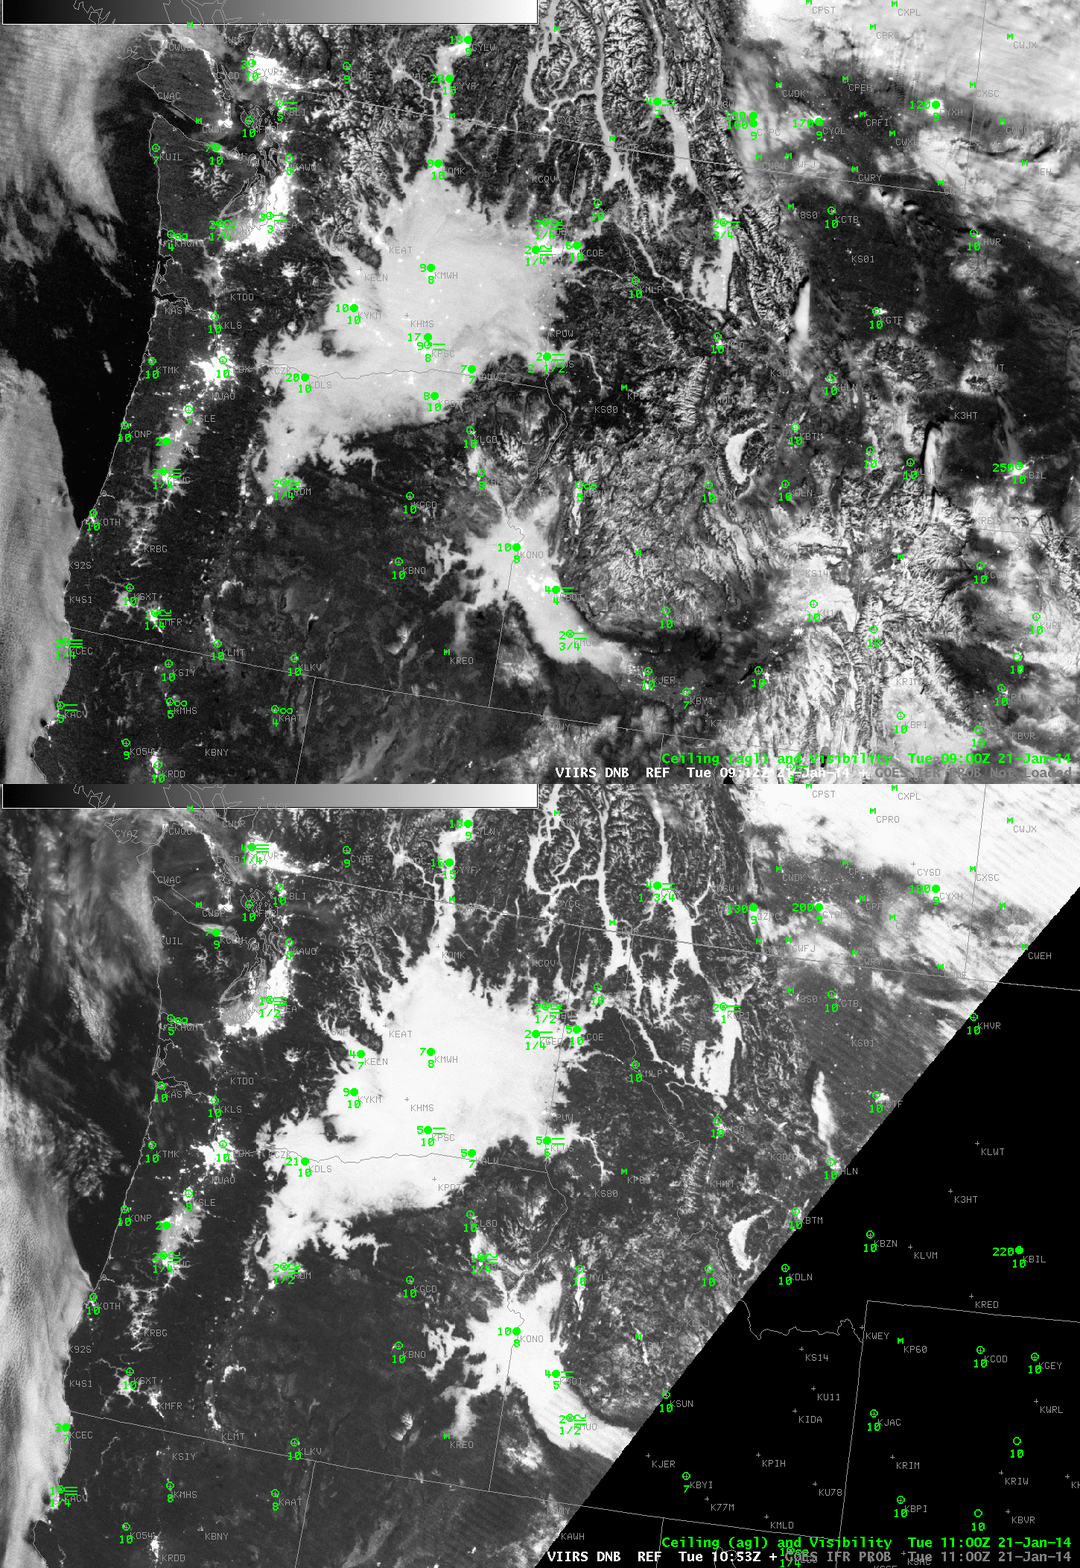
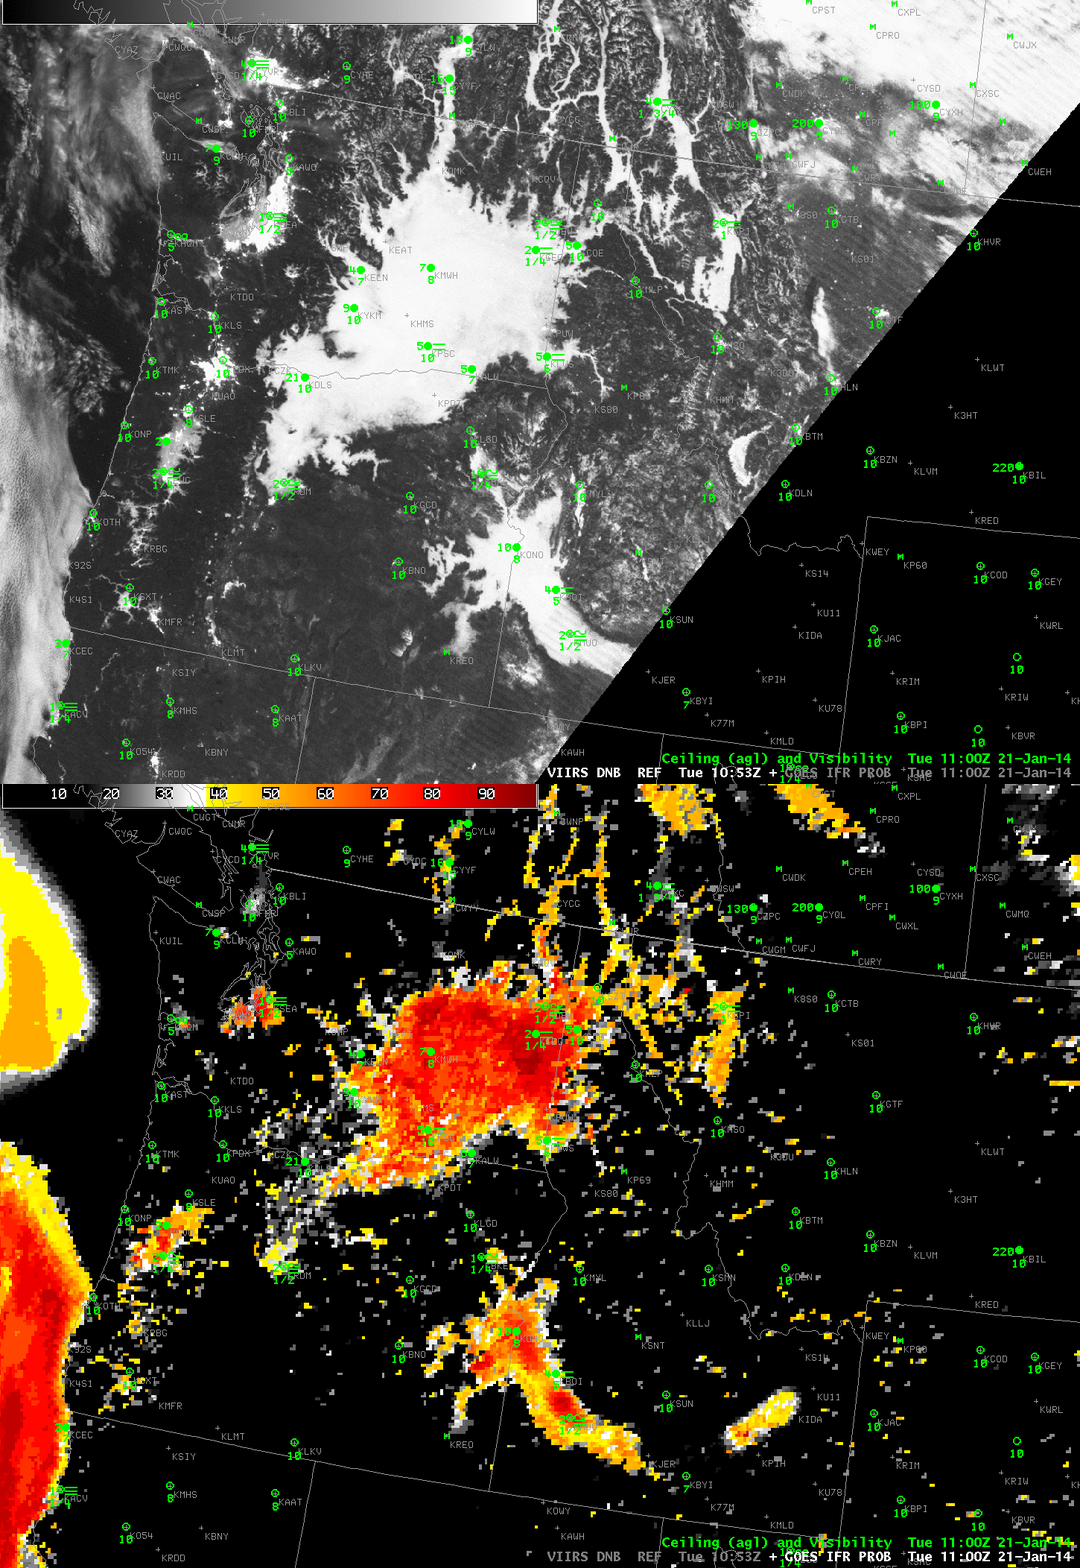
Suomi/NPP Day/Night band imagery over the Pacific Northwest, 0912 and 1053 UTC on 21 January 2014(click image to enlarge)

Suomi/NPP viewed eastern Oregon/Washington and western Idaho on two successive scans overnight. The 3/4 full moon provides ample illumination, and fog/low stratus is apparent in the imagery above. A view of the top of the clouds, however, gives little information about the cloud base, that is, whether or not important restrictions in visibility are occurring. For something like that, it is helpful to include surface-based data. Rapid Refresh data are fused with the model data to highlight regions where IFR conditions are most likely. The image below is a toggle of the 1053 UTC Day/Night band image and the 1100 UTC GOES-R IFR Probabilities (computed using GOES-West data). GOES-R IFR Probabilities are correctly highlighting regions where ceilings and visibilities are consistent with IFR conditions. Where the Day/Night band is possibly seeing elevated stratus (between The Dalles (KDLS) and Yakima (KYKM), for example), IFR Probabilities are lower.

GOES-based data cannot resolve very small-scale fog events in river valleys (over northeastern Washington State, for example). The superior spatial resolution of a polar-orbiting satellite like Suomi/NPP (or Terra/Aqua) can really help fine-tune understanding of the horizontal distribution of low clouds.
VIIRS_DNB_GOESIFR_TOGGLE_20140121_1100

Suomi/NPP Day/Night band imagery and GOES-R IFR Probabilities, ~1100 UTC on 21 January 2014(click image to enlarge)

Added: 22 January 2014
VIIRS_DNB__REF_20140122loop

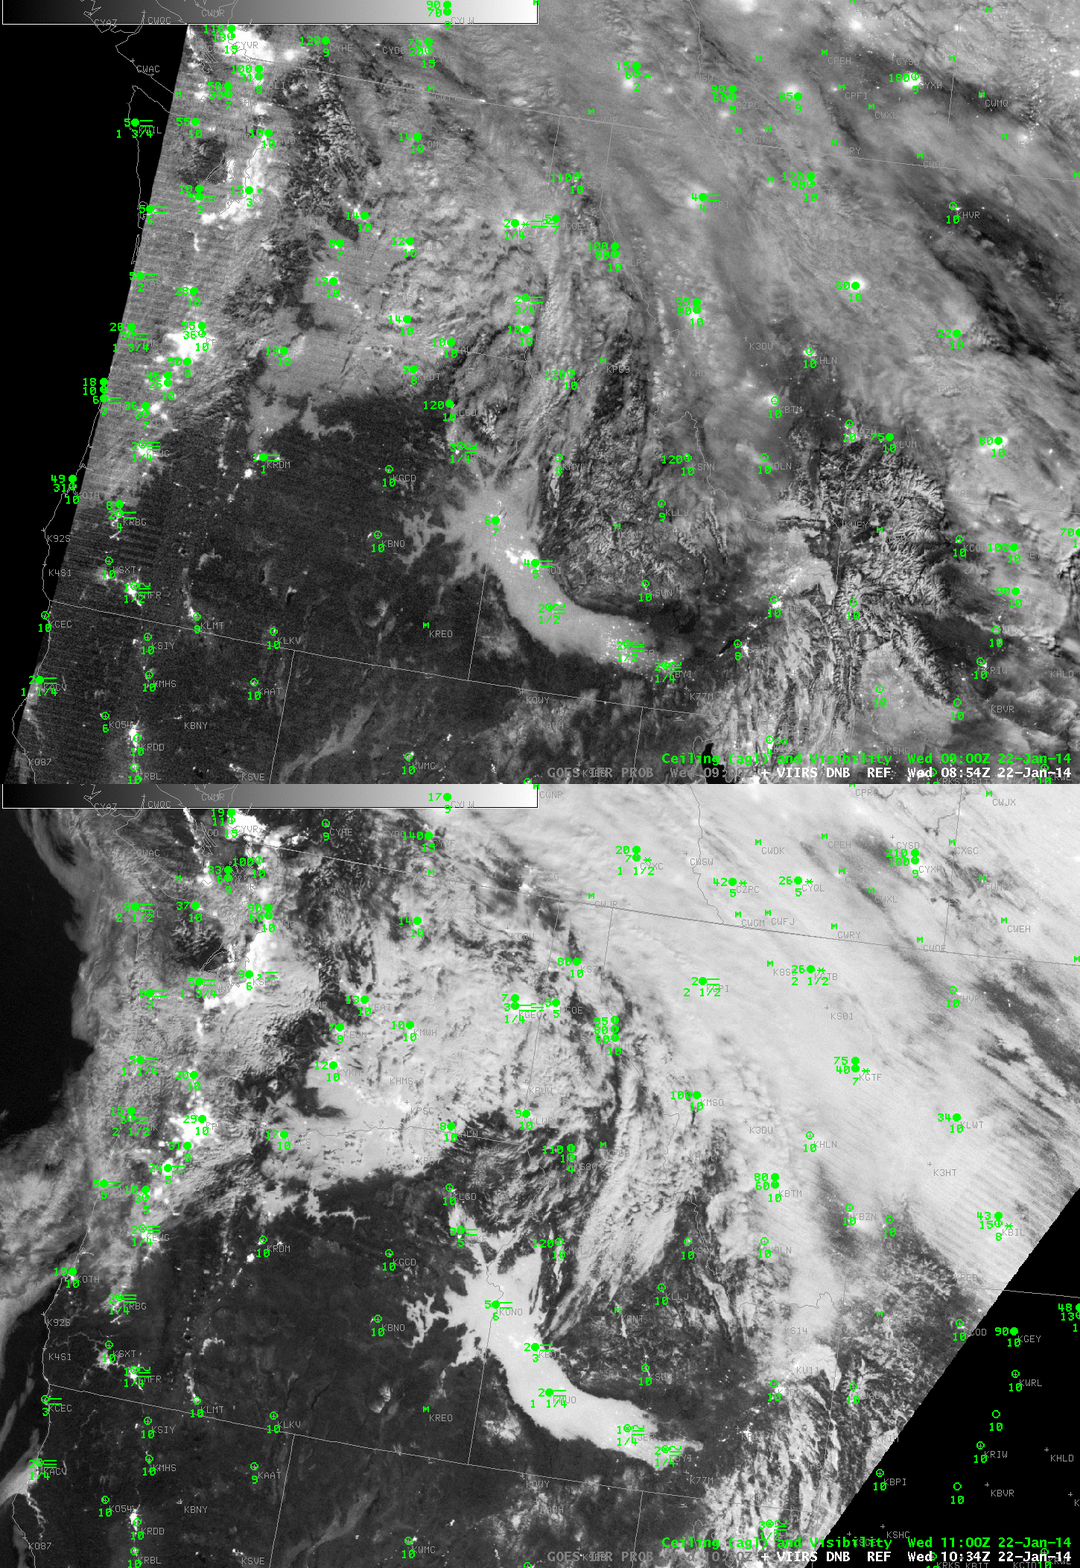
Suomi/NPP Day/Night band imagery over the Pacific Northwest, 0854 and 1034 UTC on 22 January 2014(click image to enlarge)
VIIRS_FOG_20140122loop

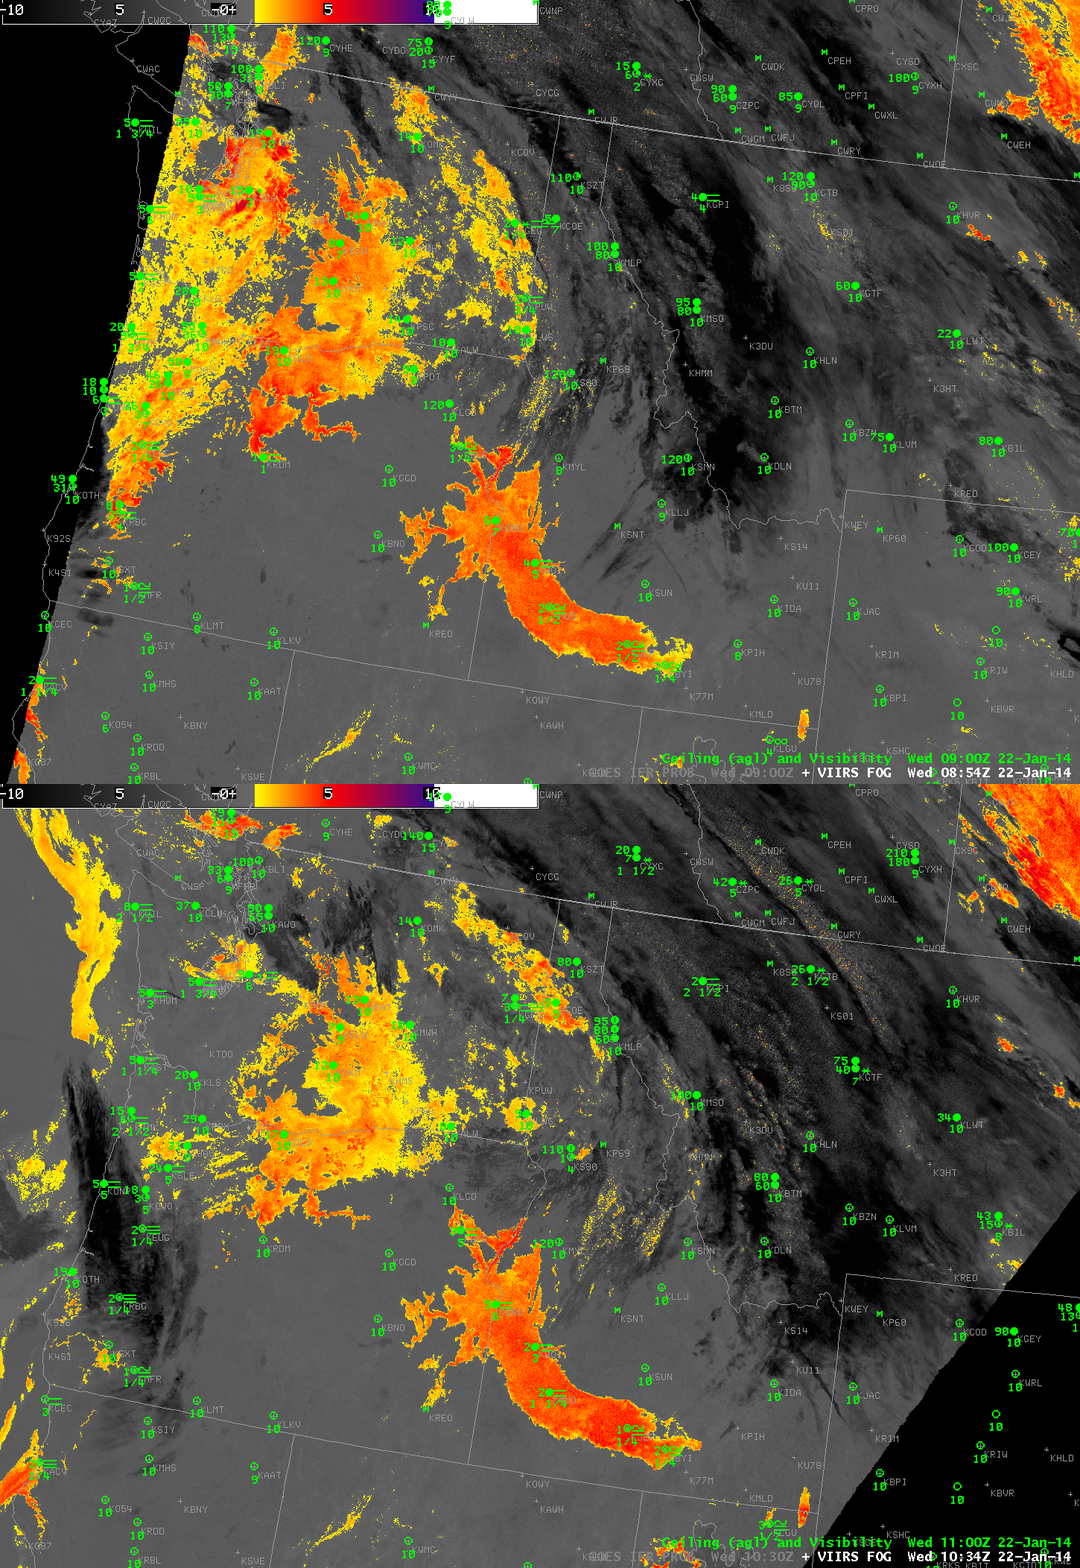
Suomi/NPP Brightness Temperature Difference from VIIRS, 11 µm – 3.74 µm imagery over the Pacific Northwest, 0854 and 1034 UTC on 22 January 2014(click image to enlarge)

The stagnant weather pattern under the west coast ridge allowed fog to persist overnight on January 22nd, and once again, the Day/Night band observed the fog-filled Snake River Valley of southern Idaho. The newly-rising moon at 0854 UTC provided less illumination than the higher moon at 1034 UTC, but both show fog/low stratus over the Snake River Valley of Idaho, and over parts of northern Oregon and central Washington. It is difficult to tell where the stratus is close enough to the ground to produce IFR conditions, however. The brightness temperature difference product from VIIRS, above, can distinguish between low clouds (orange enhancement) and higher clouds (dark grey) because of the different emissivity properties of water-based low clouds and ice-based higher clouds.

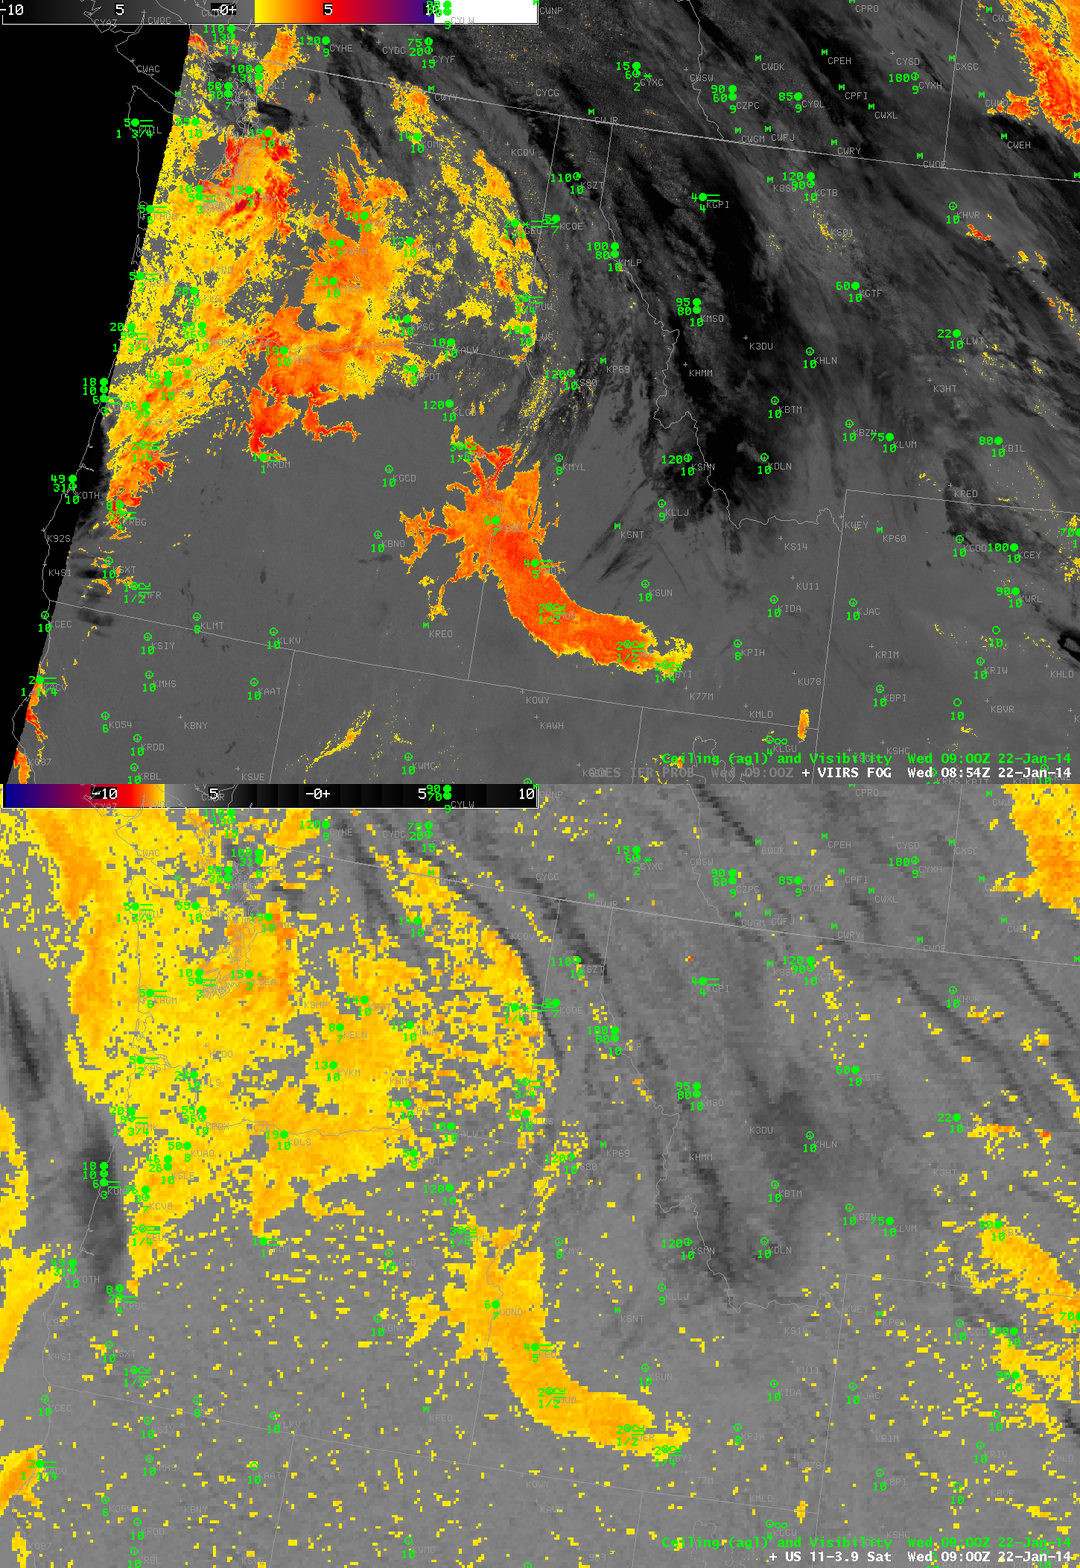
The toggle below shows how the higher-resolution VIIRS instrument can more accurately portray sharp edges to low clouds. Both instruments show the region of high clouds moving onshore in coastal Oregon (at the very very edge of the Suomi/NPP scan). These high clouds make satellite-detection of low clouds difficult because they mask detection of lower clouds.
GOESVIIRS_11-3.9_Sat_20140122_0900

Suomi/NPP Brightness Temperature Difference from VIIRS (10.35 µm – 3.74 µm) and GOES-15 Imager Brightness Temperature Difference (10.7 µm – 3.9 µm imagery over the Pacific Northwest, ~0900 UTC on 22 January 2014(click image to enlarge)
GOES_IFR_PROB_20140122loop

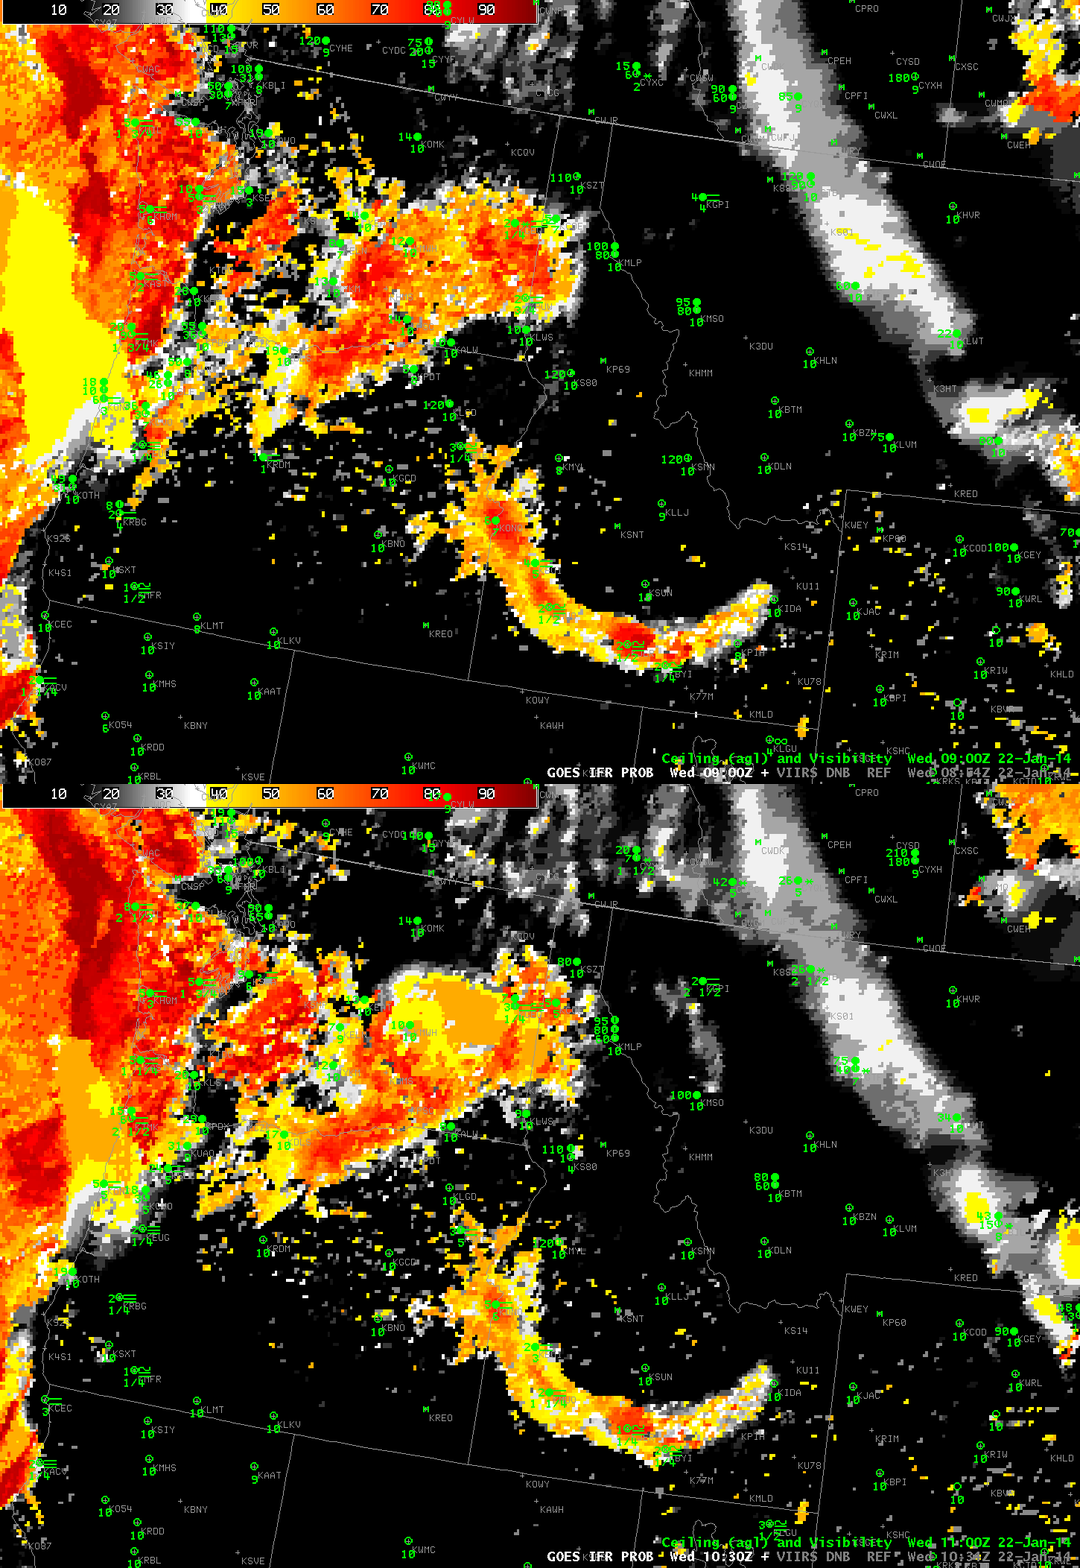
GOES IFR Probabilities at 0900 UTC and at 1030 UTC (click image to enlarge)

GOES-based IFR Probabilities show the probability of fog and low ceilings (IFR conditions) even where high clouds are present. In the toggle above, note the regions where the IFR Probability field is uniform (off the coast of Oregon, yellow, and over west-central Washington State, orange and yellow, both at 0900 UTC). These smooth fields are typical of IFR Probabilities that are determined primarily from Rapid Refresh data. Where those smooth fields exist, satellite data does not give a signal of low clouds — usually because of the presence of ice-based clouds at higher levels; therefore, model data are driving the IFR Probability signal, and model data are typically smoother than the more pixelated satellite field. There are places, however, where model data alone does not accurately portray IFR conditions (at KGPI, for example (Glacier Park), where high clouds are present).

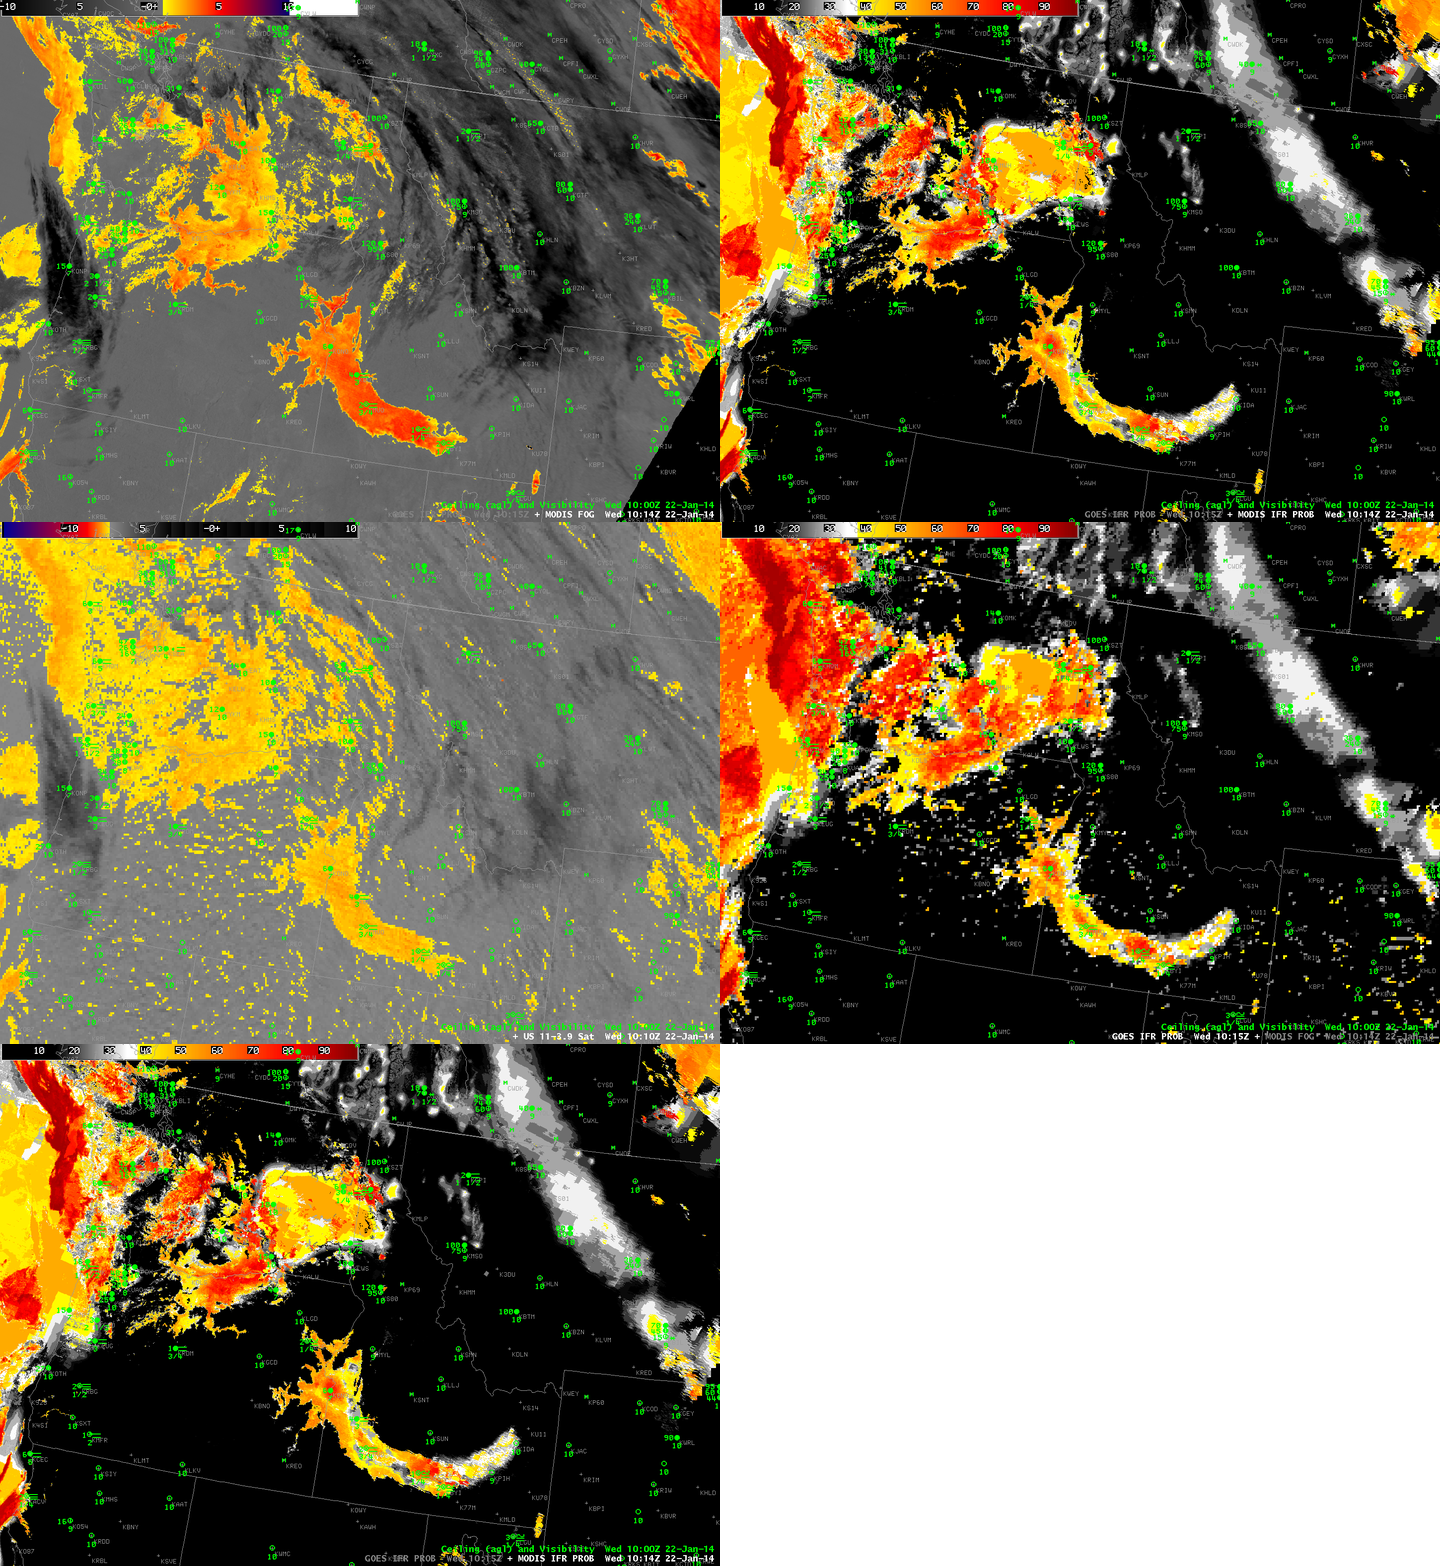
IFR Probability algorithms have not yet been extended using data from Suomi/NPP, in large part because the VIIRS instrument does not detect radiation in the so-called water-vapor channel (around 6.7 µm). The MODIS detector on board Terra and Aqua does have a water vapor channel, and IFR Probabilities are routinely produced from MODIS data, as shown below. MODIS, like VIIRS, has a 1-km pixel footprint that excels at detecting very fine small-scale features in clouds, especially small valleys, that are smeared out in the GOES imagery. The toggle below is of MODIS Brightness Temperature Difference, MODIS-based IFR Probabilities, GOES Brightness Temperature Difference, and GOES-based IFR Probabilities, all at ~1015 UTC on 22 January. Two things to note: MODIS has cleaner edges to fields, related to the high spatial resolution. The GOES-based brightness temperature difference highlights many more pixels over central Oregon where fog is not present. These positive hits bleed into the GOES-based IFR Probabilities, and they occur because of emissivity differences in very dry soils (See for example, this post). As drought conditions persist and intensify on the west coast under the longwave ridge, expect this signal to persist. The signals are not apparent in MODIS or VIIRS brightness temperature differences because of the narrower spectrum of those observations.
GOESMODIS_IFR_PROB_20140122_1014

MODIS Brightness Temperature Difference (11 µm – 3.74 µm), MODIS-based GOES-R IFR Probabilities, GOES-15 Imager Brightness Temperature Difference (10.7 µm – 3.9 µm), GOES-based GOES-R IFR Probabilities and MODIS-based IFR Probabilities (again), all near 1015 UTC 22 January 2014(click image to enlarge)

Added, 23 January:

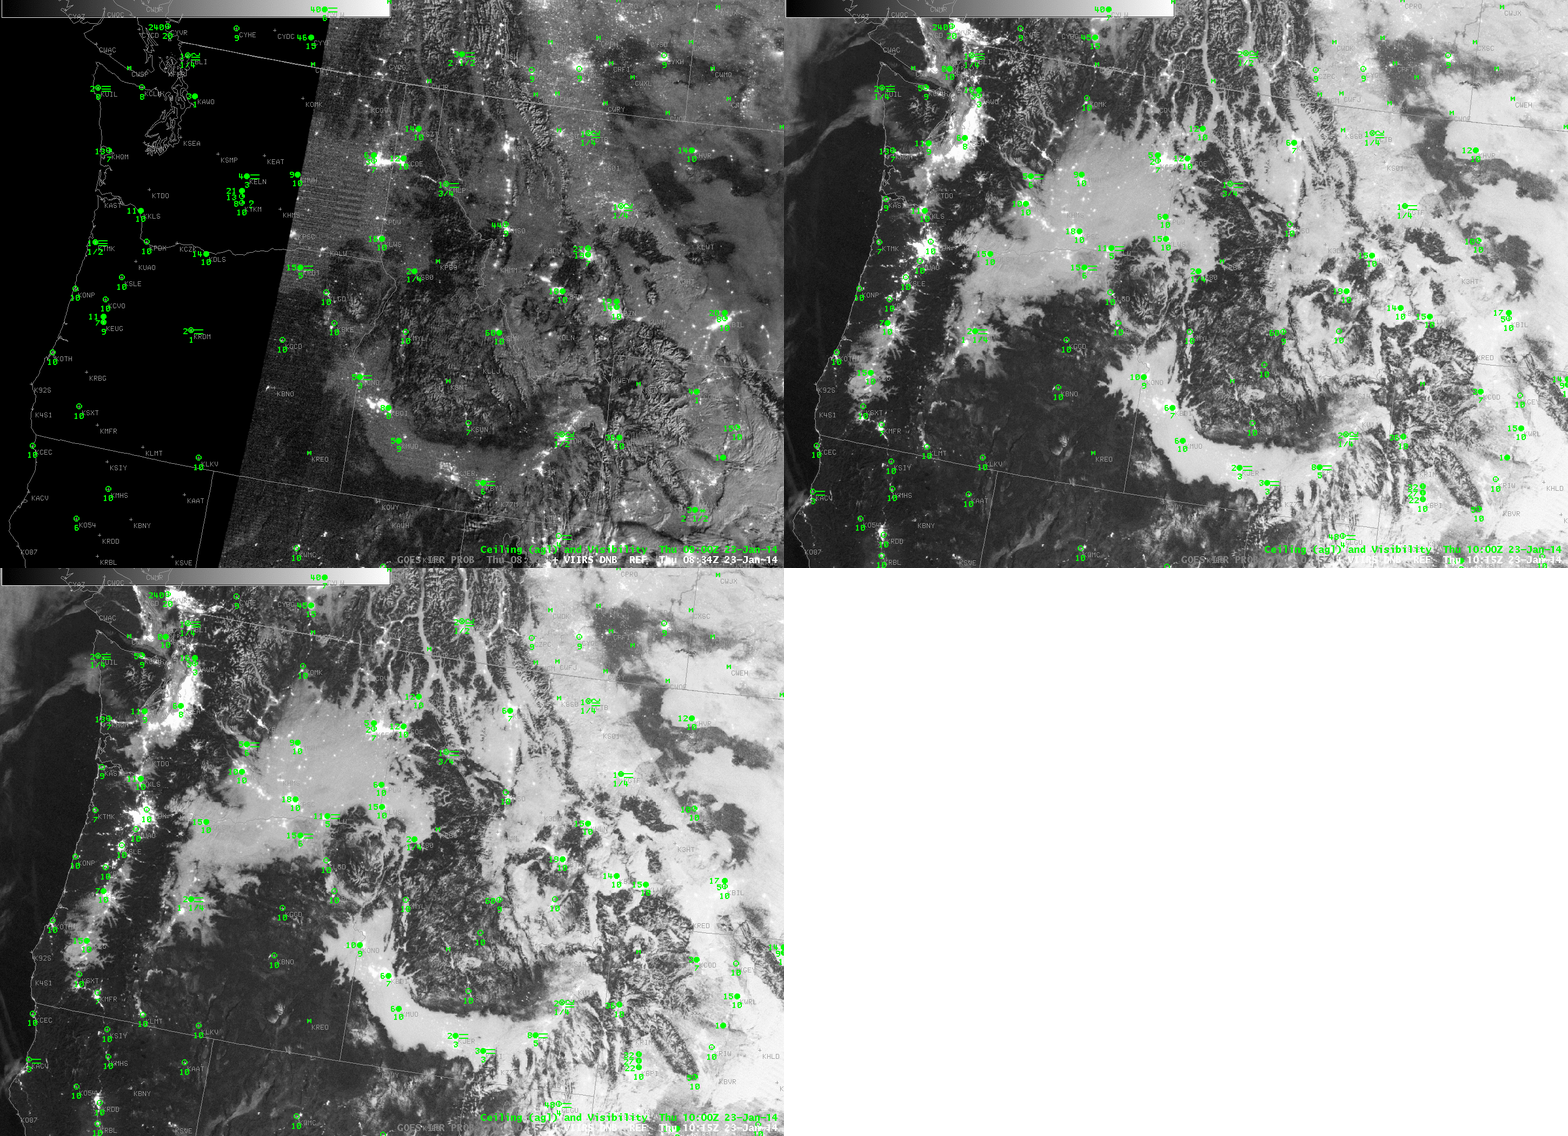
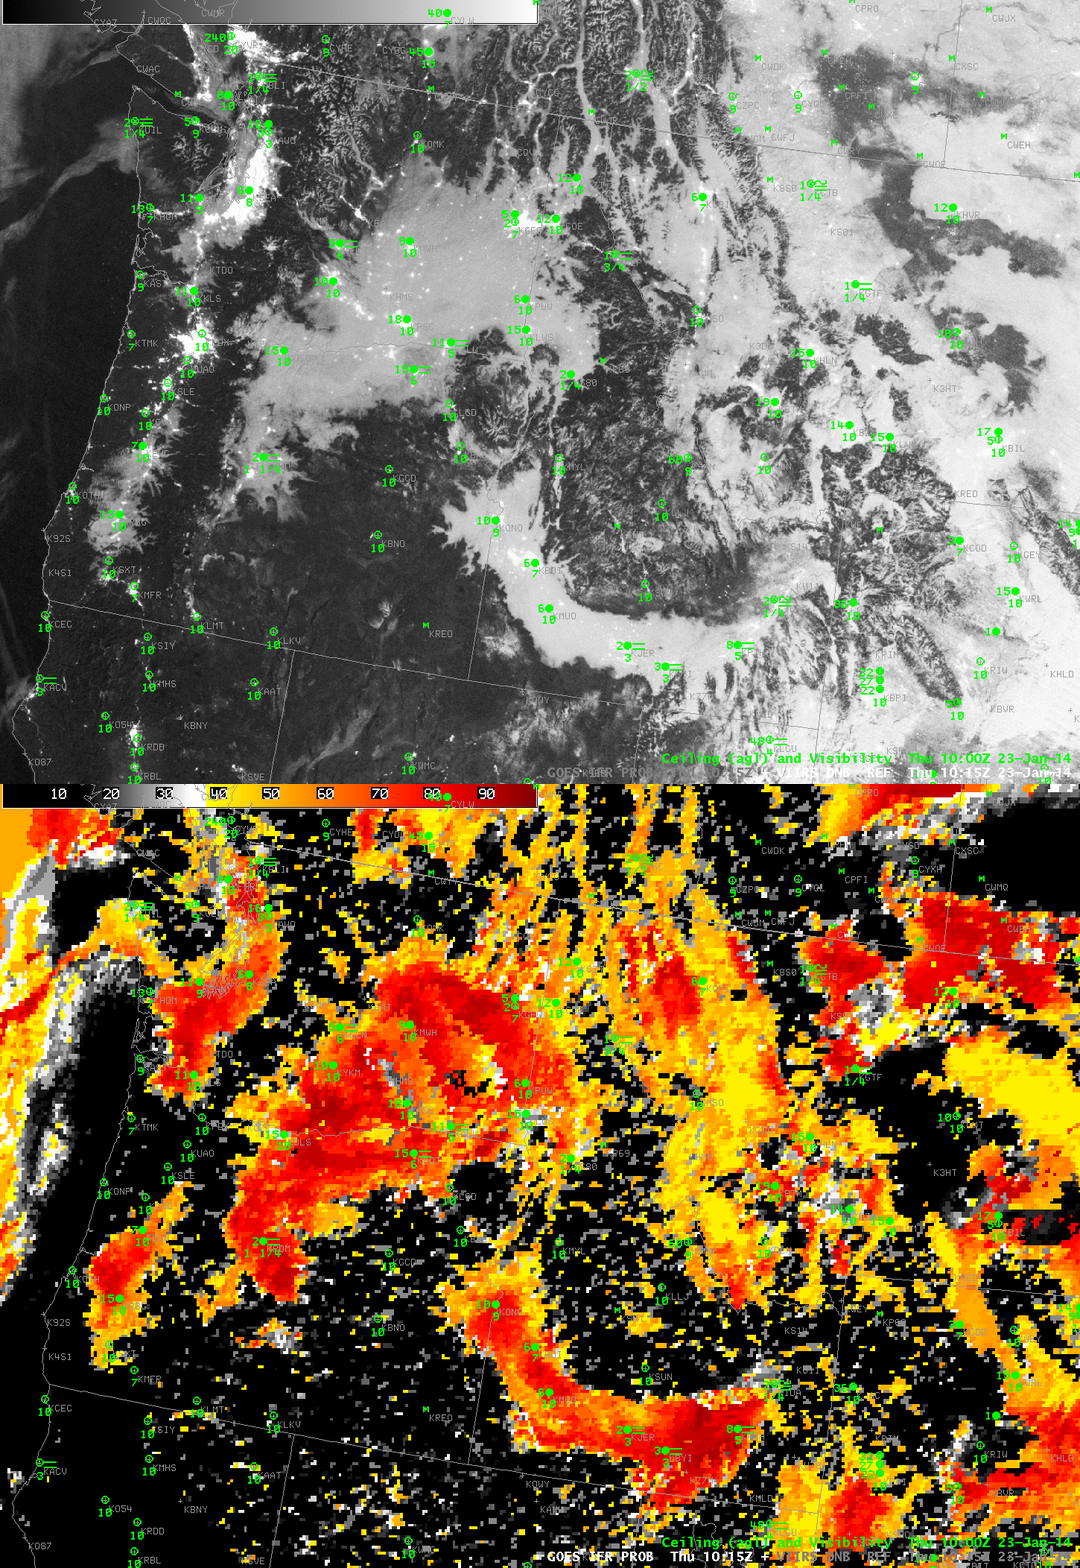
Fog persists in the Snake River Valley and elsewhere. It has also become more widespread over the high plains of Montana. Note the difference in the Day/Night band imagery below. At 0834 UTC, the rising quarter moon is unable to provide a lot of illumination; by 1015 UTC, however, the moon is illuminating the large areas of fog. Because the moon is waning, however, Day/Night band imagery will become less useful in the next week. A toggle between the 1015 UTC Day/Night band and the GOES-R IFR Probabilities computed using GOES-West (below the Day/Night band imagery) continues to demonstrate how well the field outlines the region of IFR conditions.
VIIRS_DNB__REF_20140123loop


Suomi/NPP Day/Night band imagery over the Pacific Northwest, 0834 and 1015 UTC on 23 January 2014(click image to enlarge)
VIIRS_DNB_GOES_IFR_PROB_20140123_1015


Suomi/NPP Day/Night band imagery and GOES-R IFR Probabilities (from GOES-15 and Rapid Refresh data) over the Pacific Northwest, 1015 UTC on 23 January 2014(click image to enlarge)
IFR Probabilities over the Pacific Northwest with a front

GOES_IFR_PROB_20140103loop

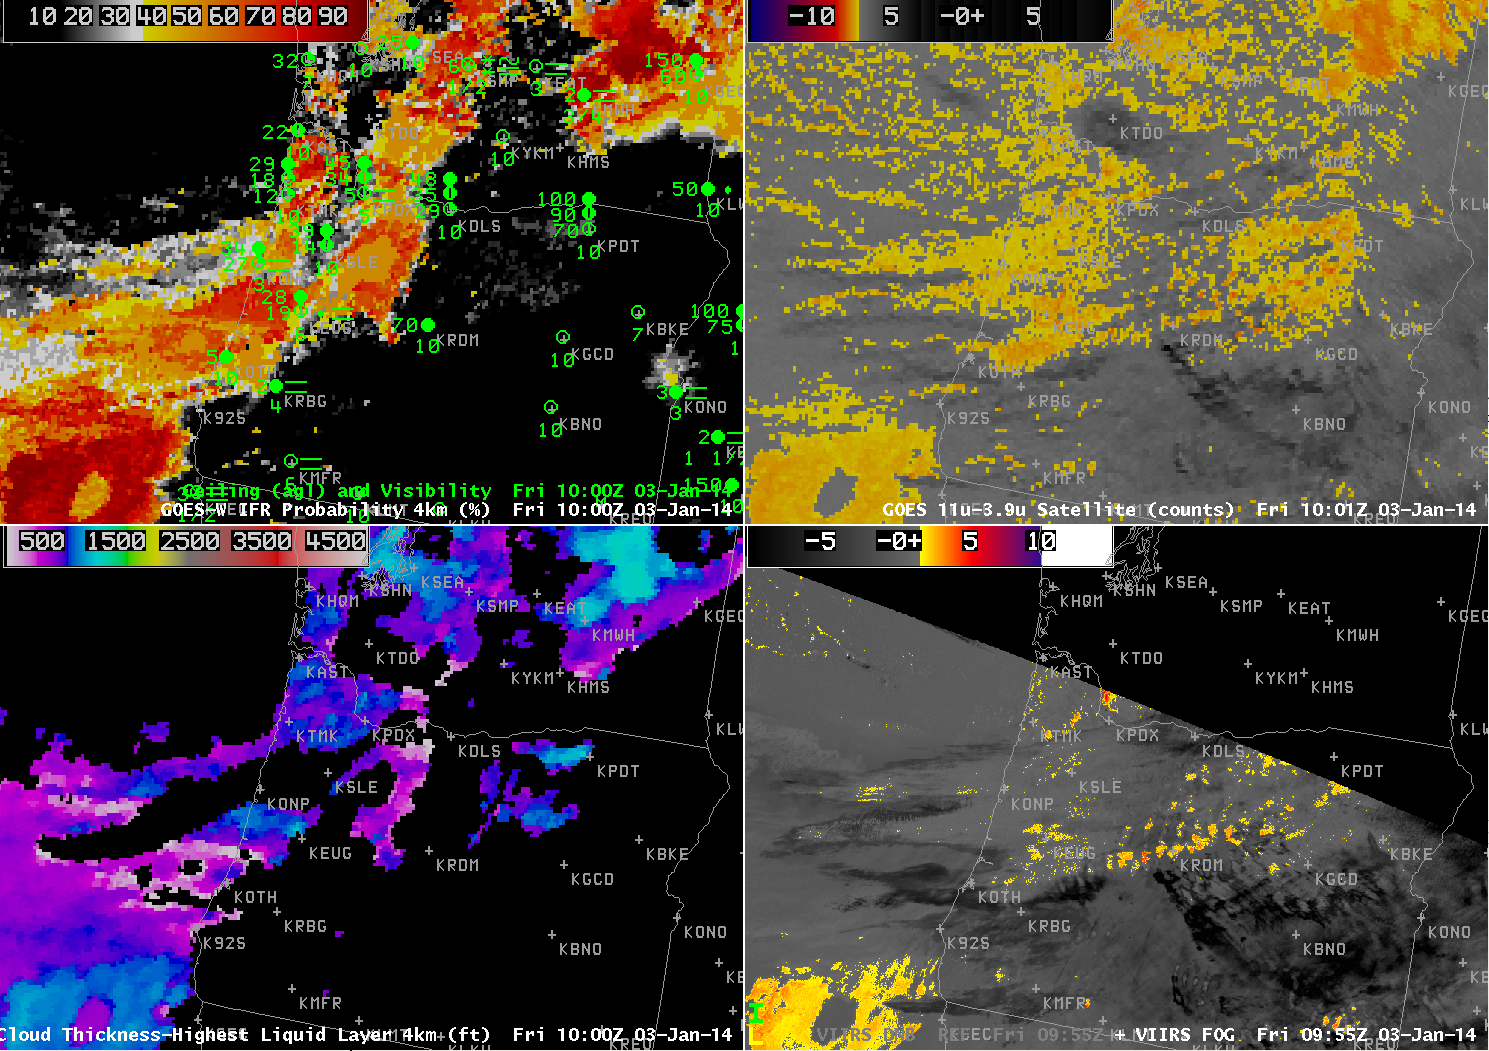
GOES-R IFR Probabilities from GOES-15 (upper left), GOES-15 Brightness Temperature Difference (10.7 µm – 3.9 µm) Fields (upper right), GOES-R Cloud Thickness from GOES-15 (lower left), Suomi/NPP Brightness Temperature Difference (lower right), times as indicated, 3 January 2014 (click image to animate)

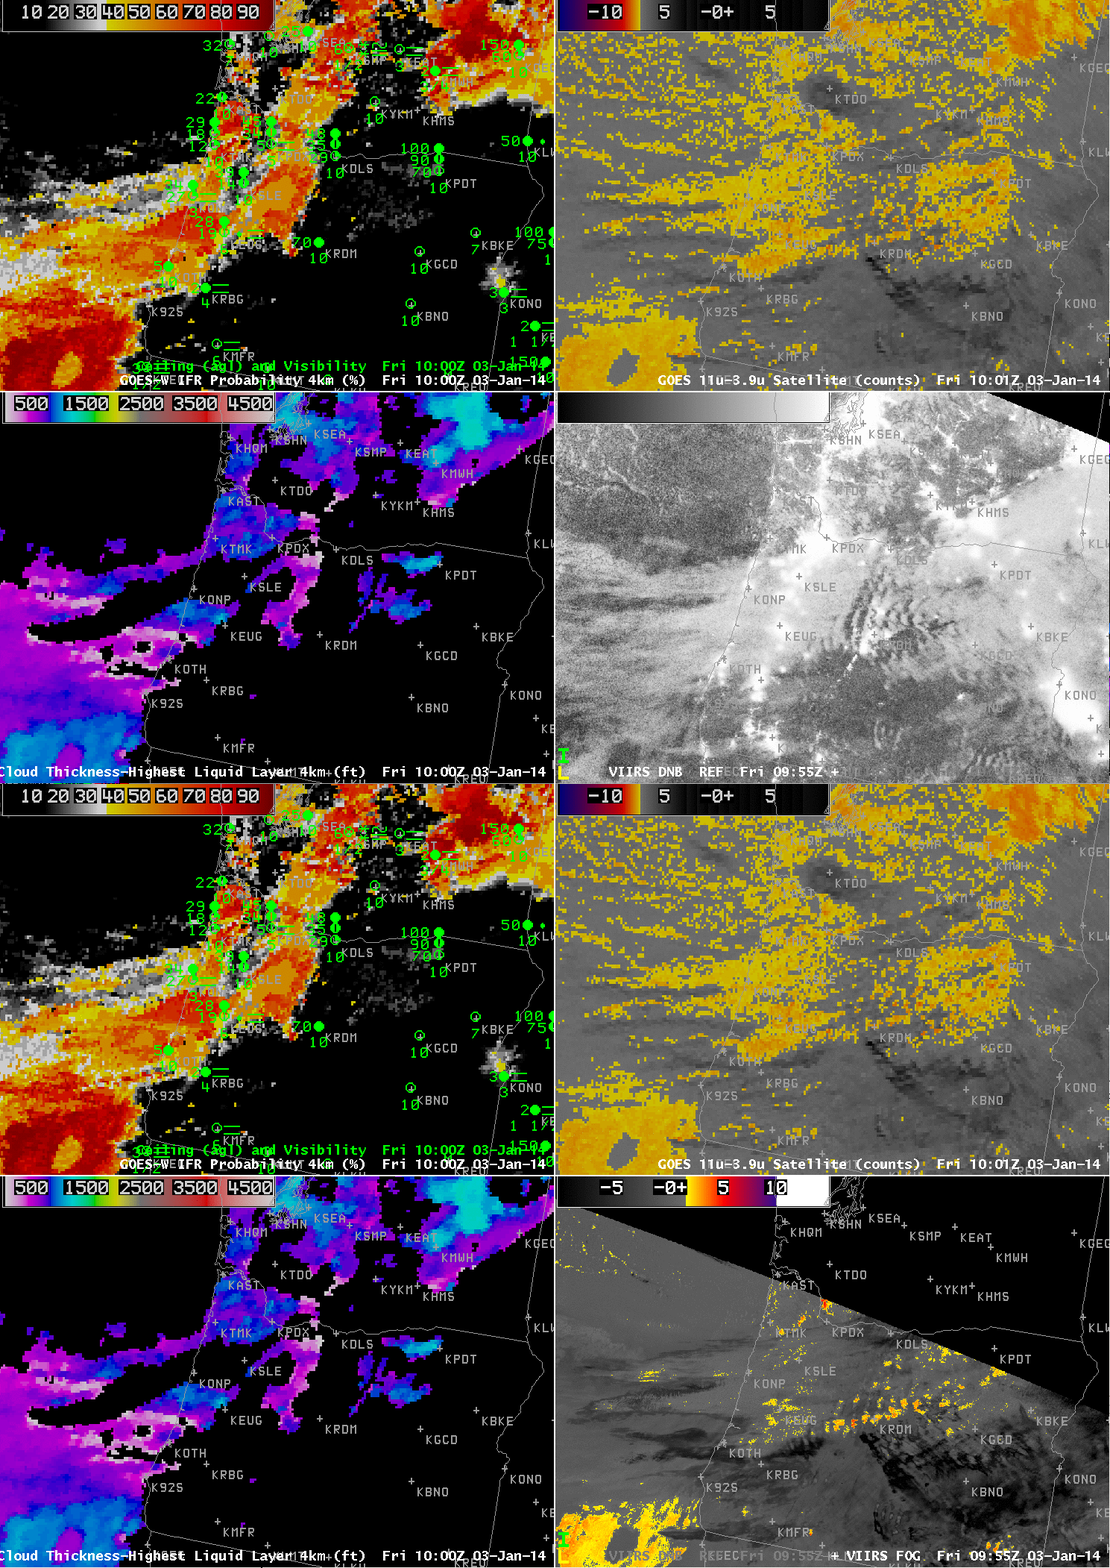
One benefit of the GOES-R IFR probabilities is its consistency from hour to hour. In the animation above, the region of higher IFR Probabilities associated with a southward-propagating front over Oregon shows good hour-to-hour consistency. In contrast, the Brightness Temperature Difference field (upper right in the figure) suffers from the presence of higher clouds (denoted in the enhancement by darker regions). As the high IFR Probabilities expand southward into southern Oregon, reported visibilities/ceilings decrease towards IFR conditions. In the animation, regions of high clouds show up in the Cloud Thickness product as regions of missing data: Cloud Thickness is of the highest water-based cloud. If the highest cloud detected by satellite is mixed-phase, or ice, Cloud Thickness is not computed. Cloud Thickness is also not computed in the 1600 UTC imagery because that time is near sunrise, and cloud thickness is not computed in twilight conditions.

Suomi/NPP provided a view of the scene as well, and the Day/Night Band showed the band of frontal clouds well. The brightness temperature difference field suggests that the cloud band was not necessarily low cloudiness, although the higher IFR Probabilities (and reduced ceilings and visibilities) testify to the presence of low clouds underneath the middle- and higher-level clouds.

VIIRS_DNB_BTD_20140103_1000

GOES-R IFR Probabilities from GOES-15 (upper left), GOES-15 Brightness Temperature Difference (10.7 µm – 3.9 µm) Fields (upper right), GOES-R Cloud Thickness from GOES-15 (lower left), Toggle between Suomi/NPP Day/Night band and Brightness Temperature Difference (lower right), ~1000 UTC, 3 January 2014 (click image to enlarge)

The influence of high clouds

GOES_IFR_PROB_20131216_0700

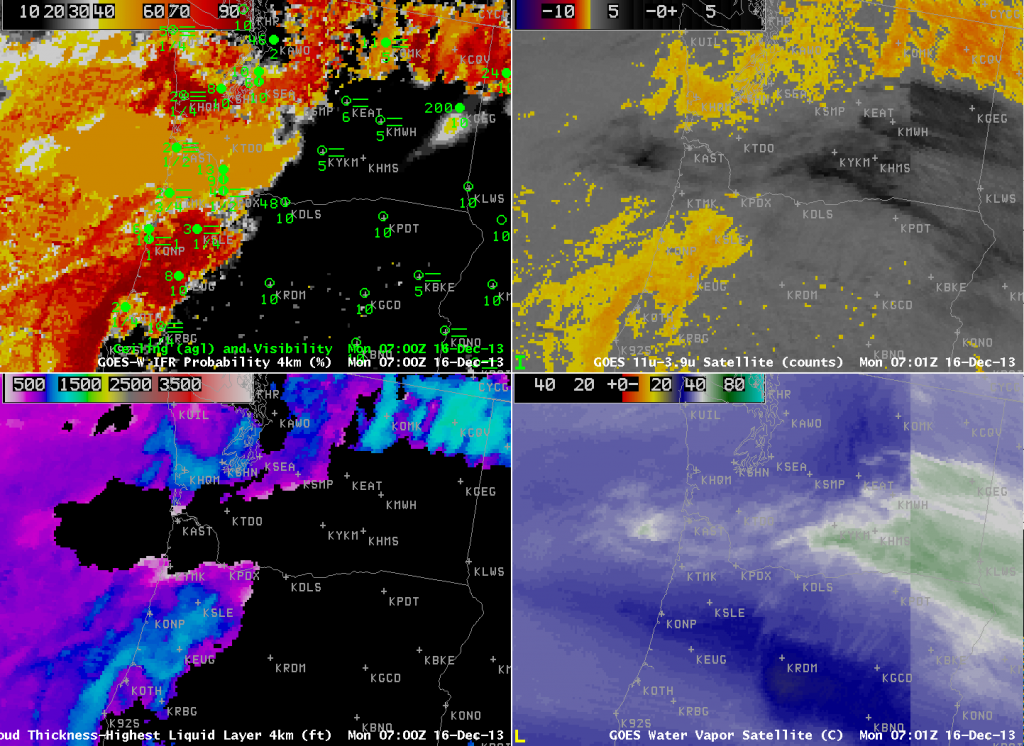
GOES-R IFR Probabilities from GOES-15 (upper left), GOES-15 and GOES-13 Brightness Temperature Difference (10.7 µm – 3.9 µm) Fields (upper right), GOES-R Cloud Thickness from GOES-15 (lower left), GOES-13 and GOES-15 6.7 µm enhanced water vapor imagery (lower right), all at ~0700 UTC 16 December 2013 (click image to enlarge)

High clouds in the atmosphere limit the ability of satellites to sense the presence of low clouds, as this example from December 16 2013 on the coast of Oregon demonstrates. Both the brightness temperature difference product and the water vapor imagery show signatures that accompany high cirrus. When cirrus is present, the brightness temperature difference field cannot be used to isolate regions of fog and low stratus because the satellite is detecting radiation from the highest emitting surface (the cirrus) not the fog/low stratus beneath. The IFR Probability field, however, uses both cloud information and Rapid Refresh Data, and the model data can fill in regions where satellites give no useful information, such as the lower Columbia River Valley around Astoria. Because satellite data are not used as a predictor, probabilities are lower. Remember how the presence of high clouds affects things when you interpret the IFR Probability fields.

GOES-R Cloud Thickness is not computed under high clouds. The GOES-R Cloud Thickness is the thickness of the highest water-based cloud deck. If a cirrus deck is present, or if twilight conditions are present, GOES-R Cloud Thickness is not computed.

Fog in eastern Washington

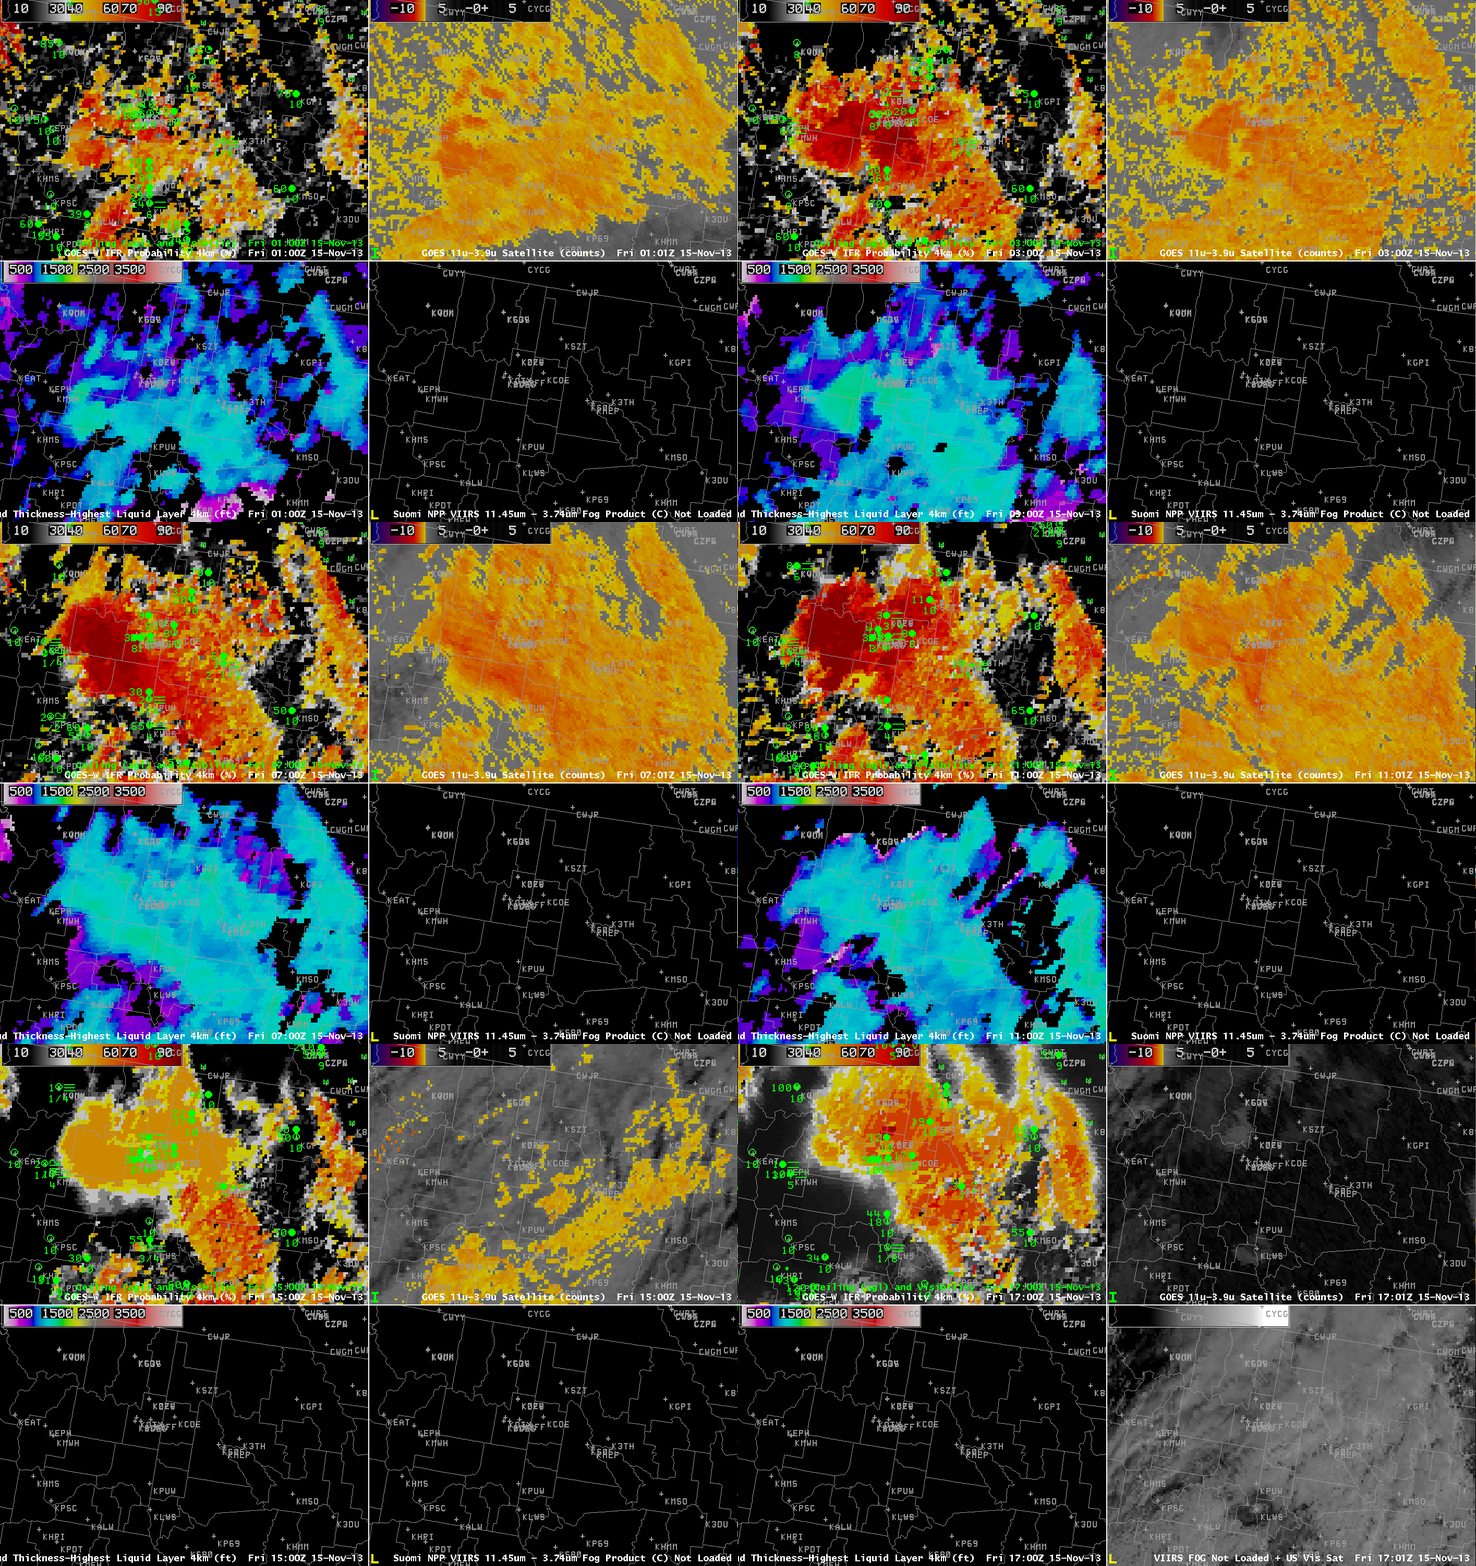
GOES_IFR_PROB_20131115loop

GOES-15-based GOES-R IFR Probabilities (Upper Left), GOES-15 Brightness Temperature Difference Product (10.7 µm – 3.9 µm) (Upper Right), GOES-R Cloud Thickness from GOES-15 (Lower Left), Suomi/NPP Brightness Temperature Difference and GOES-15 Visible data (Lower Right), all times as indicated (click image to enlarge)

The evolution of GOES-R IFR Probability fields showed an expected relationship between where Fog and Low stratus caused IFR Conditions and where IFR Probability was highest. The hourly animation, above, shows very high IFR Probabilities in and around Spokane in concert with IFR conditions that are observed. The Brightness Temperature Difference product, upper right, shows a strong signal there as well, but the positive signal extends to regions where IFR conditions are not observed: for example, over western Montana near Missoula. GOES-R IFR Probability fields thus are refining the signal in the brightness temperature difference field; the Rapid Refresh Model output allows the IFR Probability field algorithm to distinguish between fog/low stratus and mid-level stratus.

Later in the animation, IFR Probabilities decrease around Spokane as high-level clouds move in. Because these high clouds obscure the satellite view of low- and mid-level clouds, satellite information is not included in the computation of IFR Probabilities and Probabilities are lower. At the end of the animation, during the day, probabilities increase. Use of the visible data as a cloud-clearing product leads to higher probabilities (because there is more confidence that the cloud is actually present).

Note that Cloud Thickness is only computed in regions of low clouds that are comprised of water droplets. When high clouds are present, cloud thickness is not computed. In addition, cloud thickness is not computed during twilight conditions on either side of sunrise and sunset. Those restrictions show up plainly in the cloud thickness field in the animation.

Fog around Puget Sound

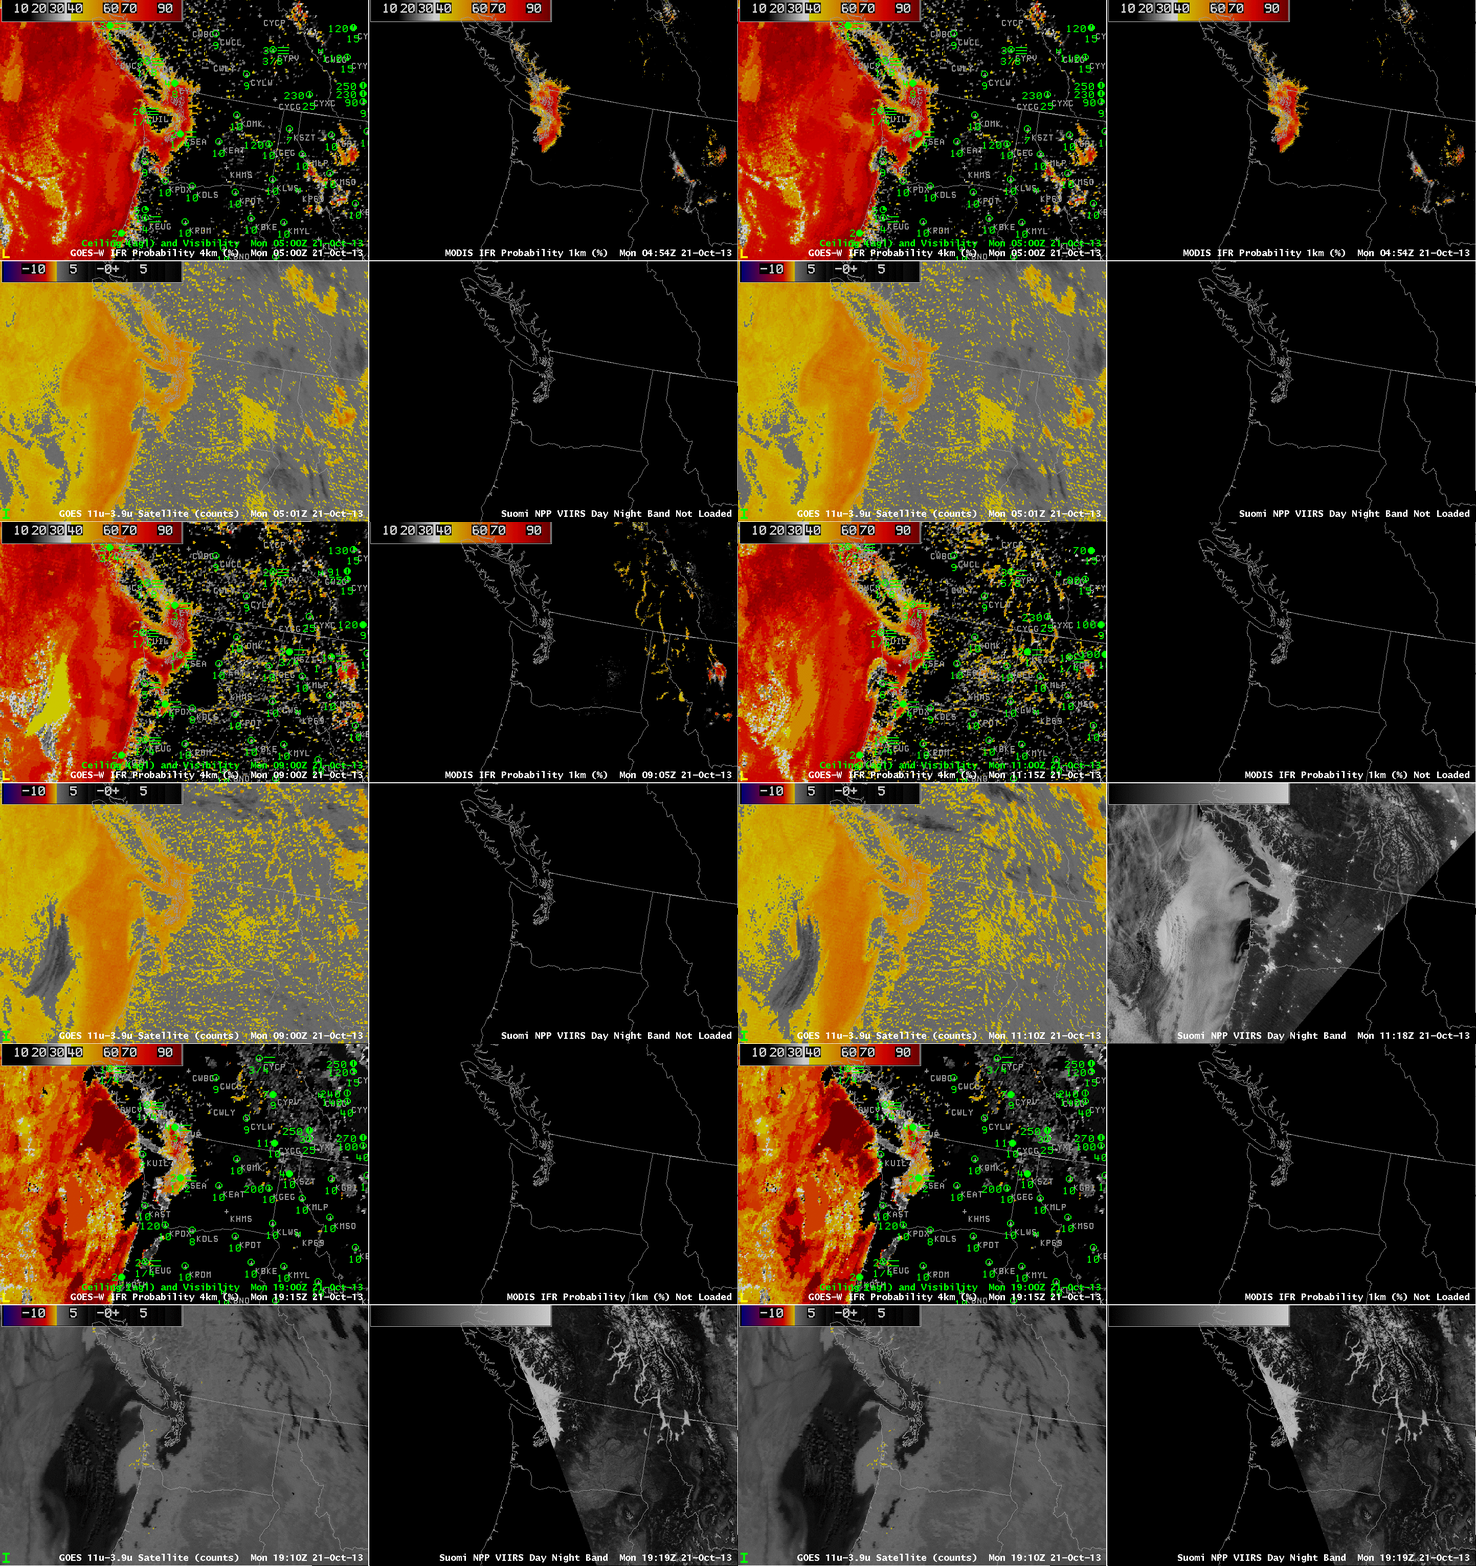
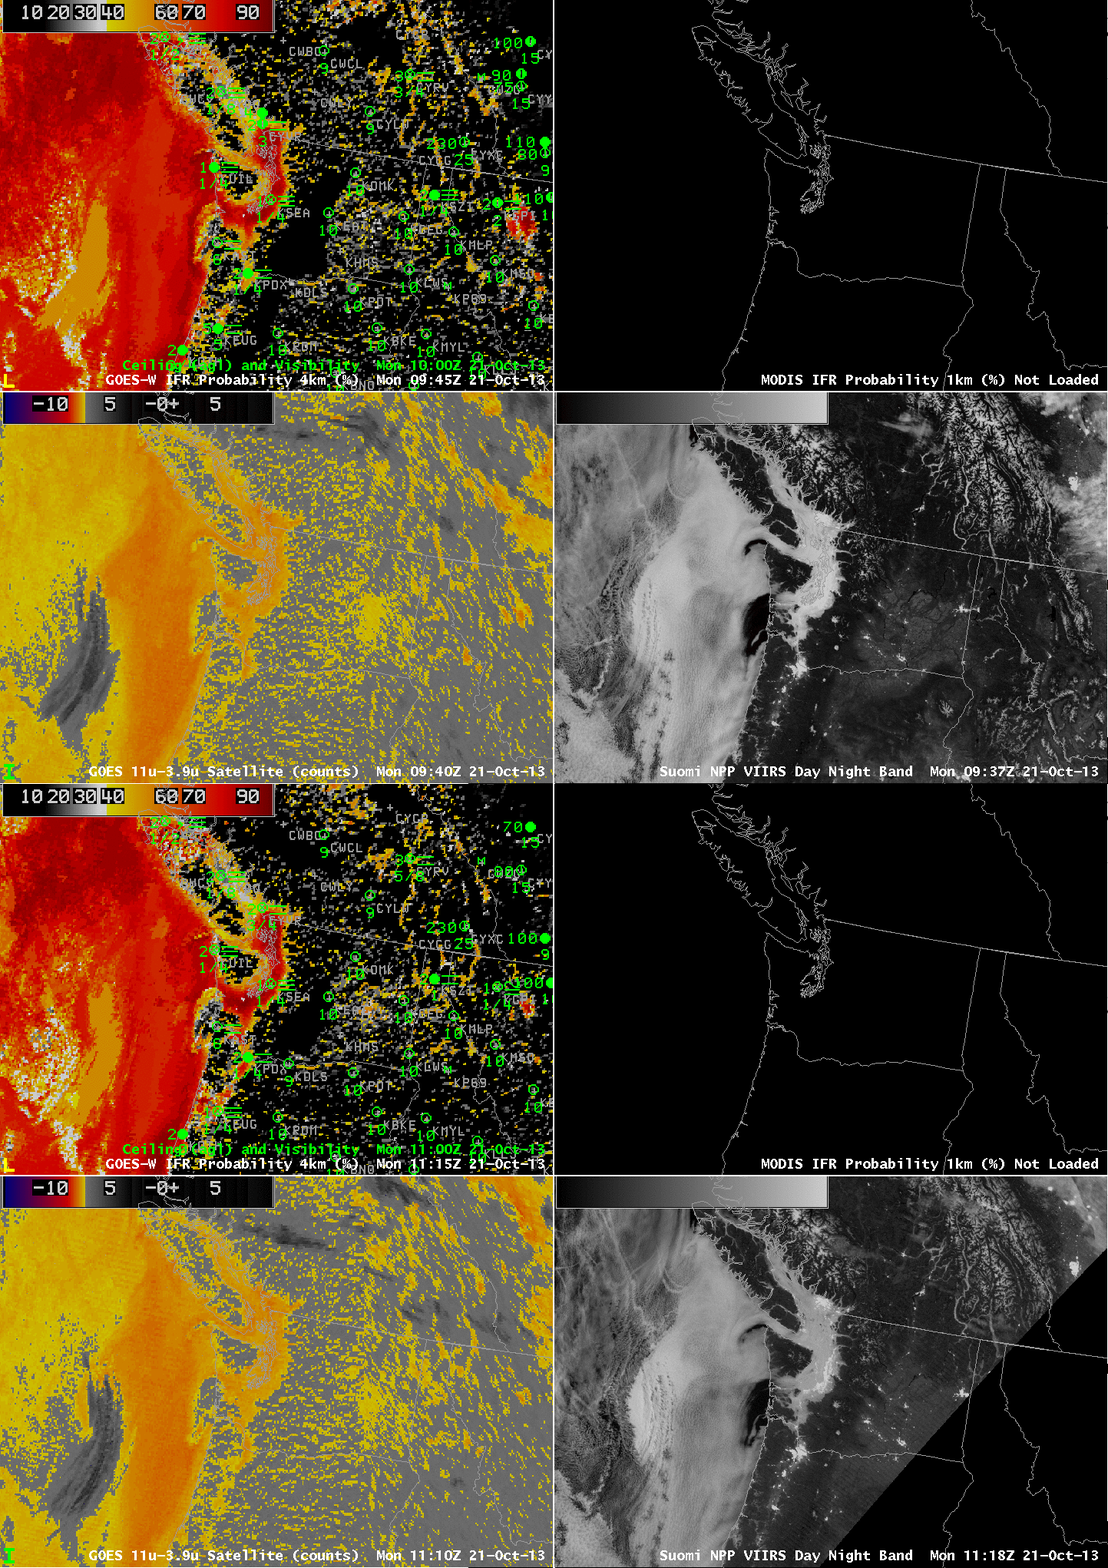
GOES_IFR_PROB_20131021loopGOES-15-based GOES-R IFR Probabilities (Upper Left), GOES-15 Brightness Temperature Difference Product (10.7 µm – 3.9 µm) (Lower Left), MODIS-based GOES-R IFR Probabilities (Upper Right), Suomi-NPP Day/Night Band (Lower Right), all times as indicated (click image to enlarge)

IFR Conditions developed around the Puget Sound during the night of 20 October. How did the GOES-R IFR Probabilities capture this event? The animation above includes imagery from 0500, 0900, 0945, 1115 and 1915 UTC. Higher-resolution polar orbiter data (from MODIS and Suomi/NPP) shows the value of higher-resolution in capturing fog that settles into valleys over southeast British Columbia and western Washington. GOES data are unable to resolve those features.

The Brightness Temperature difference fields have a strong signal over the Pacific Ocean and adjacent coastal areas (IFR Probabilities are high in those regions: both satellite data and Rapid Refresh data are consistent with a high likelihood of fog/low stratus). Over land, the signal is more noisy, perhaps because of differences in land emissivity. (That noise is not present when the sun is up — at that time the brightness temperature difference signal is determined by reflected solar radiation). Where the brightness temperature difference signal is smaller over land, the IFR Probability is also lower. That it is not even smaller suggests that model fields are at or near saturation over land. Note also a strength of the IFR Probability: A consistent signal both day and night. IFR Probabilities are high over Seattle where IFR conditions persist.

GOES_IFR_PROB_20131021DNBloopAs above, but for times with Day/Night band data at night only (click image to enlarge)

The Suomi-NPP Day/Night band can give a good indication of where clouds are present at night when, as occurred last night, the moon is near full. (The Day/Night band does not, however, by itself give any indication of surface visibility) In the example above, the clouds do not change much in the 90 minutes between overpasses. (The slight shift in the apparent location of snow-covered mountains is apparently due to parallax) GOES can just barely resolve the very thin fog features that are so evident in the Suomi/NPP data.

IFR Conditions on the West Coast as a front passes

GOES_IFR_PROB_20130930_loop

GOES-15-based GOES-R IFR Probabilities (Upper Left), GOES-15 Brightness Temperature Difference Product (10.7 – 3.9 ) (Upper Right), Color-shaded topographic map (Lower Left), GOES-15 Visible imagery and Suomi/NPP Day/Night Band (Lower Right), all times as indicated (click image to enlarge)

A strong low pressure system — the first strong system of the Fall Season — has made landfall along the Pacific Northwest Coast, and it provides an opportunity to see how GOES-R IFR Probabilities perform with extratropical systems.

Several aspects of the IFR Probability Fields — which are far more coherent than the Brightness Temperature Difference fields — require explanation. There is an increase in the IFR Probability off the coast of Oregon in the 4th image in the loop. This jump — from IFR Probabilities near 55% (orange) to Probabilities near 68% (darker red-orange) — is likely caused by a changed in the Rapid Refresh model output that is suggesting a greater likelihood of low-level saturation. Note that this region in the very next image displays the characteristic signature of the boundary between day-time predictors being used and night-time predictors being used (IFR Probabilities drop from orange yellow — 39%). In the early part of the animation, the IFR Probability field off the Oregon Coast maintains the flat (un-pixelated) look that is characteristic of a region where only Rapid Refresh model output is being used in the computation of IFR Probabilities because high cloud are present. GOES-R Cloud Thickness (of the highest water-phase cloud, not shown) would not be computed in this region, then, for two reasons: ice and mixed-phase clouds are present and it is during twilight conditions.

IFR and near-IFR Conditions are observed along the coast at Newport and North Bend before the frontal passage. IFR Probabilities are high along the coastal range, somewhat reduced in the Willamette Valley, high again in the Cascades, and lower again downstream of the Cascades. Note how the higher IFR Probabilities do take into account the presence of terrain; brightness temperature difference fields use only satellite data. Thus, after the frontal passage, when near-surface winds are west and south-west (that is, upslope), the IFR Probabilities remain high on the windward side of mountain slopes. (They are typically high, for example, at Sexton Summit — over KSXT — where IFR conditions are present until about 1100 UTC)

Suomi-NPP Day/Night band data can sometimes be used to discern regions of cloudiness. However, the Moon Phase is now a waning crescent that has not quite risen at the times shown in the animation above.