Category Archives: New England

Dense Fog over New England

GOES13_BTD_11dec2015animg

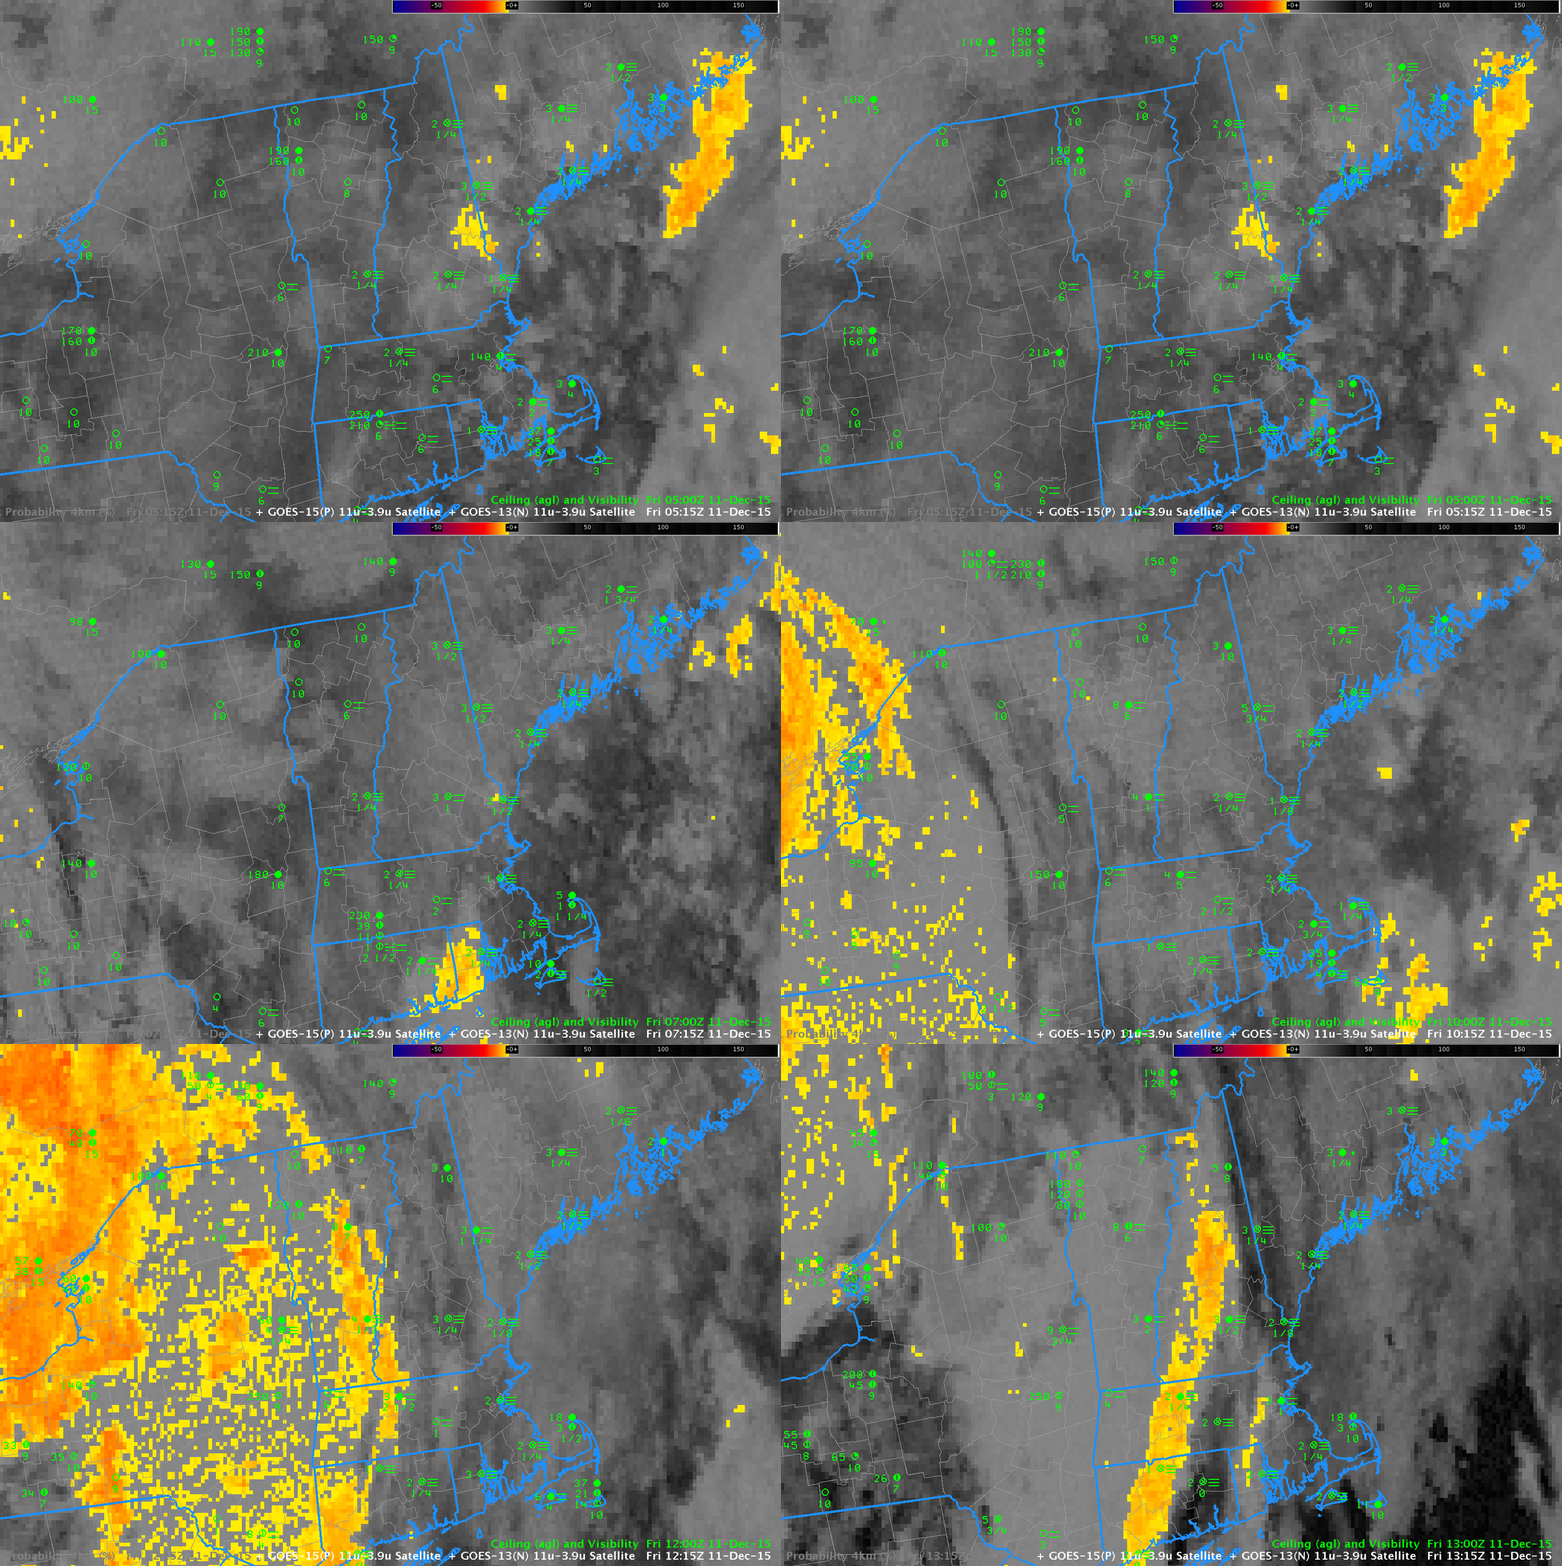
GOES-13 Brightness Temperature Difference Fields (10.7 µm – 3.9 µm), hourly from 0515 through 1315 UTC 11 December 2015 (Click to enlarge)

The brightness temperature difference field (10.7 µm – 3.9 µm), above, over New England during the morning of 11 December 2015 shows extensive cirrus cloud cover (a hole in the high clouds moves over Southern New England just before sunrise). Surface observations of ceilings and visibility show widespread IFR conditions, yet cirrus and mid-level clouds prevent a diagnosis of the low clouds.

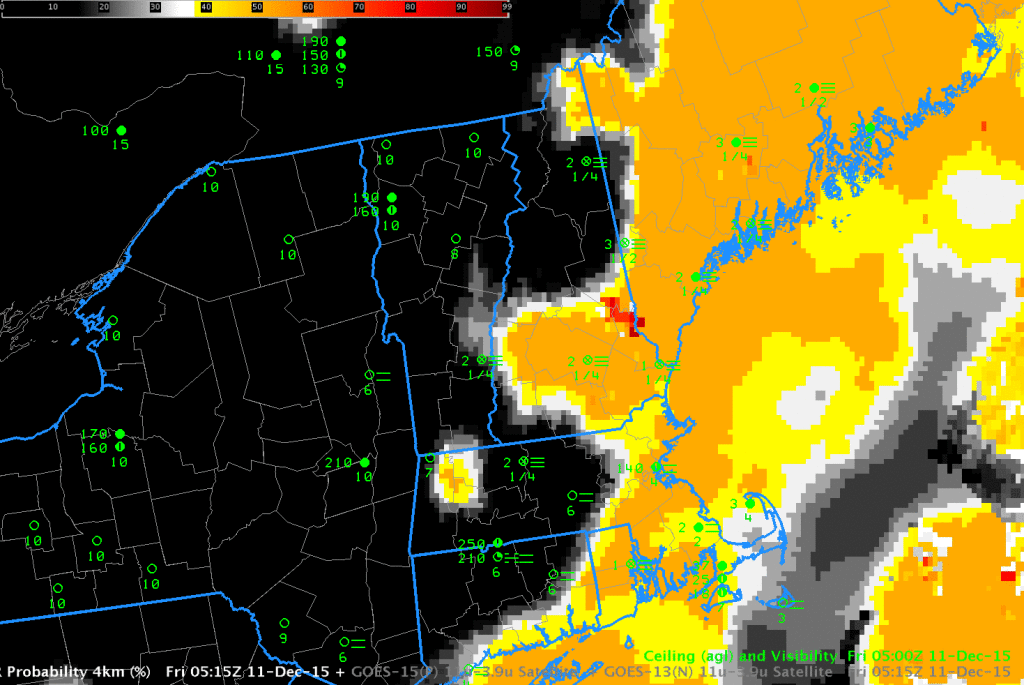
GOES-R IFR Probability fields for the same times, below, do show a strong signal (that is, higher probability of IFR conditions) in regions where IFR conditions are observed or where they have recently developed.  Because GOES-R IFR Probability fields incorporate information from the Rapid Refresh about low-level saturation.  Even if clouds decks obscure the view of near-surface clouds, as in this case, GOES-R IFR Probability fields, because they fuse together satellite data and surface information from the Rapid Refresh model, can provide useful information.

GOES13_IFR_11dec2015anim

GOES-R IFR Probability Fields, hourly from 0515 through 1315 UTC 11 December 2015 (Click to enlarge)

IFR Conditions with a strong extratropical Cyclone

NewEngland_1300_1400_12Nov2015toggle

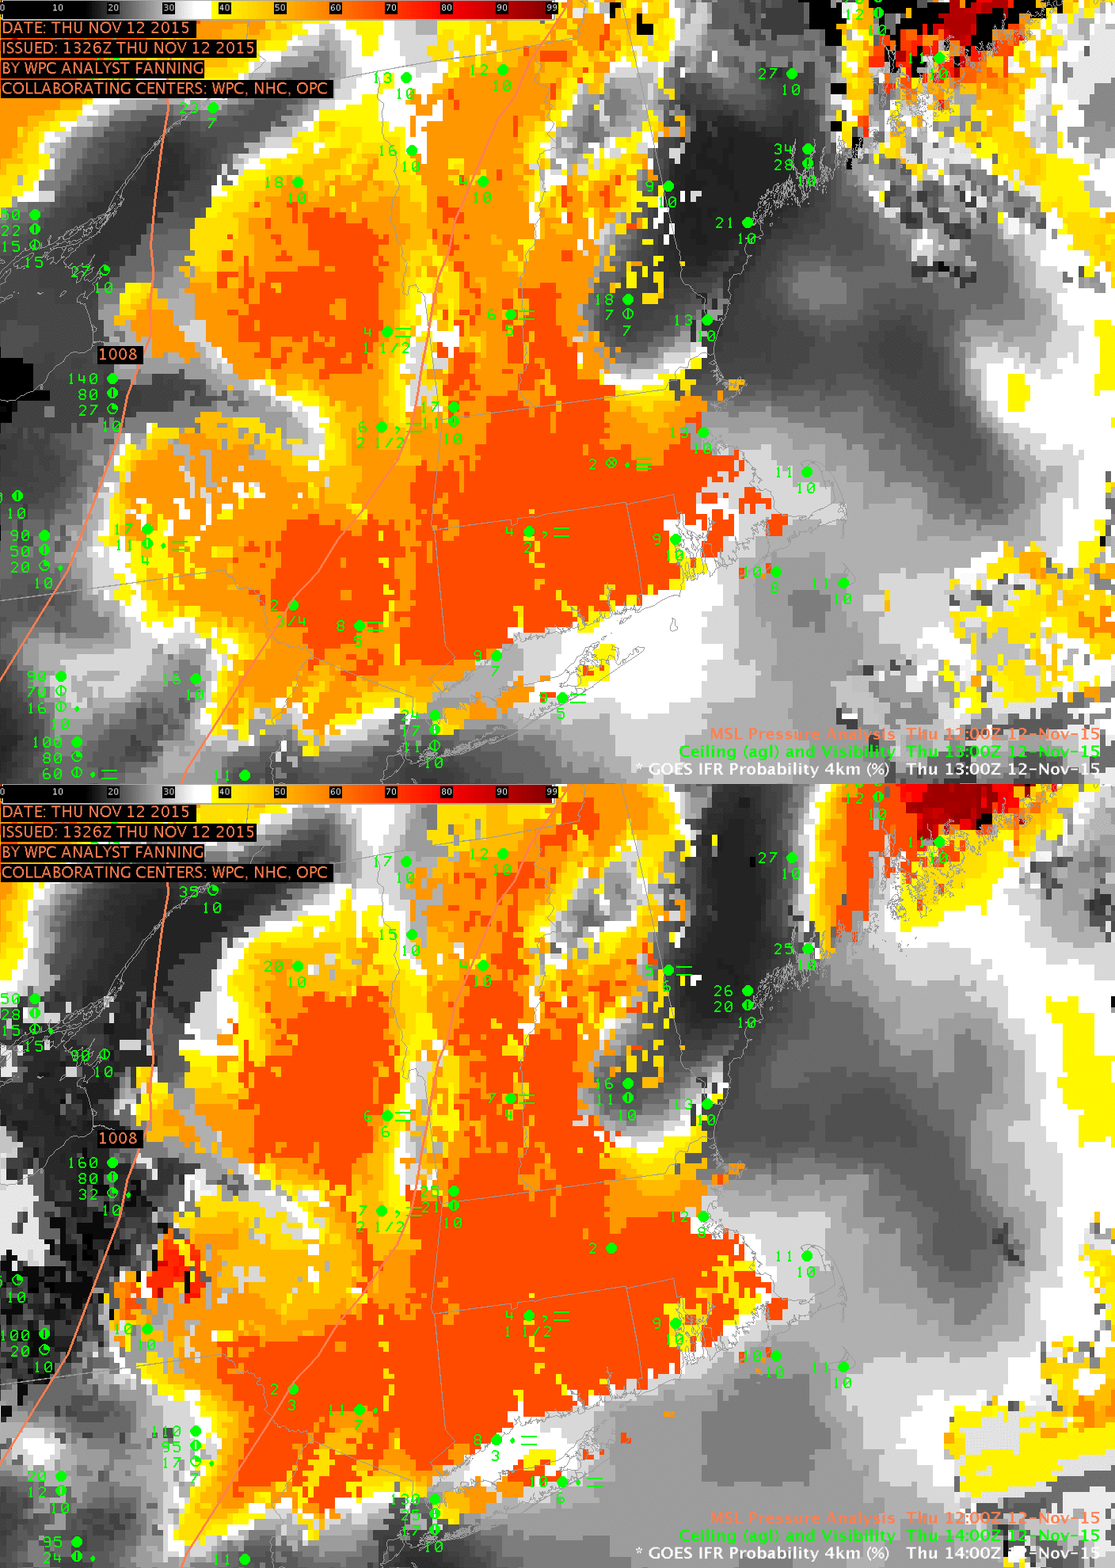
GOES-R IFR Probability Fields (from GOES-13 and the Rapid Refresh Model), 1300 and 1400 UTC on 12 November 2015 (click to enlarge)

Strong Extratropical Cyclones, such as the one affecting the central and eastern United States on 11-12 November 2015 (1200 UTC Map on 12 November is here), generate multiple levels of clouds that make it difficult to detect fog/low stratus from satellite, because intervening cloud layers get in the way. GOES-R IFR Probability fields, however, because they incorporate near-surface information from the Rapid Refresh Model, can yield useful information about the likelihood of IFR Conditions. The toggle above shows data at 1300 and 1400 UTC over the northeast United States.  Highest IFR Probabilities are removed from the coastlines of New England — as observations confirm.  Note how the Adirondack and Catskill regions have higher probabilities, where terrain is reaching up into the stratus deck.  Features in the IFR Probability field are strongly related to surface-based observations of fog and low stratus.

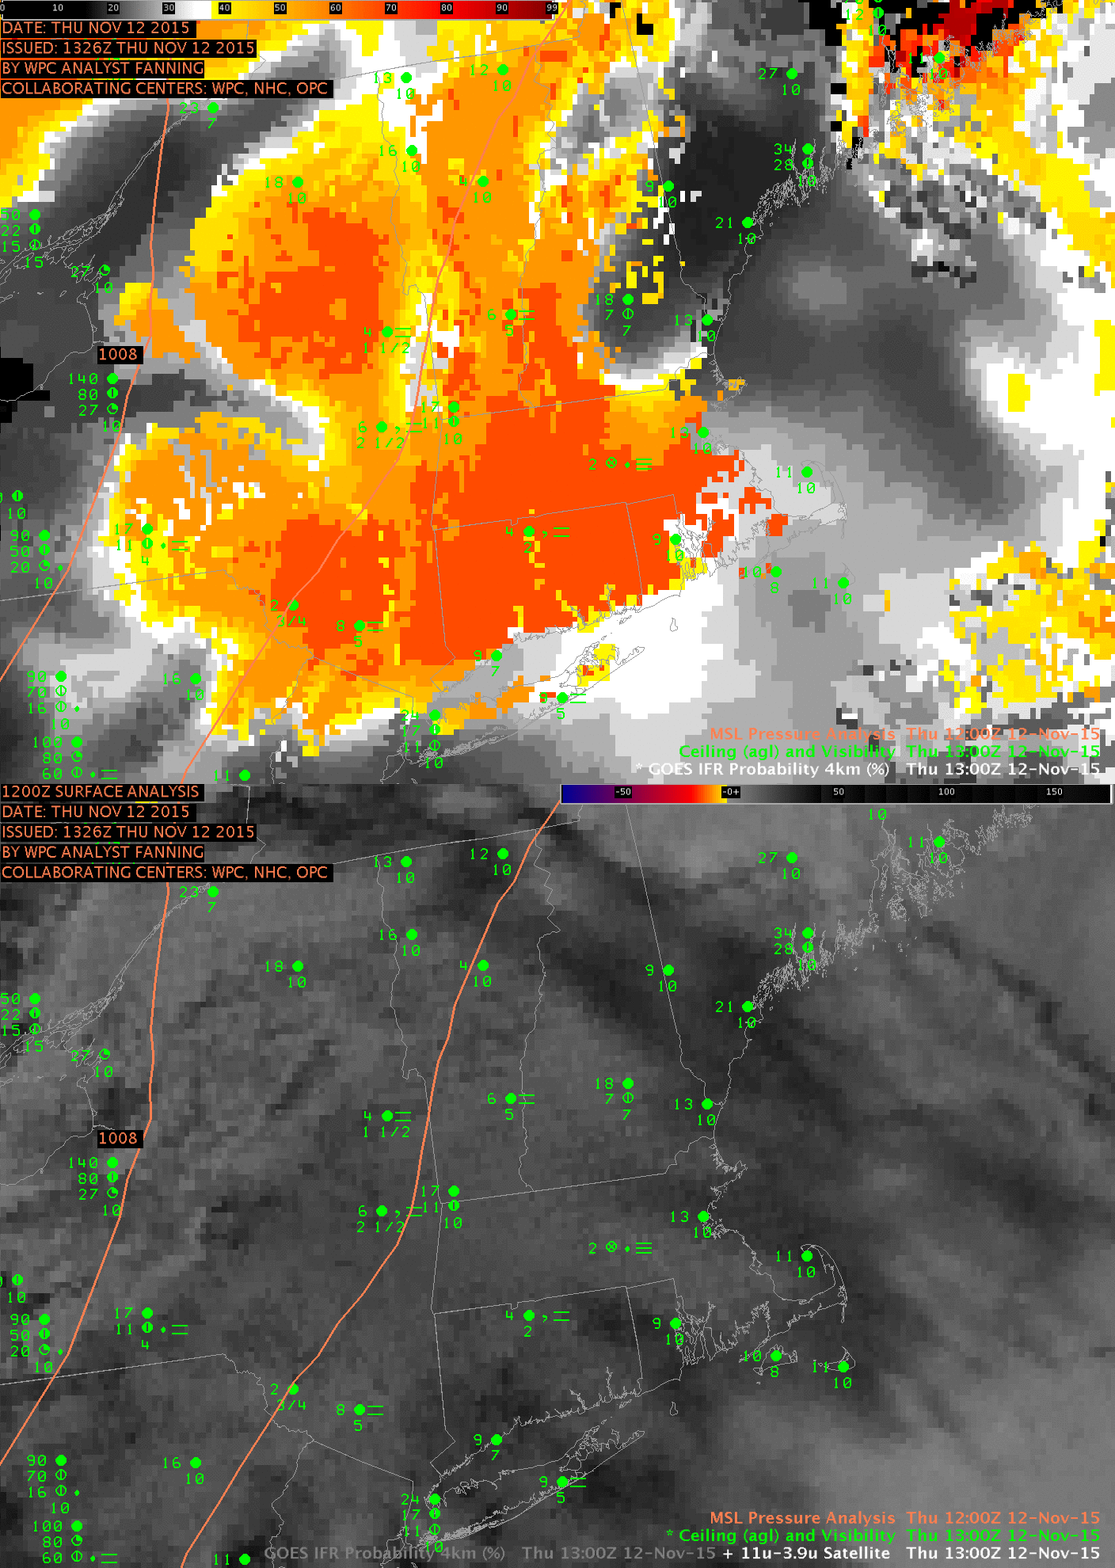
The toggle below shows IFR Probability fields and GOES-13 Brightness Temperature Differences as 1300 UTC.  Features in the brightness temperature difference field have no relationship to surface-based observations of fog and low stratus.

NewEnglandIFR_BTD_1300_12Nov2015toggle

GOES-R IFR Probability Fields (from GOES-13 and the Rapid Refresh Model) and GOES-13 Brightness Temperature Difference fields (10.7µm – 3.9µm), 1300 UTC on 12 November 2015 (click to enlarge)

IFR Conditions over eastern Massachusetts and the Cape

GOES_IFR_PROB_20150622_0315_1225anim

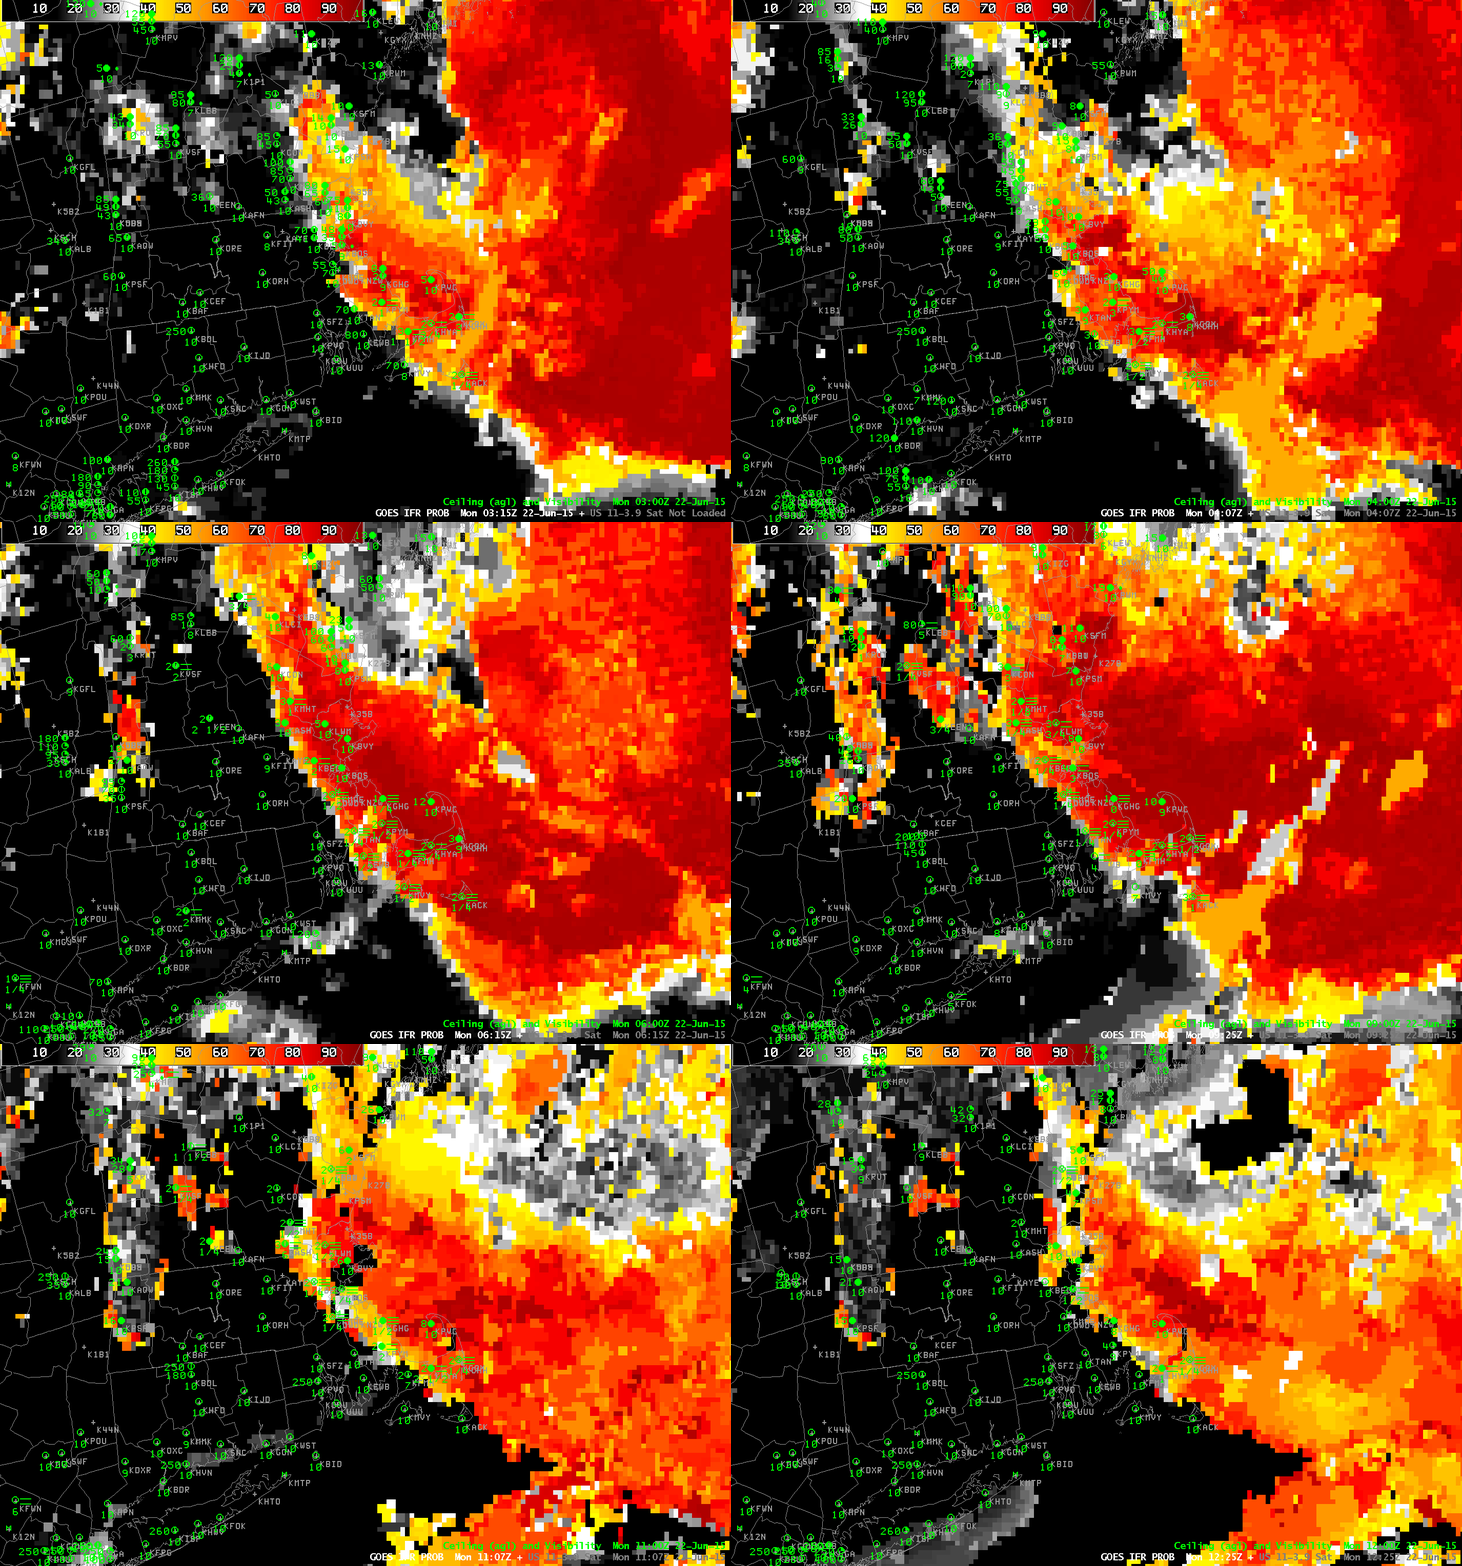
GOES-R IFR Probability, 0315 through 1215 UTC on 22 June 2015 (Click to enlarge)

Sea fog penetrated inland over eastern New England overnight. How did GOES-R IFR Probabilities depict the event, and how did those fields compare to the traditional fog-detection method, brightness temperature differences between the 10.7 µm and 3.9 µm channels? The animation above shows the IFR Probabilities, and they neatly outline the regions of low ceilings and reduced visibilities.

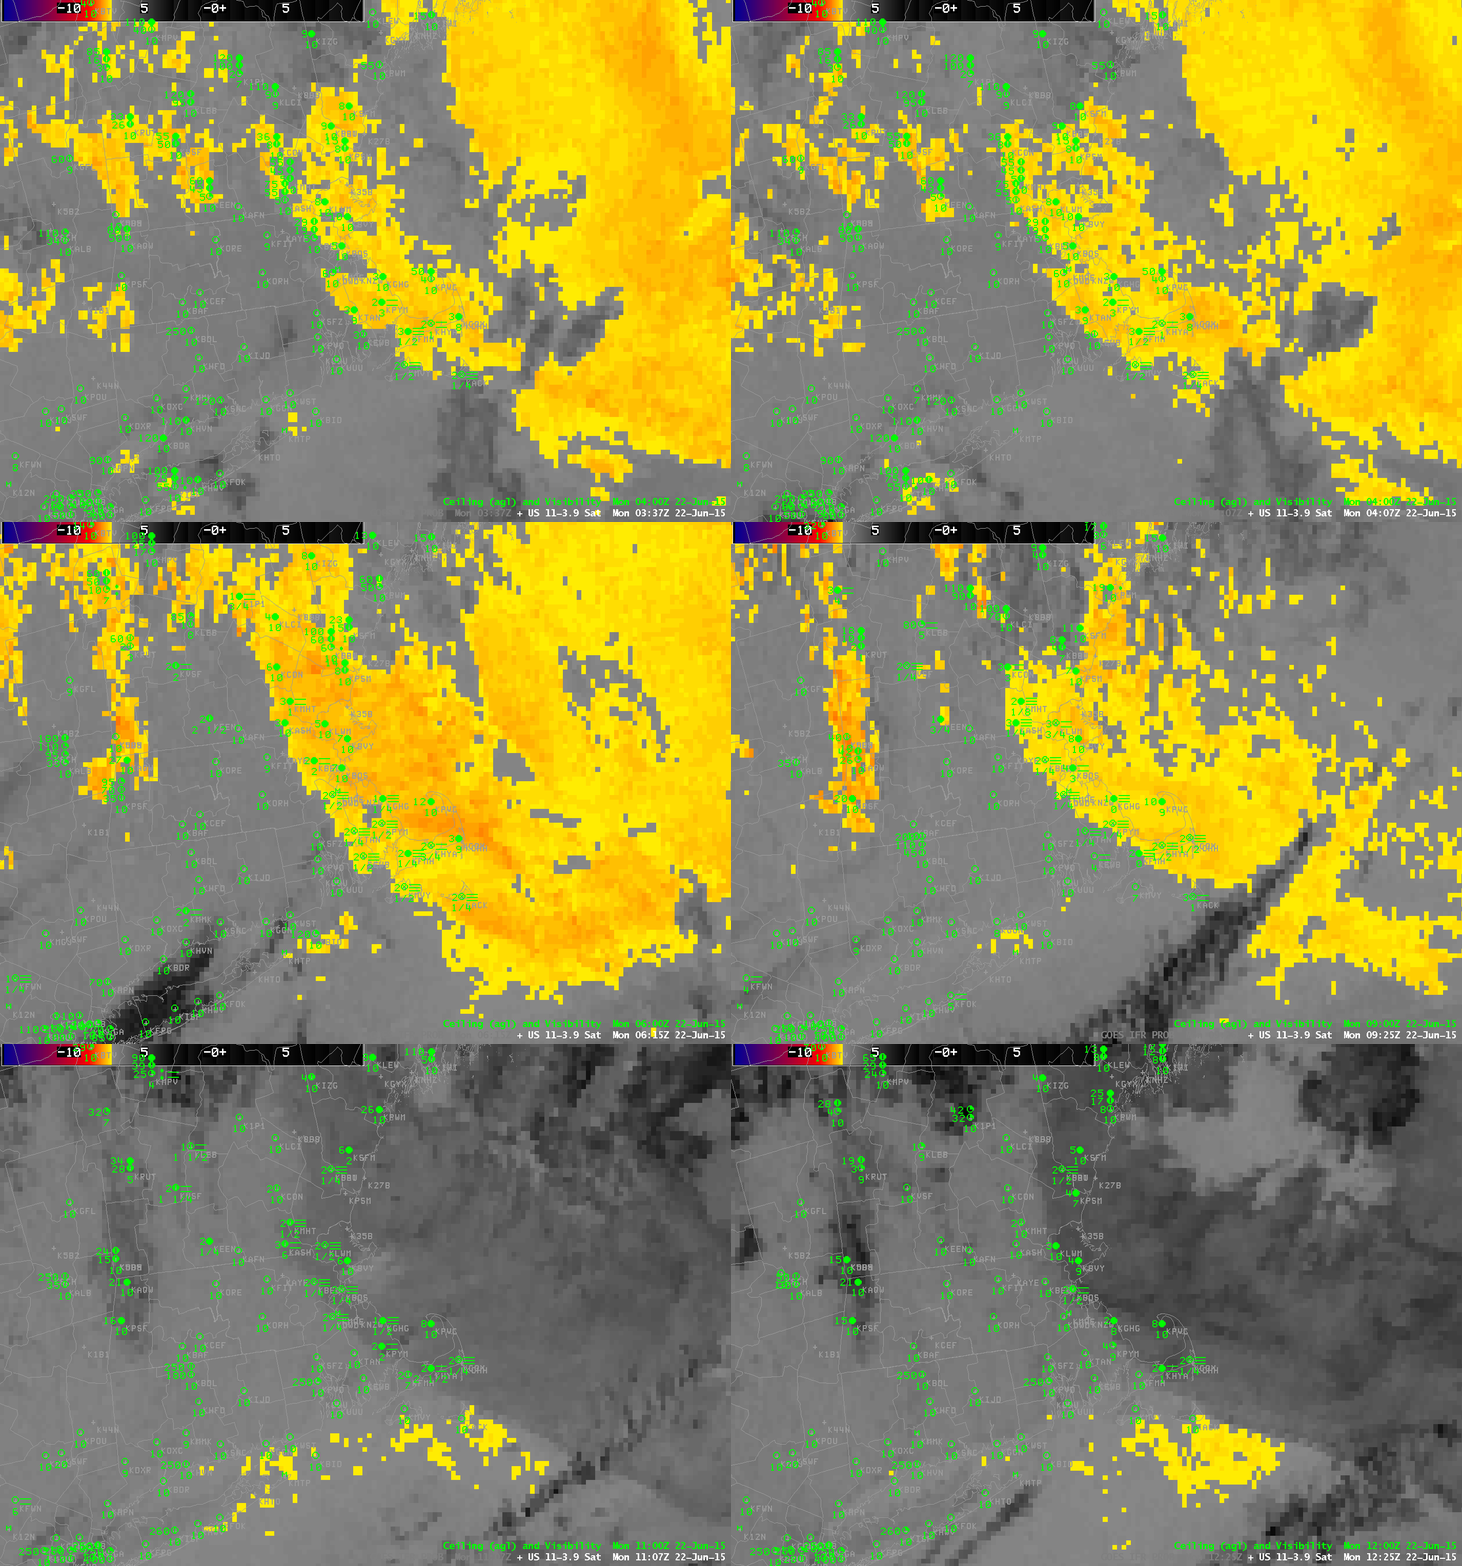
In contrast, Brightness Temperature Difference fields, shown below, are troubled by two different factors in these loops. Around 0700-0800 UTC, thin cirrus over southern Cape Cod impedes the satellite view of low clouds (Click here for a toggle between the two fields at 0722 UTC); brightness temperature difference fields yield little information when that happens. (GOES-R IFR Probability values drop when the Satellite component cannot be used; make certain when interpreting the values that you are aware of the presence/absence of high clouds!) In addition, the brightness temperature difference field loses features around sunrise, when solar radiation with a wavelength around 3.9 µm increases. GOES-R IFR Probability fields maintain a coherent signal through sunrise, however.

Careful inspection of the animation above does reveal some stations where IFR Conditions occur and IFR Probabilities are low. For example, Lebanon NH in the Connecticut River Valley reports IFR Conditions intermittently. Small-scale valley fog is a challenge for both GOES detection and for Rapid Refresh detection.

US_11-3.9_Sat_20150622_0337_1225anim

GOES-13 Brightness Temperature Difference Fields (10.7 µm – 3.9 µm), ~0315-1215 UTC on 22 June 2015 (Click to enlarge)

Dense Fog over eastern Maine

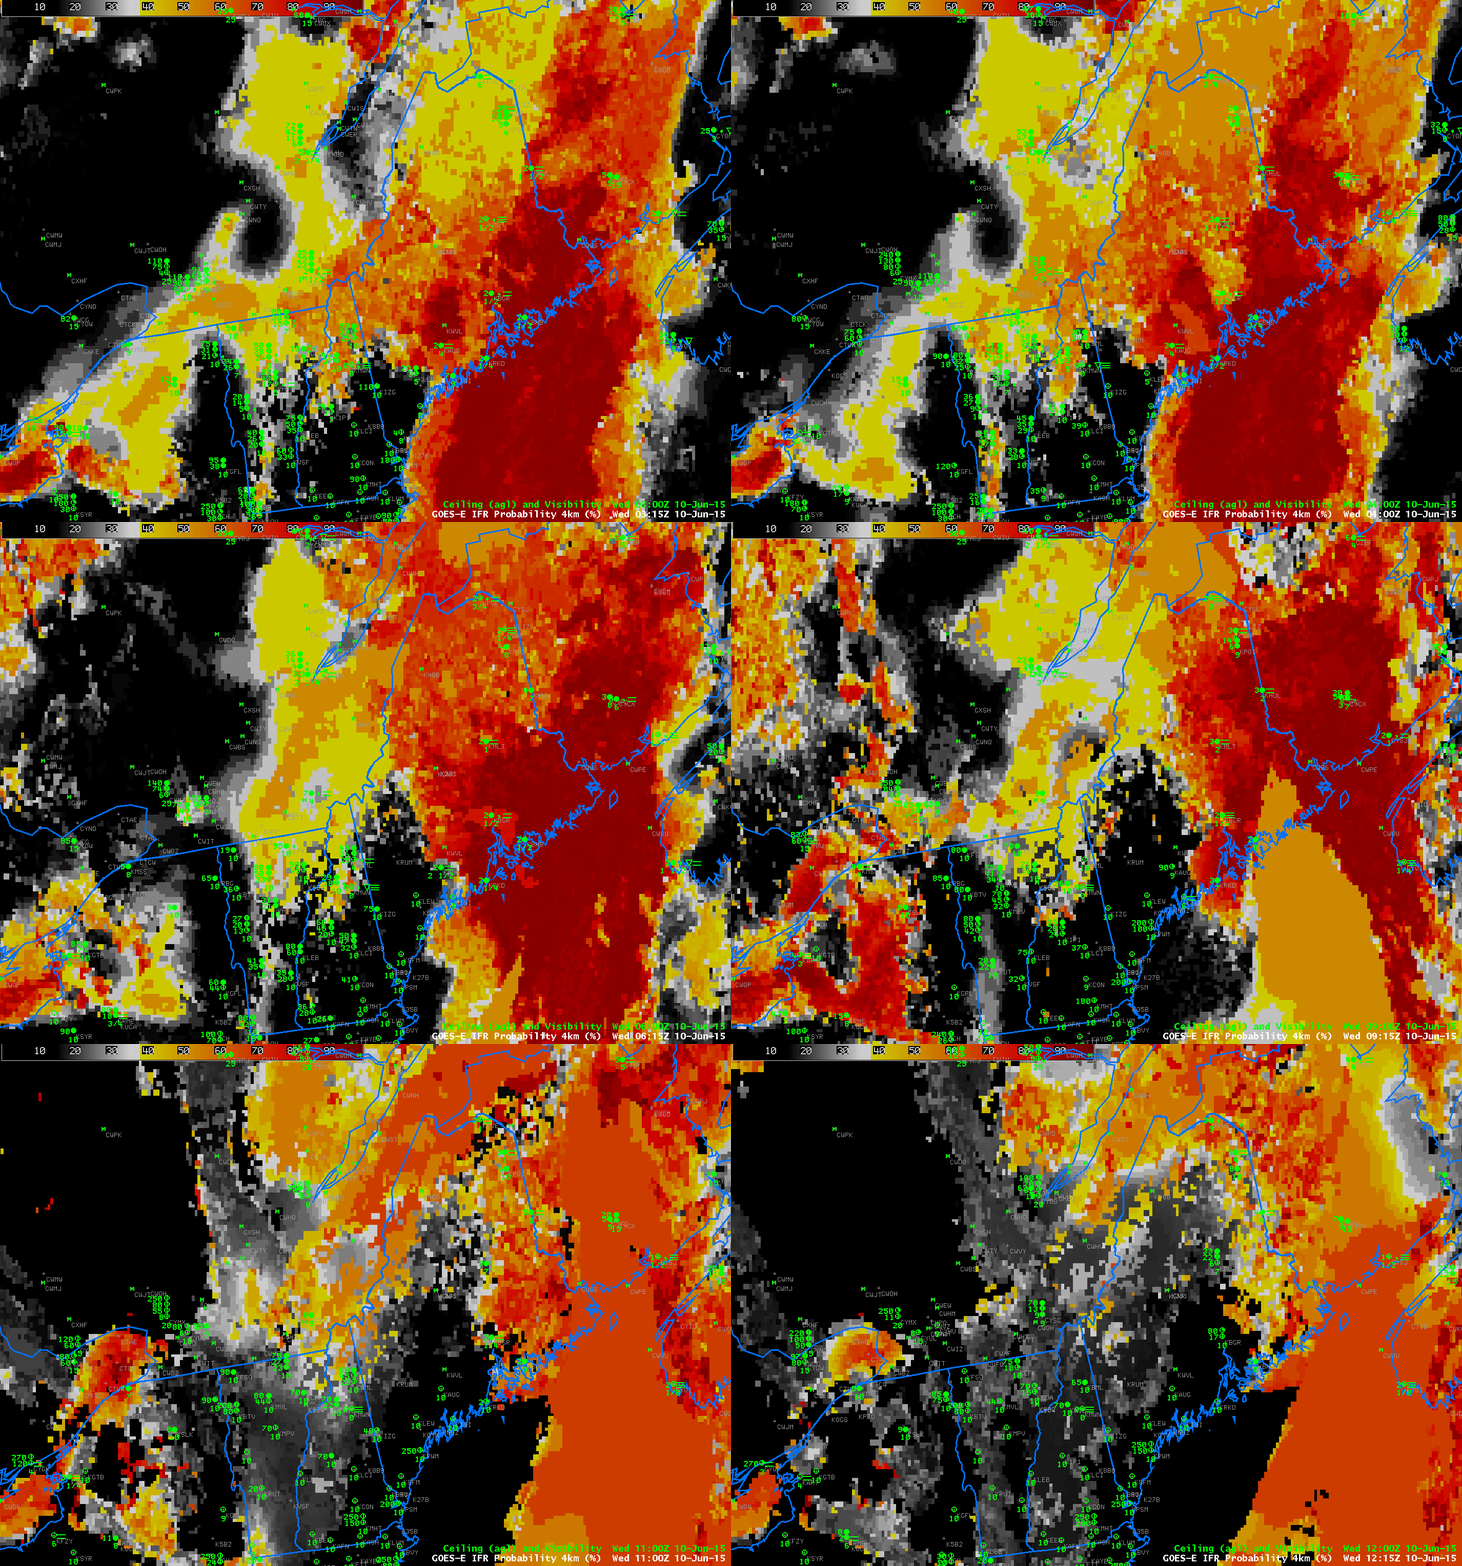
GOES_IFR_PROB_20150610anim_0315_1215

GOES-R IFR Probability Fields, hourly from 0315 to 1215 UTC on 10 June 2015 (Click to enlarge)

A cold front that moved across Maine early in the morning on 10 June 2015 was accompanied by dense fog. Dense Fog Advisories were hoisted over eastern Maine (screenshot from weather.gov; screenshot from the Caribou ME National Weather Service). The hourly imagery of IFR Probabilities, above, showed high probabilities over eastern Maine (where surface observations are scant). Note how the back edge of the high IFR Probabilities, after the frontal passage, correlates will with the timing of rising ceilings and reduced visibilities.  This occurs at Augusta (KAUG), Bangor (KBGR) and Millinocket (KMLT), for example.

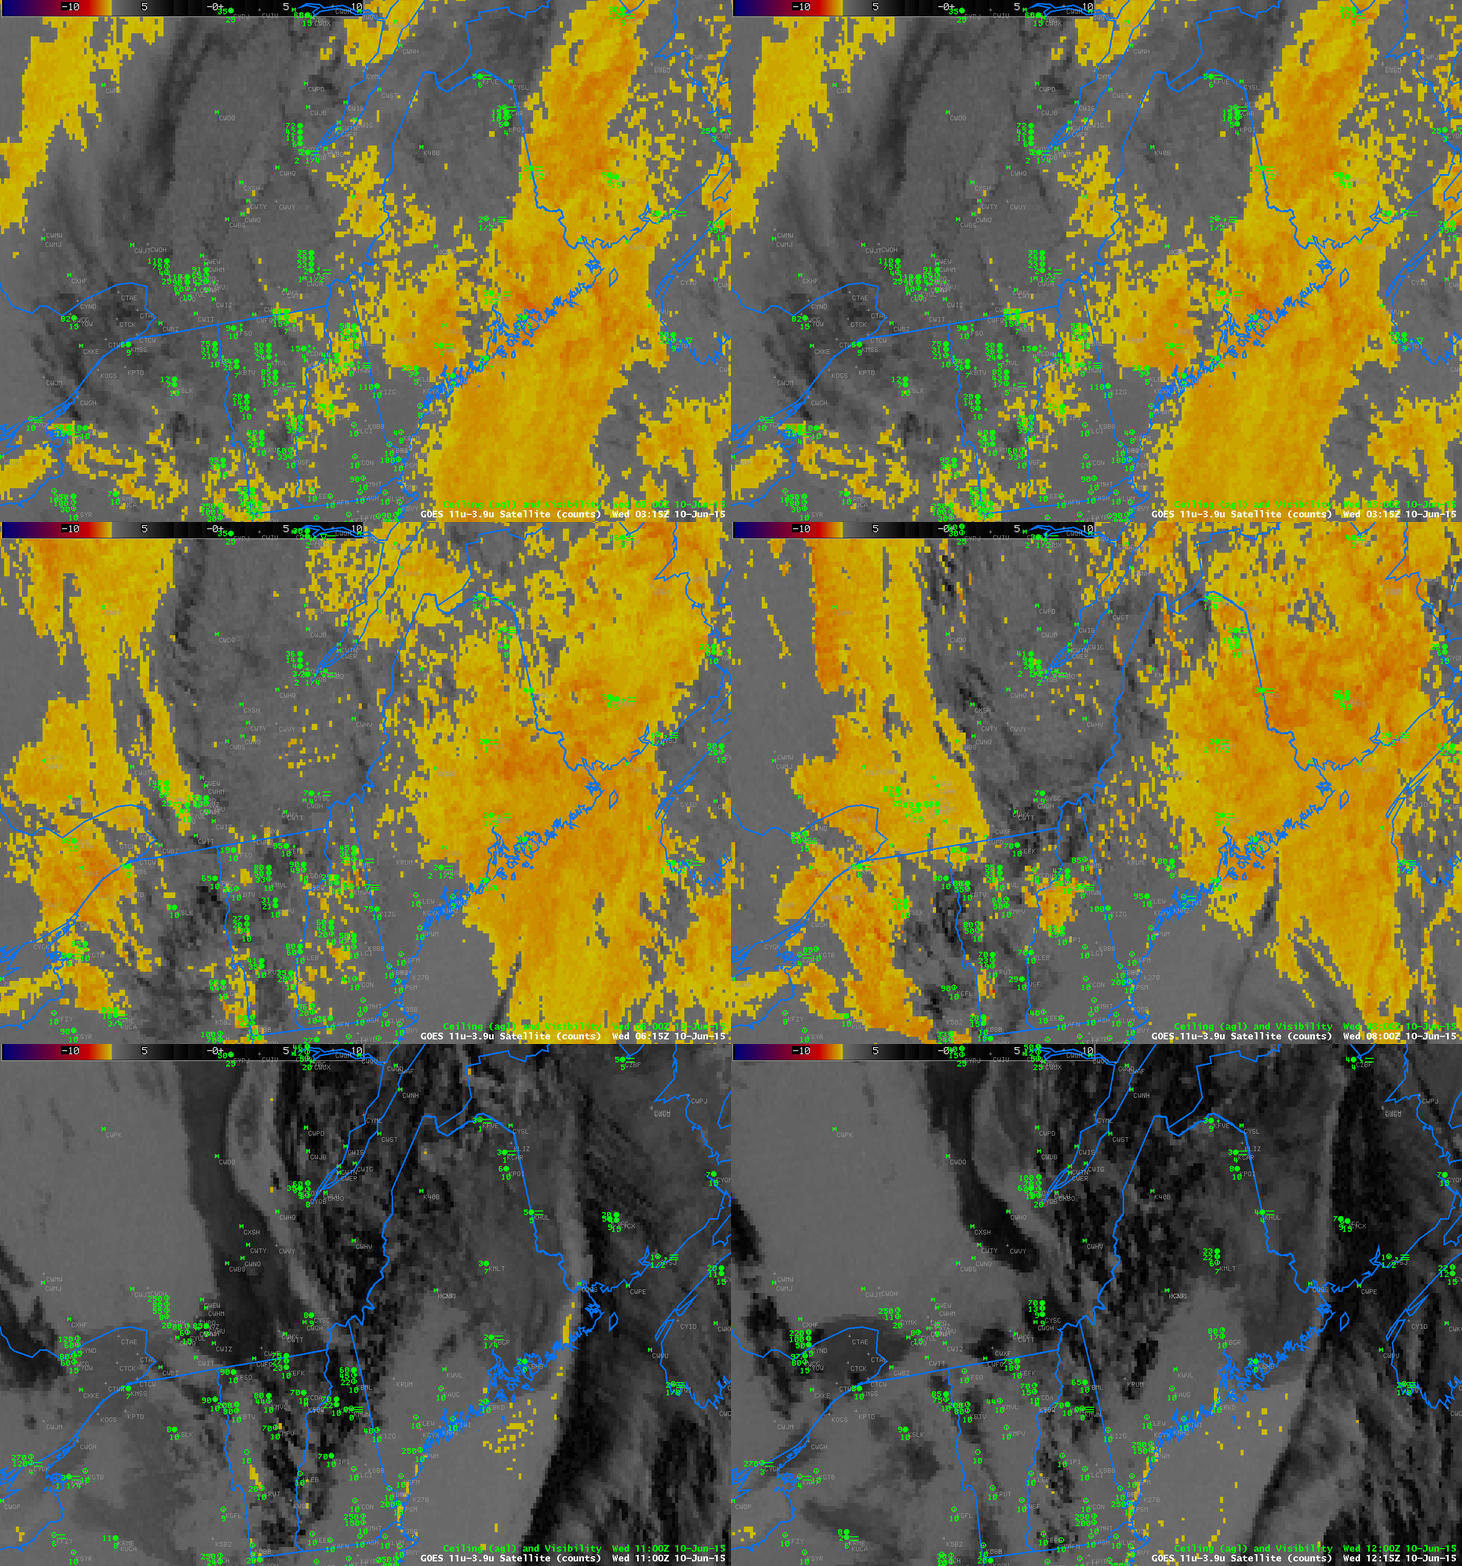
The traditional method of detecting fog and low cloud, the brightness temperature difference field that compares values at 10.7 µm and 3.9 µm , had difficulty indicating regions of fog for two reasons on the morning of 10 June.  An animation of the product is below.  There were high clouds present that interfered with the satellite’s view of low clouds.   (IFR Probability can still give a useful signal in this case because of information that comes from the Rapid Refresh Model).  In addition, the ever-earlier sunrise in early June supplies enough 3.9 µm radiation at the end of the animation to flip the sign of the brightness temperature difference field and the distinct signal of low water-based clouds is lost.

US_11-3.9_Sat_20150610anim_0315_1215

Brightness Temperature Difference Fields (10.7 µm – 3.9 µm), hourly from 0315 through 1215 UTC on 10 June 2015 (Click to enlarge)

IFR Probabilities with a back-door cold front

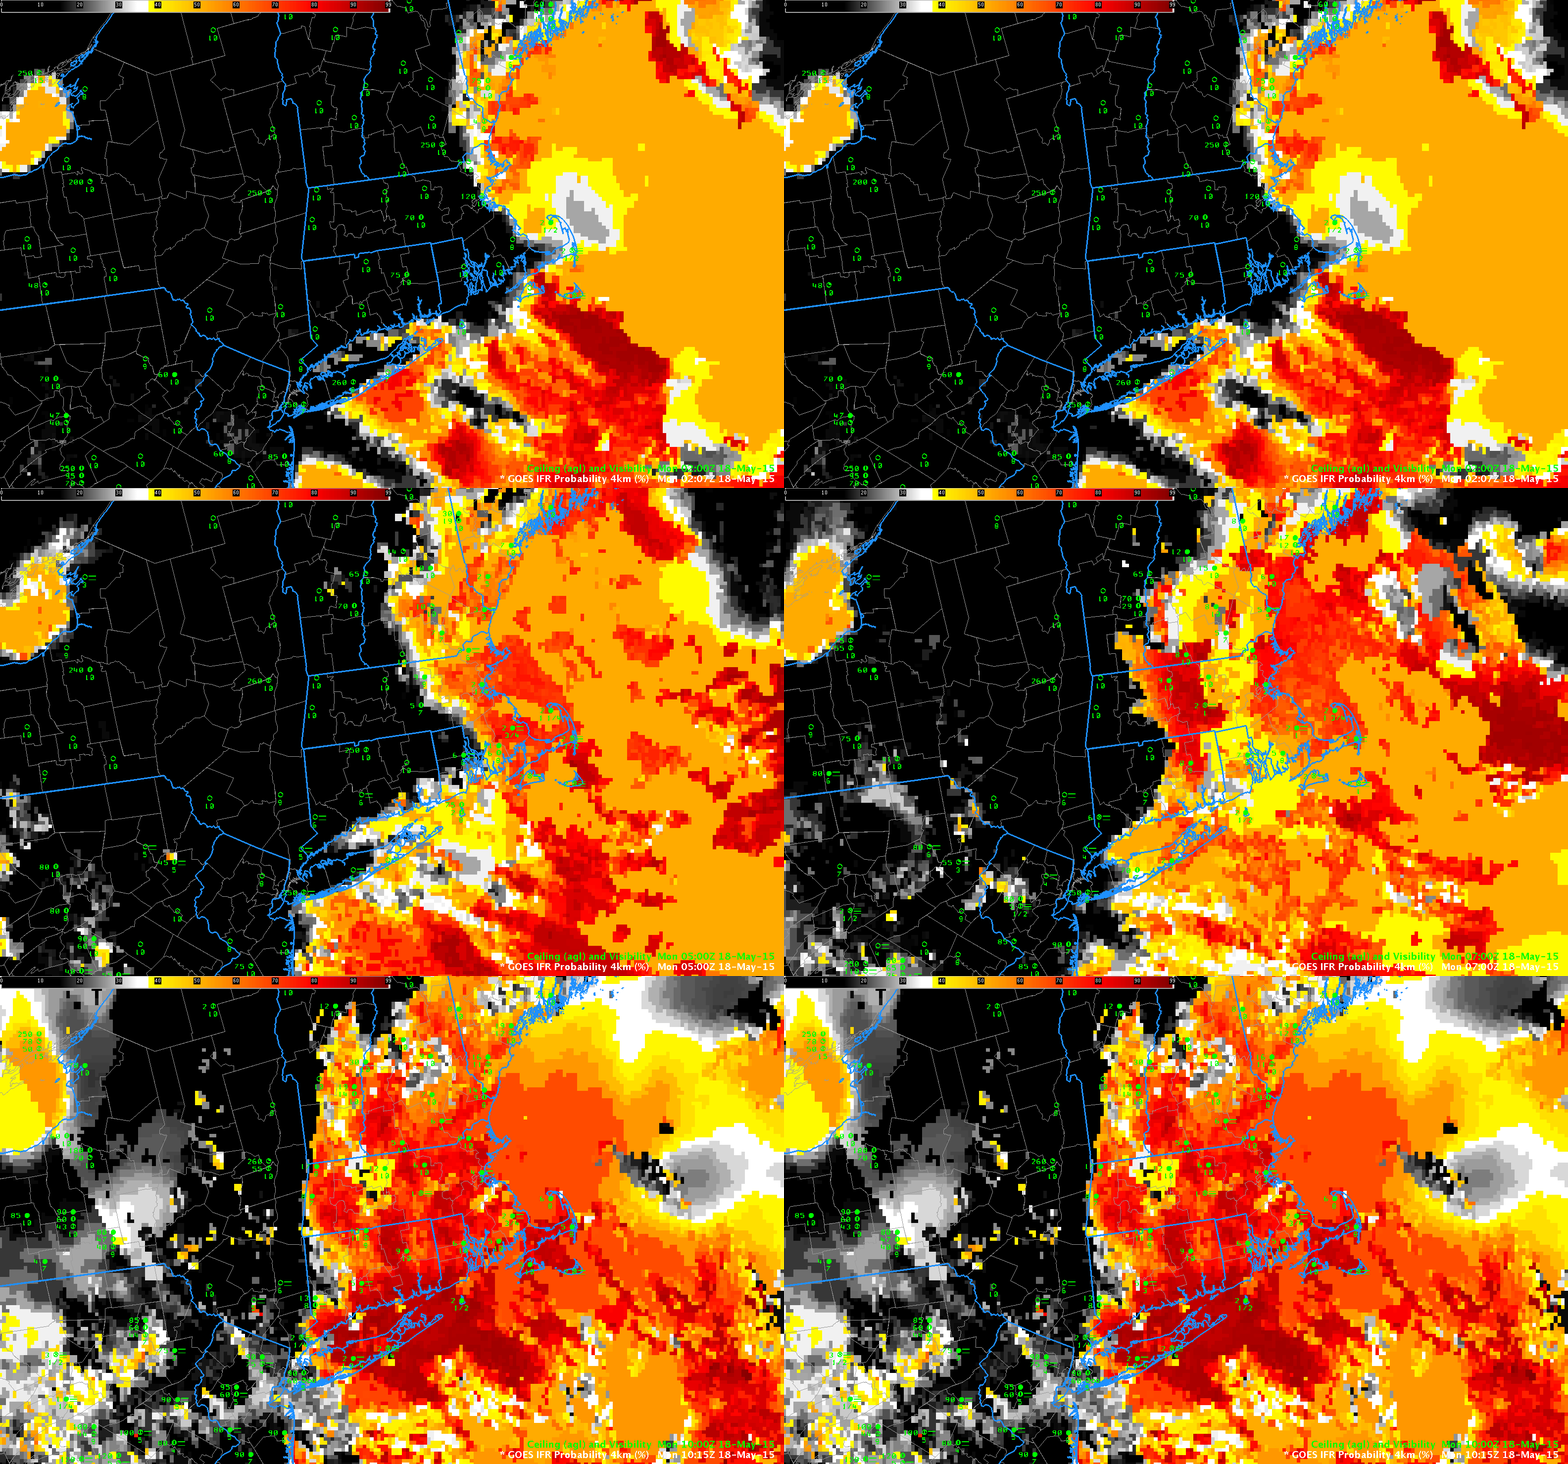
BackDoorCold_18May2015IFRanim

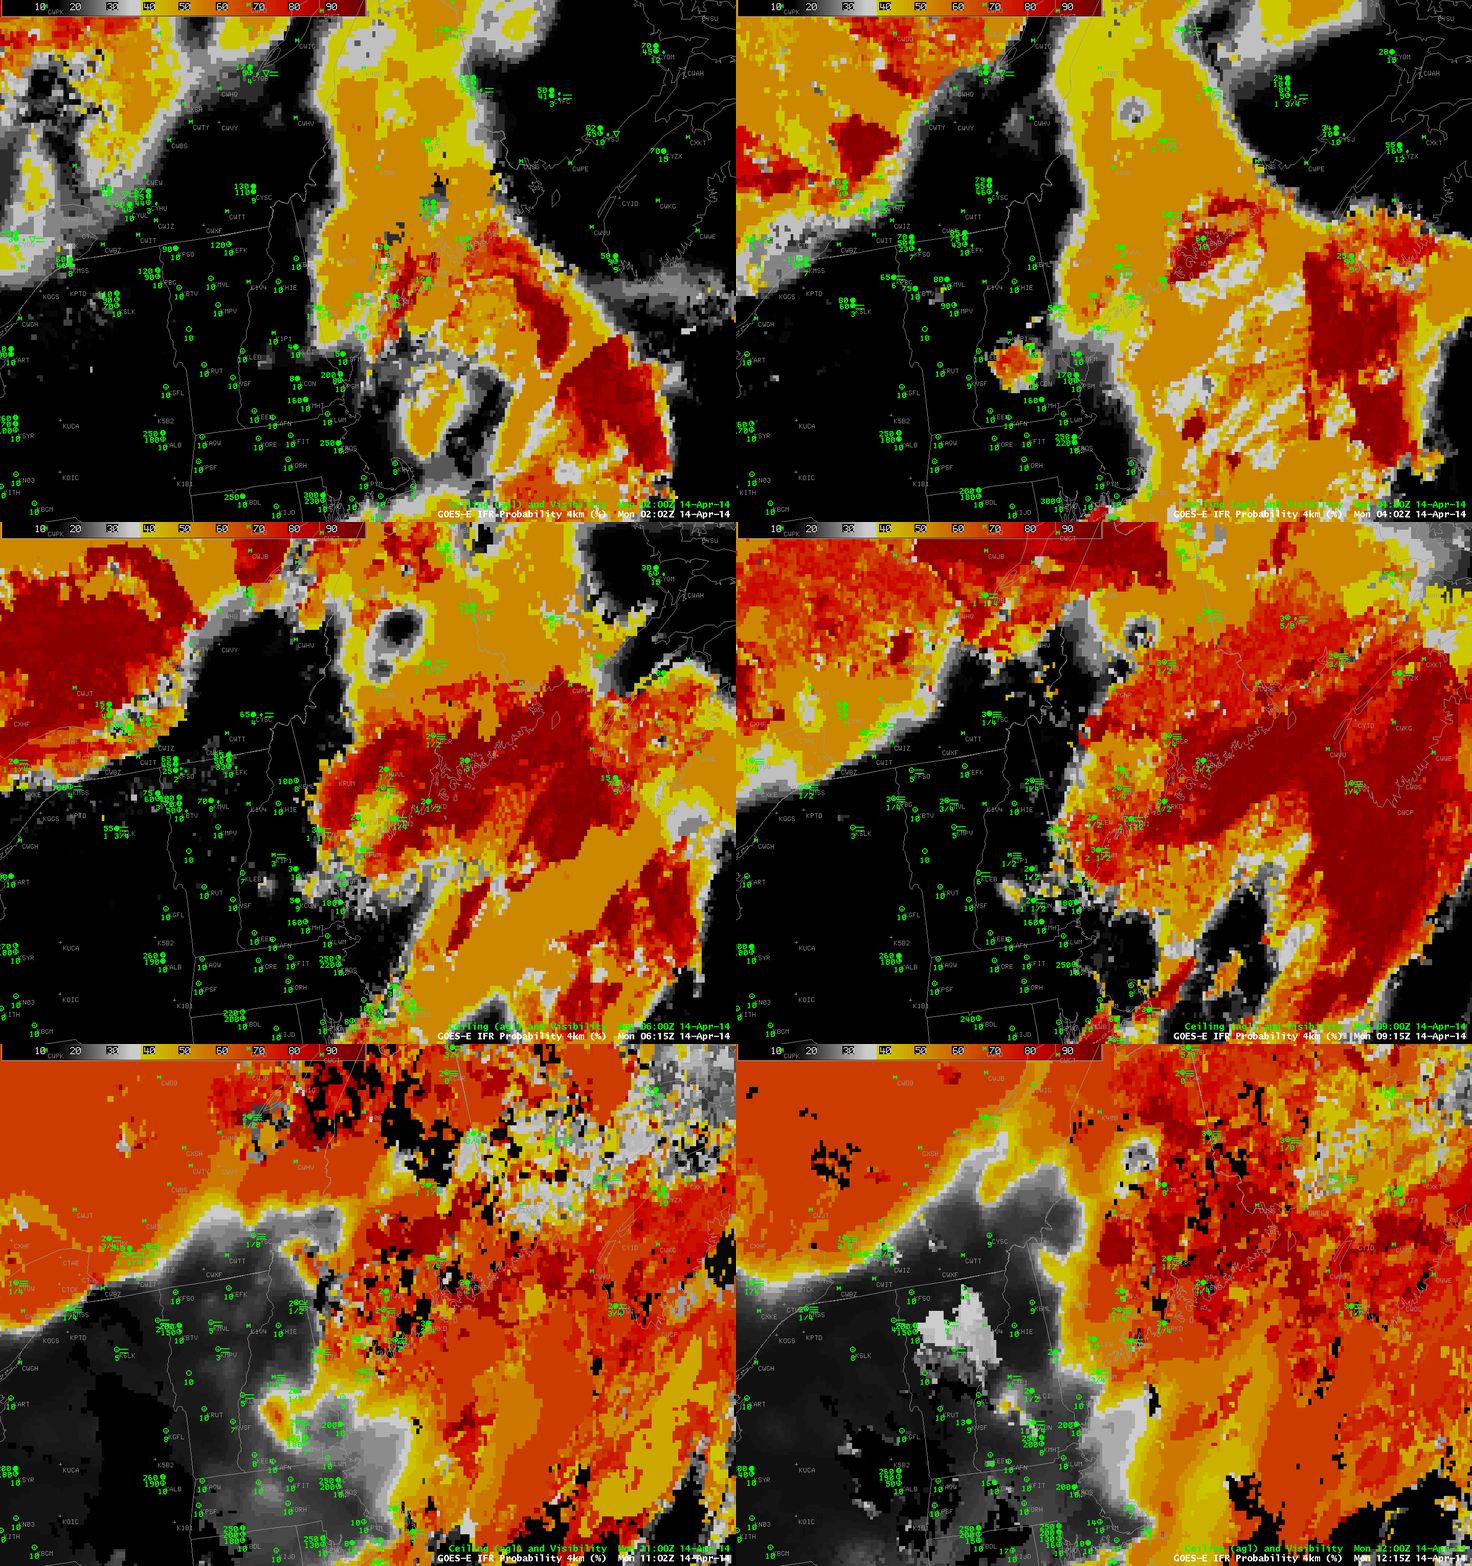
GOES-R IFR Probabilities, hourly from 0200 through 1015 UTC on 18 May 2015 (click to enlarge)

Easterly winds south of a High over the Canadian Maritimes ushered in cool, moist air over the Northeastern United States early on Monday. IFR Probabilities, above, show the progress of the low ceilings and reduced visibilities that accompanied the change in air mass. The low clouds eventually penetrated to the Delaware River, as shown in the GOES-14 SRSO-R animation here (from this blog post).

In the animation above, observations of ceilings and visibilities over southern New England approach IFR conditions quickly as the IFR Probability ‘front’ passes through.

Fog over Southeast New England

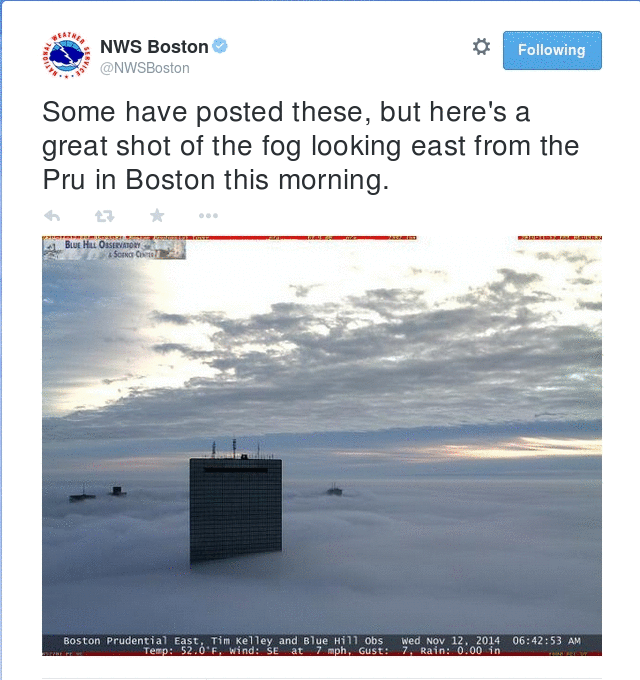
Fog overspread much of southern New England overnight on 11-12 November 2014.
BostonTweet7AM_12Nov2014

Downtown Boston, Fogbound, Wednesday Morning 12 Nov 2014 (Photo Credit: Blue Hill Observatory)

From the National Weather Service in Taunton, MA, late in the day on 11 November 2014:

000
WWUS81 KBOX 120001
SPSBOX

SPECIAL WEATHER STATEMENT
NATIONAL WEATHER SERVICE TAUNTON MA
701 PM EST TUE NOV 11 2014

CTZ002>004-MAZ002>024-026-NHZ011-012-015-RIZ001>008-120415-
HARTFORD CT-TOLLAND CT-WINDHAM CT-WESTERN FRANKLIN MA-
EASTERN FRANKLIN MA-NORTHERN WORCESTER MA-CENTRAL MIDDLESEX MA-
WESTERN ESSEX MA-EASTERN ESSEX MA-WESTERN HAMPSHIRE MA-
WESTERN HAMPDEN MA-EASTERN HAMPSHIRE MA-EASTERN HAMPDEN MA-
SOUTHERN WORCESTER MA-WESTERN NORFOLK MA-SOUTHEAST MIDDLESEX MA-
SUFFOLK MA-EASTERN NORFOLK MA-NORTHERN BRISTOL MA-
WESTERN PLYMOUTH MA-EASTERN PLYMOUTH MA-SOUTHERN BRISTOL MA-
SOUTHERN PLYMOUTH MA-BARNSTABLE MA-DUKES MA-NANTUCKET MA-
NORTHERN MIDDLESEX MA-CHESHIRE NH-EASTERN HILLSBOROUGH NH-
WESTERN AND CENTRAL HILLSBOROUGH NH-NORTHWEST PROVIDENCE RI-
SOUTHEAST PROVIDENCE RI-WESTERN KENT RI-EASTERN KENT RI-
BRISTOL RI-WASHINGTON RI-NEWPORT RI-BLOCK ISLAND RI-
INCLUDING THE CITIES OF…HARTFORD…WINDSOR LOCKS…UNION…
VERNON…PUTNAM…WILLIMANTIC…CHARLEMONT…GREENFIELD…
ORANGE…BARRE…FITCHBURG…FRAMINGHAM…LOWELL…LAWRENCE…
GLOUCESTER…CHESTERFIELD…BLANDFORD…AMHERST…NORTHAMPTON…
SPRINGFIELD…MILFORD…WORCESTER…FOXBORO…NORWOOD…
CAMBRIDGE…BOSTON…QUINCY…TAUNTON…BROCKTON…PLYMOUTH…
FALL RIVER…NEW BEDFORD…MATTAPOISETT…CHATHAM…FALMOUTH…
PROVINCETOWN…VINEYARD HAVEN…NANTUCKET…AYER…JAFFREY…
KEENE…MANCHESTER…NASHUA…PETERBOROUGH…WEARE…FOSTER…
SMITHFIELD…PROVIDENCE…WEST GREENWICH…WARWICK…BRISTOL…
NARRAGANSETT…WESTERLY…NEWPORT…BLOCK ISLAND
701 PM EST TUE NOV 11 2014

…PATCHY DENSE FOG POSSIBLE OVERNIGHT INTO WEDNESDAY MORNING…

A WARM AND MOIST AIRMASS BY NOVEMBER STANDARDS WAS OVER
CONNECTICUT… RHODE ISLAND…MASSACHUSETTS AND INTO NEW HAMPSHIRE
THIS EVENING. THIS COMBINED WITH LIGHT WINDS WILL RESULT IN PATCHY
DENSE FOG OVERNIGHT INTO WEDNESDAY MORNING. THERE IS SOME
UNCERTAINTY ON HOW WIDESPREAD THE FOG WILL BE. THUS A DENSE FOG
ADVISORY HAS NOT BEEN POSTED. HOWEVER AT LEAST SOME PATCHY DENSE
FOG IS LIKELY OVERNIGHT. THEREFORE MORNING COMMUTERS SHOULD PLAN
SOME EXTRA TIME TO REACH THEIR DESTINATION. IF FORECAST CONFIDENCE
ON WIDESPREAD DENSE FOG INCREASES LATER THIS EVENING A DENSE FOG
ADVISORY WILL BE ISSUED.

$$

NOCERA

Subsequently, the NWS in Taunton tweeted two times about the fog.

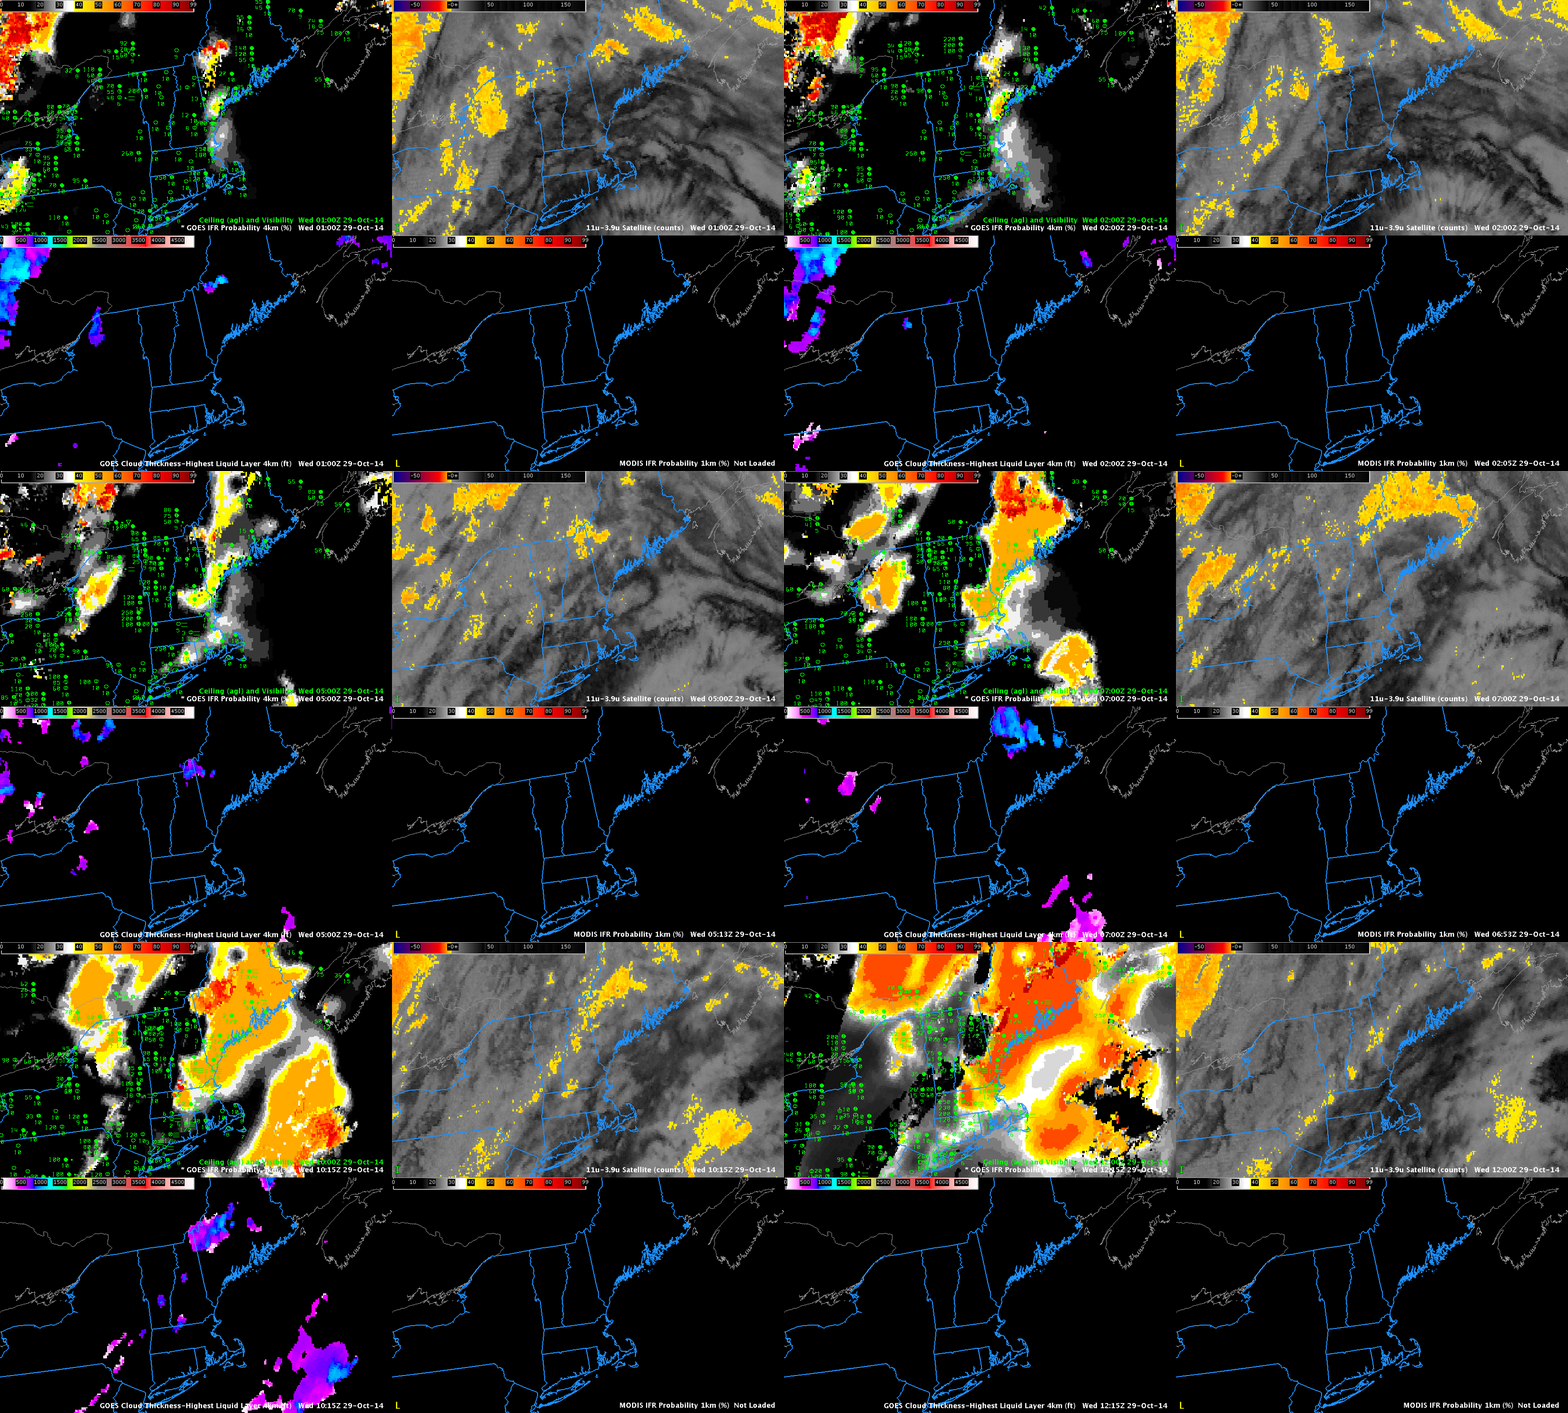
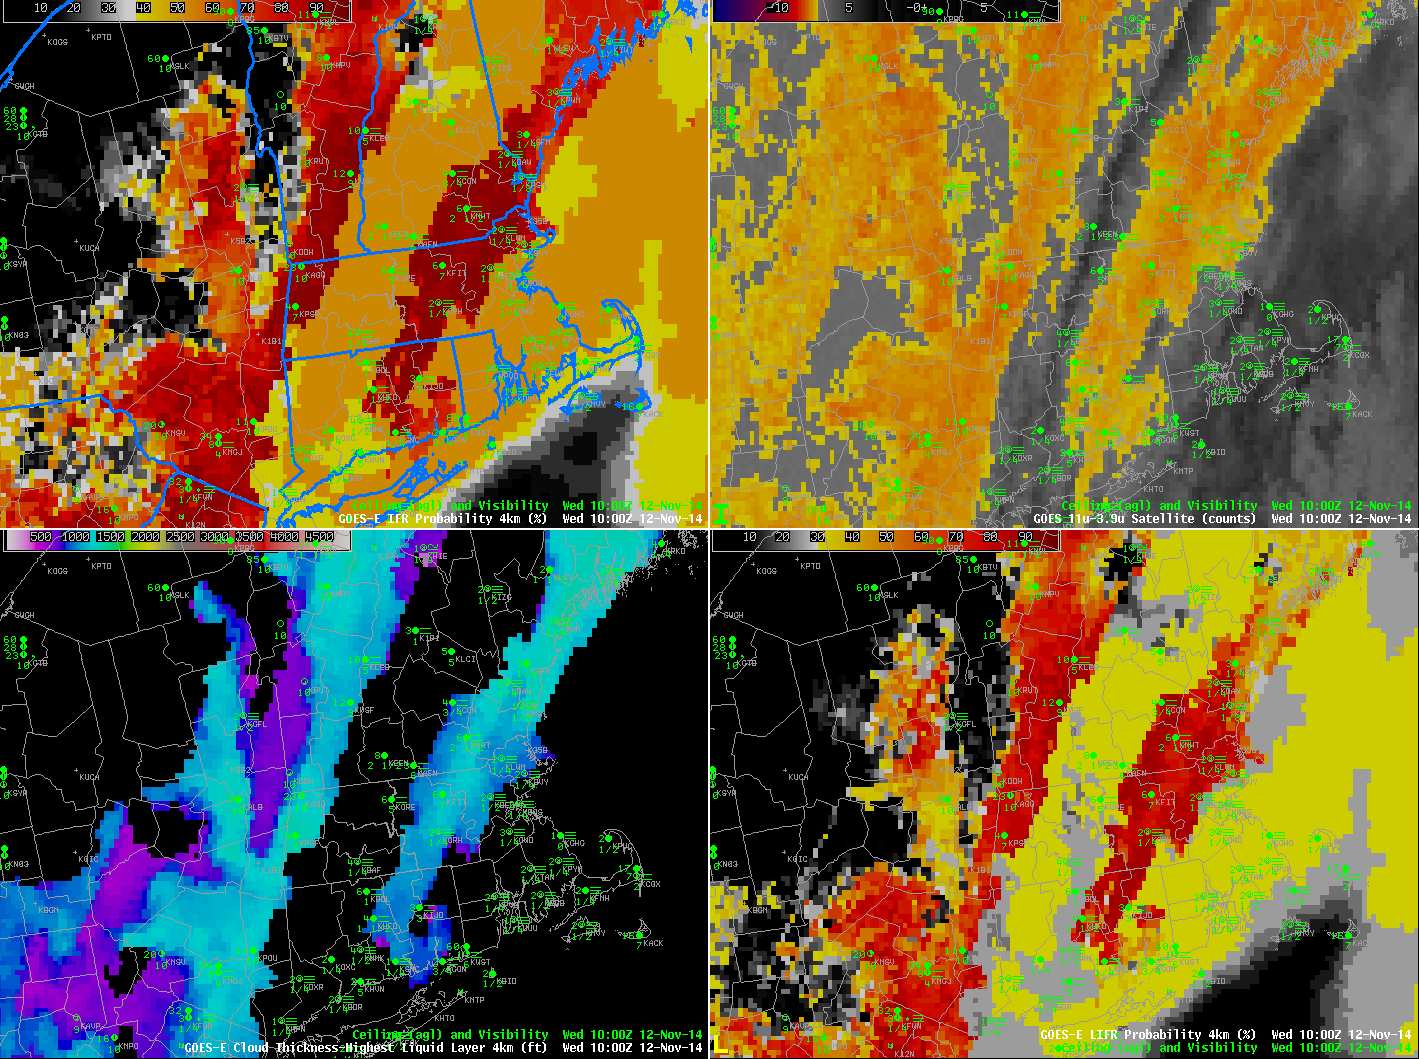
How well did the GOES-R IFR Probability Fields diagnose this fog event? Note the presence of high and mid-level clouds in the picture at top, from the morning of 12 November. Their signature should be in the IFR Probability fields as well, and that is the case.
GOES_IFR_PROB_20141112_0100-1215

GOES-R IFR Probabilities (Upper Left), GOES-East Brightness Temperature Difference (10.7 µm – 3.9 µm) (Upper Right), GOES-R Cloud Thickness (Lower Left) and GOES-R Low IFR Probability (Lower Right) (Click to animate)

In the animation above, the effect of high clouds is obvious on the IFR (and Low IFR) Probability fields: when mid-level or high clouds prevent satellite data from being used as a predictor in IFR Probability fields, then model data are the main predictors. Model data have coarse resolution relative to satellite data so the IFR Probability fields in those regions have a smoother look that is not at all pixelated. Note how a signal in of low clouds in the Brightness Temperature Difference Field (orange or yellow enhancement) nearly overlaps the more pixelated parts of the IFR and Low IFR Probability fields. Where cirrus/mid-level clouds are indicated in the brightness temperature difference fields, IFR and Low IFR Probability fields are smoother; these are also regions where the GOES-R Cloud Thickness (which field is of the thickness of the highest water-based cloud viewed by the satellite) is not computed because ice-based clouds are screening any satellite view of water-based clouds.

Note how southeastern Massachussetts in the animation above — under multiple cloud layers — has relatively small IFR and low IFR (LIFR) Probability values in a region where dense fog is reported. This arises because the model being used — the Rapid Refresh — to generate IFR Probability predictors is not saturating in the lower levels. It is important to remember that when satellite data are missing, only model data are used to generate GOES-R Fog/Low Stratus products. To rely on only the IFR Probability fields as an indication of the presence of fog is to believe the model simulation in that region is correct. Sometimes the model simulation is correct (this case, for example); in the present case, however, there were regions in southeastern Massachusetts where the model forecast did not accurately represent the observed conditions.

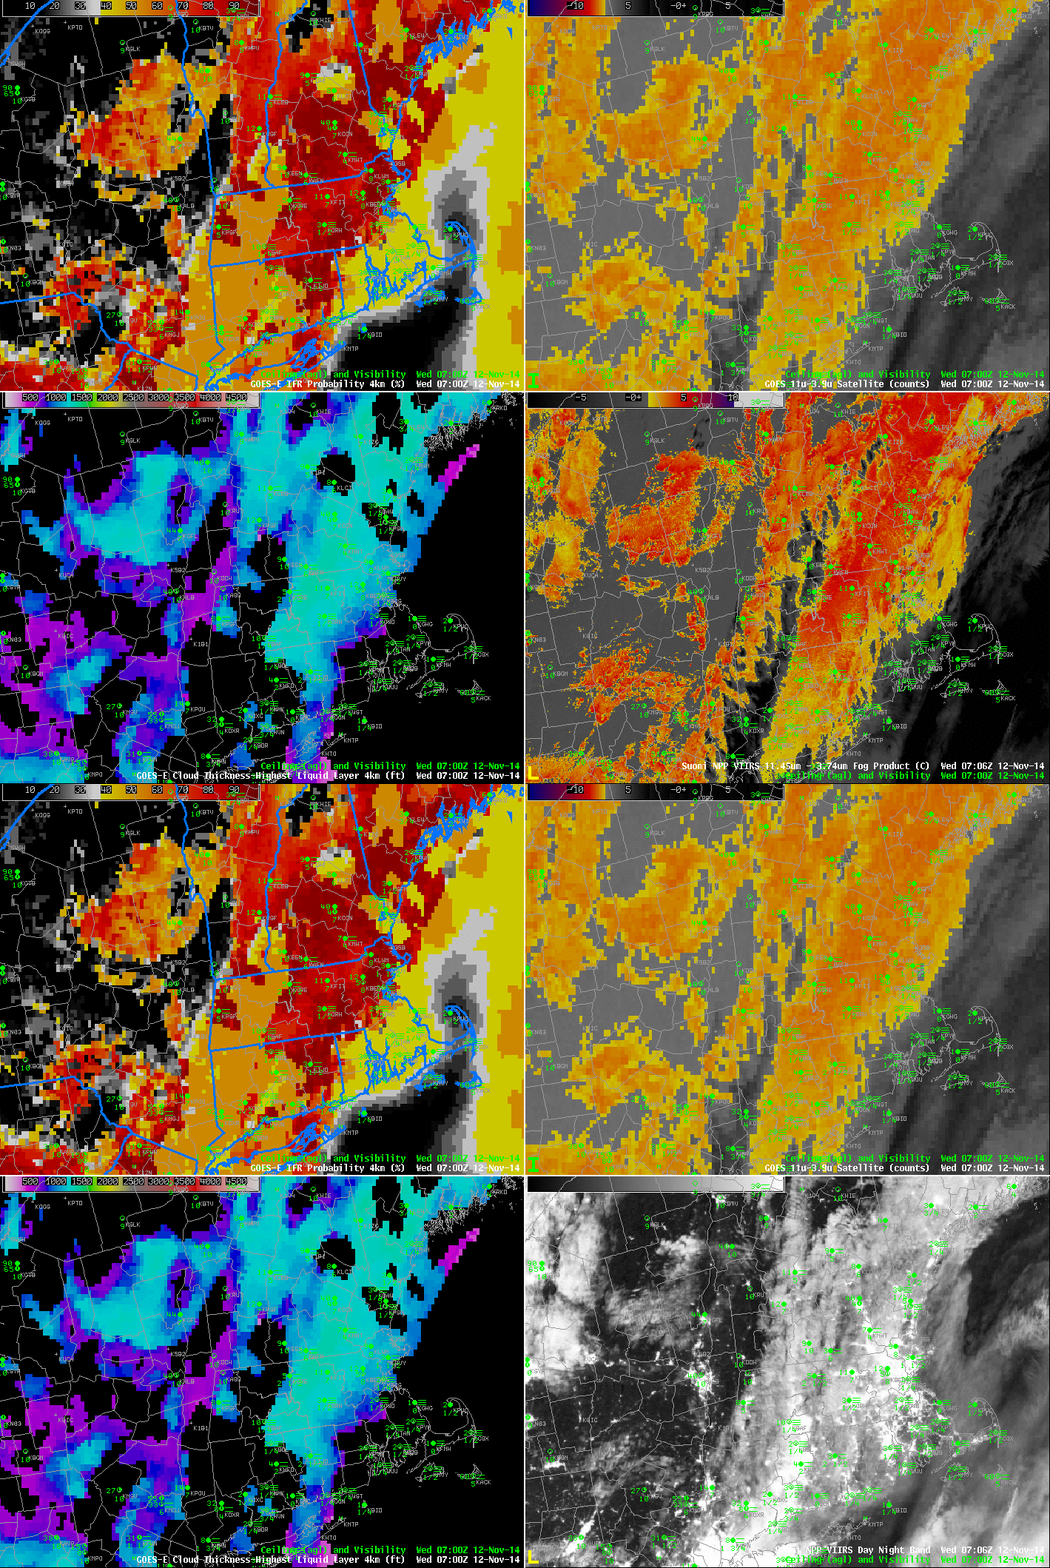
Suomi NPP overflew New England around 0700 UTC on 12 November, and the data collected are included in the image toggle below. Suomi NPP better resolves some of the smaller valleys in interior New England, and some of the sharp edges to the fields.
VIIRS_BTD_DNB__REF_20141112_0706

As above, but with a toggle between Suomi NPP VIIRS Day Night Band and Brightness Temperature Difference (11.45 µm – 3.74 µm) in the lower right. All data at ~0700 UTC 12 Nov (Click to enlarge)
Fog over the Northeast under Cirrus Clouds

The system that produced cirrus to obscure satellite-based observations of low clouds and fog over the Southeast US on 29 October (link) had the same effect over the Northeast United States: Multiple Cloud Layers with an extratropical system will prevent satellites from identifying regions of low clouds and fog. Any kind of fog detection algorithm, then, must incorporate surface-based observations (as in a model, for example) to provide useful information when multiple cloud layers are present.

GOES_IFR_4Panel_Northeast_29October2014_00_12

GOES-based GOES-R IFR Probabilities (Upper Left), GOES-13 Brightness Temperature Difference (10.7µm – 3.9µm) (Upper Right), GOES-based GOES-R Cloud Thickness (Lower Left), MODIS-based GOES-R IFR Probabilities (Lower Right) (Click to enlarge)
WFOs in the northeast issued Dense Fog Advisories for the morning of 29 October (and retweeted fog images from the public). (Link) The animation above shows the evolution of GOES-based GOES-R IFR Probabilities and GOES-13 Brightness Temperature Difference fields. Little information can be gleaned from the brightness temperature difference fields; however, the IFR Probability does show high probabilities where IFR and near-IFR conditions develop from coastal Massachusetts northeastward through coastal Maine. The flat character of the IFR Probability field occurs because Rapid Refresh model data are being used as predictors in the computation of IFR Probability, and those model fields do not vary quickly. When satellite data are also used — as over Quebec at the start of the animation — the IFR Probability fields have a pixelated character.

IFR Probabilities increase on the last frame of the animation. This occurs because the region becomes sunlit, and cloud-clearing abilities increase. The algorithm to compute IFR Probability therefore has greater confidence that clouds are present and probabilities increase.

Fog/Low Stratus near the Gulf of Maine

GOES_IFR_PROB_20140414loop

GOES-R IFR Probabilities computed from GOES-13 and surface plots of ceilings/visibilities, times as indicated (click to enlarge)

When relatively high dewpoints move over the cold waters of the Gulf of Maine in Spring, advection fog can form. Sometimes this happens underneath clear skies, sometimes it happens underneath high clouds. In both cases, the IFR Probability field should give a reasonable answer — but how can that prediction be validated? In the example above, the apparent fog/low cloud bank propagates off to the east, and when it is fully ashore near Yarmouth, NS, visibilities drop from near-IFR to IFR conditions. The IFR probability field has an appearance that suggests plenty of high clouds are overlaying the visibility-restricting lower clouds, yet a consistent signal of higher probabilities of IFR conditions is maintained in/around the Gulf of Maine northward into Maine.

GOES-R IFR Probability signal because of co-registration errors

GOES_IFR_PROB_20140130_0802

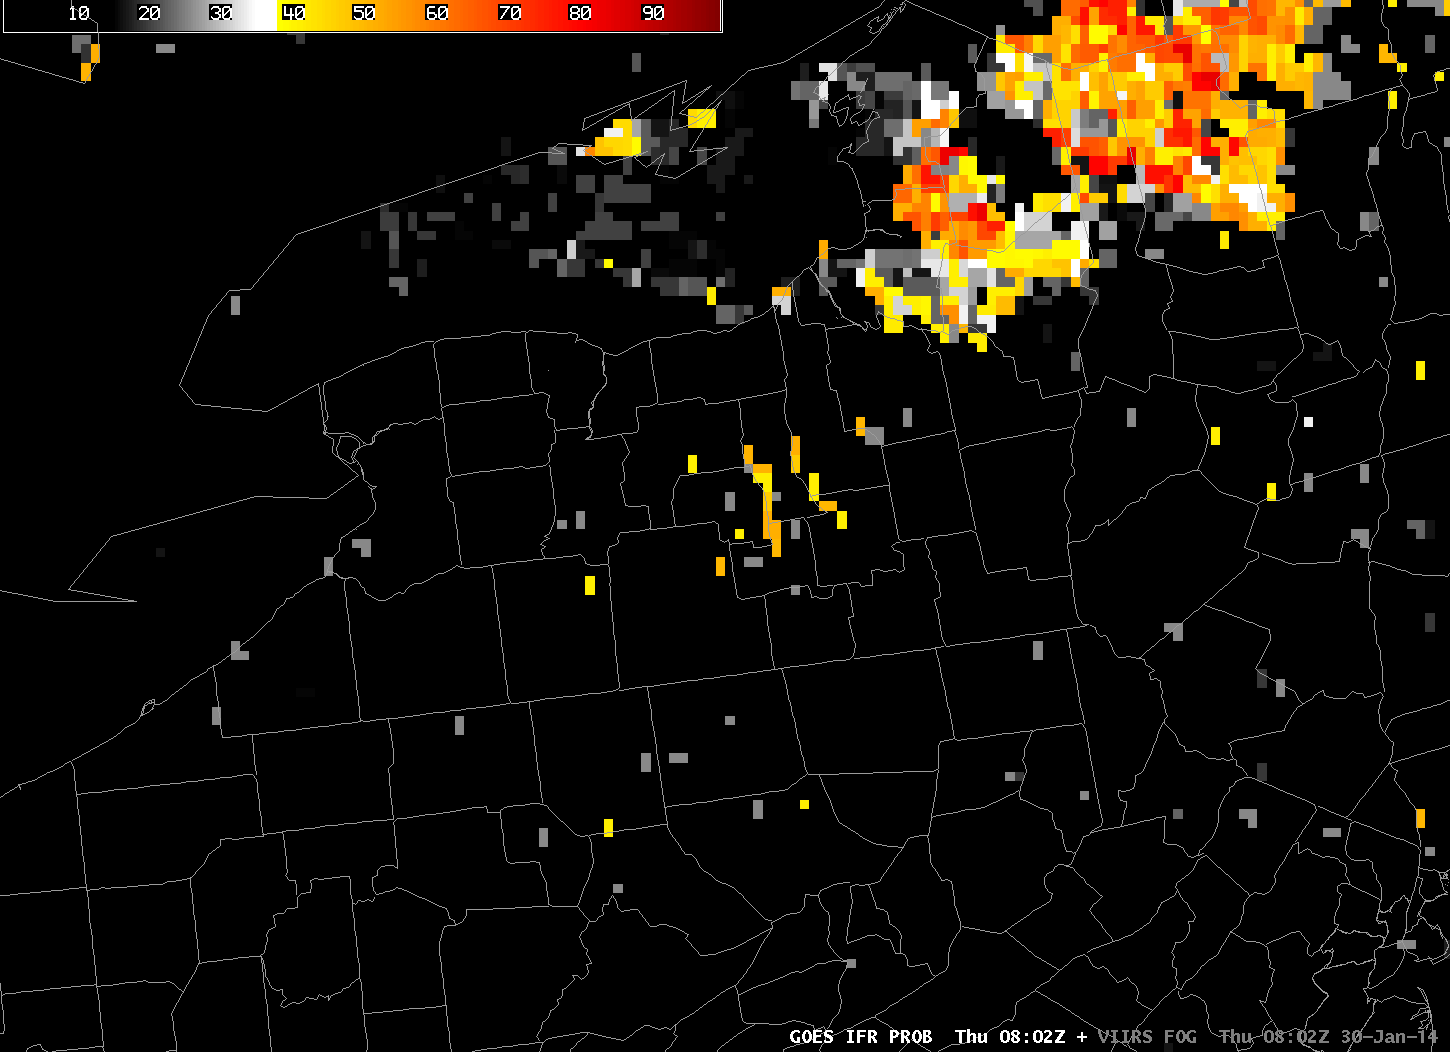
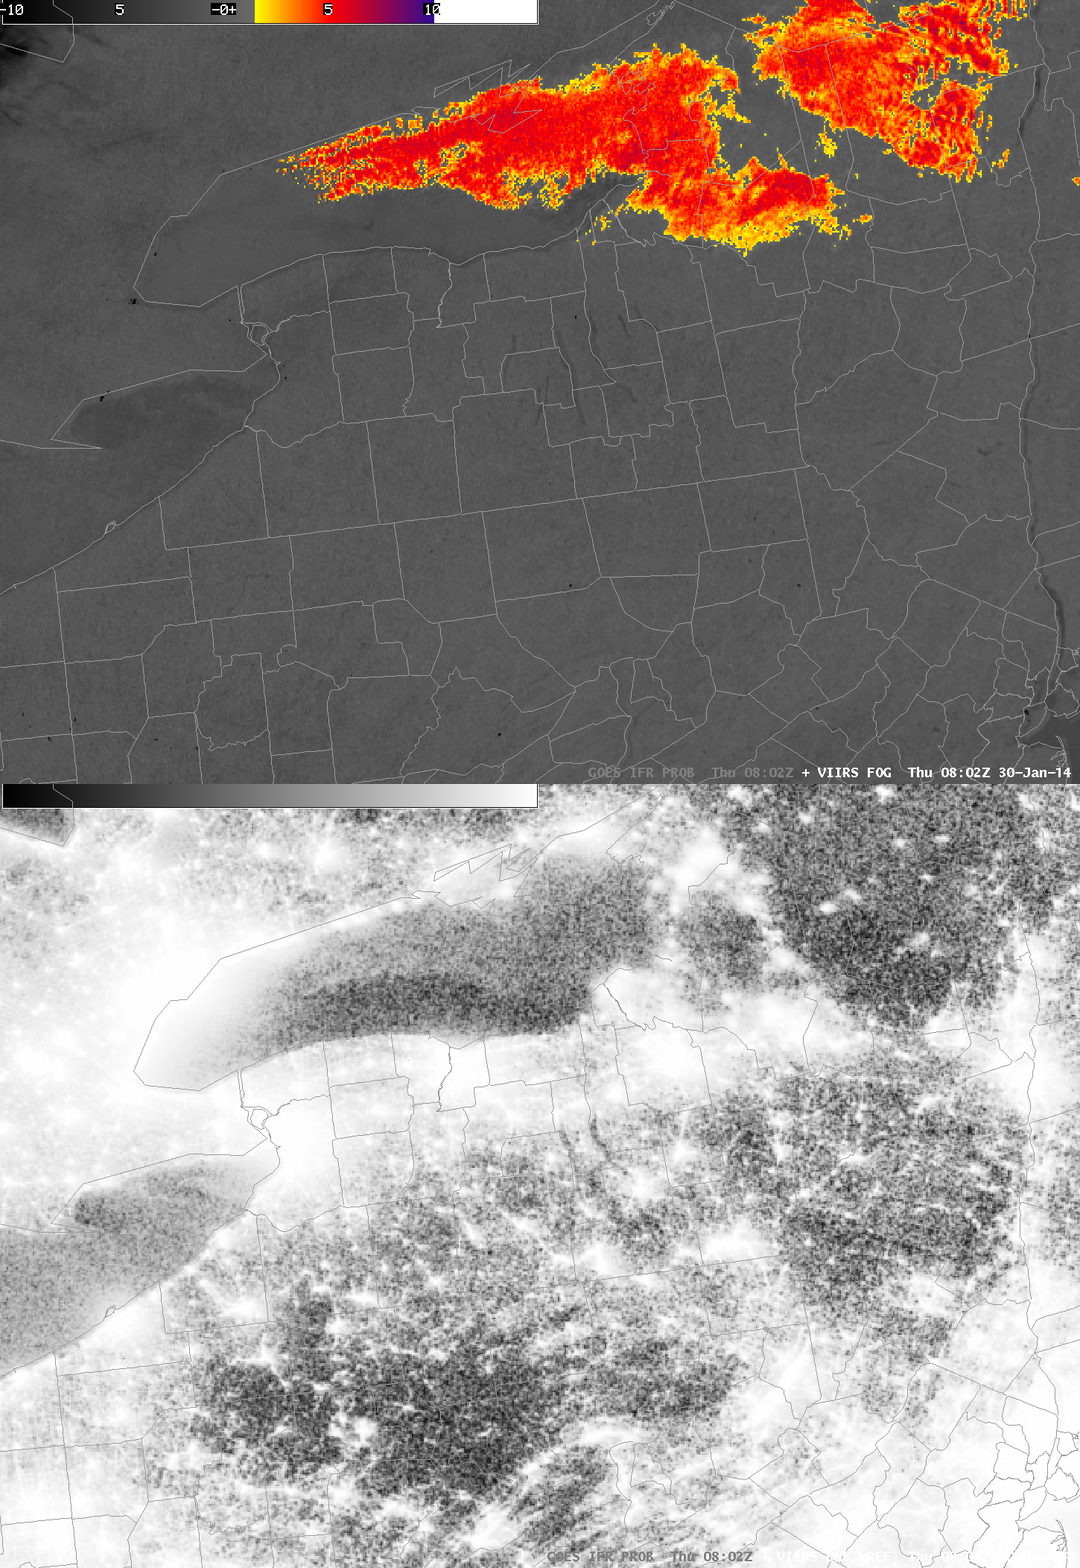
GOES-R IFR Probabilities at 0802 UTC, 30 January 2014 (click image to enlarge)

Special Update, 17 November 2014.

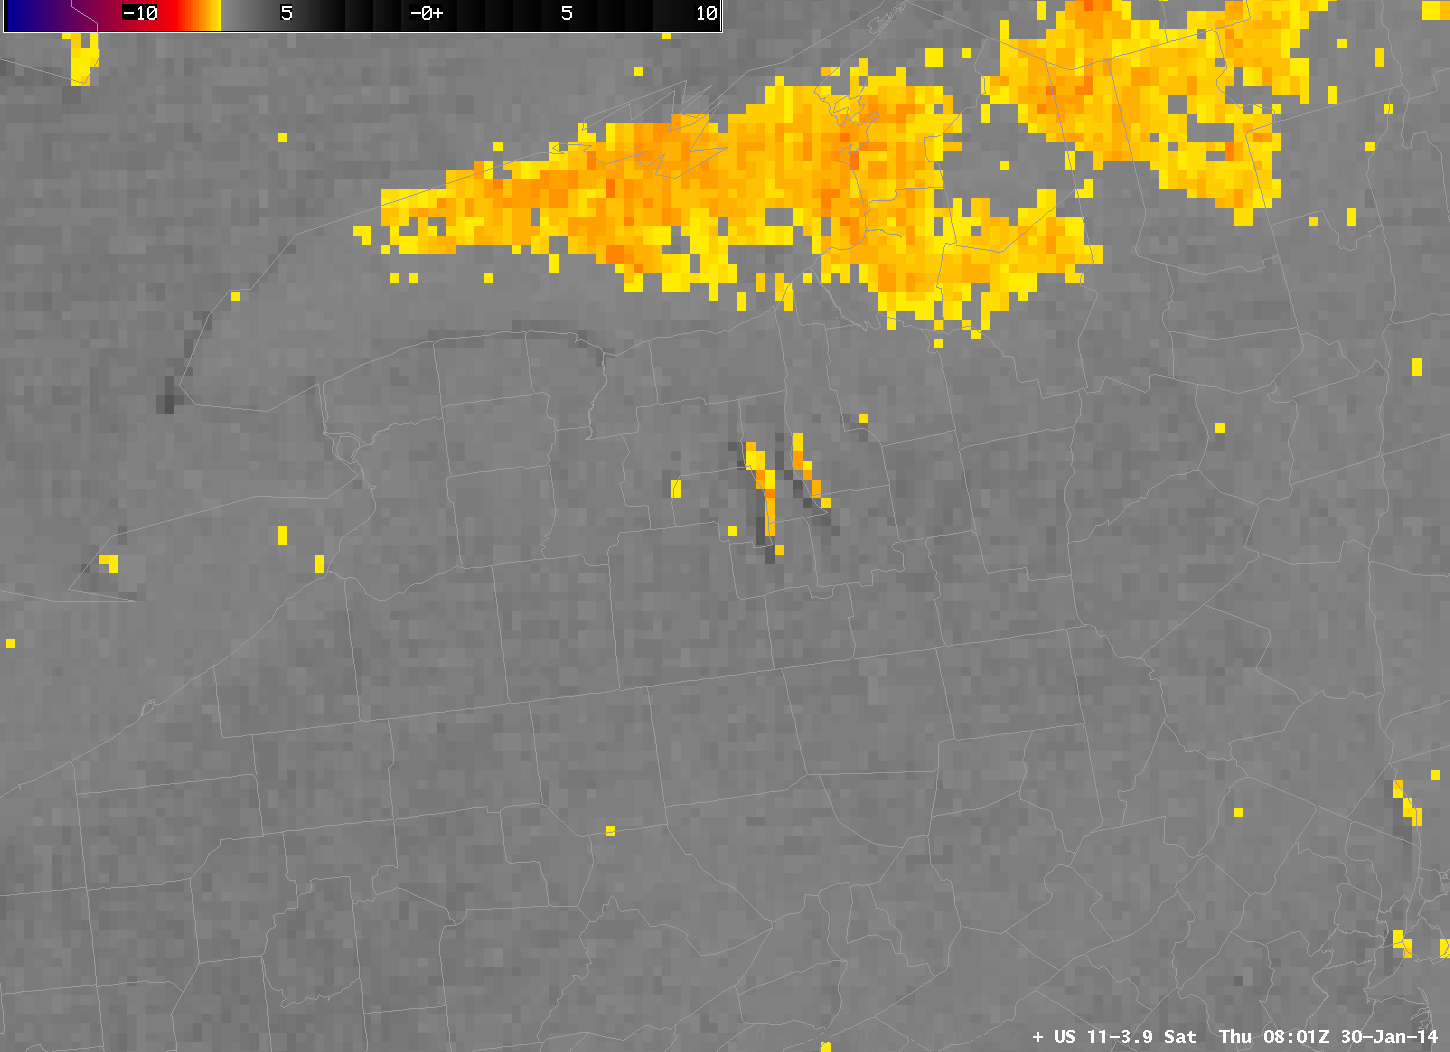
GOES-R IFR Probabilities on the morning of 30 January suggested the likelihood of fog along some of the Finger Lakes of upstate New York. These high probabilities arise because the Brightness Temperature Difference (10.7 µm – 3.9 µm) Product, below, shows a signal there. Note, however, that the Brightness Temperature Difference has a shadow; this is the sign that the co-registration error that is present between the 10.7 µm and 3.9 µm channels is producing a fictitious signal of fog over the lake. Such errors have been discussed here and elsewhere in the past.

US_11-3.9_Sat_20140130_0801

GOES-East Brightness Temperature Difference (10.7 µm – 3.9 µm) at 0801 UTC, 30 January 2014 (click image to enlarge)

Evidence that fog is not present is available in Suomi/NPP data taken at the same time as the GOES data, above. The toggle, below, of Day/Night Band imagery and of the brightness temperature difference (11.35 µm – 3.74 µm) from VIIRS shows scant evidence of fog/low stratus near the Finger Lakes. Because the moon is new, lunar illumination is at a minimum and surface features in the Day/Night band are not distinct, but the dark waters of the lakes are apparent.

VIIRS_FOGDNB_20140130_0802

Suomi/NPP VIIRS Day/Night band and Brightness Temperature Difference (11.35 µm – 3.74 µm) at 0802 UTC, 30 January 2014 (click image to enlarge)

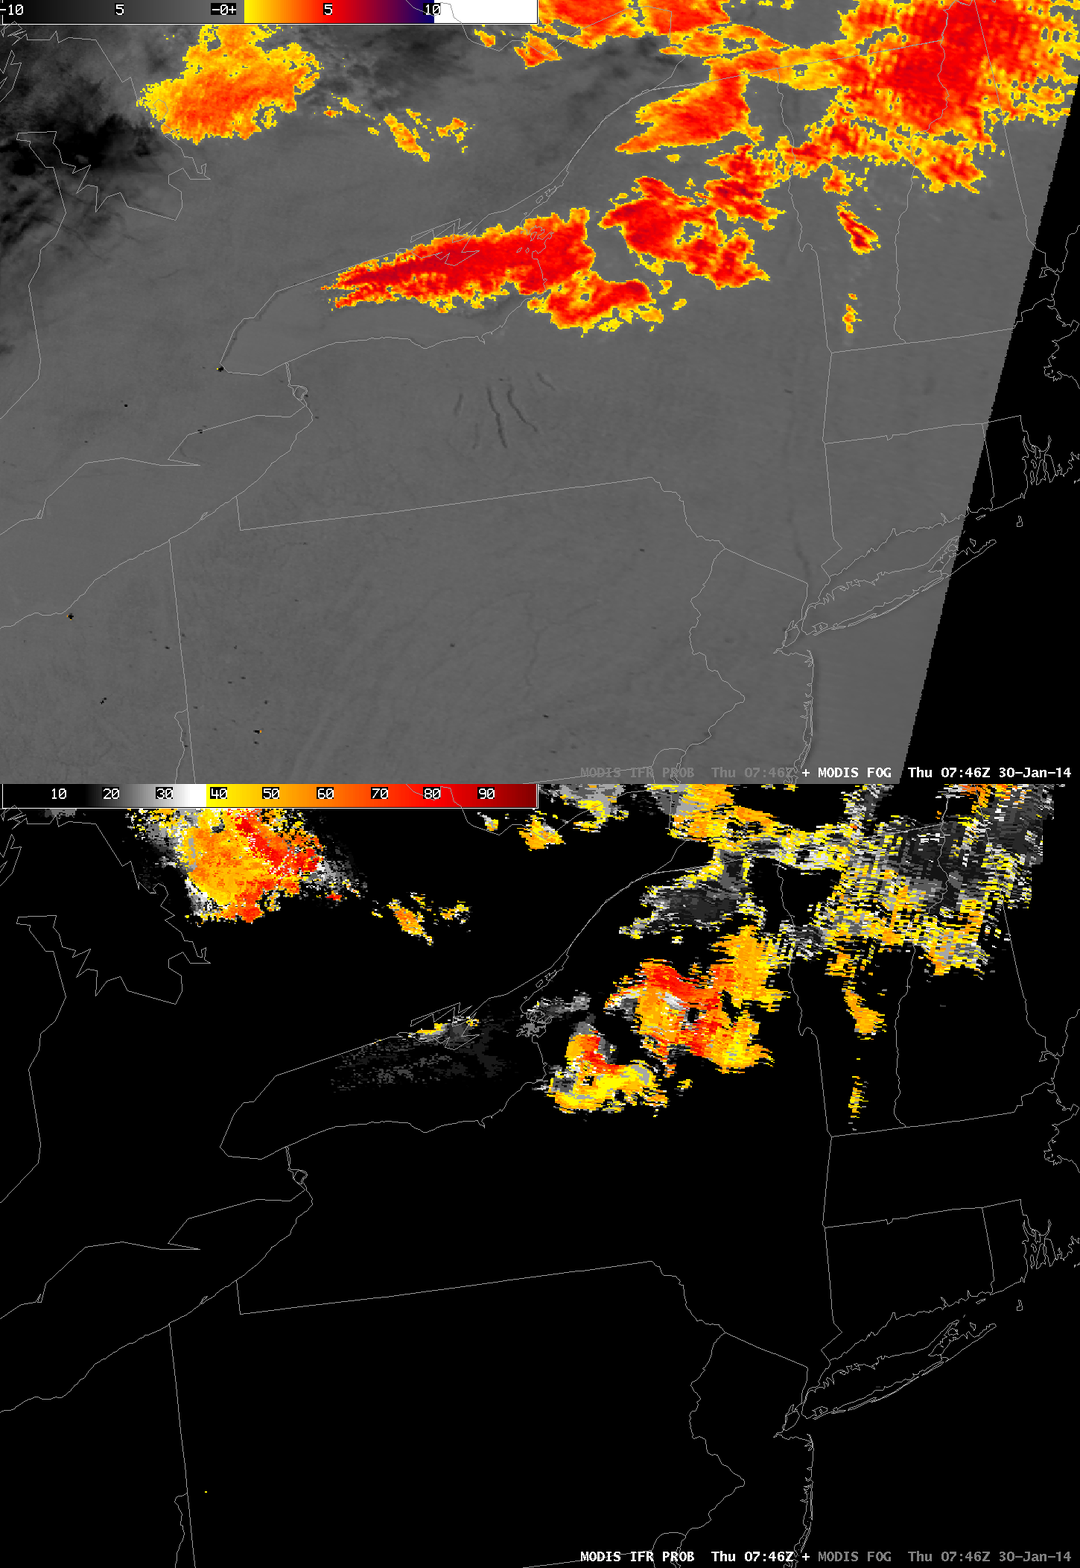
MODIS data also suggests no fog/low stratus in the region. Both the brightness temperature difference field and the MODIS-based IFR Probabilities, below, support a forecast that does not mention fog around the Finger Lakes.

MODIS_FOG_IFRPROB_20140130_0746

MODIS Brightness Temperature Difference (11 µm – 3.74 µm) and MODIS-based GOES-R IFR Probabilities at 0746 UTC, 30 January 2014 (click image to enlarge)


=====================================================================

Update, 17 November 2014

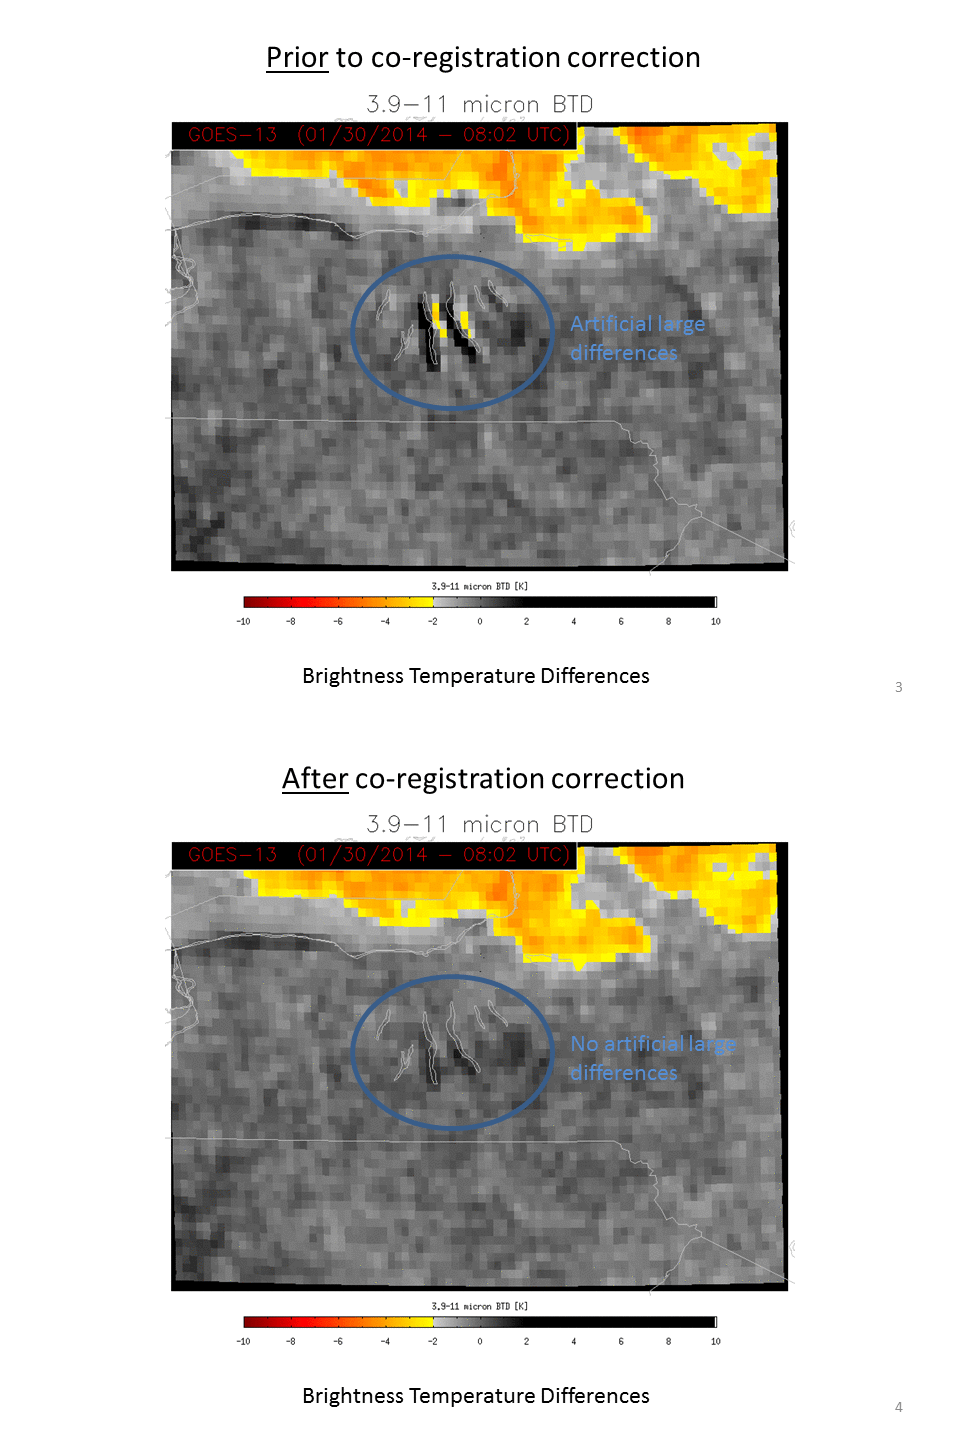
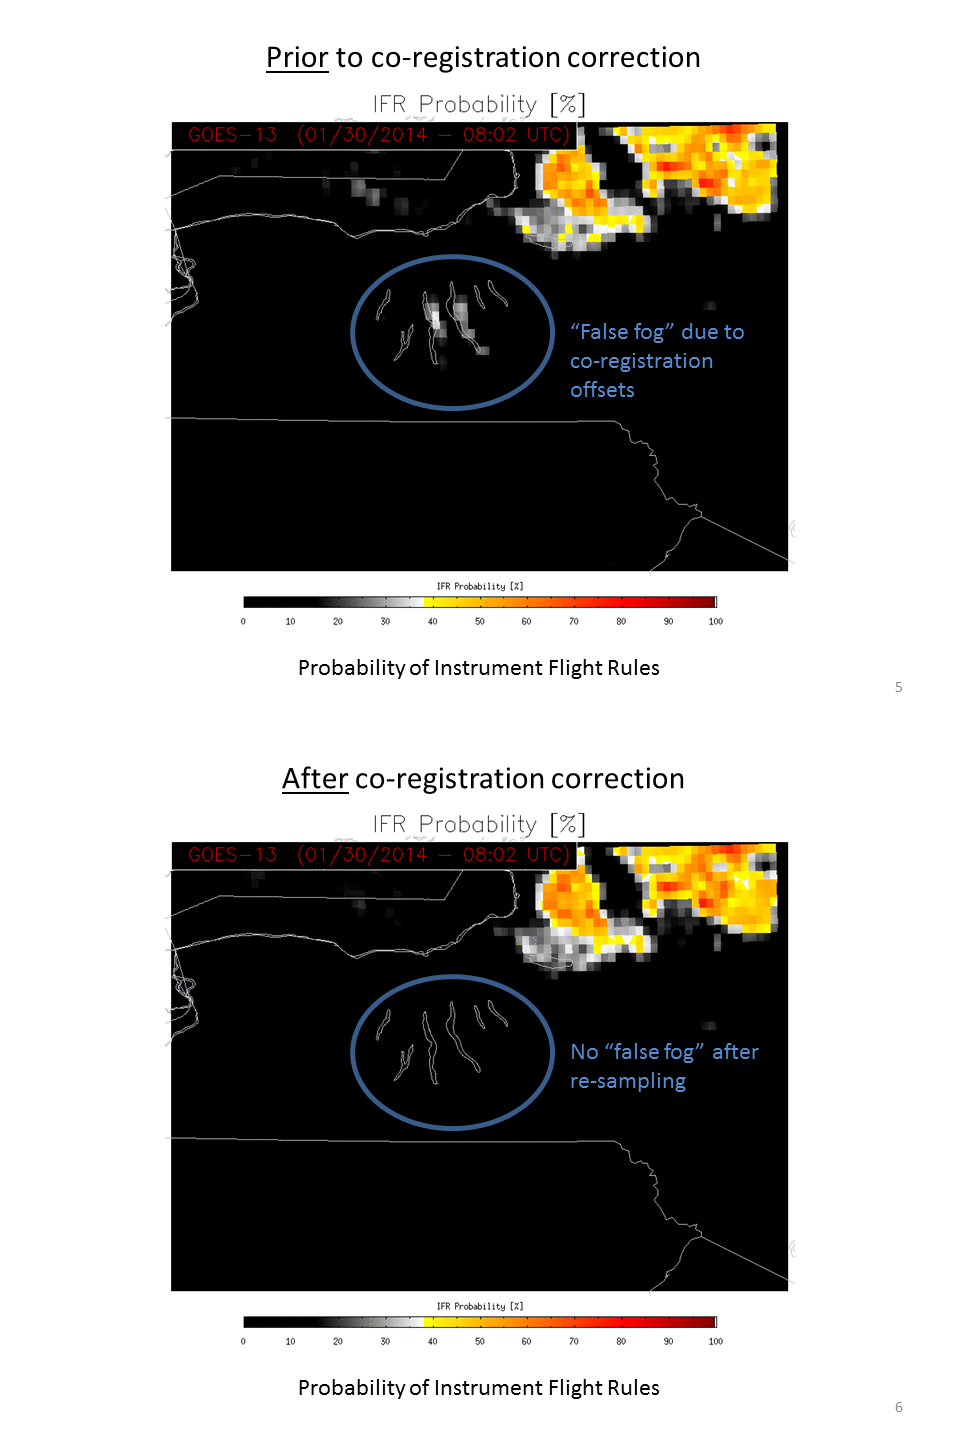
NOAA/NESDIS has tested a software fix to align better the longwave infrared (10.7 µm) and shortwave infrared (3.9 µm) channels. The toggle below is of the Brightness Temperature Difference Field with (After co-registration correction) and without (Prior to co-registration correction) the realignment.

BTD_BeforeAfterFix

GOES-13 Brightness Temperature Difference Fields at 0802 UTC, 30 January 2014, with and without the co-registration correction as indicated (Photo Credit: UW-Madison CIMSS; Click to enlarge)

The correction of the co-registration error translates into more realistic IFR Probabilities in/around the Finger Lakes. In this case, IFR Probabilities are reduced because the false strong signal from the satellite is not present because of more accurate co-registration.

IFR_BeforeAfterFix

GOES-R IFR Probability fields computed Prior to and After co-registration correction, data from 0802 UTC 30 January 2014. IFR Probability fields with the corrected co-registration data are more accurate. (Photo Credit: UW-Madison CIMSS; Click to enlarge)

Fog over northern Vermont and New Hampshire

GOES_IFR_PROB_20131015loop

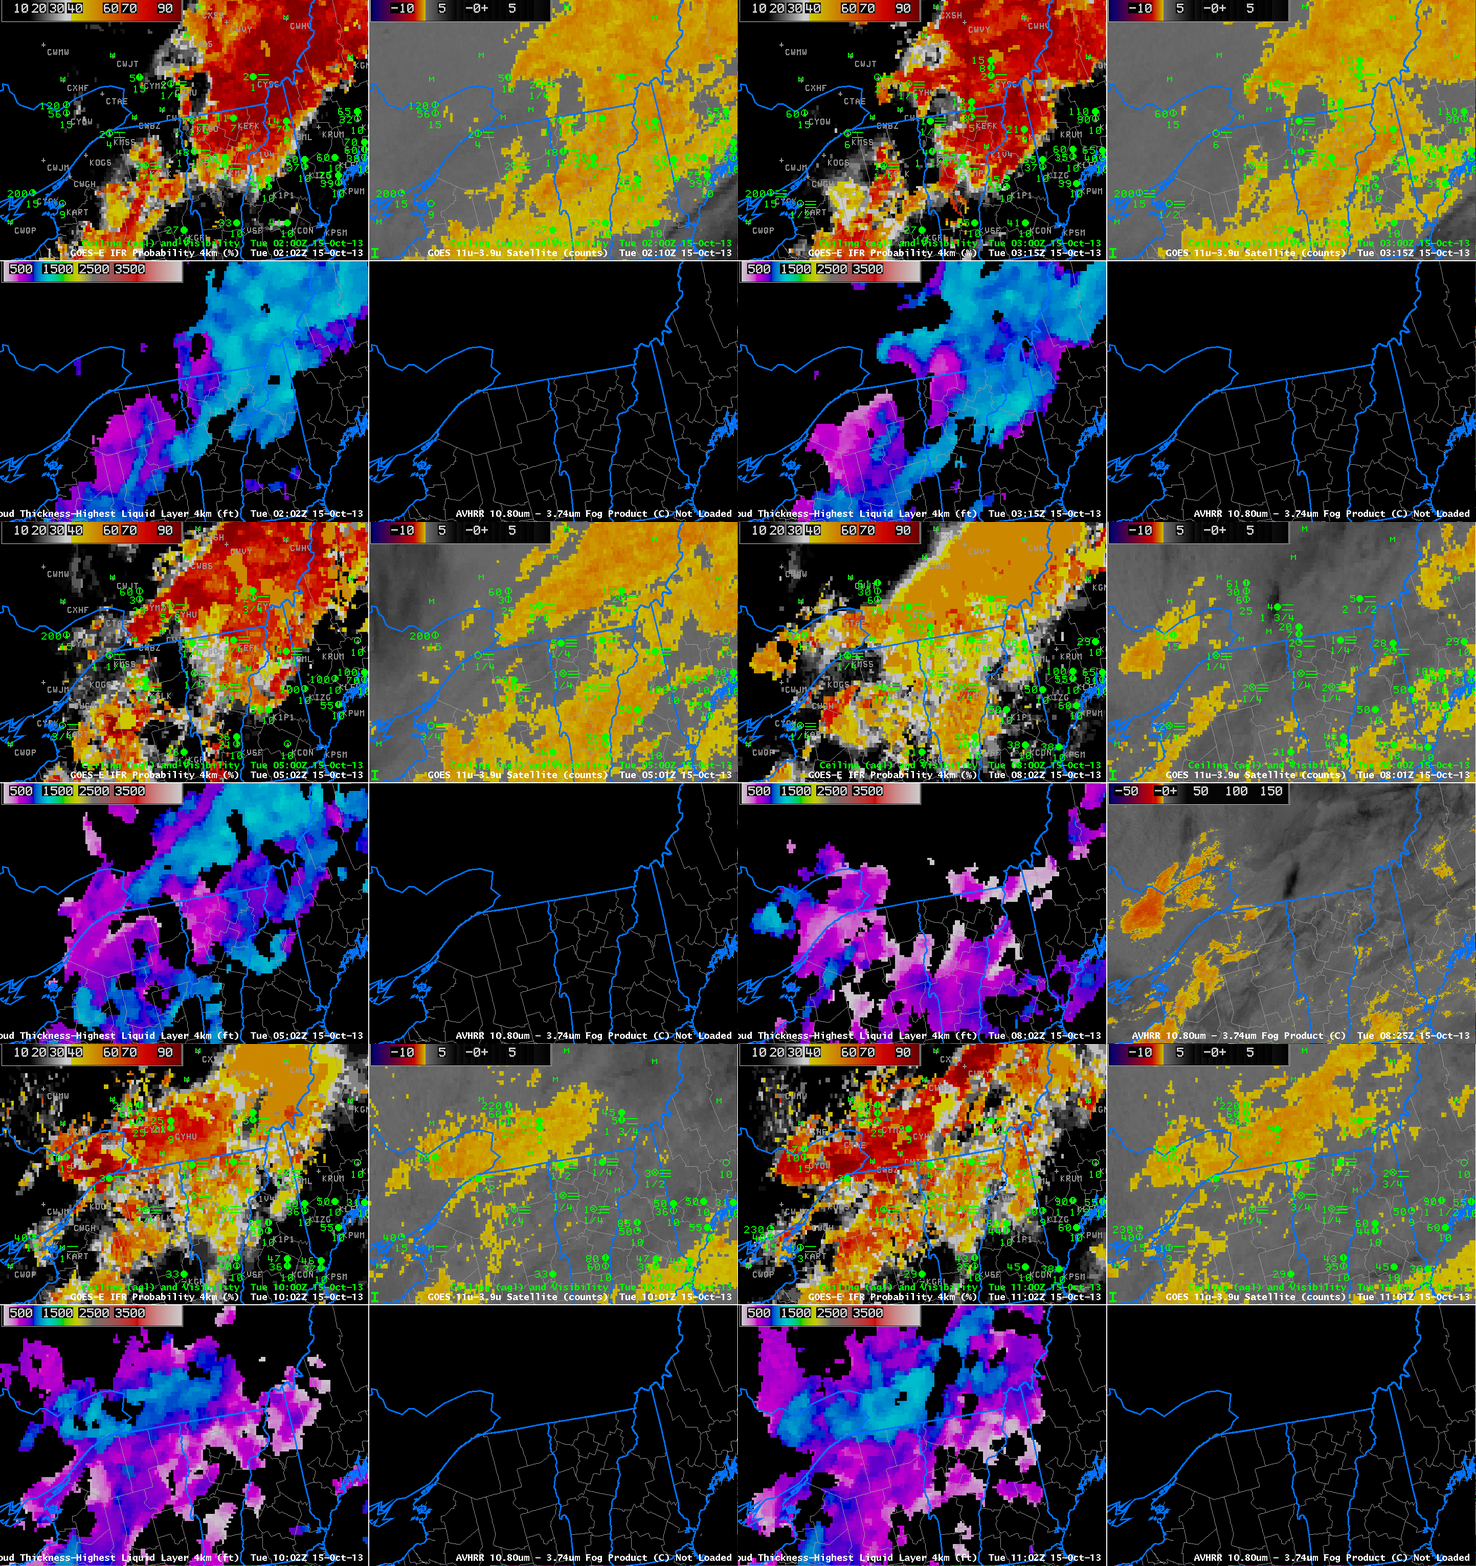
GOES-13-based GOES-R IFR Probabilities (Upper Left), GOES-13 Brightness Temperature Difference Product (10.7 µm – 3.9 µm) (Upper Right), GOES-13-based GOES-R Cloud Thickness (Lower Left), AVHRR Brightness Temperature Difference (10.8 µm – 3.74 µm) (Lower Right), all times as indicated (click image to enlarge)

High Pressure over southern Quebec allowed for light winds over northern New England, and fog and low stratus developed. The animation above shows the benefit of the fused product; when mid- and high-level clouds are present in the satellite field of view, the brightness temperature difference product loses the ability to detect fog and low stratus. Data from the Rapid Refresh Model will be used in these regions to produce an IFR Probability Field. Note how Burlington, VT, for example, reports IFR conditions. The brightness temperature difference product has only a small signal over Burlington, but IFR Probabilities are high.