Category Archives: Multiple Cloud Layers

Widespread fog and low clouds along the East Coast

US_Water_Vapor_20141223_2hrmovie

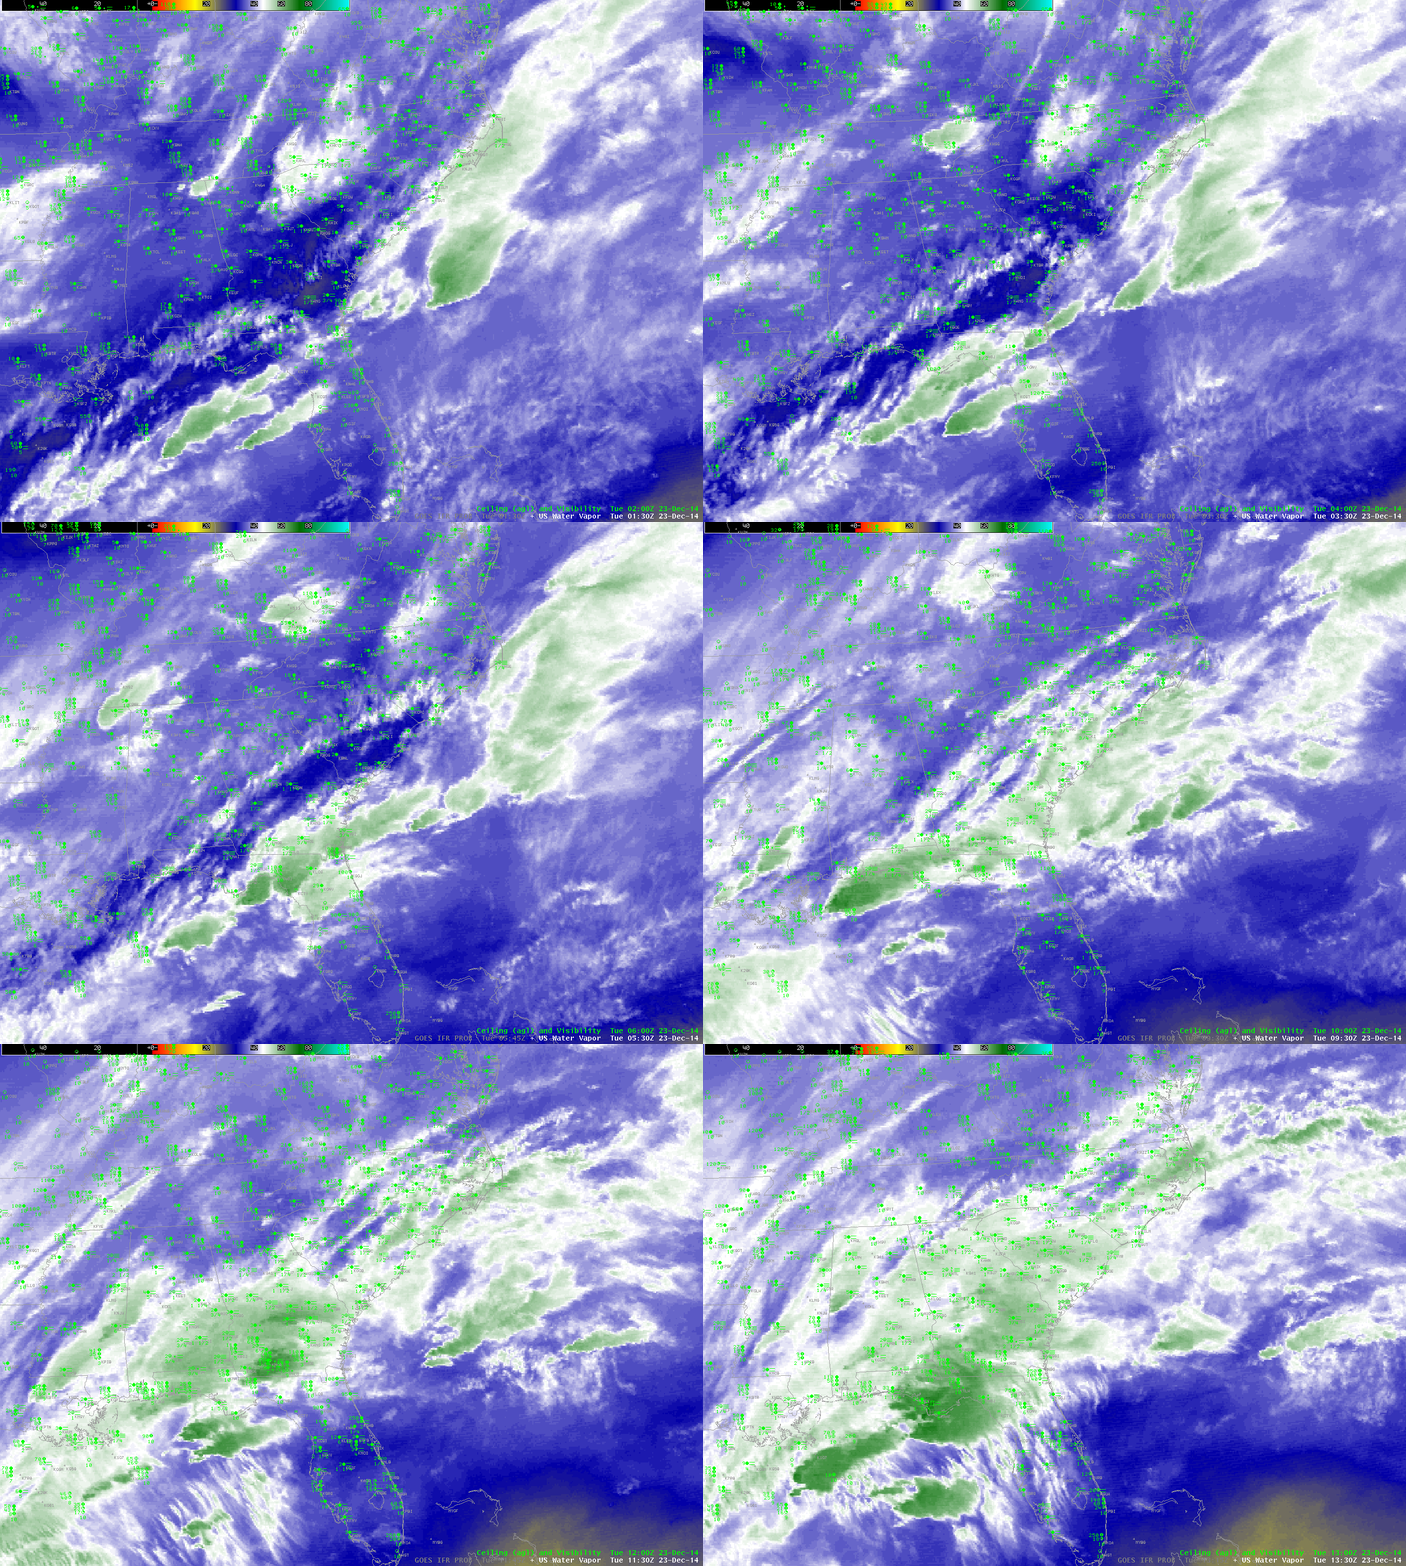
GOES-East Water Vapor imagery, every 2 hours, 0130 – 1330 UTC 23 December 2014 (Click to enlarge)

 A slow-moving storm system is producing widespread fog and low clouds on the east coast (and in the middle of the country as well). The water vapor animation above shows the cloud cover associated with the system. Water vapor imagery such as this suggests many different cloud layers, and in such cases the IFR Probability fields (below) rely on Rapid Refresh Data to provide information because Satellite signals of low clouds cannot occur in the presence of cirrus contamination. A simple Brightness Temperature Difference product would give little information about near-surface clouds over the Southeast.

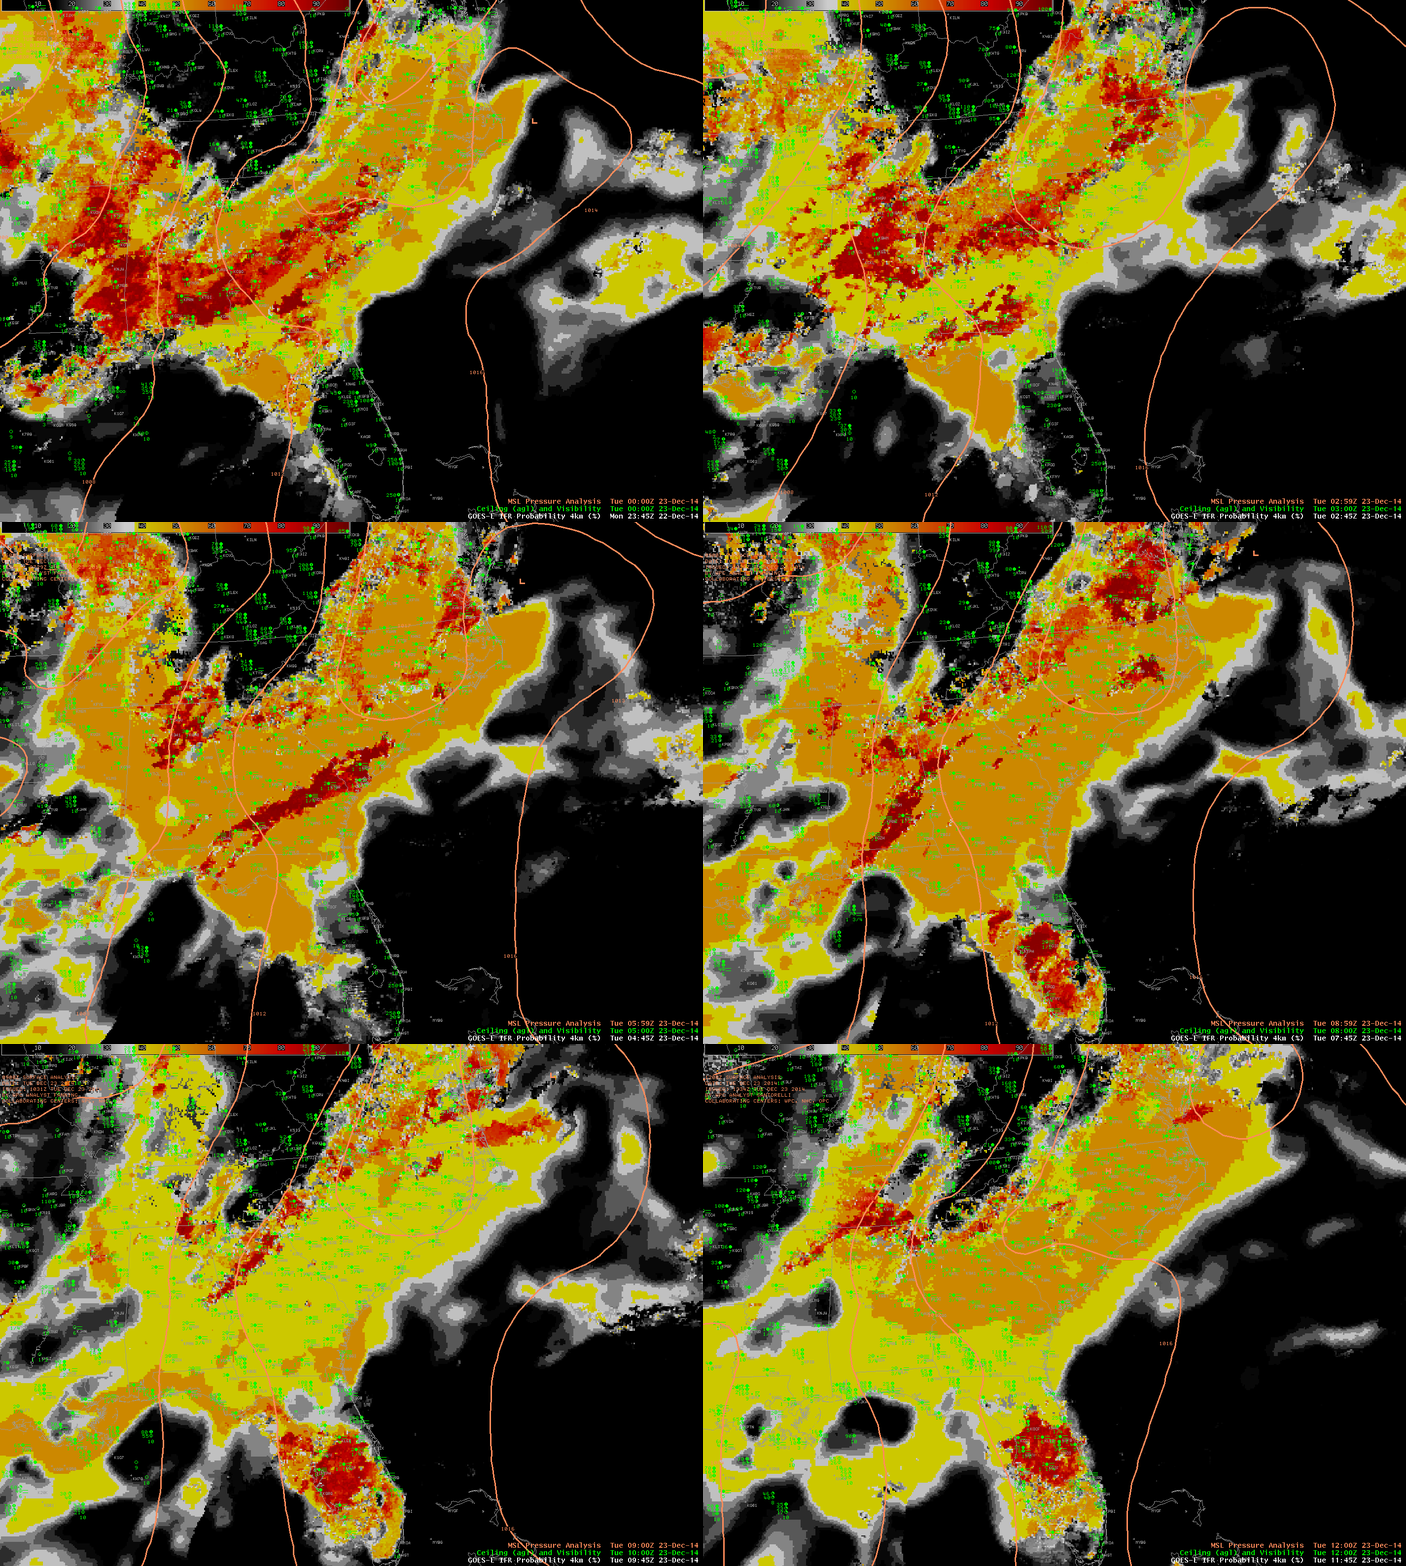
GOES_IFR_PROB_20141223anim

GOES-East-based GOES-R IFR Probabilities and surface-based observations of ceilings and visibilities, hourly from 0145 through 1245 UTC 23 December 2013 (Click to enlarge)

 IFR Probability fields show a flat nature that occurs when satellite data cannot be used as a Predictor because of the presence of high clouds/multiple cloud layers. The Probability values are suppressed; interpretation of those values should be colored by the knowledge of the presence or absence of high clouds. In the example above, when high clouds briefly separate over central South Carolina around 0600 UTC, a region of higher IFR probability is shown. The algorithm is more confident that fog/low stratus exists because Satellite Predictors can also be used in that region. What changes is the ability of the GOES-R IFR Probability algorithm to assess the probability of IFR conditions because more predictors can be included; in the region where the high clouds part, satellite information about the low clouds can be included, and IFR Probabilities increase as a result.

Fog over the Southern Plains

Fog developed over Texas, Oklahoma and Arkansas early in the morning of 9 December 2014. Multiple cloud layers made traditional satellite detection (that is, using brightness temperature difference field (10.7µm – 3.9µm)) problematic. How did the fused product, GOES-R IFR Probability perform? The animation below shows the hourly evolution of IFR Probability from 0215 UTC through 1415 UTC.

IFR_09Dec2014_02_14anim

GOES-R IFR Probabilities, hourly from 0215 through 1415 UTC on 9 December 2014, along with surface plots of ceilings and visibilities (Click to enlarge)

There are widespread reports of IFR conditions over southeast Oklahoma and northern Texas, as well as over Arkansas in the Arkansas River Valley. IFR Probability fields generally overlap the region of reduced ceilings and visibilities.

Note that the probabilities increased over west Texas between 1315 and 1415 UTC. The boundary between day and night predictors is also apparent at 1415 UTC as a SW to NE line over the Texas Panhandle. Probabilities change as night switches to day because different combinations of satellite predictors can be used. In particular, the use of visible imagery improves cloud clearing and therefore IFR Probabilities increase in regions where low clouds exist (because the possibility of clouds being present is more easily detected).

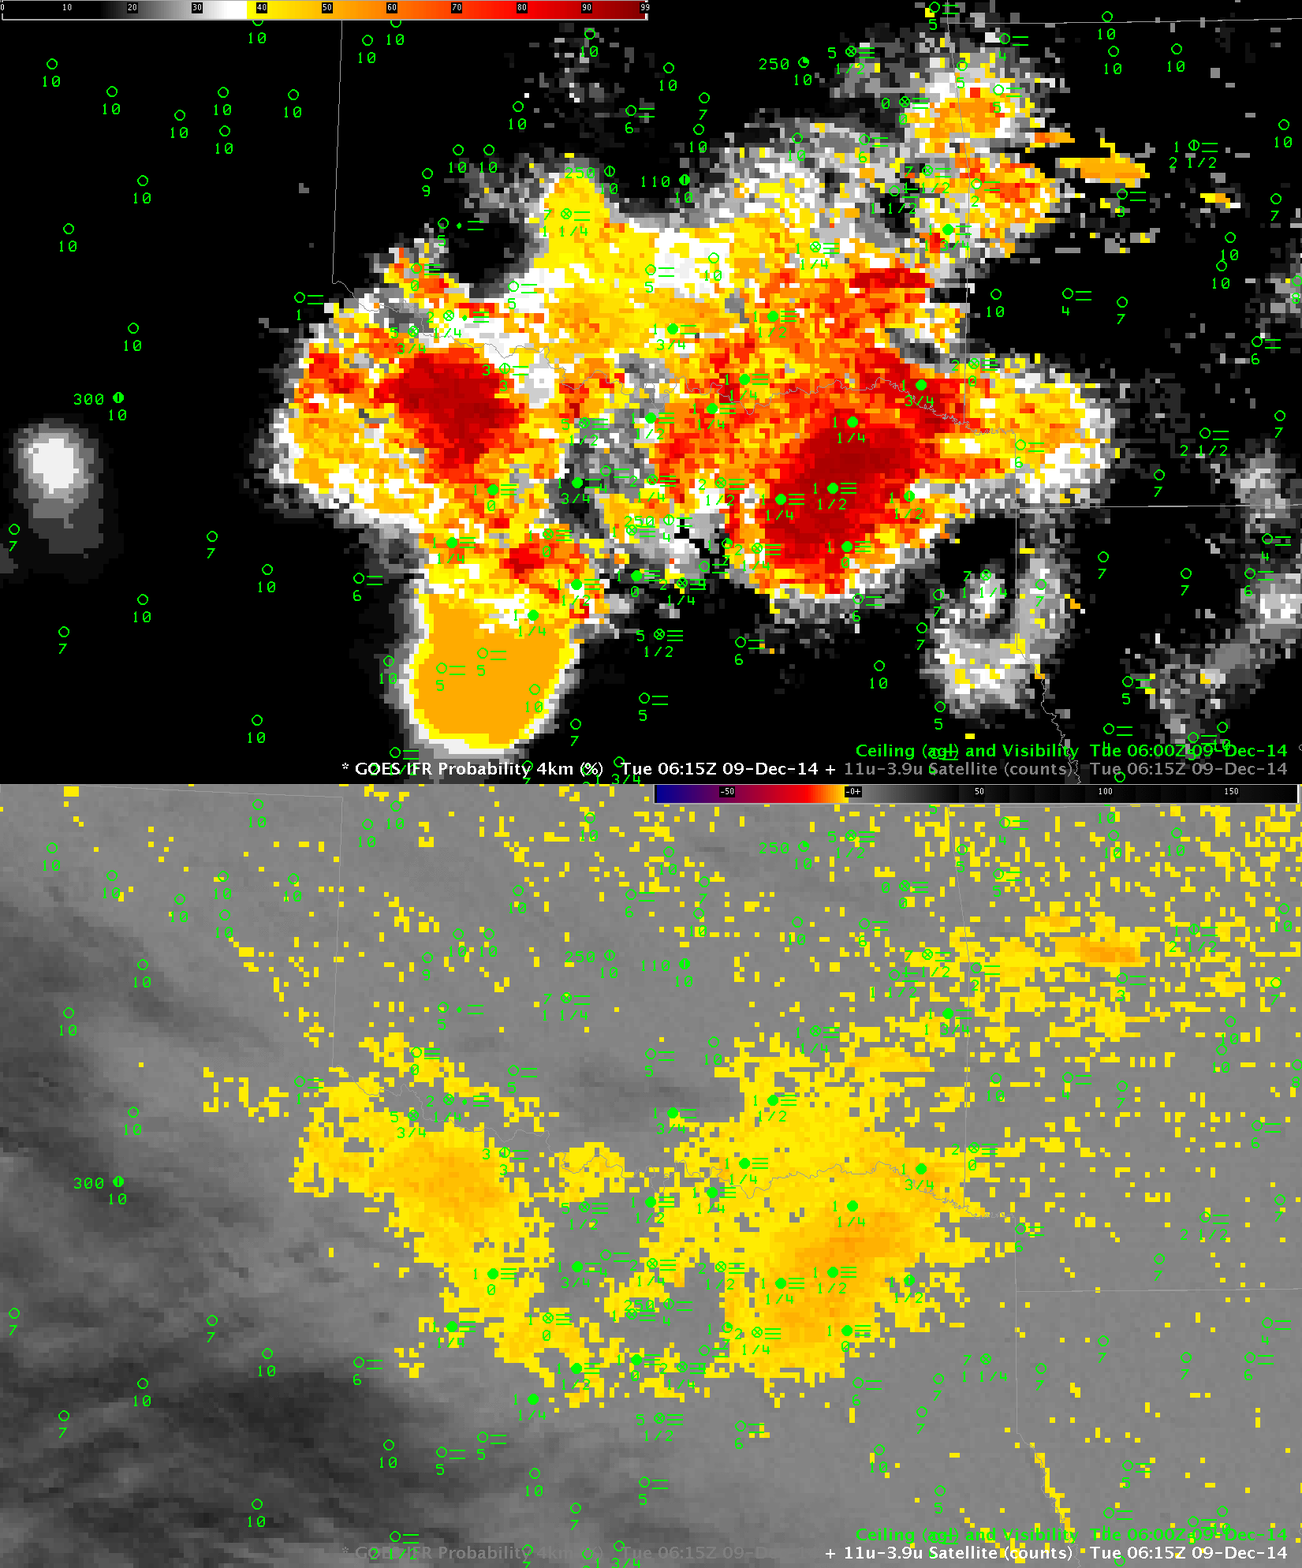
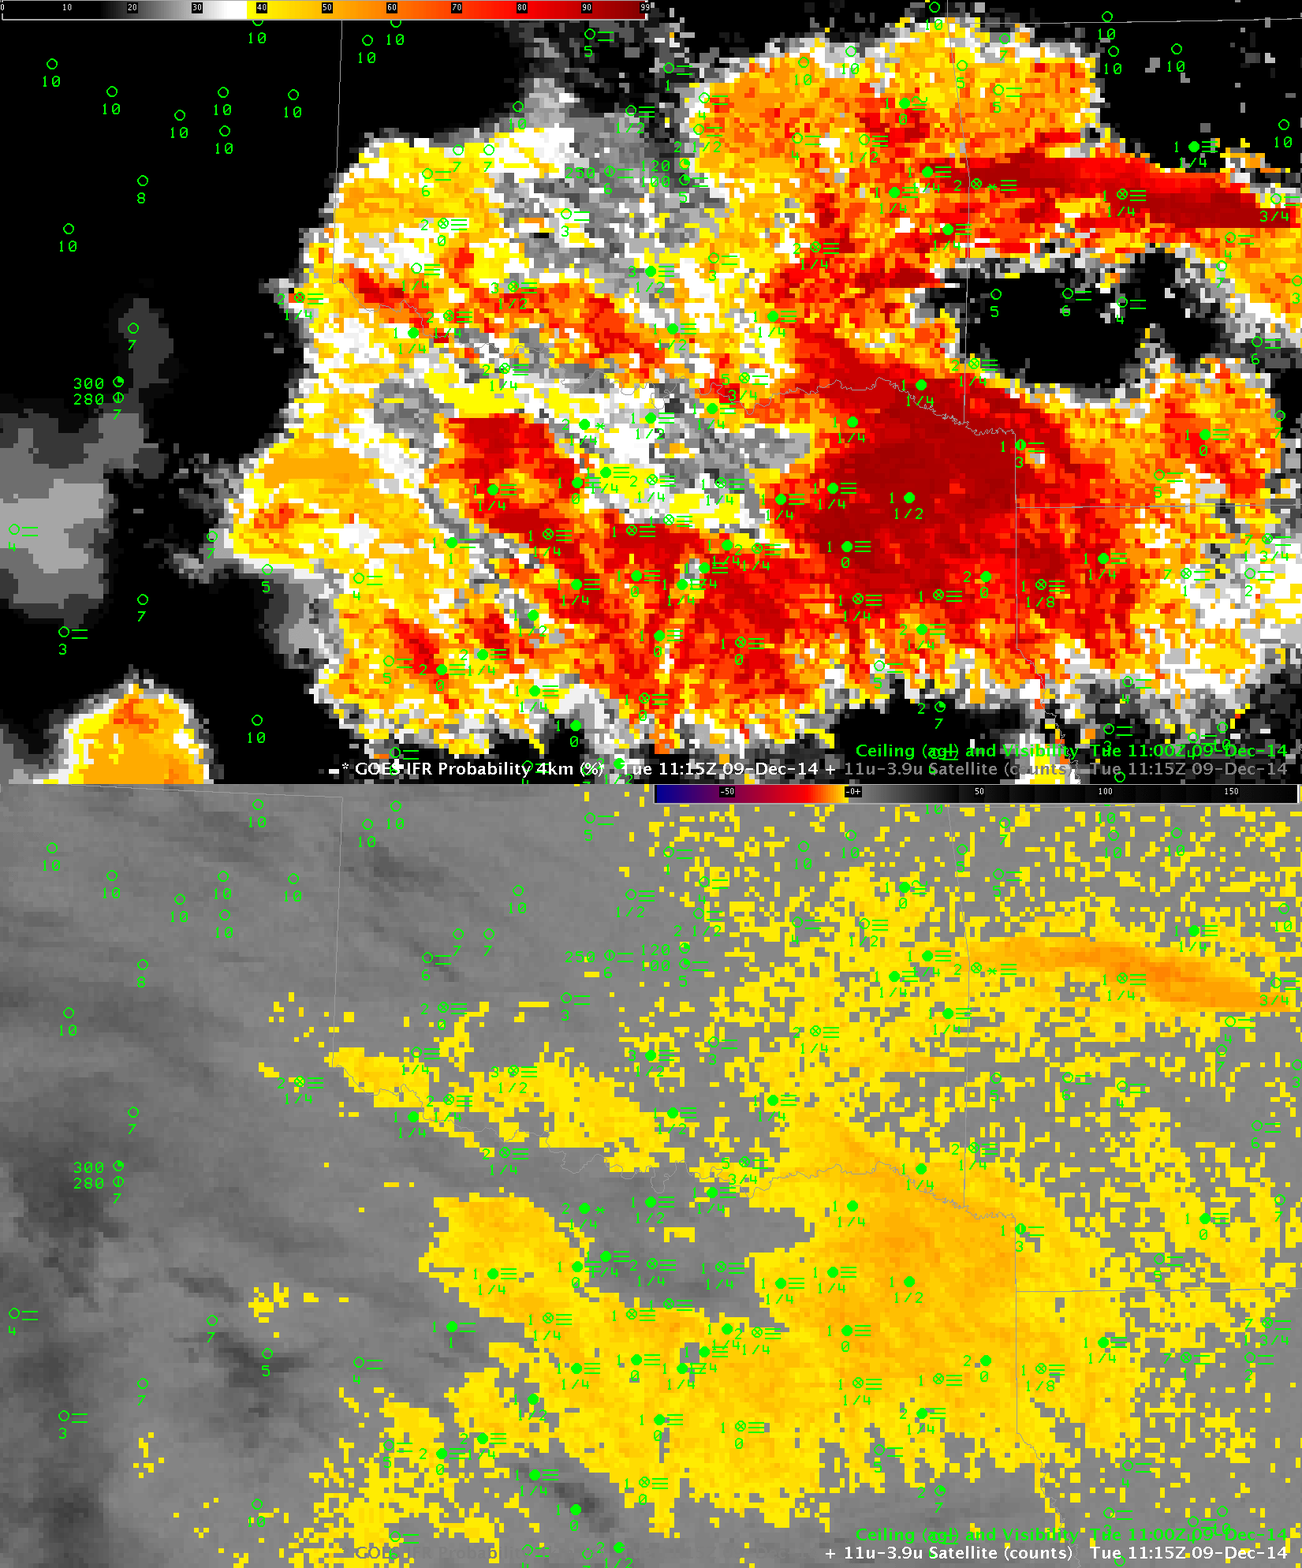
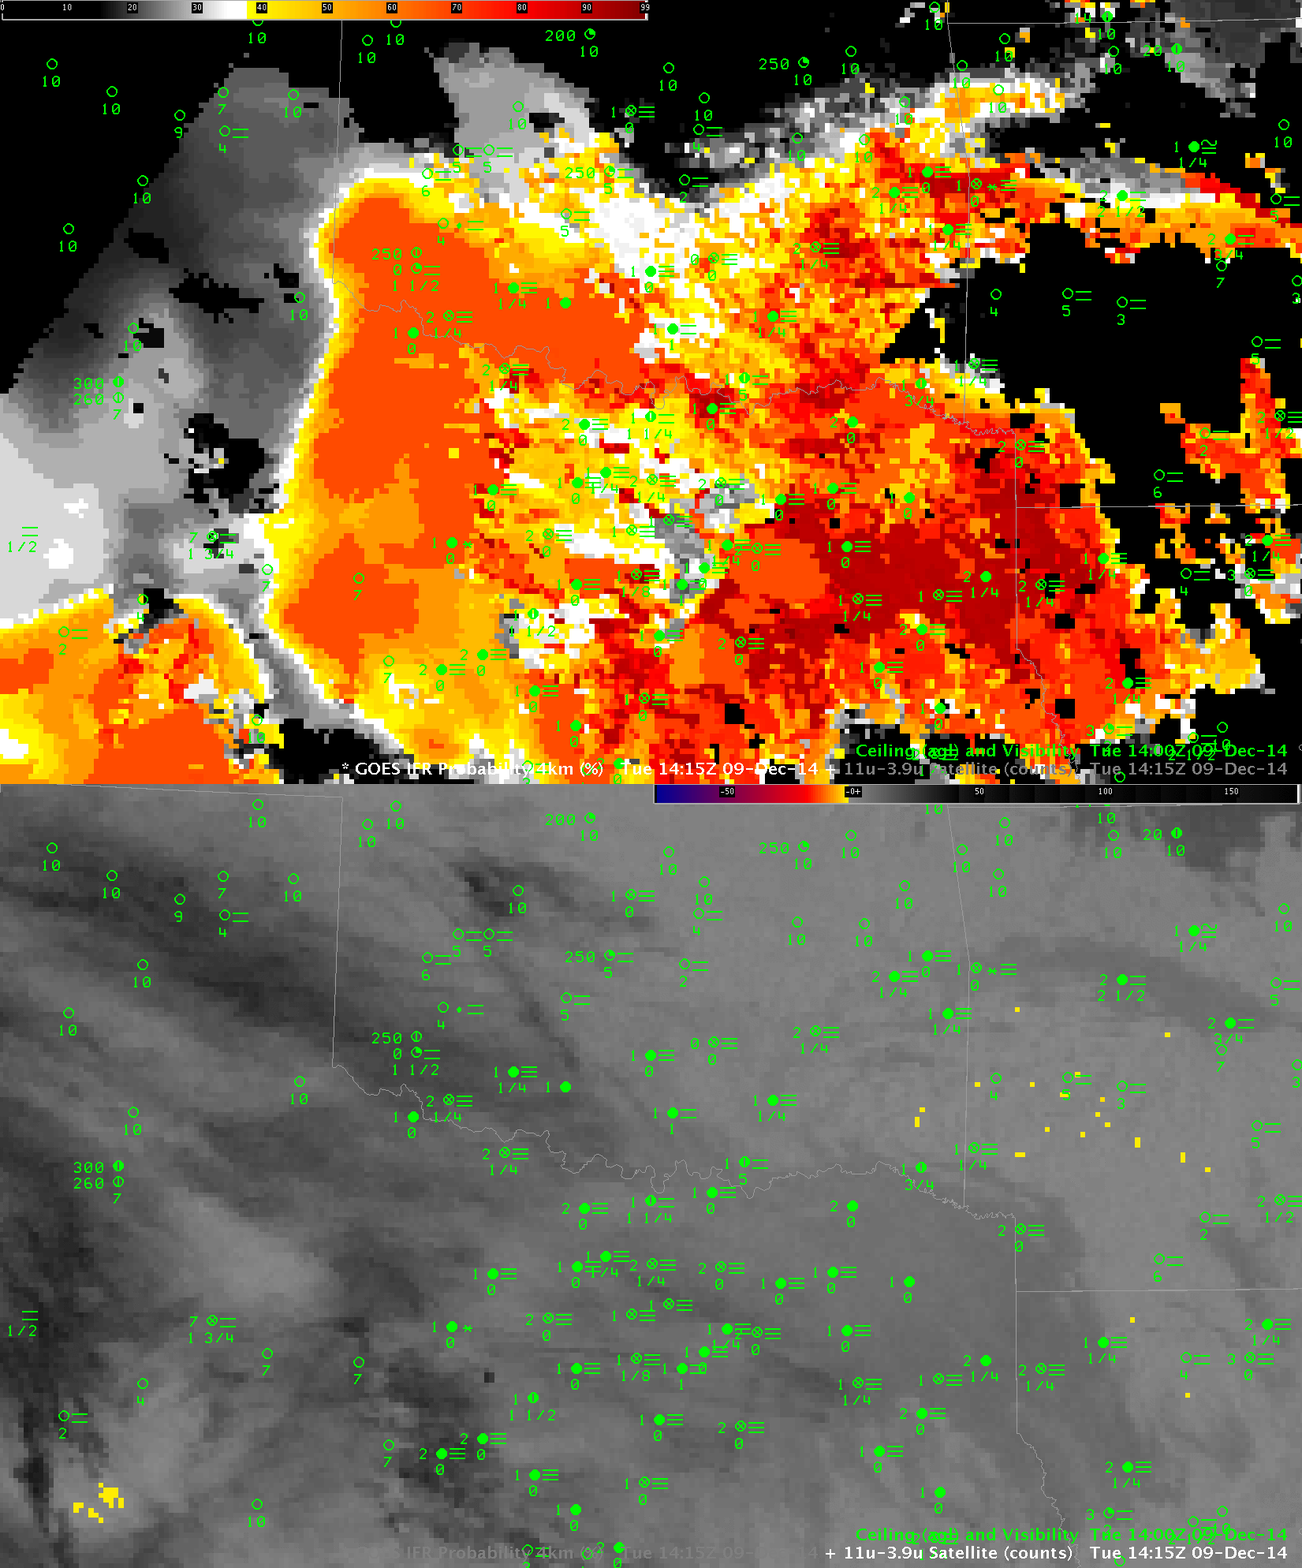
The toggles below show data from 0615, 1115 and 1415 UTC and demonstrate why a fused product can give better information than a satellite-only product. Intermittent high clouds over the southern Plains prevented GOES-13 from identifying regions of low clouds (Cirrus clouds in the enhancement below appear as dark regions). IFR Probabilities can give valid information in these regions because the Rapid Refresh Model gives information about the possibility of low-level saturation. There are large regions at 1415 UTC over west Texas that are covered by cirrus clouds; despite the inability of the satellite to detect low clouds, IFR Probability maintains a strong signal there where IFR Conditions are occurring. The 1415 Brightness Temperature Difference field, in contrast to the IFR Probability field, gives very little information because increasing amounts of solar radiation are changing the relationship between 10.7µm and 3.9µm radiation at 1415 UTC.

IFRPROB_BTD_0615_9Dec2014

GOES-R IFR Probabilities and GOES-13 Brightness Temperature Difference Fields (10.7µm – 3.9µm), 0615 UTC on 9 December 2014, along with surface observations of ceilings and visibilities (Click to enlarge)

IFRPROB_BTD_1115_9Dec2014

As above, but at 1115 UTC (Click to enlarge)

IFRPROB_BTD_1415_9Dec2014

As above, but at 1415 UTC (Click to enlarge)

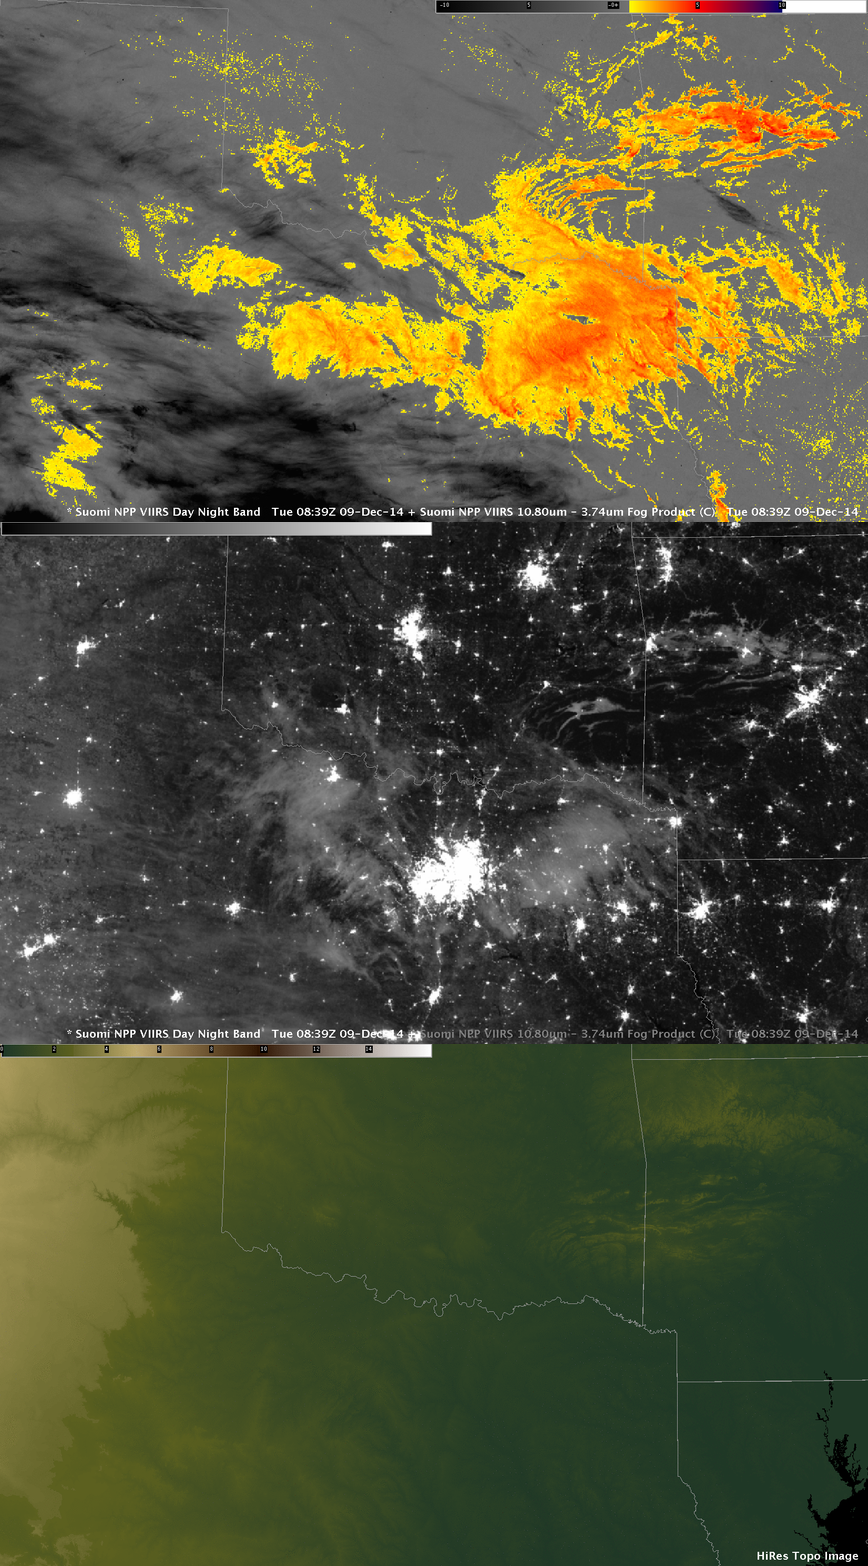
A near-Full Moon on 9 December means that the Day Night Visible imagery from Suomi NPP produced great imagery of the clouds over the southern Plains. The toggle below shows the Day Night band, the brightness temperaure difference field (11.35µm – 3.74µm) and the topography. Very narrow fog banks are apparent over southeast Oklahoma and over Arkansas, nestled into narrow valleys. The Brightness Temperature Difference field distinguishes between water-based clouds (presumably low stratus or fog) in orange and ice clouds (cirrus) in black.

SNPP_BTD_DNB_0839UTC_09Dec2014

Suomi NPP Brightness Temperature Difference (11.35µm – 3.74µm) fields, Day Night band imagery and Color-shaded topography, 0839 UTC 9 December 2014 (Click to enlarge)

The fog event over Dallas was photographed from the air: Link.

More fog over South Carolina

Dense fog redeveloped over South Carolina overnight on 3-4 December 2014, and as noted in the Forecast Discussion below, its character was just a bit different than on the previous night.

000
FXUS62 KCHS 040239
AFDCHS

AREA FORECAST DISCUSSION
NATIONAL WEATHER SERVICE CHARLESTON SC
939 PM EST WED DEC 3 2014

.SYNOPSIS…
UNDER A WEAKENING WEDGE OF HIGH PRESSURE…FOG WILL PERSIST TONIGHT.
ANOTHER AREA OF HIGH PRESSURE WILL BUILD FROM THE NORTH THURSDAY THROUGH
FRIDAY. A WARM FRONT WILL THEN LIFT ACROSS THE AREA ON SATURDAY…
BEFORE A COLD FRONT MOVES THROUGH SATURDAY NIGHT. AN INLAND WEDGE
OF HIGH PRESSURE WILL BECOME ESTABLISHED SUNDAY AND MONDAY…FOLLOWED
BY THE PASSAGE OF ANOTHER COLD FRONT MONDAY NIGHT. HIGH PRESSURE
WILL THEN PREVAIL INTO THE MIDDLE OF NEXT WEEK.

&&

.NEAR TERM /UNTIL 6 AM THURSDAY MORNING/…
WHILE THE SCENARIO IS QUITE DIFFERENT FOR FOG TONIGHT COMPARED TO
LAST NIGHT…DESPITE PLENTY OF CIRRIFORM CLOUDS /SOME OF WHICH ARE
OPAQUE/
…WE ARE STILL GETTING AREAS OF FOG TO FORM. SOME OF THE
FOG IS ALREADY DENSE…ESPECIALLY IN THE CHARLESTON QUAD COUNTY
AREA AND ALONG OUR COASTAL ZONES SOUTH INTO MCINTOSH. THIS IS A
MIX OF STRATUS BUILD-DOWN AND ADVECTIVE FOG FROM OFF THE ATLANTIC
.
SO WE LOOK FOR A FURTHER EXPANSION OF THE FOG INLAND TO THE WEST
OF I-95 THROUGH THE NIGHT. DENSE FOG ADVISORIES WILL THEREFORE
REMAIN IN EFFECT.

IFRProb_04Dec2014anim

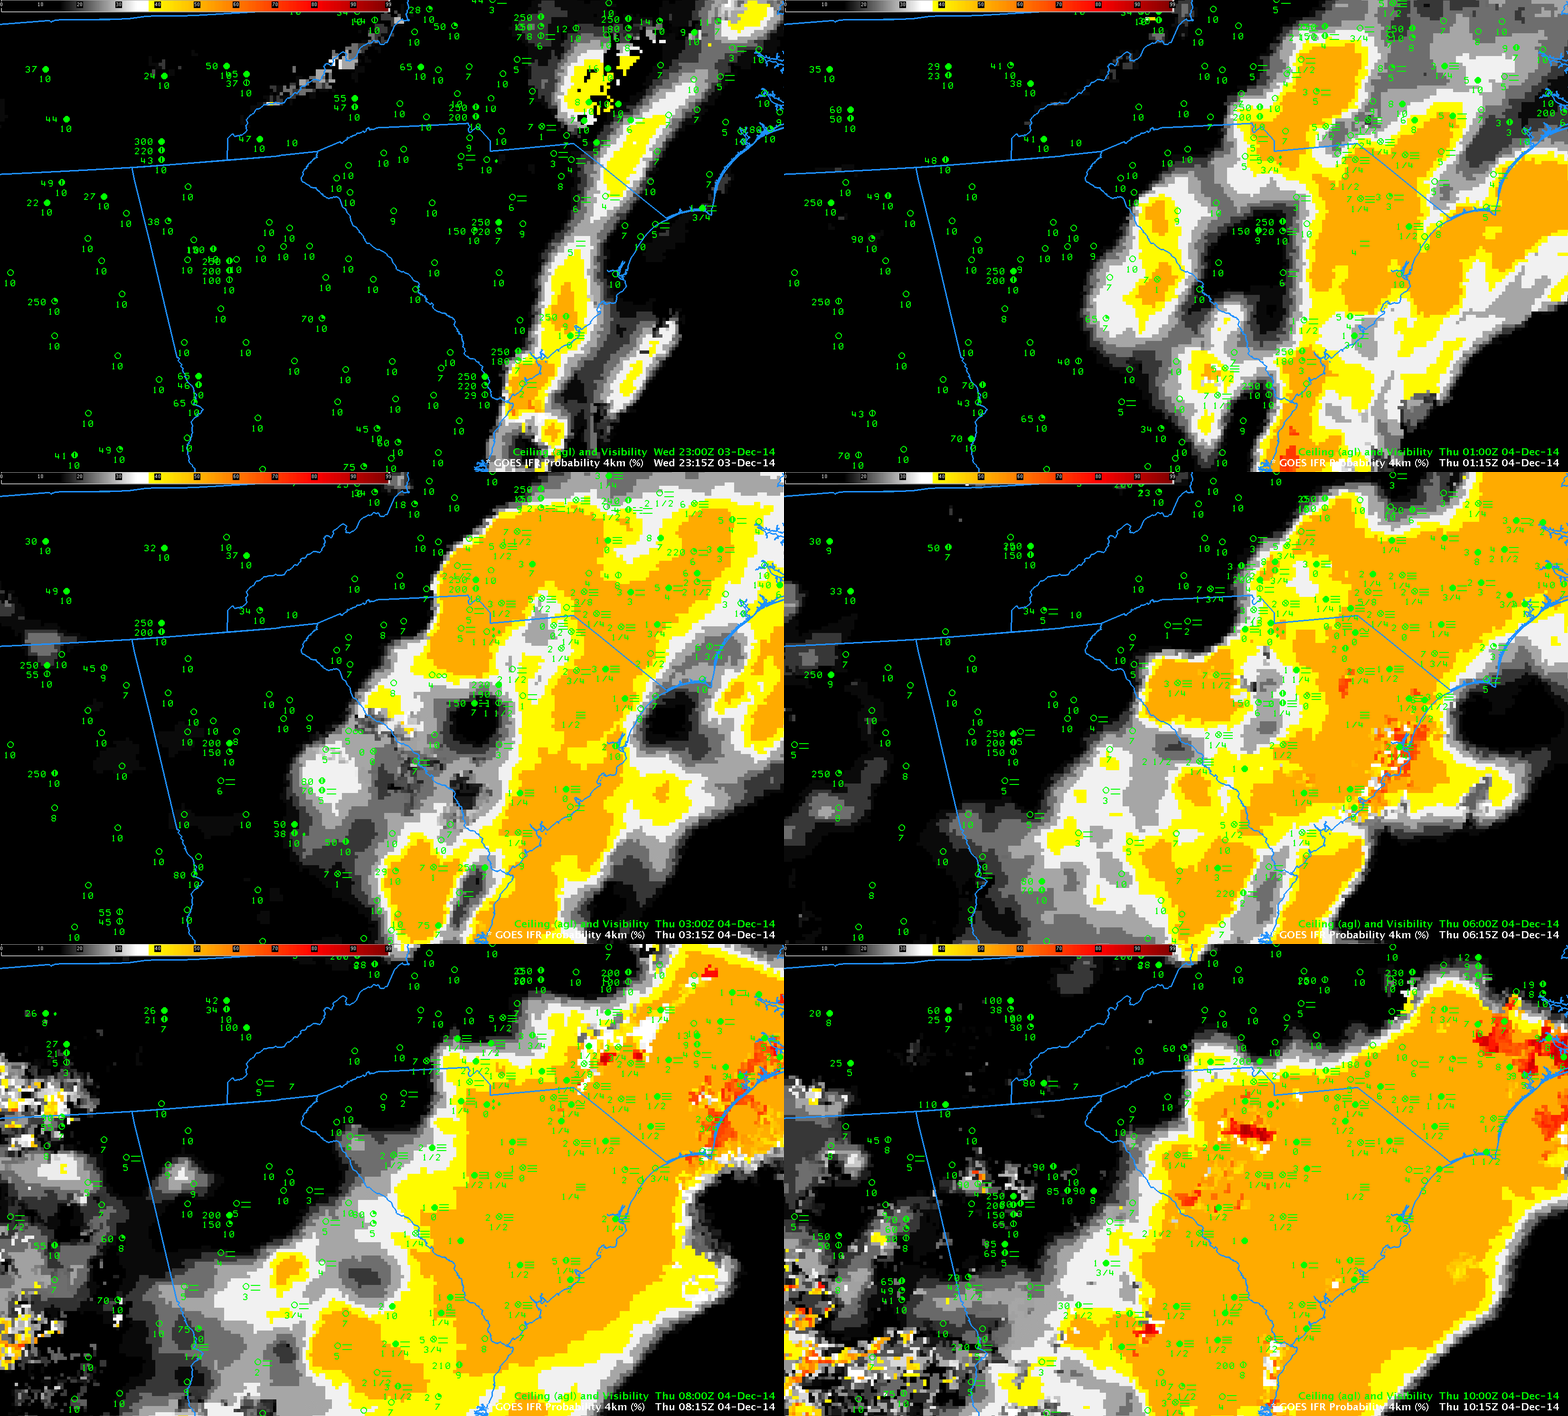
GOES-based GOES-R IFR Probabilities, hourly from 2315 UTC 3 December through 1015 UTC on 4 December as well as observations of ceilings (AGL) and visibilities (Click to enlarge)

GOES-R IFR Probabilities, above, (click here for an animation with a faster dwell rate) once again capably outlined the region of IFR conditions over South Carolina. Probabilities are lower when Satellite data cannot be used as a predictor, as when cirrus clouds prevent the satellite from viewing water-based clouds closer to the surface. In such cases when only Rapid Refresh model data can be used as Fog Predictors, the fields take on a flatter, less pixelated character as above. There are a few regions where breaks in the cirrus cloud allow Satellite predictors to be incorporated in the IFR Probability fields, for example along the South Carolina coast at 0600 UTC. When high clouds are present, interpret the magnitude of the IFR Probability in a different way than when high clouds are absent. An IFR Probability of 55% in a region of cirrus clouds has a different meaning than an IFR Probability of 55% in a region of only low clouds.

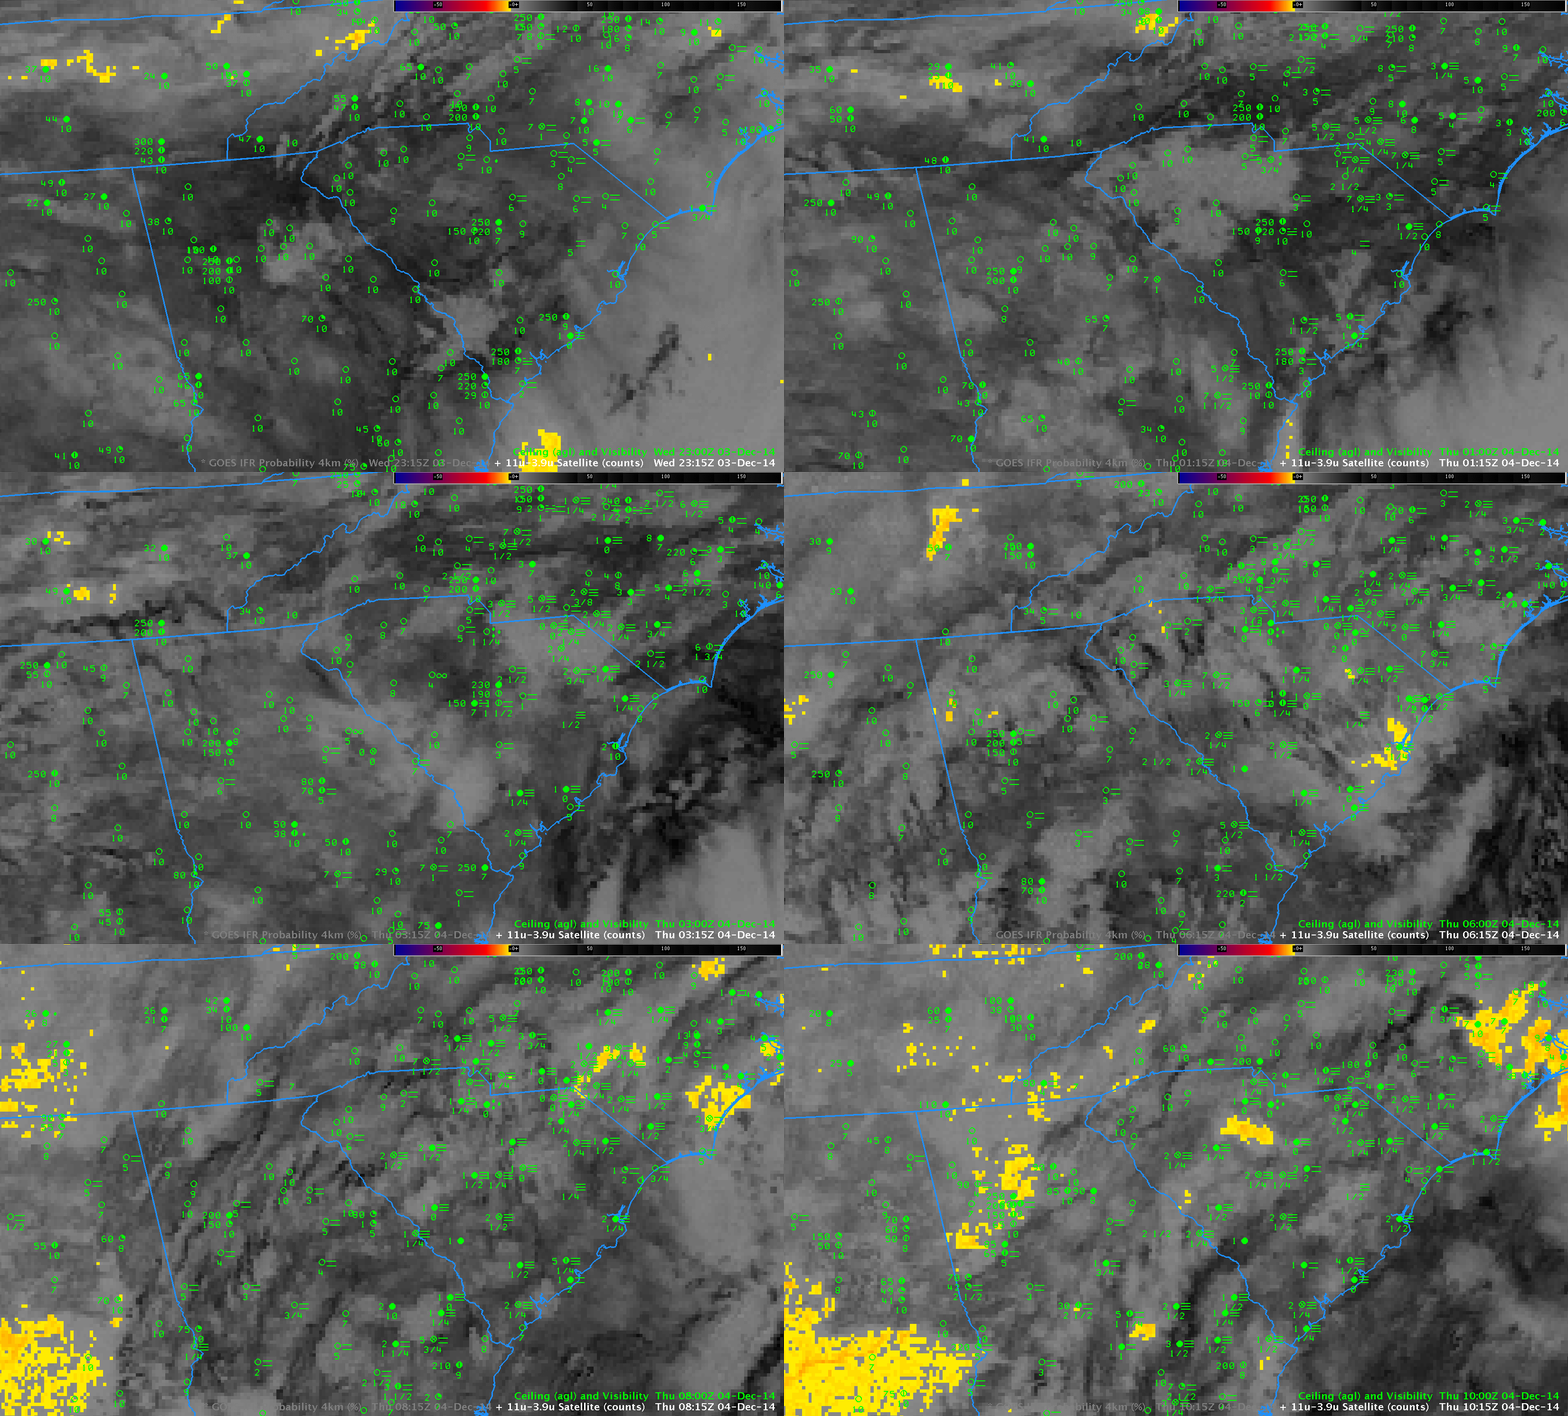
Because of Cirrus clouds, the brightness temperature difference fields gave almost no information about the presence of low clouds. See the animation below (a loop with a faster dwell rate is here).

BTD_GOES13_4DEC2014anim

GOES-13 Brightness Temperature Difference Fields (10.7µm – 3.9µm), hourly from 2315 UTC 3 December through 1015 UTC on 4 December, as well as observations of ceilings (AGL) and visibilities (Click to enlarge)

Advection Fog with a Cyclone over the Midwest

GOES_IFR_PROB_20141123_2307

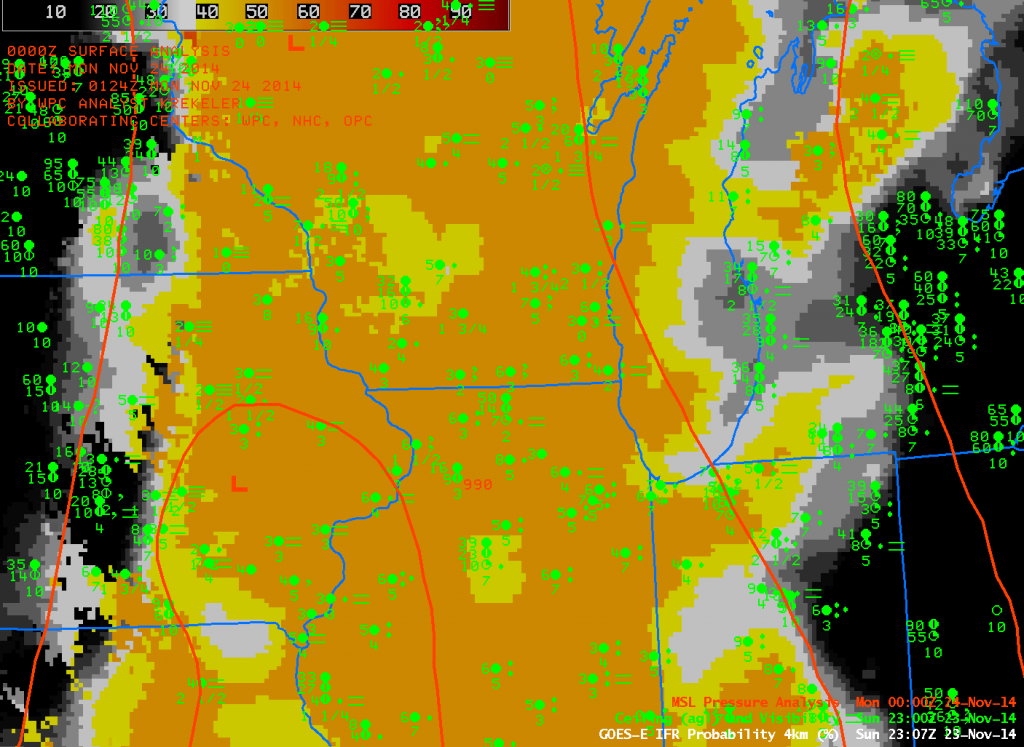
GOES-based GOES-R IFR Probabilities and surface observations of Ceilings and Visibilities, ~2300 UTC, and the 0000 UTC HPC Analysis of surface pressure (Click to Enlarge)

In the image above, a trough of low pressure is depicted along the Mississippi River, with moist southerly flow over the Ohio Valley and Western Great Lakes (Dewpoints in Wisconsin at this time were mid- to upper-40s (Fahrenheit). This moist air is easily cooled to its dewpoint by the underlying cool ground, and dense fog is a result. However, this fog is difficult to detect from satellite because of the multiple cloud layers that accompany low pressure systems. GOES-R IFR Probabilities show a good signal because of Fog Predictors that are derived from numerical model output (the numerical model used is the Rapid Refresh). In this case, the Rapid Refresh was accurately depicting the evolution of the system because the model-based field of IFR Probabilities accurately overlaps the region of observed IFR (and near-IFR) conditions.

Fog over the Northeast under Cirrus Clouds

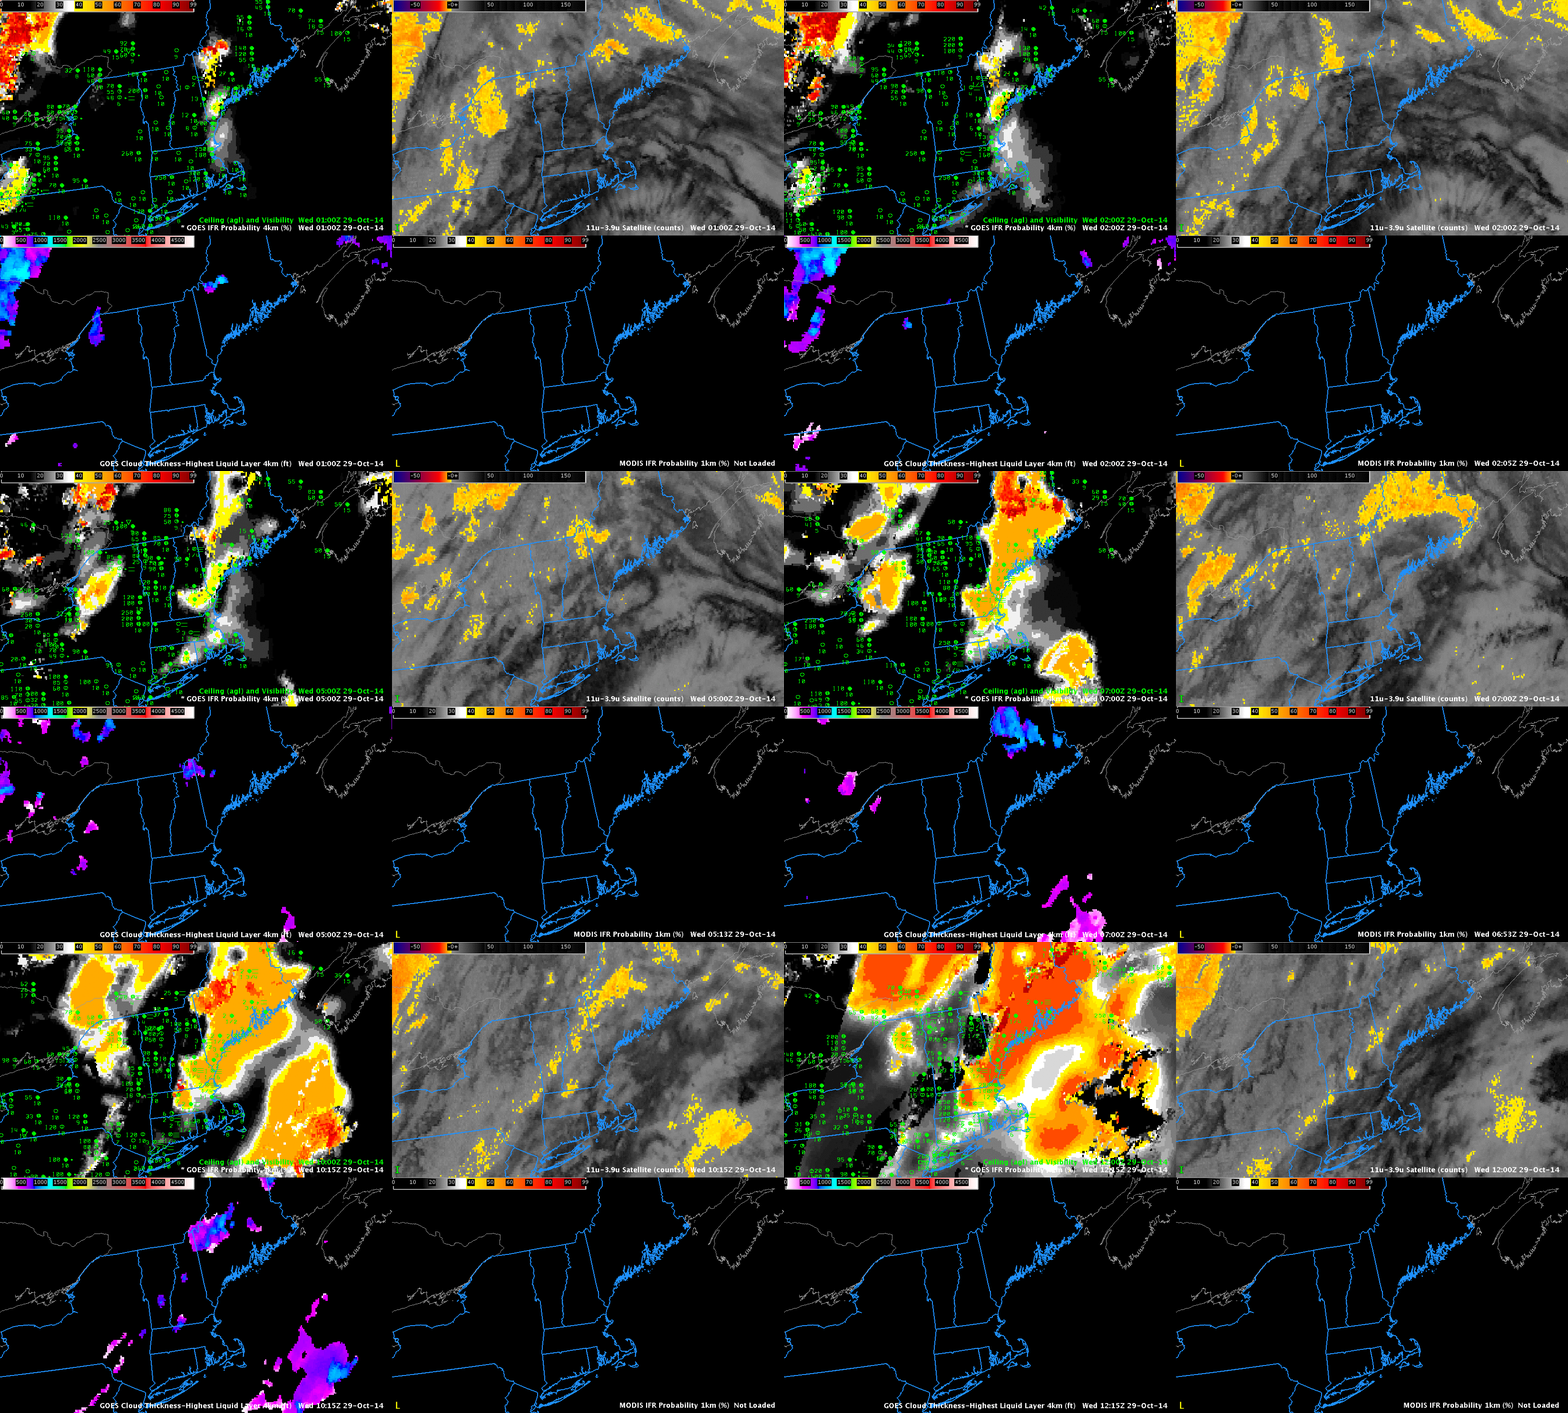
The system that produced cirrus to obscure satellite-based observations of low clouds and fog over the Southeast US on 29 October (link) had the same effect over the Northeast United States: Multiple Cloud Layers with an extratropical system will prevent satellites from identifying regions of low clouds and fog. Any kind of fog detection algorithm, then, must incorporate surface-based observations (as in a model, for example) to provide useful information when multiple cloud layers are present.

GOES_IFR_4Panel_Northeast_29October2014_00_12

GOES-based GOES-R IFR Probabilities (Upper Left), GOES-13 Brightness Temperature Difference (10.7µm – 3.9µm) (Upper Right), GOES-based GOES-R Cloud Thickness (Lower Left), MODIS-based GOES-R IFR Probabilities (Lower Right) (Click to enlarge)

WFOs in the northeast issued Dense Fog Advisories for the morning of 29 October (and retweeted fog images from the public). (Link) The animation above shows the evolution of GOES-based GOES-R IFR Probabilities and GOES-13 Brightness Temperature Difference fields. Little information can be gleaned from the brightness temperature difference fields; however, the IFR Probability does show high probabilities where IFR and near-IFR conditions develop from coastal Massachusetts northeastward through coastal Maine. The flat character of the IFR Probability field occurs because Rapid Refresh model data are being used as predictors in the computation of IFR Probability, and those model fields do not vary quickly. When satellite data are also used — as over Quebec at the start of the animation — the IFR Probability fields have a pixelated character.

IFR Probabilities increase on the last frame of the animation. This occurs because the region becomes sunlit, and cloud-clearing abilities increase. The algorithm to compute IFR Probability therefore has greater confidence that clouds are present and probabilities increase.

Fog over the Southeast under Cirrus Clouds

GOES13_BTD_IFR_29Oct2014_1015

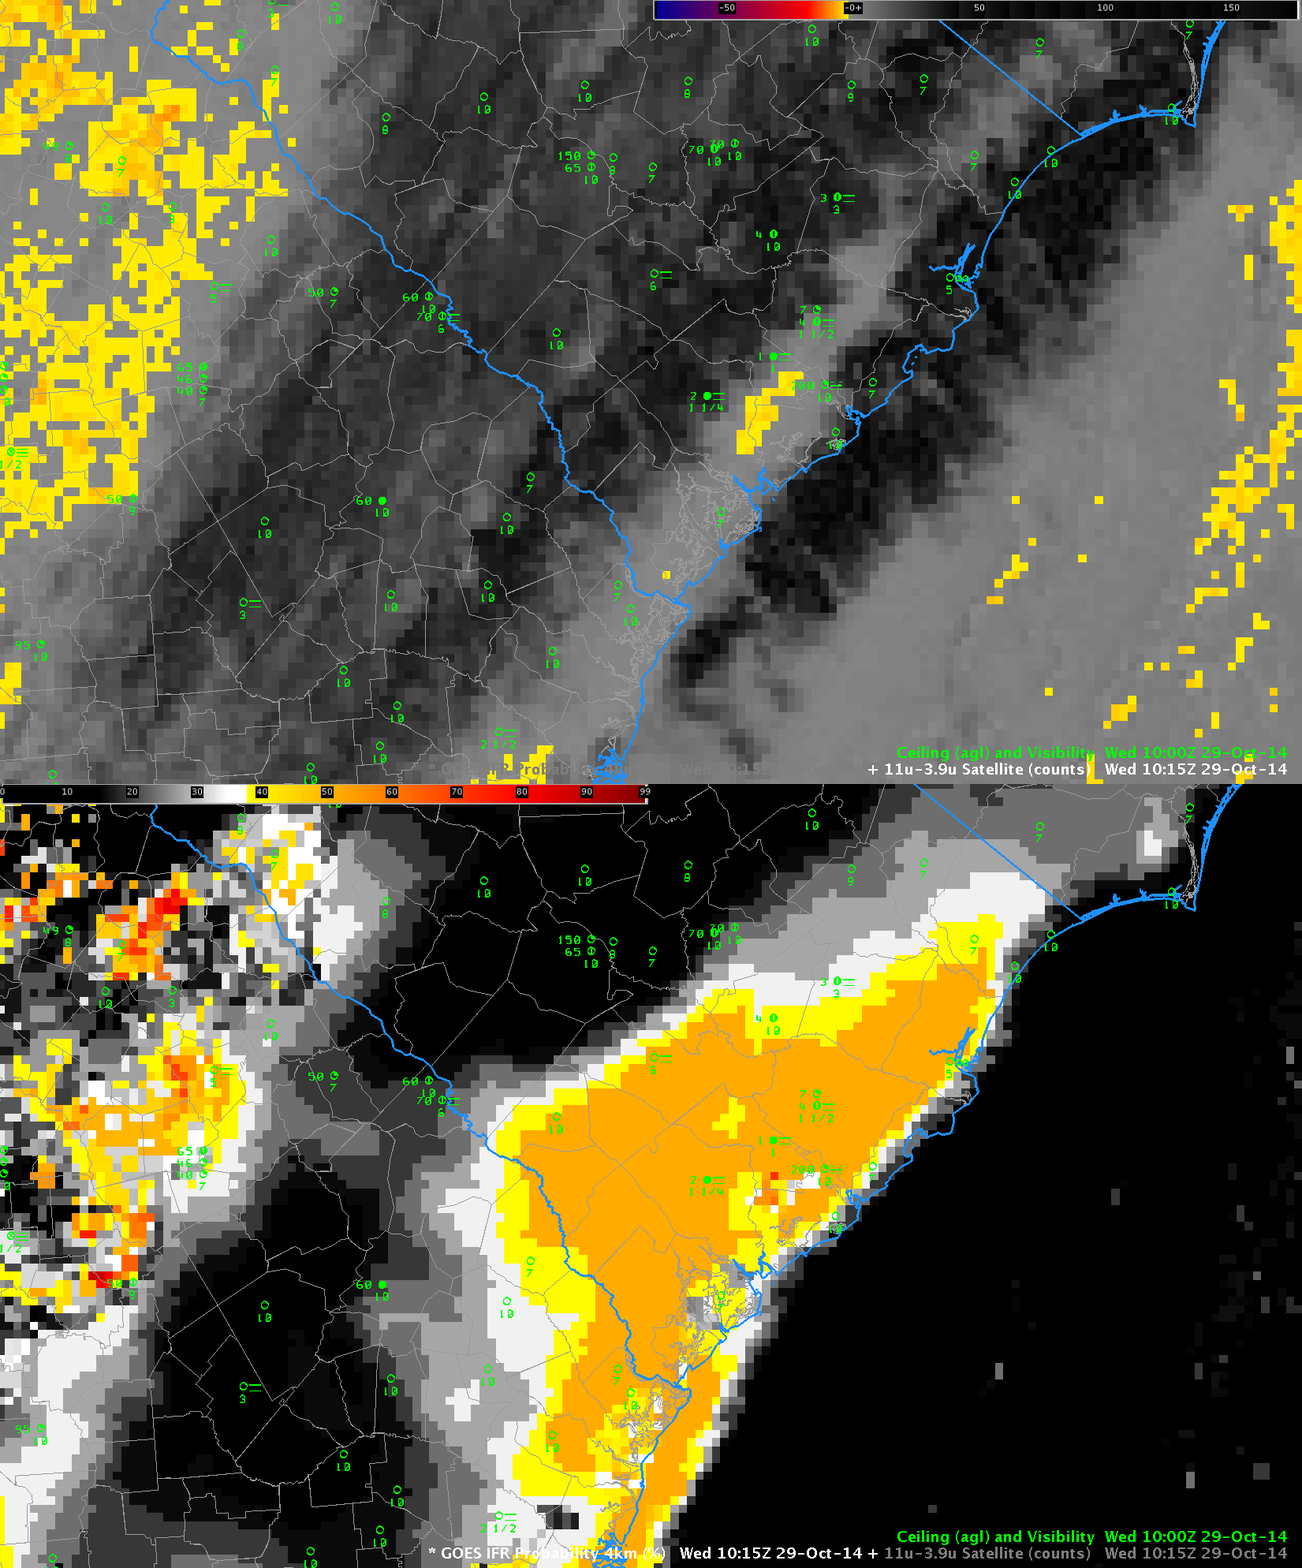
Toggle between GOES-13 Brightness Temperature Difference (10.7µm – 3.9µm) and GOES-based GOES-R IFR Probabilities at 1015 UTC 29 October, with ceilings and visibilities plotted (Click to enlarge)

On the morning of 28 October 2014, Fog developed over the southeast under clear skies. On the morning of 29 October, Fog developed under cirrus clouds. When cirrus clouds are present, the brightness temperature difference product gives no information on low clouds, and the GOES-R IFR Probability fields rely on model data only to provide information. The toggle above shows IFR Probability Fields that overlap the region of reduced ceilings/visibilities in coastal South Carolina. Because model data are the primary predictor used, the field is much smoother (less pixelated) than when satellite data can also be used as a predictor.

GOES-R IFR Probabilities as a Weather System Moves Out

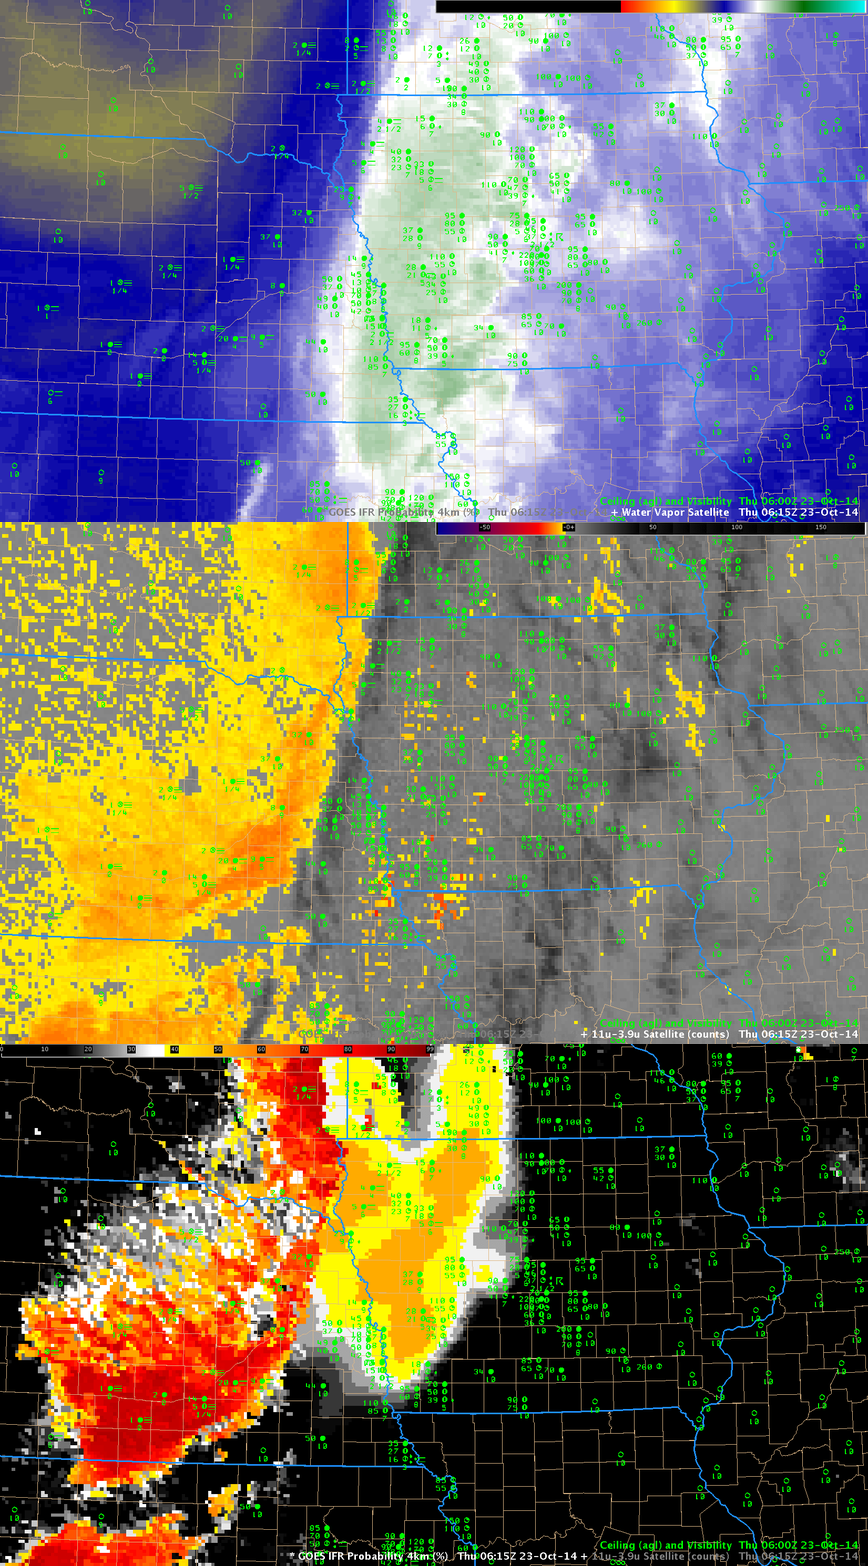
GOES_WV_BTD_IFR_23Oct2014_0615

GOES-13 Water Vapor (6.5µm), Brightness Temperature Difference (10.7µm – 3.9µm) and GOES-based IFR Probabilities, all at 0615 UTC 23 October 2014, with surface observations of ceilings and visibilities (click to enlarge)

When a baroclinic system moves through a CWA, drops precipitation and then exits after sunset, the stage is often set for the development of radiation fog. The animation above cycles through the 0615 UTC imagery: GOES-13 Water Vapor (6.5 µm), GOES-13 Brightness Temperature Difference (10.7µm – 3.9µm) and GOES-based GOES-R IFR Probabilities. The upper-level reflection of a surface cold front moving through eastern Nebraska and western Iowa (link) is obvious in the (infrared) water vapor imagery, and also in the brightness temperature difference field.

The difficulty that arises with multiple cloud layers that invariably accompany these systems is that the mid- and high-level clouds do not allow for an accurate satellite-only-based depiction of low stratus and fog. GOES-R IFR Probabilities allow for that kind of depiction because near-surface saturation is considered in the computation of IFR Probabilities (using data from the Rapid Refresh Model). Thus, IFR Probabilities correctly suggest the presence of reduced visibilities over extreme northwestern Iowa and they alert a forecasters to the possibility of fog over much of western Iowa.
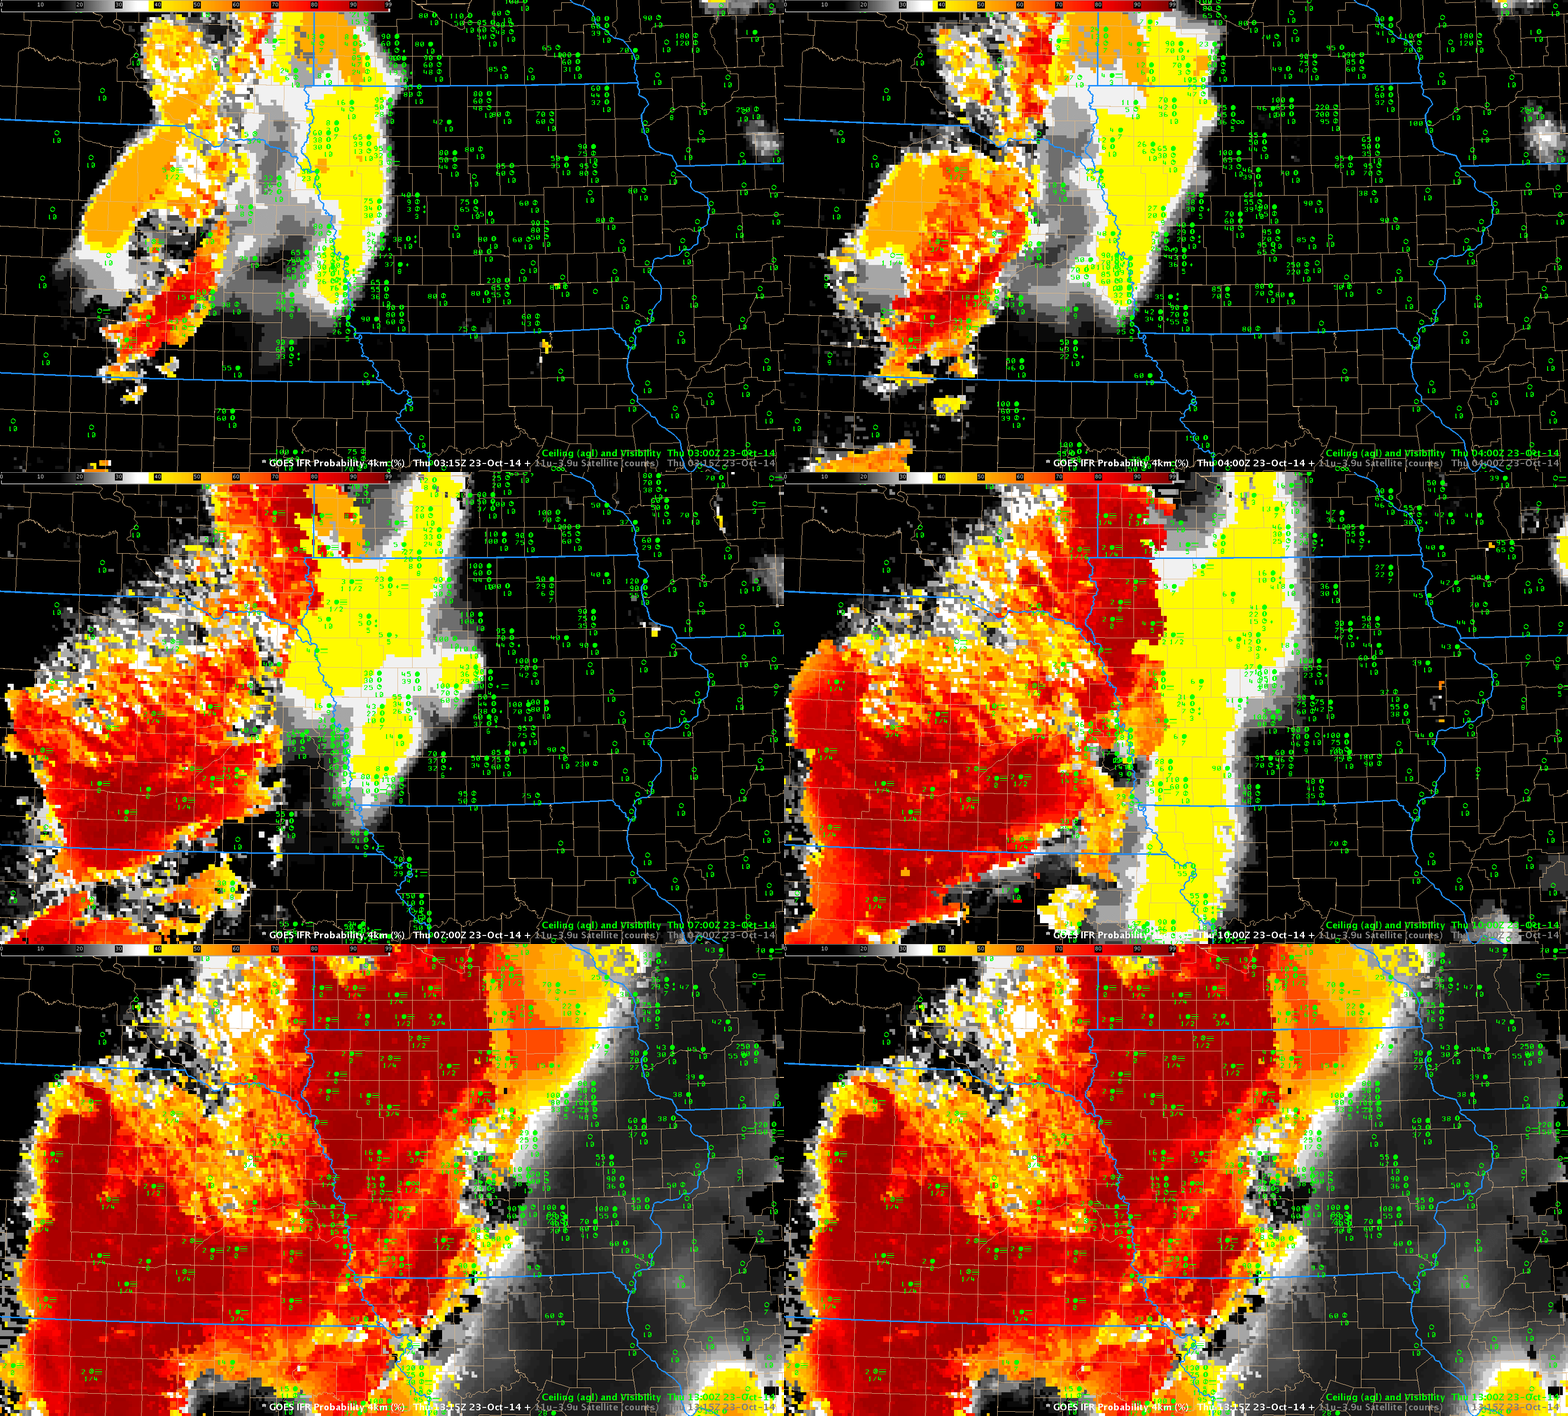
GOES_IFR_23Oct2014_03-13

GOES-based IFR Probabilities, 03-13 UTC 23 October 2014 (Click to enlarge)

The animation of GOES-R IFR Probability fields, above, shows the steady increase in probability that accompanied the reduction in ceilings and visibilities. The character of the IFR Probability fields is testimony to the data that are used to create them. The fairly flat fields over Iowa early in the animation mean that satellite data cannot be used as a predictor (because of the multiple cloud levels that are present there, as apparent in the animation below). Instead, the model fields (that are fairly flat compared to satellite pixels) are used and horizontal variability in the field is small. In addition, IFR Probability values themselves are somewhat smaller because fewer predictors can be used.

IFR Probabilities are more pixelated in nature over southern Nebraska where satellite-based predictors could be used. IFR conditions are widespread in that region where IFR Probabilities exceed 90%. Note how IFR probabilities are smaller over Kansas, in a region of mid-level stratus (but not fog). The brightness temperature difference field there maintains a strong signal. IFR probability fields do a superior job of distinguishing between mid-level stratus and low stratus/fog (compared to the brightness temperature difference field). This is because a mid-level stratus deck and a fog bank can look very similar from the top, but an accurate Rapid Refresh model simulation of that atmosphere will have starkly different humidity profiles.
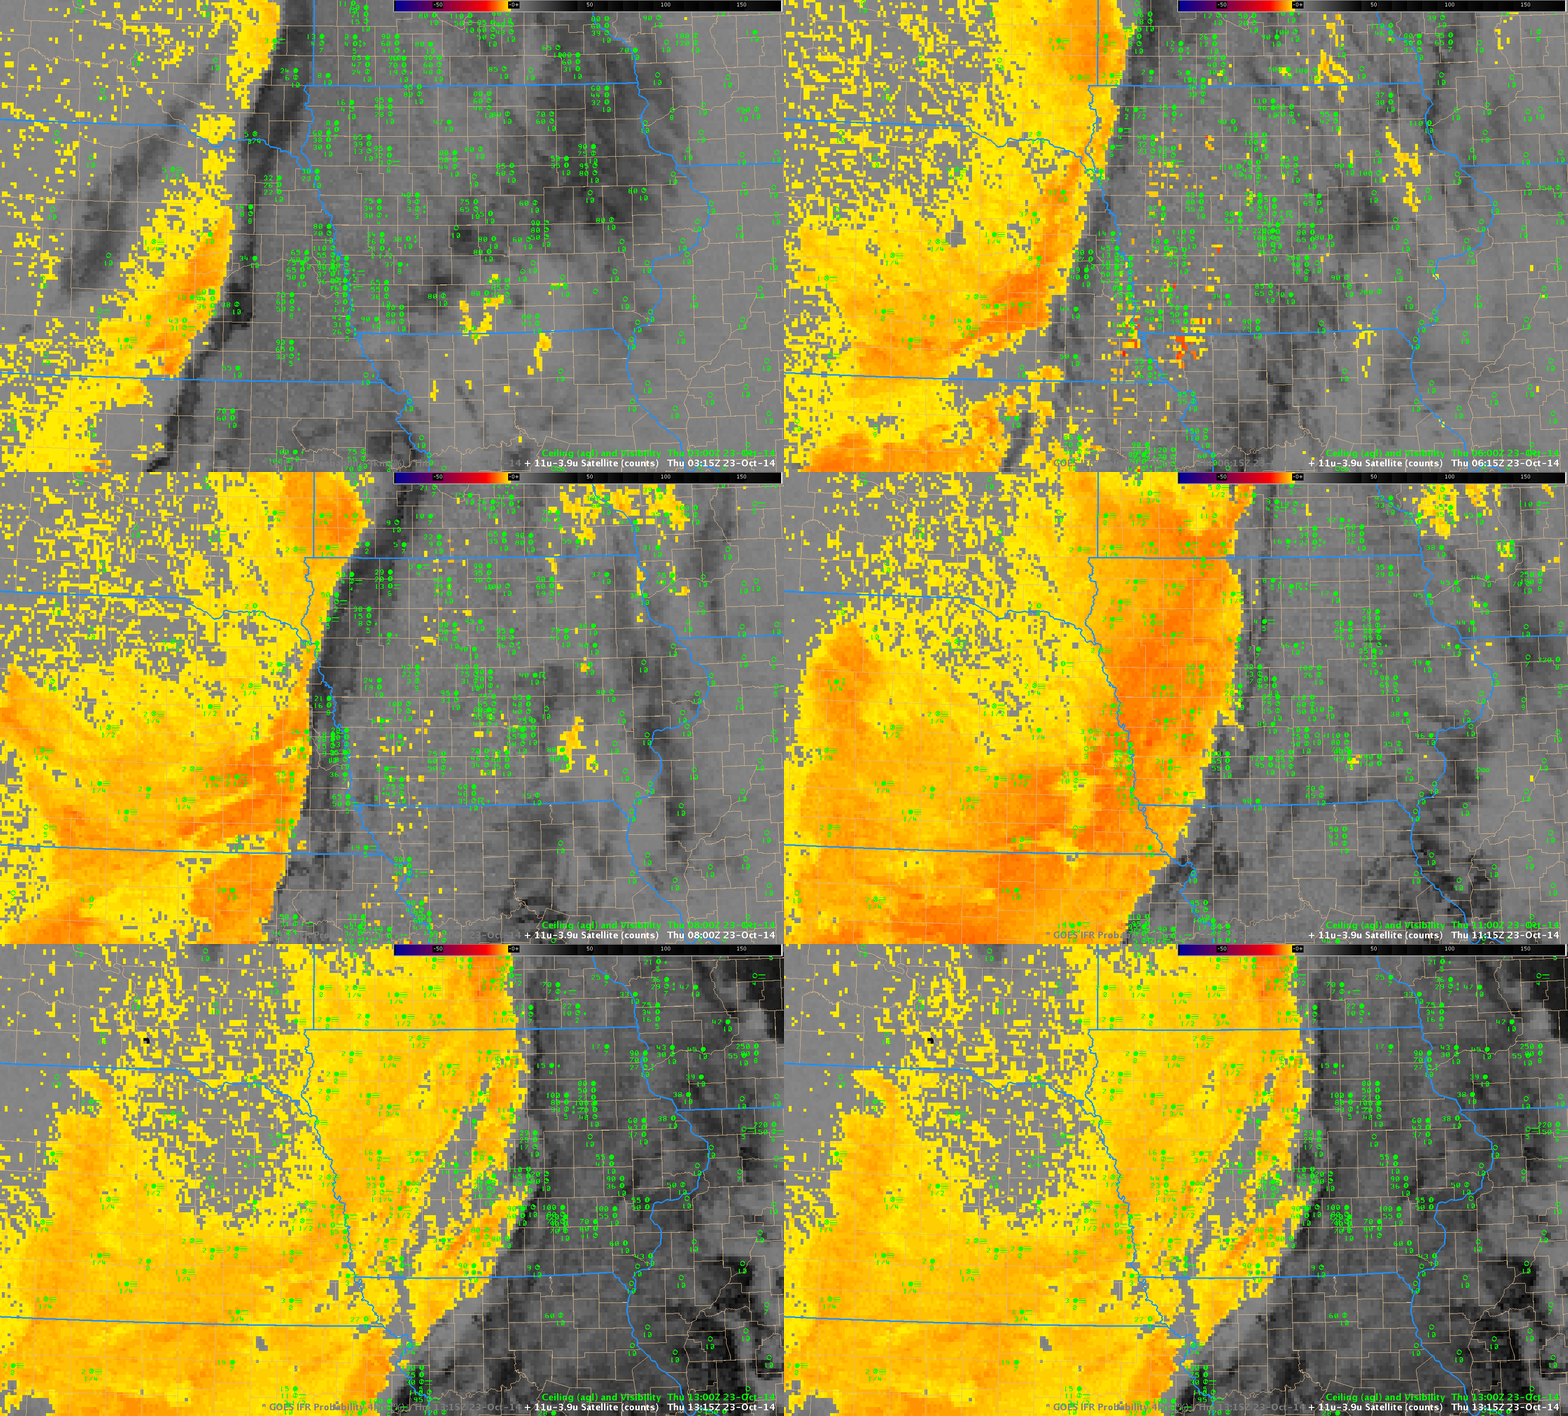
GOES_BTD_23Oct2014_03-13

GOES-13 Brightness Temperature Difference (10.7µm – 3.9µm) Fields hourly from 0300 through 1300 UTC 23 October, including surface observations of ceilings and visibilities (Click to enlarge)

At 1400 UTC (below), the rising sun (and its abundant 3.9 µm energy that can be easily scattered off clouds) causes the sign of the brightness temperature difference field to flip. (Compre the 1400 UTC Brightness Temperature Difference Field below to the final Brightness Temperature Difference field (1300 UTC) in the animation above!) However, the IFR Probability field maintains its character through sunrise.
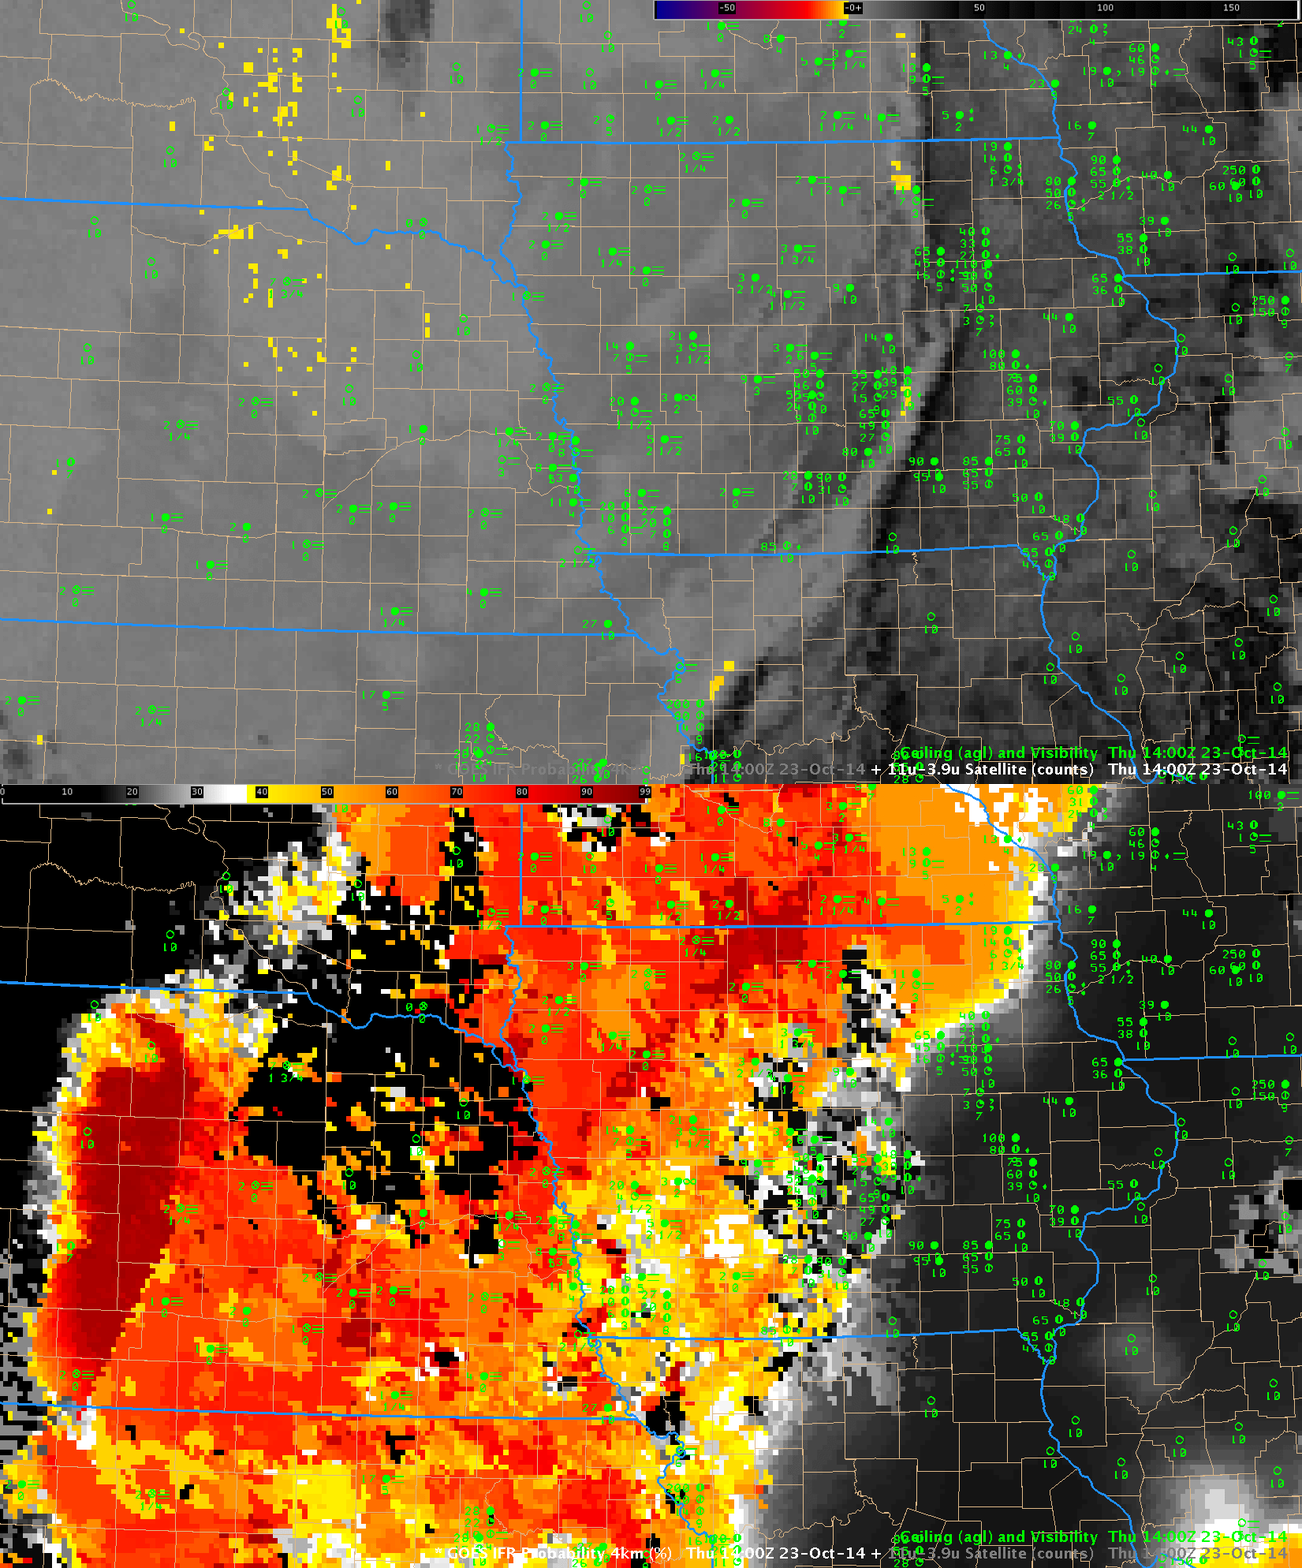
GOES_BTD_IFR_23Oct2014_14z

GOES-13 Brightness Temperature Difference (10.7µm – 3.9µm) and GOES-based IFR Probabilities, all at 1400 UTC 23 October 2014, with surface observations of ceilings and visibilities (click to enlarge)

The NSSL WRF accurately suggested that fog/low stratus was possible. The brightness temperature difference field from the model run, below, at 0900 UTC, shows a strong signal of low water-based clouds over western Iowa and Nebraska. (This link shows the latest model run (initialized at 0000 UTC) of Brightness Temperature Difference fields, with output from 0900 through 1200 UTC of the following day)
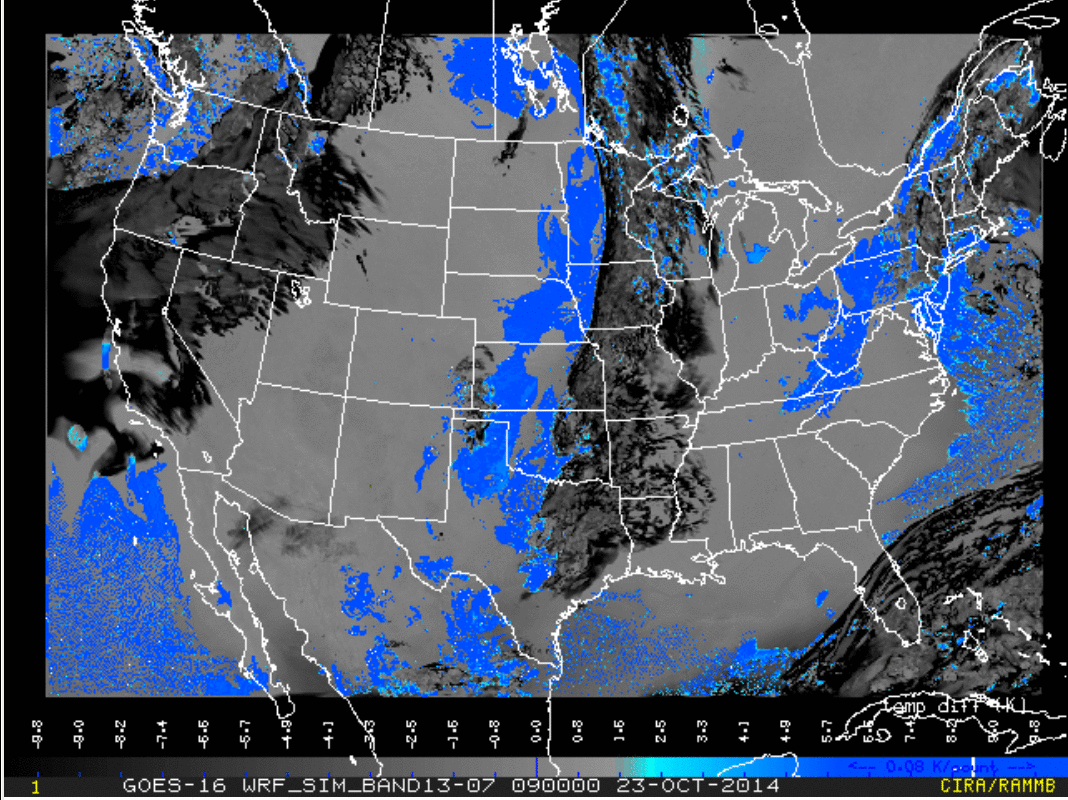
NSSL_WRF_BTD_0900_23Oct2014

Simulated Brightness Temperature Difference fields, 0900 UTC 23 October 2014, from the 0000 UTC NSSL WRF Model Run (Click to enlarge)

MODIS-based IFR Probability Fields were also available for this event, at 0824 UTC, below. As with the GOES, there is a noticeable (very!) difference between regions where Satellite Predictors are being used in the computation of IFR Probabilities (Nebraska) and regions where Satellite Predictors are not being used in the computation of IFR Probabilities (Iowa). The superior resolution of the MODIS data also suggests that River Valleys in eastern Nebraska are more likely foggy than adjacent land. The Elkhorn River between Norfolk and O’Neill, for example, shows up in the MODIS-based IFR Probability field as a thread of higher IFR Probability.
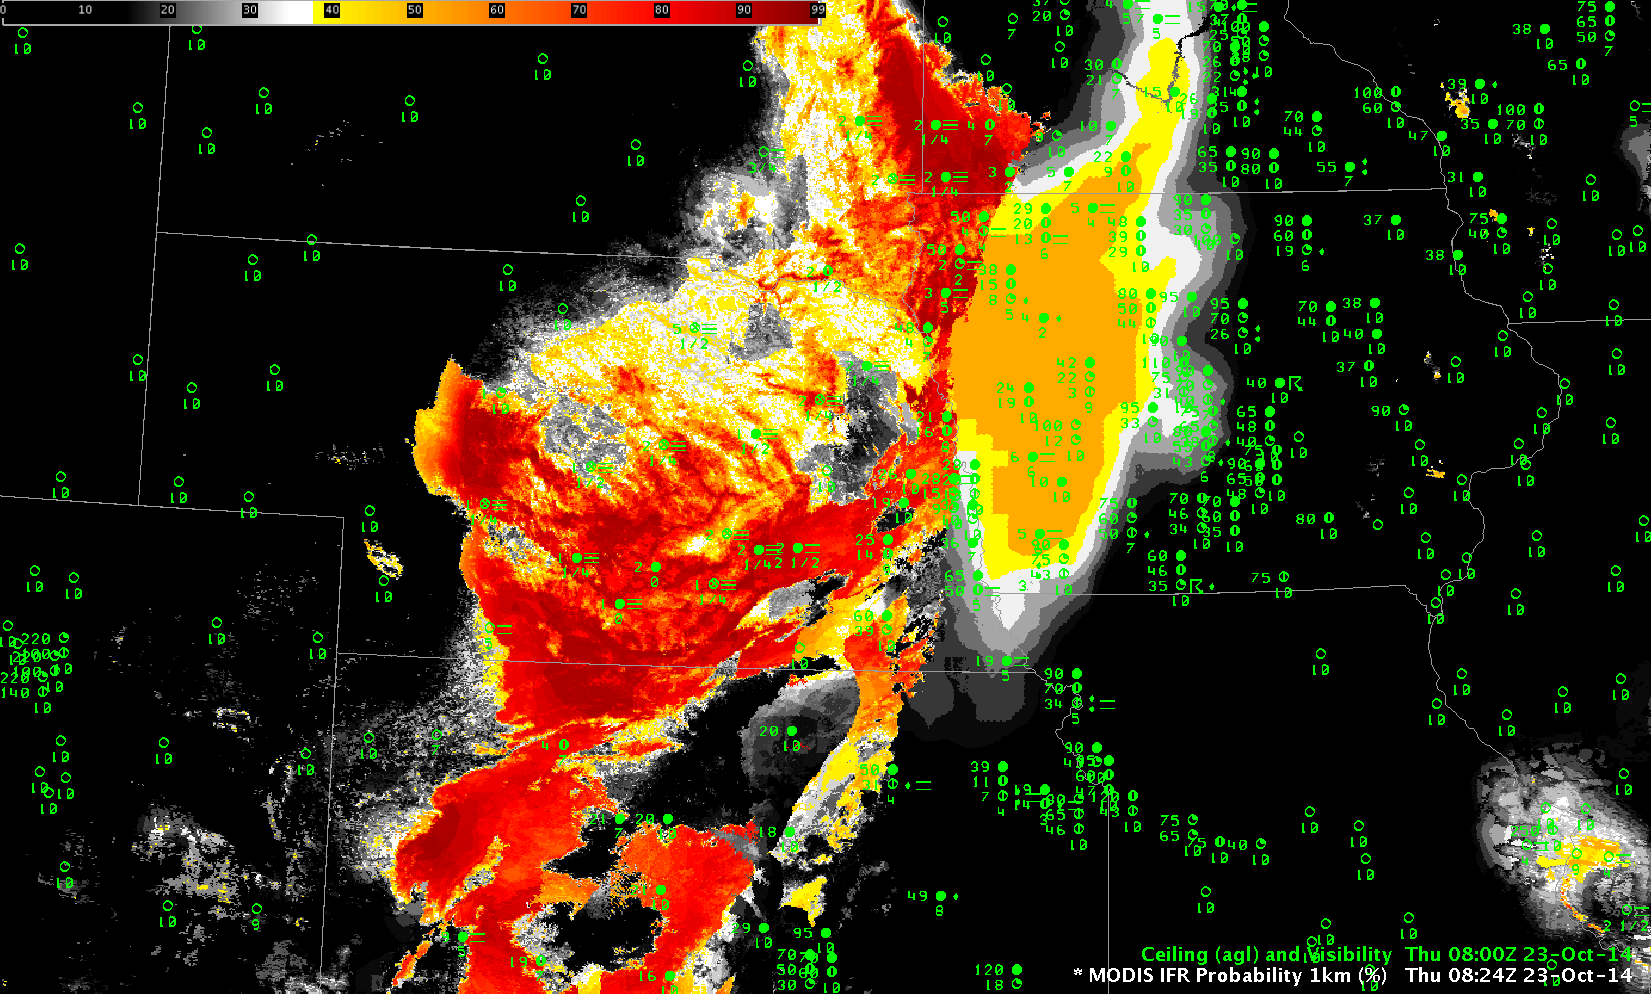
MODIS_IFR_23Oct2014_0824

MODIS-based IFR Probability at 0824 UTC, 23 October 2014 (Click to enlarge)
IFR Probabilities with a strong extratropical cyclone

GOES_IFR_1515UTC_13Oct2014

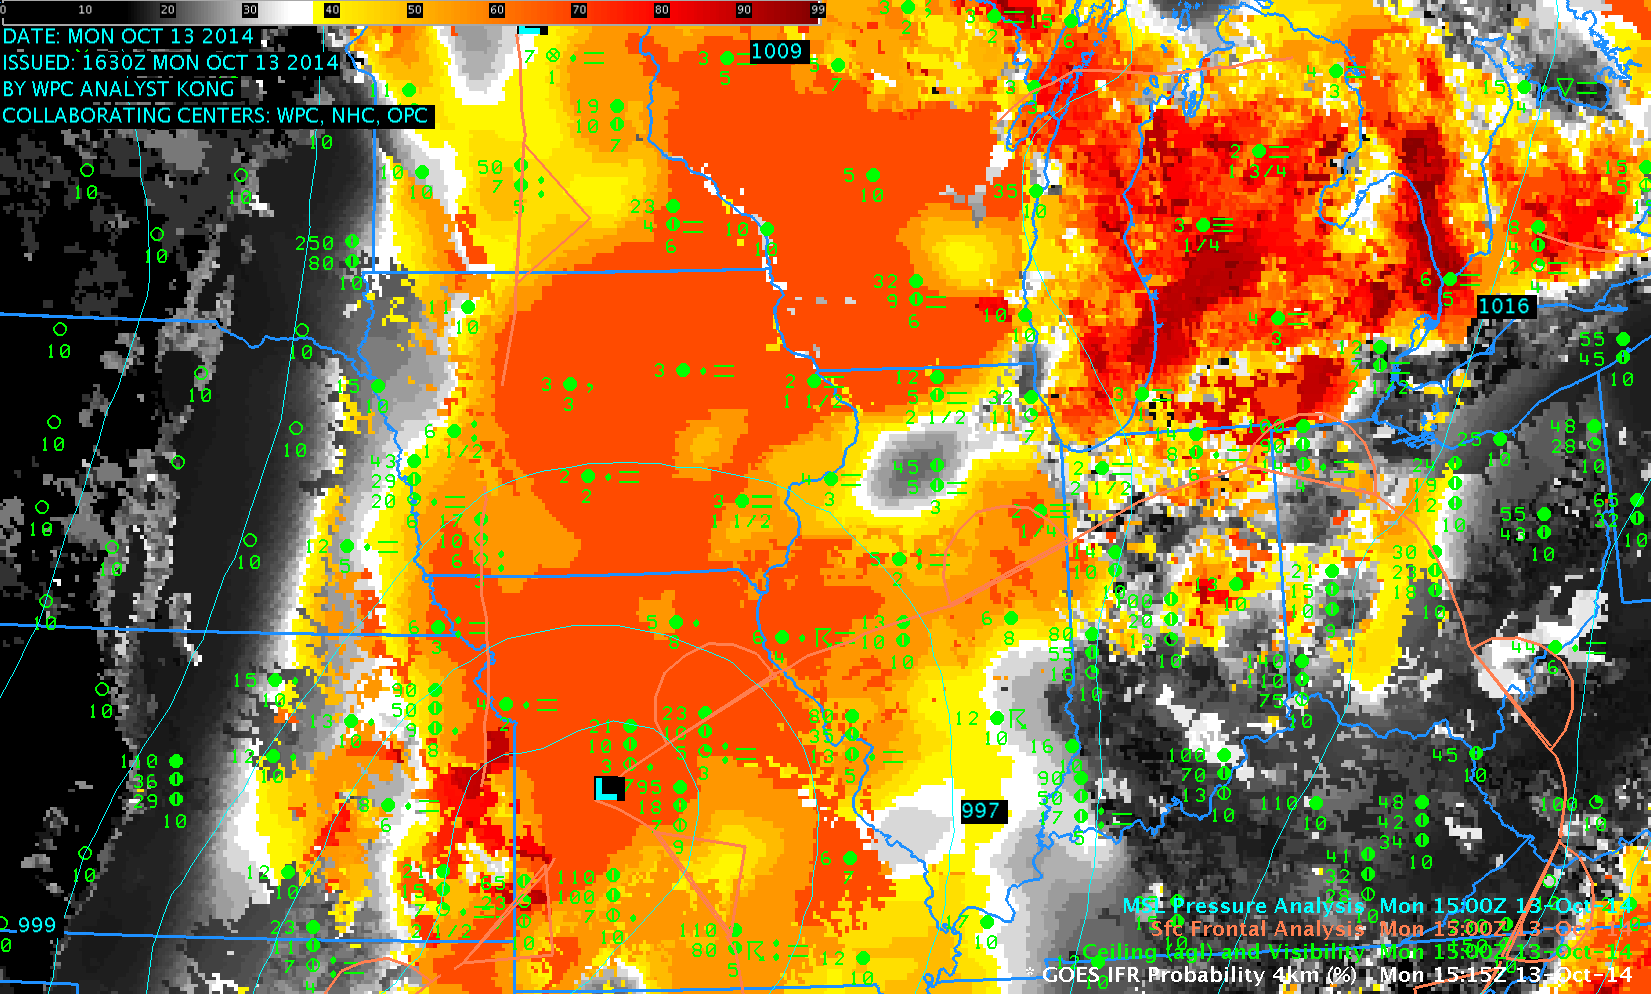
GOES-R IFR Probabilities over the upper Midwest, 1515 UTC on 13 October 2014, along with surface reports of Ceilings and Visibilities, and HPC Frontal / Pressure analyses (Click to enlarge)

Strong low pressure systems can cause IFR conditions over large areas, but the multiple cloud layers that accompany extratropical cyclogenesis make difficult the observation of low stratus, because higher cloud decks are invariably in the way of the satellite’s view. For such systems, inclusion of Rapid Refresh Data as a way of detecting low-level saturation is a must. In the imagery above, note that the highest IFR Probabilities are between the warm front (that emerges from the low in Missouri and stretches into Illinois and Indiana) and the trough that extends north of the low in Missouri.

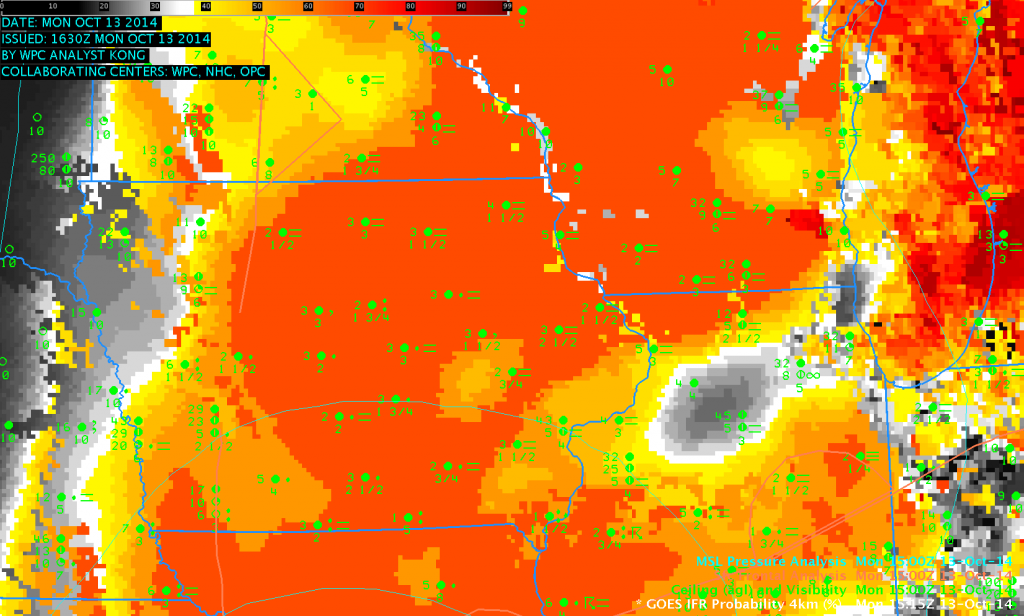
A zoomed-in view of the above image, below, centered over Iowa, does show good spatial correlation between observed IFR conditions and high IFR Probabilities. This suggests that the Rapid Refresh Model is accurately simulating the evolution of the strong storm in Missouri.

GOES_IFR_ZOOM_1515_13Oct2014

As above, but zoomed in over Iowa (Click to enlarge)

IFR Probability when an extratropical storm passes by

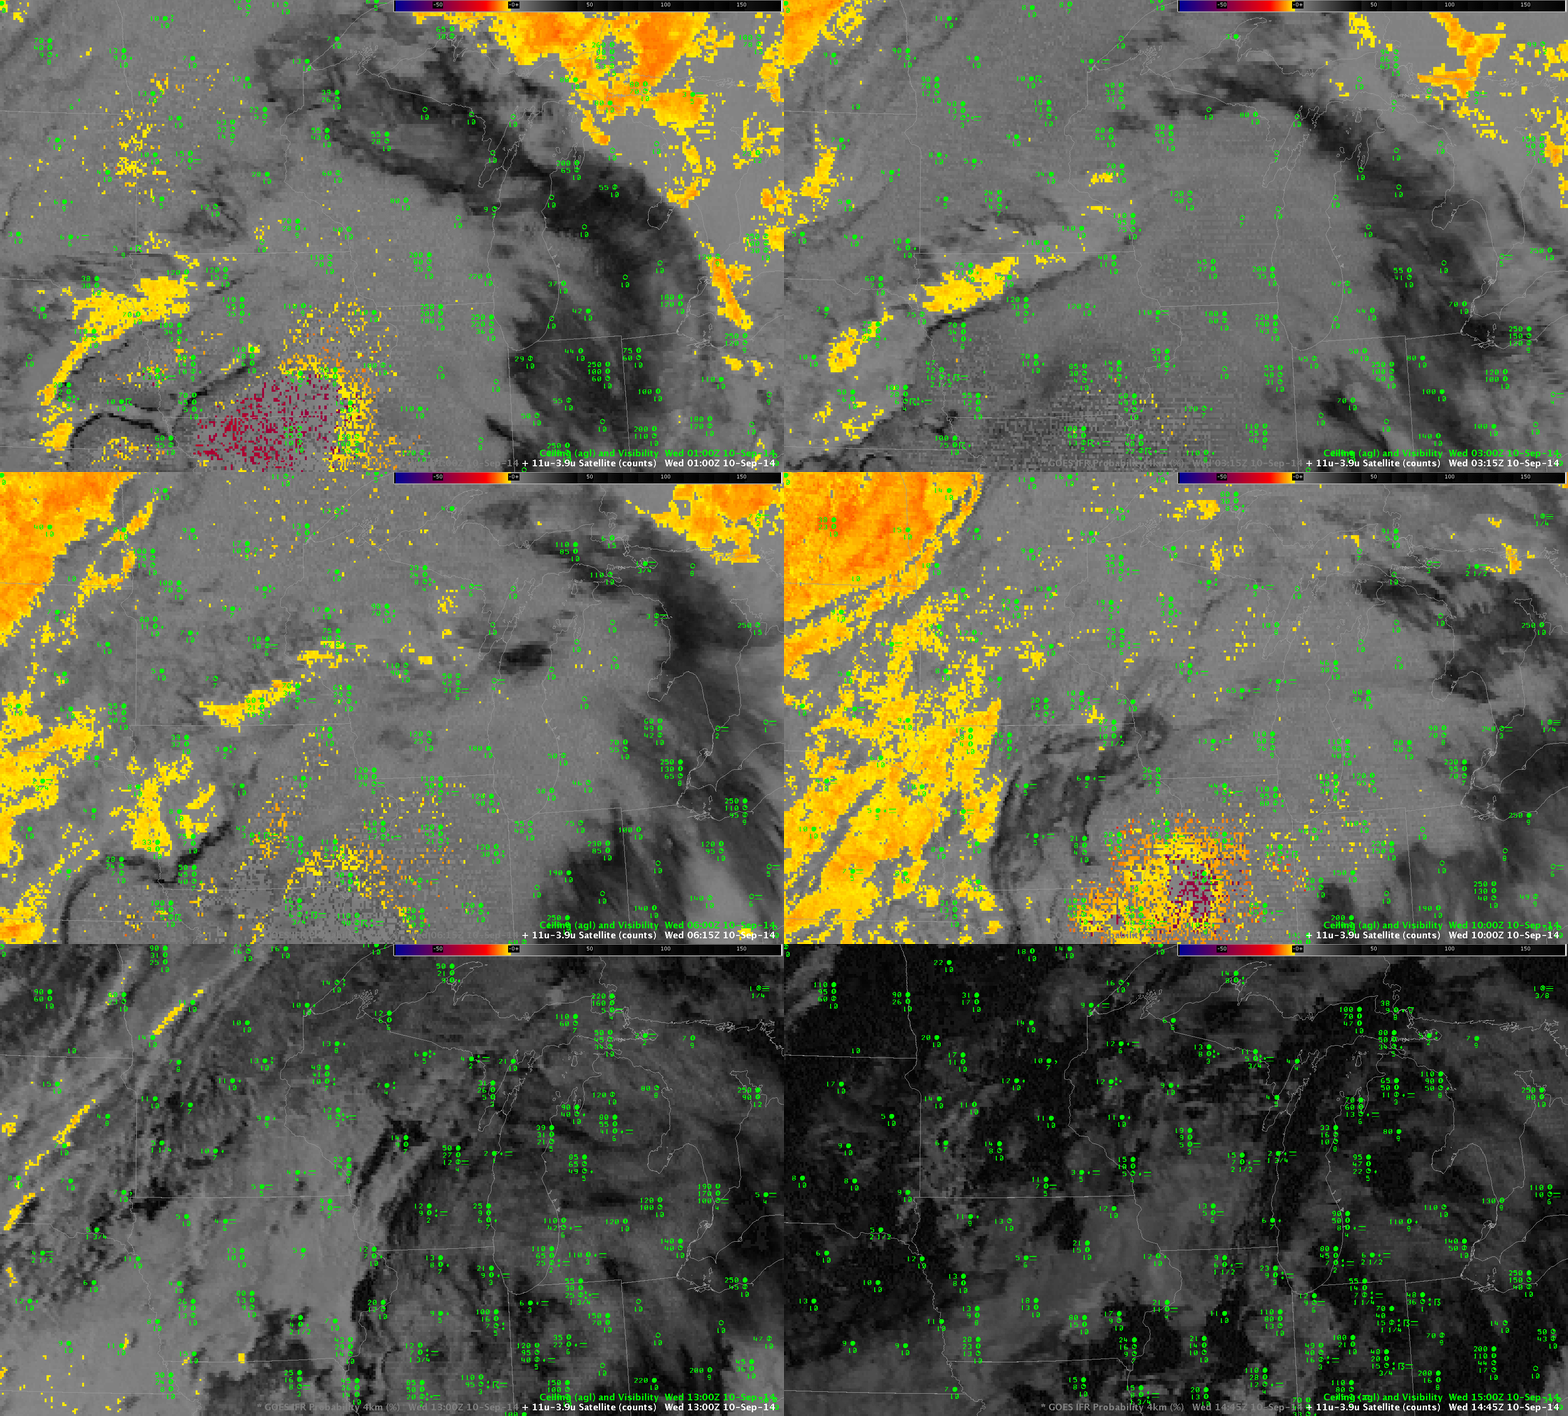
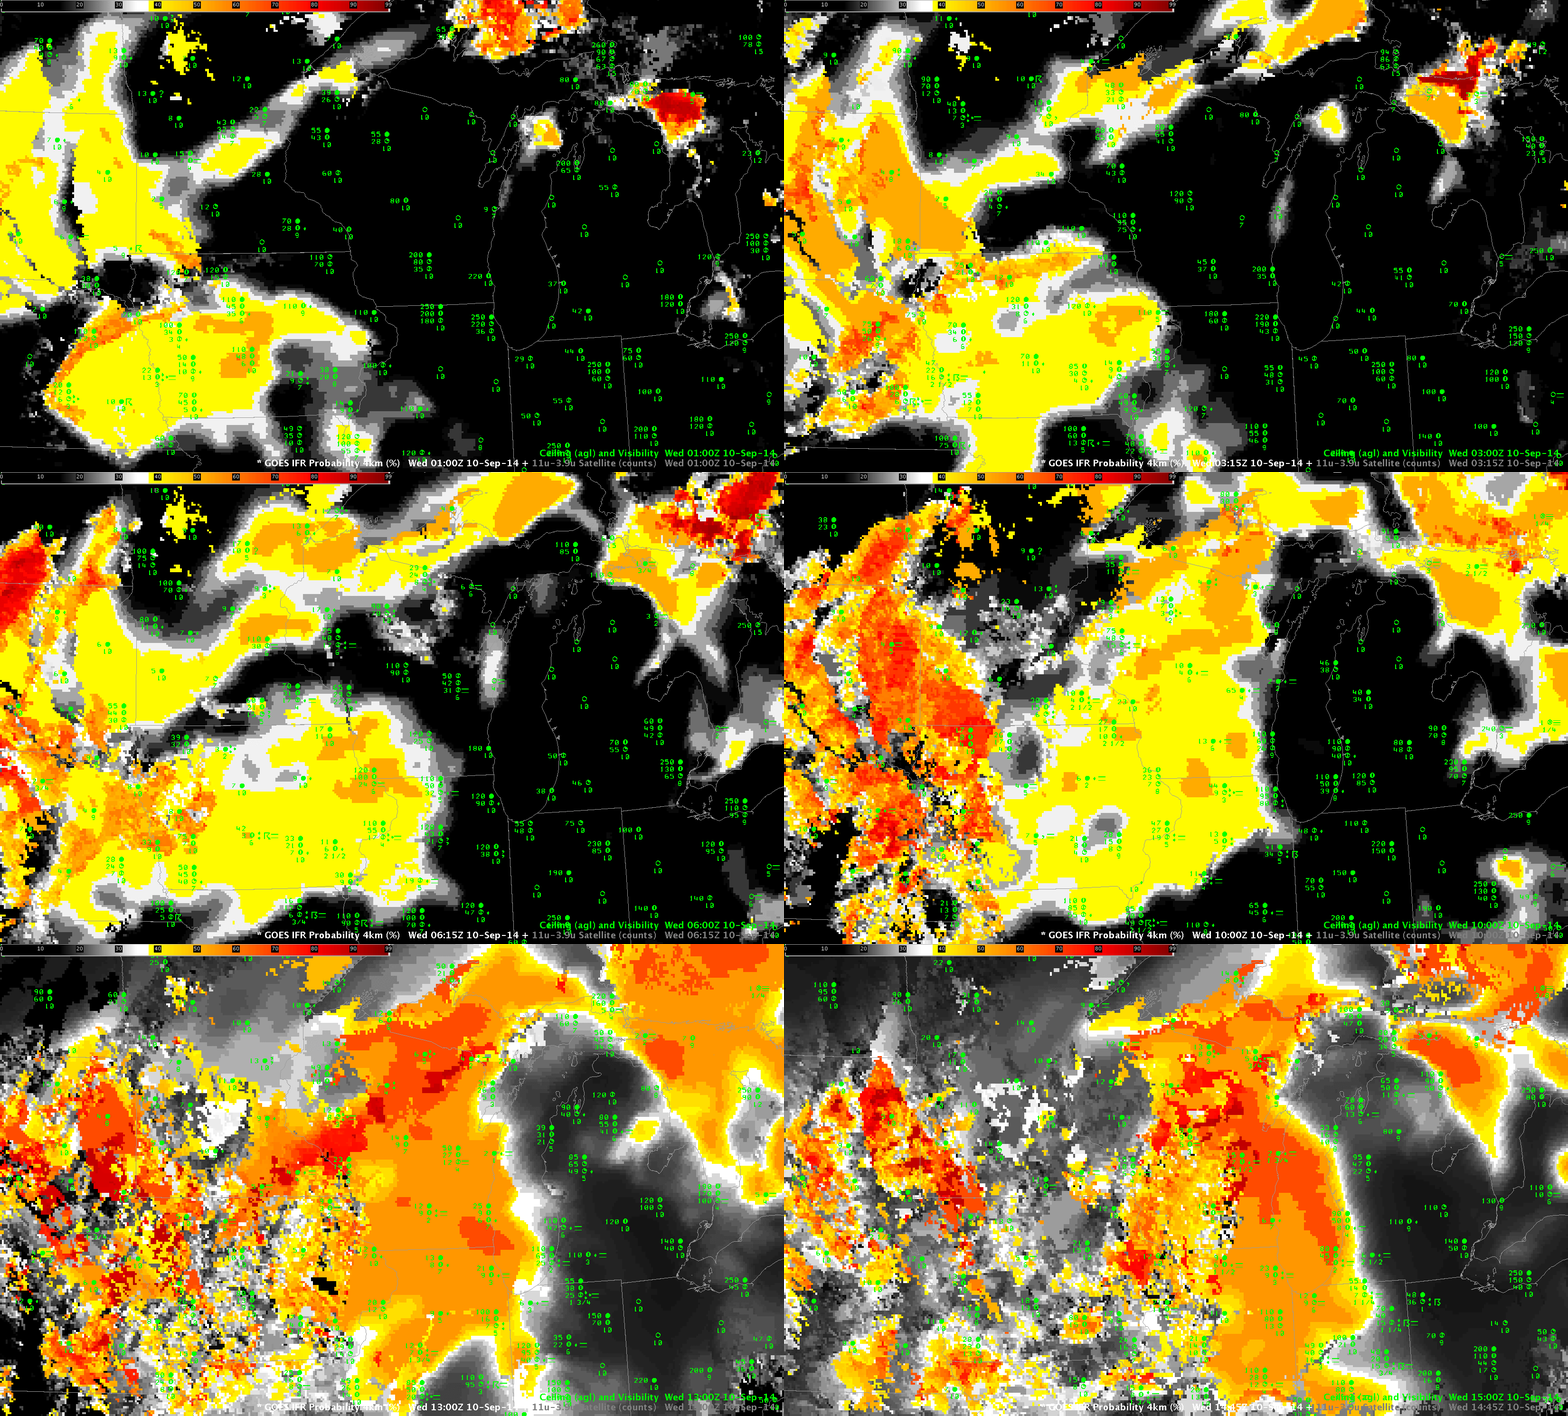
The approach of an extratropical cyclone, such as the Colorado Cyclone in this animation in the upper Midwest on 10 September 2014, will frequently result in areas of IFR or near-IFR conditions. However, the many cloud layers that accompany these baroclinic disturbances will always make difficult the task of identifying (using satellite imagery) regions of low stratus and fog. Consider the animation below of Brightness Temperature Difference (10.7µm – 3.9µm) fields (a traditional method of detecting water-based clouds) over the Upper Midwest on 10 September.

BTD_10Sep2014_02-14UTC

Color-enhanced Brightness Temperature Difference fields (10.7µm – 3.9µm), hourly from 0100 UTC to 1400 UTC on 10 September 2014 (Click to enlarge)
Interpretation of this loop is time-consuming. Not only is there little distinct signal related to observed IFR and near-IFR conditions, but the rising sun (at the end of the animation) causes the Brightness Temperature Difference to flip sign, altering the enhancement. There are regions where the Brightness Temperature Difference field detects water-based clouds that may be associated with fog or stratus, chiefly over the western third of the domain (and especially over the Dakotas) in the later half of the animation.

Compare the animation above to the loop of IFR Probabilities for the same time period below. IFR Probabilities are highest where near-IFR or IFR conditions are present, and the IFR Probability field screens out regions where low stratus (but not fog) is present, such as over the Dakotas at the end of the animation. Regions where IFR Probability fields have a flat character — such as over Wisconsin around sunrise — are where only Rapid Refresh model data (but not satellite data) are used as predictors, and the field does not have pixel-scale variability. Because fewer predictors are used, the magnitude of the IFR Probability is smaller than in regions where both satellite and model data can be used as Predictors. Thus, a flat field (over eastern Wisconsin at the end of the animation, or over Iowa at the beginning) has values that should be interpreted differently from similar values in regions where both satellite and model data can be used in the computation of IFR Probabilities.

IFRPROB_10Sep2014_01-14UTC

GOES-R IFR Probability fields (Computed from GOES-13 and Rapid Refresh Data), hourly from 0100 UTC to 1400 UTC on 10 September 2014 (Click to enlarge)

Interpreting IFR Probability Fields

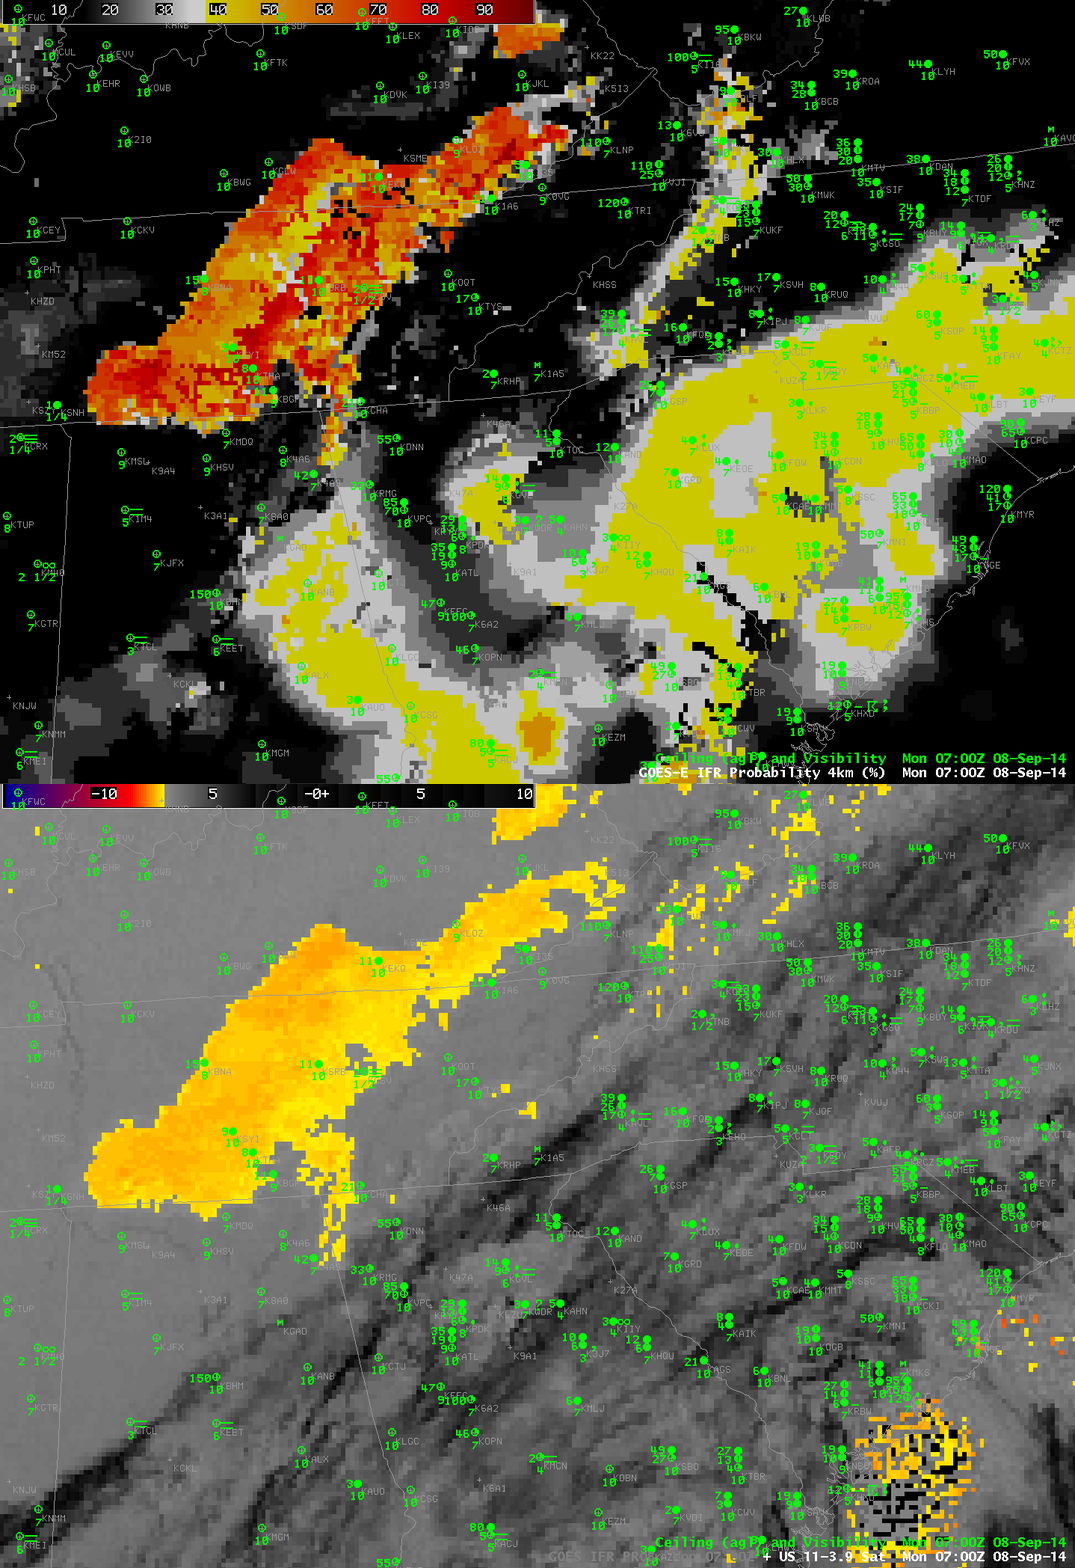
IFR_PROB_11-3.9_Sat_20140908_0700

Toggle between GOES-R IFR Probabilities and GOES-East Brightness Temperature Differences (10.7 µm – 3.9 µm) over the southeast US, 0700 UTC 8 September 2014 (Click to enlarge)

When multiple cloud layers are present, such as when a cirrus shield overlays a region, the traditional method of detecting fog/low stratus, the brightness temperature difference product, struggles to identify regions of low clouds because the satellite sees only the signature of the high clouds. Low clouds are hidden from view. In such cases, it is vital to incorporate low-level information to identify regions where fog/low stratus might be present. The required low-level information can come from the model fields of the Rapid Refresh Model. The model predictors can be used to generate IFR Probabilities in regions where satellite predictors are unavailable because of the presence of high clouds.

In the toggle above, the Brightness Temperature Difference field shows high clouds over Georgia and the Carolinas. IFR Probabilities in this region are around 50% — relatively low because Cloud Predictors cannot be used in the algorithm. But IFR Conditions are present over North and South Carolina. Tailor your interpretation of the IFR Probability values to account for which predictors are used.

Over Tennessee, IFR Probabilities are much higher. In this region, satellite predictors can be used, and a strong satellite signal is present. IFR Conditions are not widespread, however. Use the IFR Probability field as one tool (but not the only tool) when making nowcasts about the possibilities of fog/low stratus.