Category Archives: Midwest

GOES-16 IFR Probability with Dense Fog in the Upper Midwest

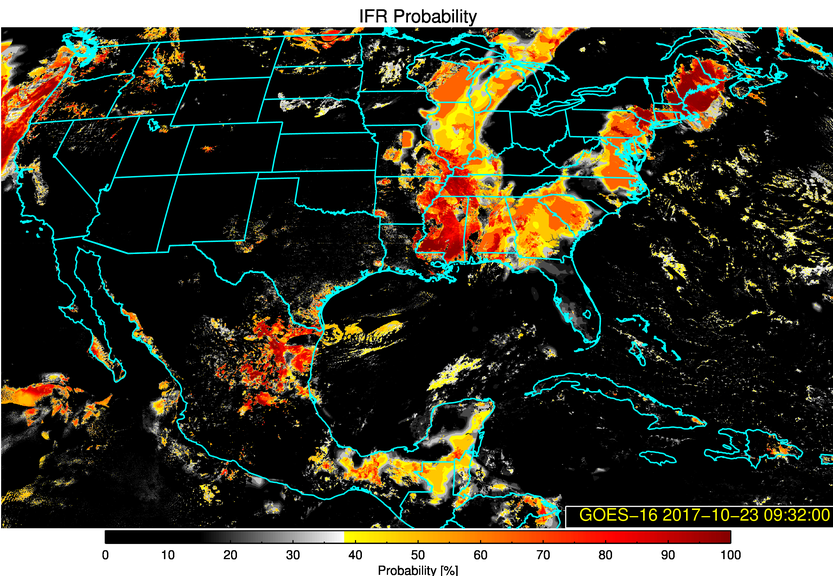
GOES-16 IFR Probability fields, 0932-1157 UTC on 23 October 2017 (Click to animate)

GOES-16 data posted on this page are preliminary, non-operational and are undergoing testing.

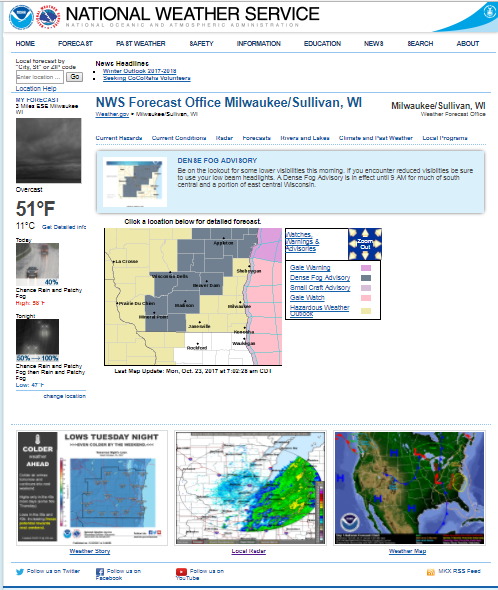
Dense Fog developed over the upper Midwest on Monday morning, 23 October 2017, and Advisories were issued as shown below.  GOES-R IFR Probabilities are now being created using GOES-16 data, those data are now available at this link.  The uniformity of the IFR Probability fields shown above over WI suggest that high-level clouds are present, and the GOES-16 satellite could not therefore view the fog/stratus near the ground: only Rapid Refresh data were used to create GOES-R IFR Probability values.

GOES-R IFR Probability fields available to NWS Field Offices via LDM are still being computed with GOES-13 and GOES-15 data.  When GOES-16 becomes operational as GOES-East at 75.2º W Longitude, planned for December, IFR Probabilities available through the LDM will be created with GOES-16 and GOES-15 data. The switchover will happen when GOES-16 becomes operational.

Screenshot of NWS webpage from Sullivan, WI at 1200 UTC on 23 October 2017. Dense Fog advisories are in place from SW Wisconsin to NE Wisconsin. Note also the Radar imagery showing departing showers. (Click to enlarge)

Fog over southwest Lower Michigan

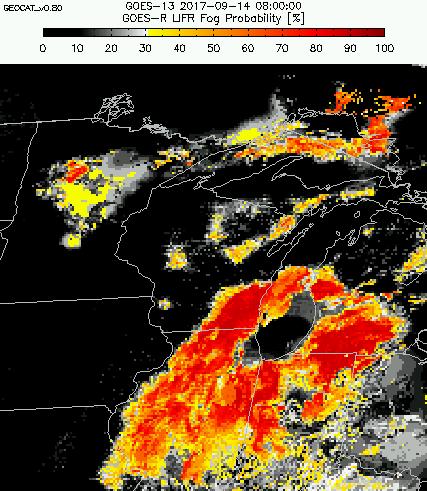
GOES-R IFR Probability Fields, 0330-1430 UTC on 14 September 2017 (Click to animate)

GOES-R IFR Probabilities are computed using Legacy GOES (GOES-13 and GOES-15) and Rapid Refresh model information; GOES-16 data will be incorporated into the IFR Probability algorithm in late 2017

GOES-R IFR Probability fields (From this site, but also available via LDM feed in AWIPS), above, show the development of dense for over Lower Michigan, leading to the issuance of advisories. IFR Probabilities on this morning remained fairly low over the relatively warm late Summer waters of Lake Michigan. There is also a noteworthy gap in Fog of unknown origin from Grand Rapids Michigan southwestward to Lake Michigan as fog forms on either side of that line. This is especially evident around 0845 UTC; the gap subsequently fills in as fog becomes more widespread.

GOES-16 data posted on this page are preliminary, non-operational and are undergoing testing

GOES-16 also viewed the fog field, from the top of the cloud deck, as shown below in an animation (courtesy of Nathan Jeruzal the National Weather Service Grand Rapids Office) of the Brightess Temperature Difference field (10.3  µm – 3.9  µm) for two hours before sunrise on 14 September 2017. A still image at 1117 UTC suggests that fog over Grand Rapids’ city limits was not widespread, perhaps due to slight warming in the city due to an Urban Heat Island that would reduce the relative humidity.

At the end of the animation, there is a consistent change in signal over eastern Michigan, from cyan indicating low clouds/stratus to grey, indicating no cloud, because of increasing amounts of reflected solar radiation at 3.9 as the Sun rises. The GOES-R IFR Probability field animation at top suggests that the fog persists through sunrise.

GOES-16 Brightness Temperature Difference fields (10.3 µm – 3.9 µm), 0947-1142 UTC on 14 September 2017;  City outlines are denoted in Yellow (Click to enlarge)

Dense Fog over the central Mississippi River Valley

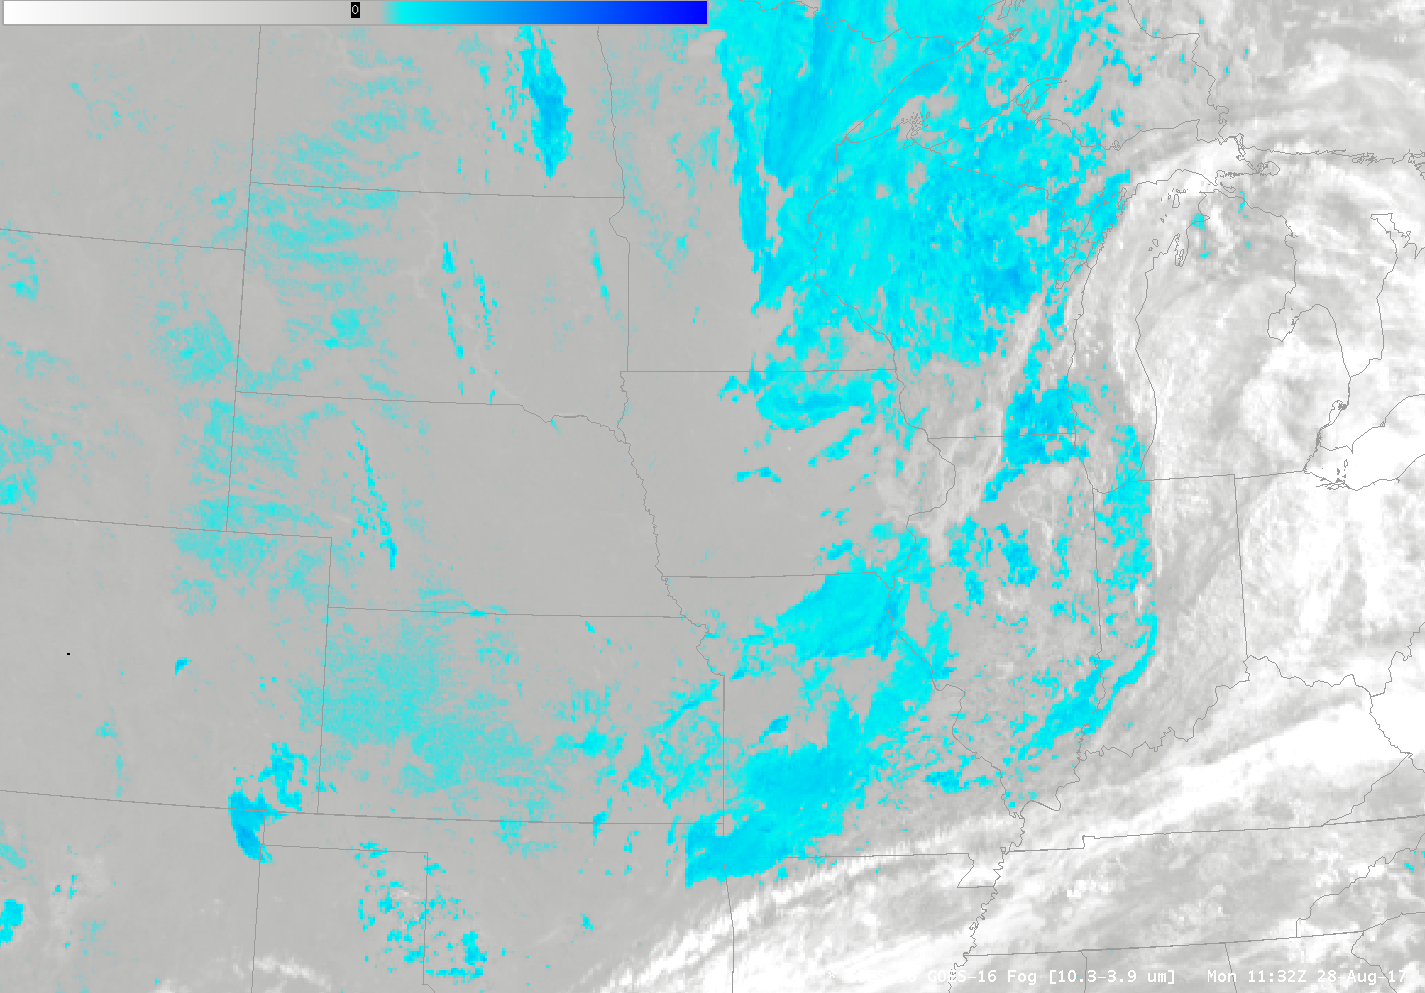
GOES-16 Brightness Temperature Difference field (10.3 µm – 3.9 µm) from 0417 to 1357 UTC on 28 August 2017 (Click to animate)

GOES-16 data posted on this page are preliminary, non-operational and are undergoing testing.

GOES-16 Brightness Temperature Difference fields (10.3 µm – 3.9 µm), above, show the development of stratus clouds (made up of water droplets) over the Plains during the morning of 28 August 2017.  The Brightness Temperature for 10.3 µm is warmer than that for 3.9 µm during the night because cloud water droplets do not emit 3.9 µm radiation as a blackbody but those same cloud water droplets do emit 10.3 µm radiation more nearly as a blackbody would.   The conversion from sensed radiation to brightness temperature does assume blackbody emissions;  thus, the 3.9 µm brightness temperature is cooler where clouds made up of small water droplets exist.  The animation above shows stratus clouds developing over Missouri and adjacent states.  Dense Fog Advisories were issued near sunrise for much of the region (see image at bottom of this blog post) and IFR Conditions were widespread.

The animation above shows a positive signal over the western High Plains from Kansas northward to North Dakota. (Click here for the view at 1132 UTC on 28 August).

GOES-R IFR Probabilities are computed using Legacy GOES (GOES-13 and GOES-15) and Rapid Refresh model information; GOES-16 data will be incorporated into the IFR Probability algorithm in late 2017

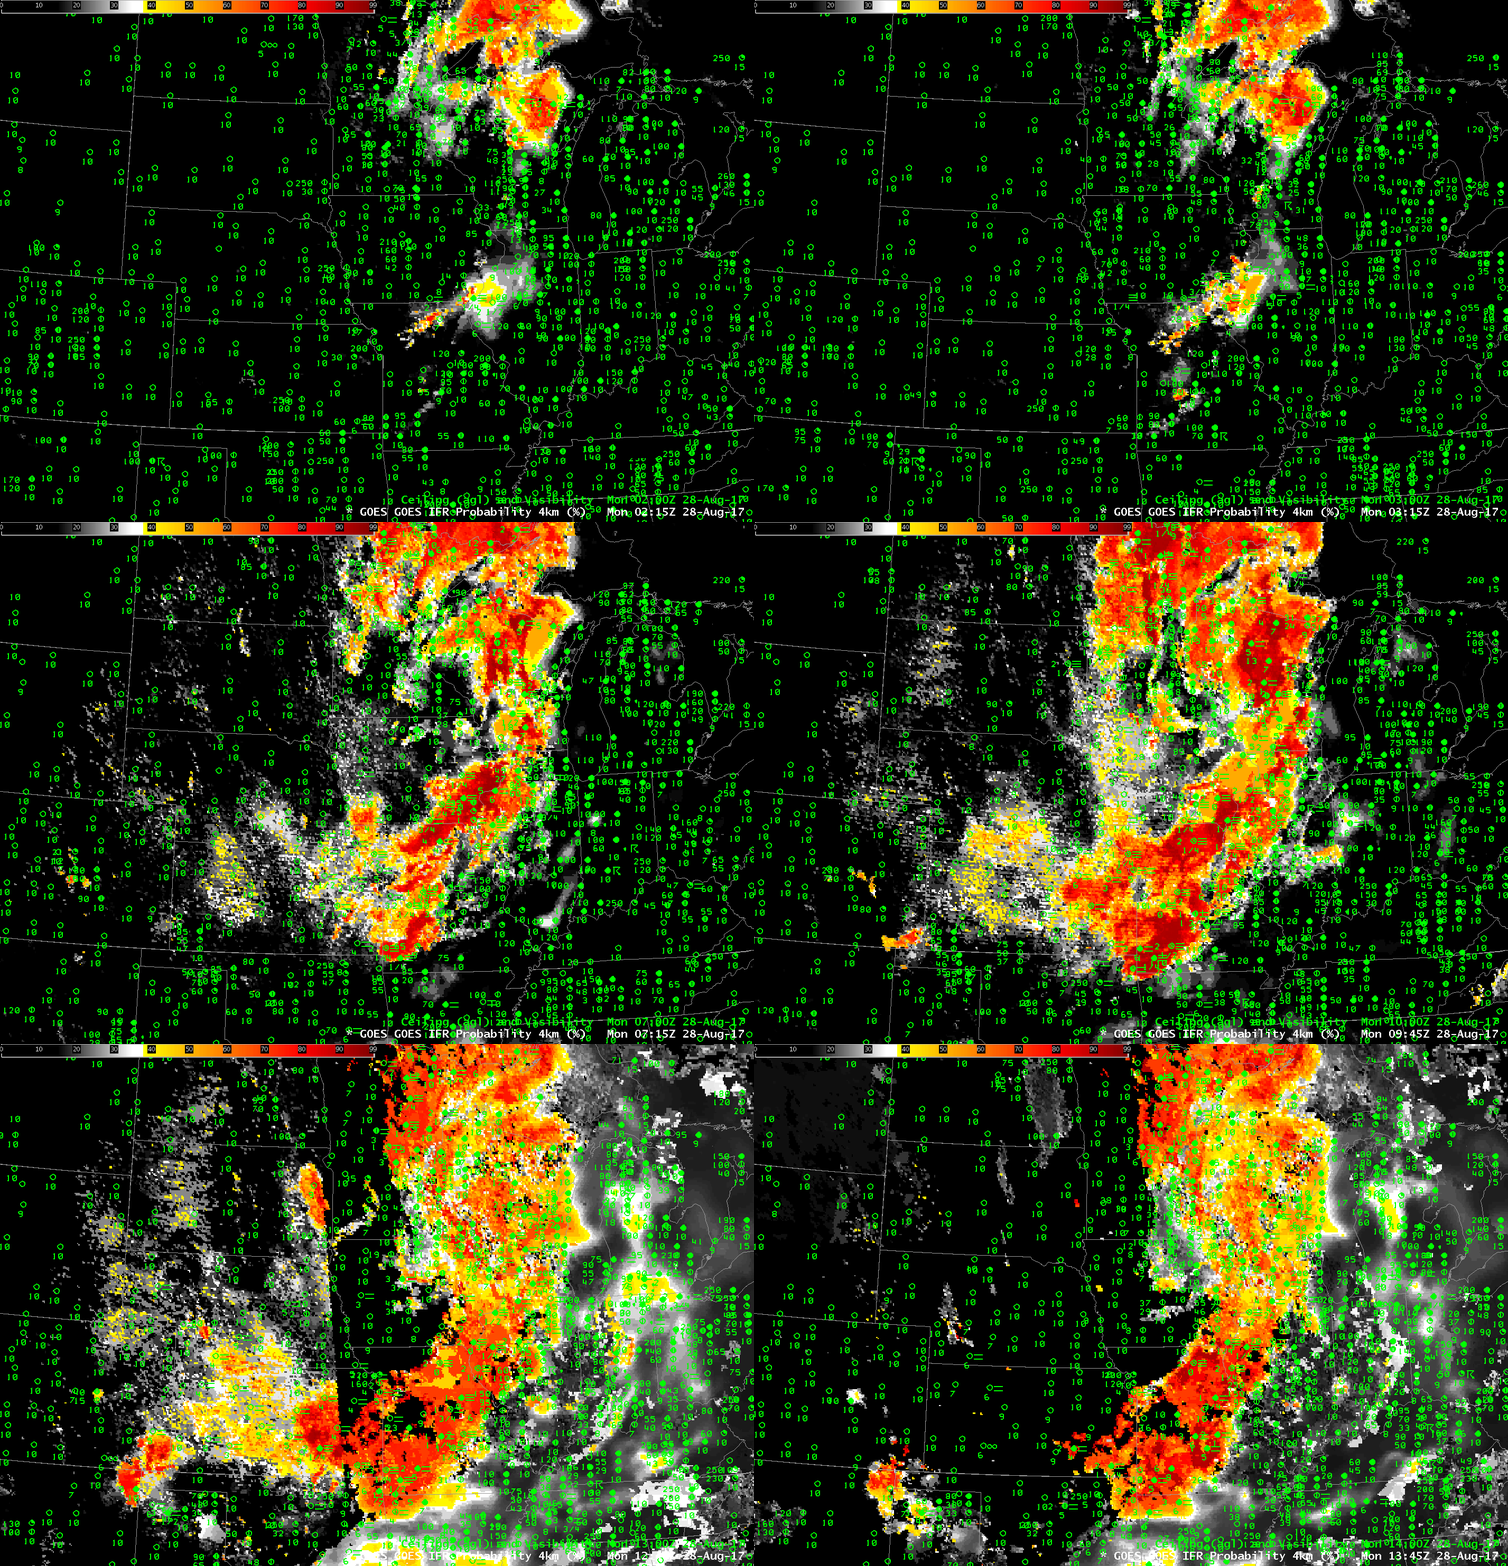
How did GOES-R IFR Probability fields capture this event? The animation showing the fields every 30 minutes from 0215 through 1345 UTC on 28 August 2017, below, shows the development of High Probabilities in the region where Dense Fog was observed. There is a signal along the western High Plains, but it has low Probability; a conclusion might be that thin stratus has developed but that the Rapid Refresh model does not suggest that widespread low-level saturation is occurring. As the sun rises, the signal over the western High Plains disappears. Click here for a toggle between the GOES-R IFR Probability and the GOES-16 Brightness Temperature Difference field at 1115 UTC.

GOES-R IFR Probability fields, 0215-1345 UTC, 28 August 2017 (Click to enlarge)

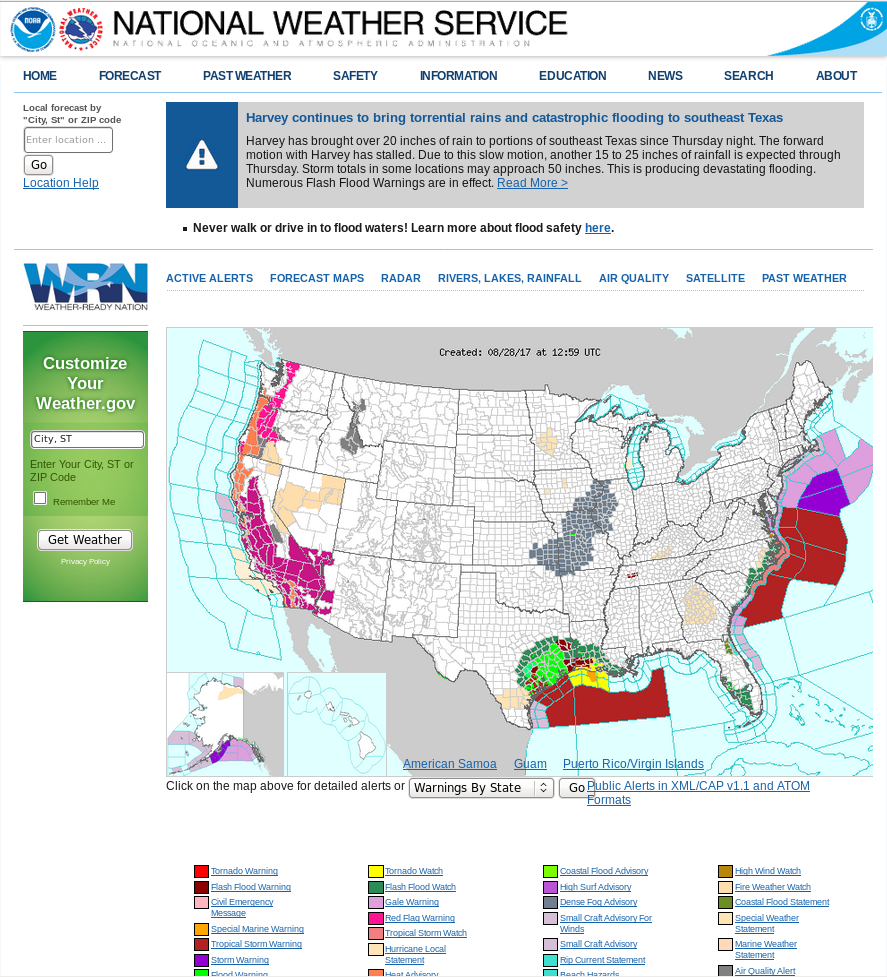
Screen Capture of http://www.weather.gov at 1300 UTC on 28 August 2017 (Click to enlarge)

Dense Fog over Missouri

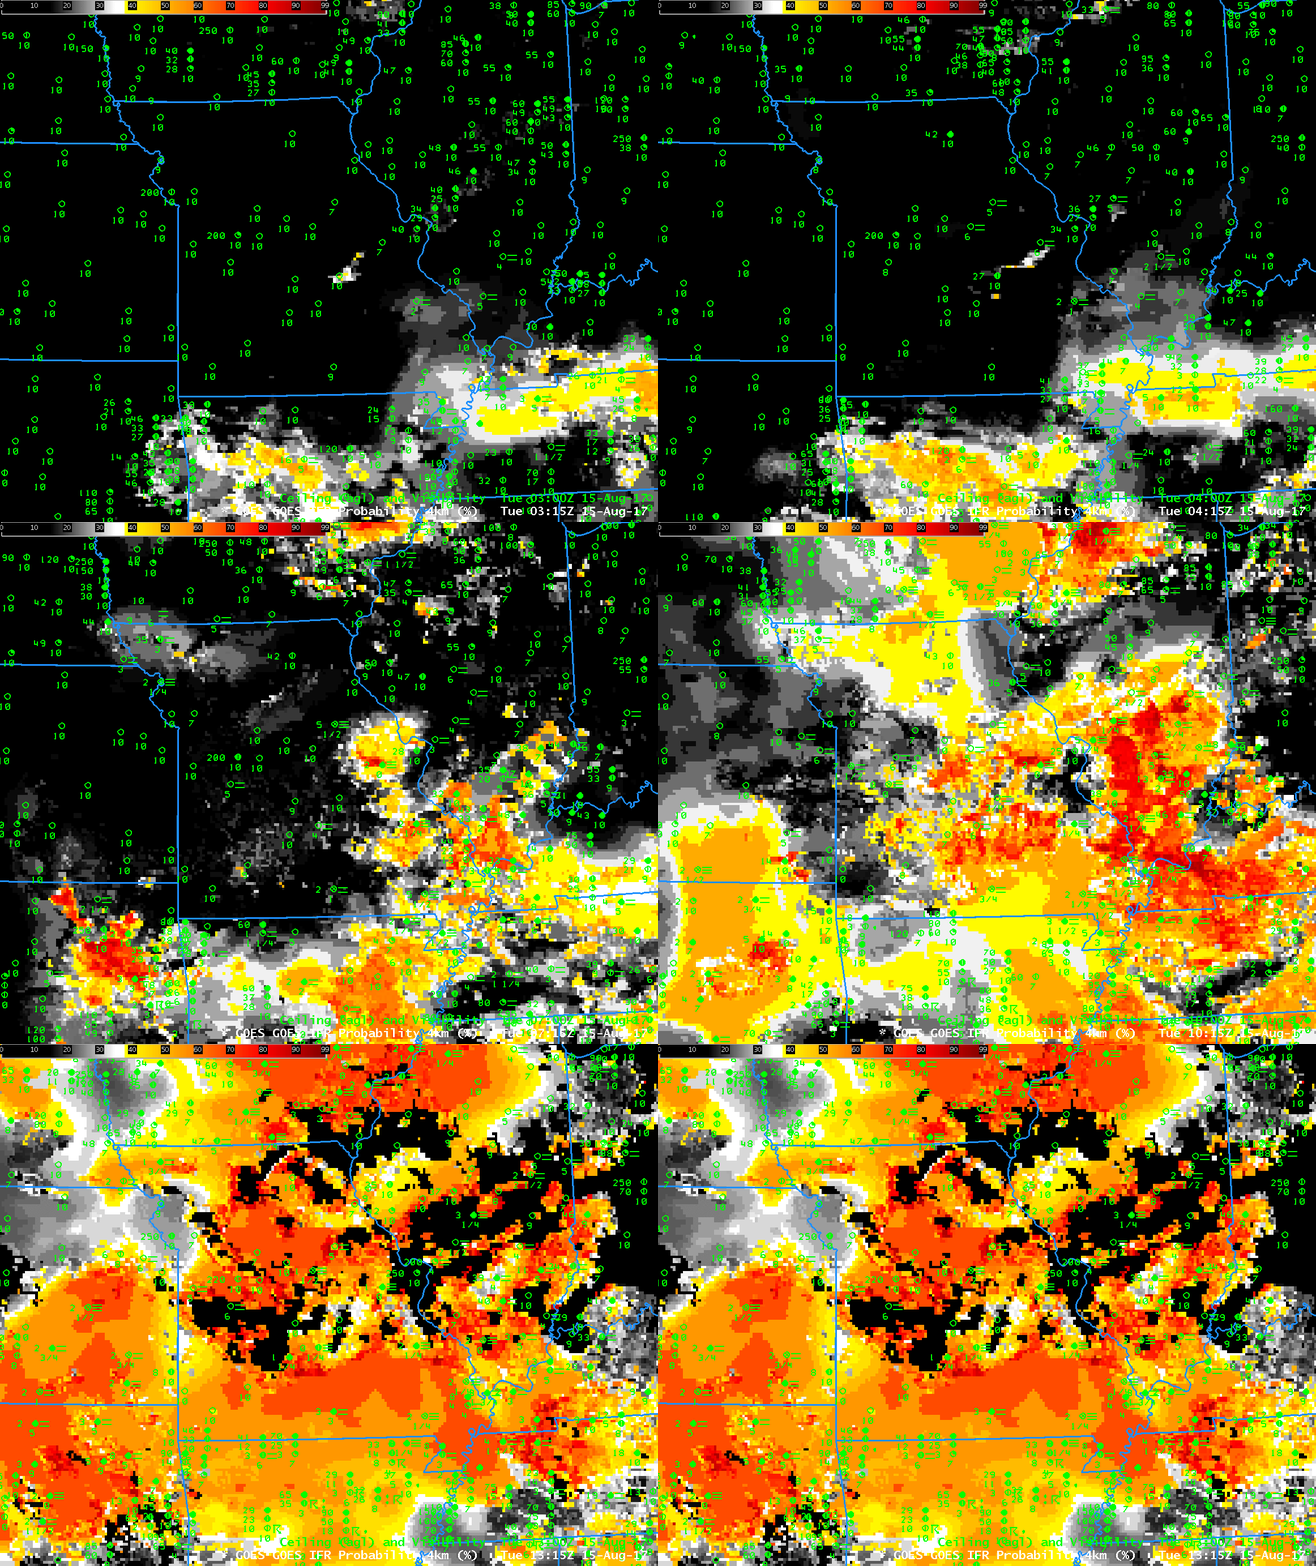
GOES-R IFR Probability Fields, and surface reports of Ceilings and Visibilities, hourly from 0315 to 1315 UTC on 15 August 2017 (Click to enlarge)

GOES-R IFR Probabilities are computed using Legacy GOES (GOES-13 and GOES-15) and Rapid Refresh model information; GOES-16 data will be incorporated into the IFR Probability algorithm in late 2017

IFR Conditions and Dense Fog developed over southeastern Missouri during the early morning on 15 August 2017, leading to the issuance of Dense Fog Advisories. GOES-R IFR Probabilities, above, showed increasing values as the ceilings lowered and visibilities dropped.  The IFR Probability fields over southern Missouri and northern Arkansas (and Kansas and Oklahoma) have the characteristic uniformity that arises when Rapid Refresh data alone are used to drive the IFR Probability values.  In these regions, high clouds (associated with convection over Arkansas) are blocking the satellite view of lower clouds.

Such high clouds will make it difficult for a satellite-only product to identify the regions of clouds.  For example, the Brightness Temperature Difference field below (10.3 µm – 3.9 µm) from GOES-16, color-enhanced so that low clouds are green and that cirrus (at night) are purple) shows widespread low cloudiness at the start of the animation, including some obvious river fog over Missouri (river valleys that are not well-resolved with GOES-13), but developing convection over Arkansas eventually prevents the view of low clouds.

GOES-16 data posted on this page are preliminary, non-operational and are undergoing testing

GOES-16 Brightness Temperature Difference field (10.3 µm – 3.9 µm), hourly from 0312 to 1312 UTC on 15 August 2017 (Click to enlarge)

Because the Brightness Temperature Difference field (helpfully called the ‘Fog’ Channel Difference in AWIPS) is challenged by high clouds in viewing the low clouds, RGB Products that use the brightness temperature difference field are also similarly impeded by high clouds.  Consider, for example, the stations in southern Missouri shrouded by the cirrus shield.  IFR Conditions are occurring there and a strong signal of that appears in the IFR Probability fields.

GOES-R IFR Probability computed with GOES-13 and Rapid Refresh Data, GOES-16 Fog (10.3 µm – 3.9 µm) Brightness Temperature Difference and GOES-16 Advanced Nighttime Microphysics RGB, all near 1115 UTC on 15 August 2017 (Click to enlarge)

IFR Conditions under multiple cloud decks in the Upper Midwest

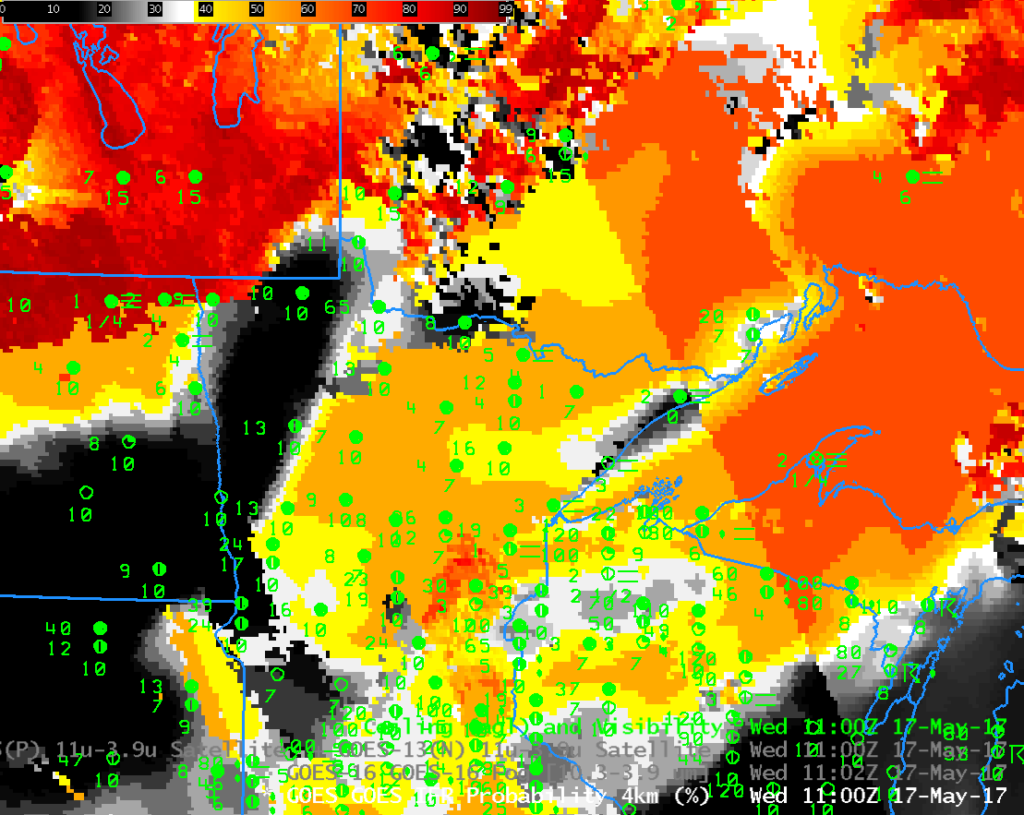
GOES-R IFR Probability Field, along with observations of surface visibility and ceiling heights, 1100 UTC on 17 May 2017 (Click to enlarge)

Note: GOES-R IFR Probabilities are computed using Legacy GOES (GOES-13 and GOES-15) and Rapid Refresh model information; GOES-16 data will be incorporated into the IFR Probability algorithm in late 2017

The GOES-16 data posted on this page are preliminary, non-operational data and are undergoing testing

A morning screenshot from the Aviation Weather Center website shows a wide region of IFR and Low IFR Conditions reported over the Upper Midwest, from eastern North Dakota eastward to Lake Superior. The GOES-R IFR Probability field, above, from 1100 UTC on 17 May 2017, shows high probabilities over that region.

Over much of Minnesota and Michigan, the character of the IFR Probability field is flat.  This is typical of IFR Probability when high clouds prevent satellite data from being used as a statistical predictor for IFR Conditions.  If high clouds are present, the satellite cannot detect the presence of low clouds, and the chief predictor of IFR conditions will therefore be model data that typically does not vary strongly from gridpoint to gridpoint when IFR conditions are present.  The pronounced boundary apparent in the IFR Probability field that extends nortwestward from Green Bay in Wisconsin is the boundary between night-time predictors (to the west) and daytime predictors (to the east).

GOES-R IFR Probability values are largest in the region of IFR conditions over North Dakota.  In this region, high clouds are not present and the satellite is able to detect low clouds, and that information is part of the computation of IFR Probabilities.  Note also the region in east-central Minnesota where satellite data are also being used in the computation of IFR Probabilities;  the resultant field there is pixelated.

The toggle below shows the brightness temperature difference field between the shortwave and longwave infrared window channels from GOES-13 (3.9 µm and 10.7 µm) and GOES-16 (3.9 µm and 10.33 µm).  This brightness temperature difference field is used to detect stratus, and by inference fog, because stratus cloud tops composed of water droplets emit radiation around 10.3-10.7 µm as a blackbody, but do not emit 3.9 µm radiation as a blackbody.  Satellite detection of radiation, and computation of the inferred temperature of the emitting surface, assumes blackbody emissions.  Consequently, the brightness temperature computed using detected 3.9 µm radiation is colder than that computed using 10.7 µm (or 10.33 µm) radiation.

Both satellites capture the region of low stratus/fog over North Dakota, and the superior spatial resolution of GOES-16 is apparent. Note, however, that neither satellite can detect low clouds associated with dense fog in regions of higher clouds — over Michigan’s Keewenaw Peninsula, for example, or along the shore of Lake Superior in Minnesota. This is an unavoidable shortcoming of satellite-only-based detection of low clouds/fog.

GOES-13 (3.9 µm – 10.7 µm) and GOES-16 (10.33 µm – 3.9 µm) Brightness Temperature Difference fields, 1100 UTC on 17 May 2017 (Click to enlarge)

Dense Fog from the Ohio Valley to North Carolina

Note: GOES-R IFR Probabilities are computed using Legacy GOES (GOES-13 and GOES-15) and Rapid Refresh model information; GOES-16 data will be incorporated into the IFR Probability algorithm in late 2017.

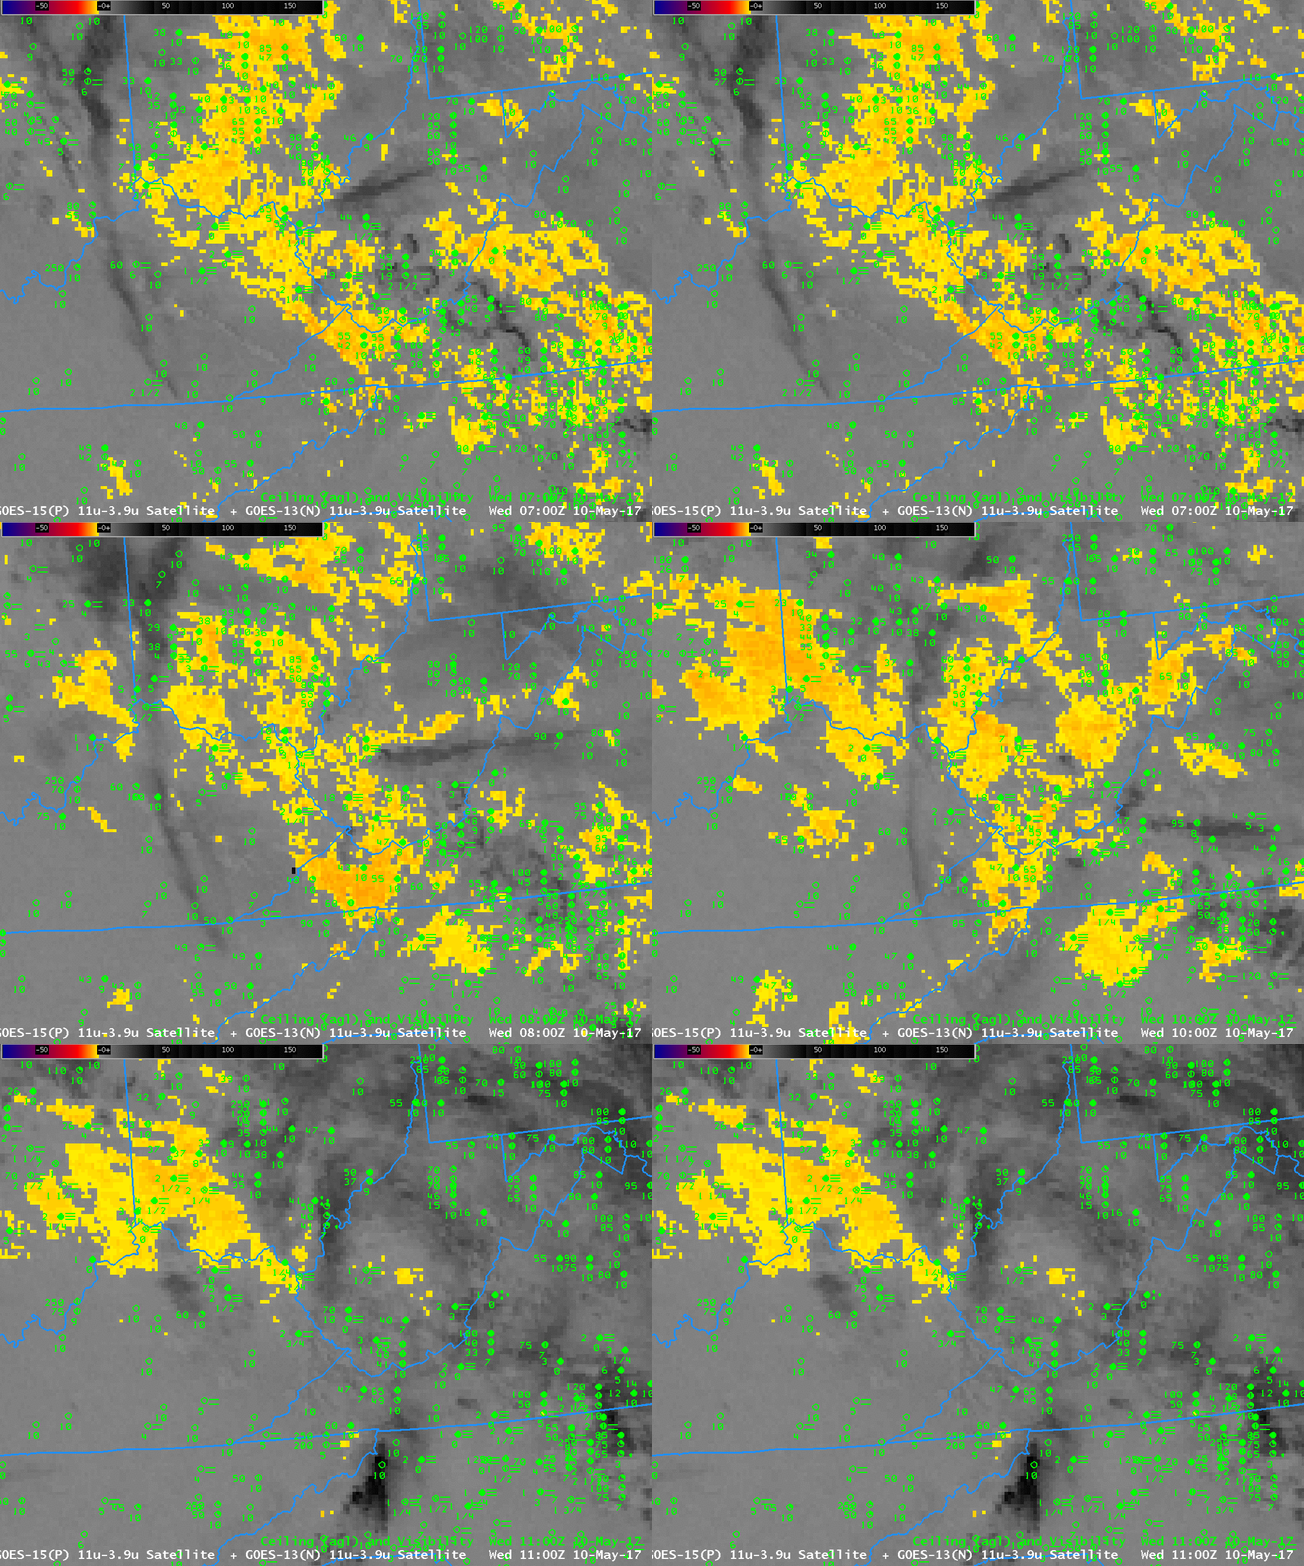
The weather.gov website on Wednesday morning 10 May 2017 showed two dense fog advisories, one near Cincinnati, OH and one near Greensboro, NC. The aviation weather website showed an IFR Sigmet in between the two regions of dense fog. The fog formed along a stationary front that sat over the region.

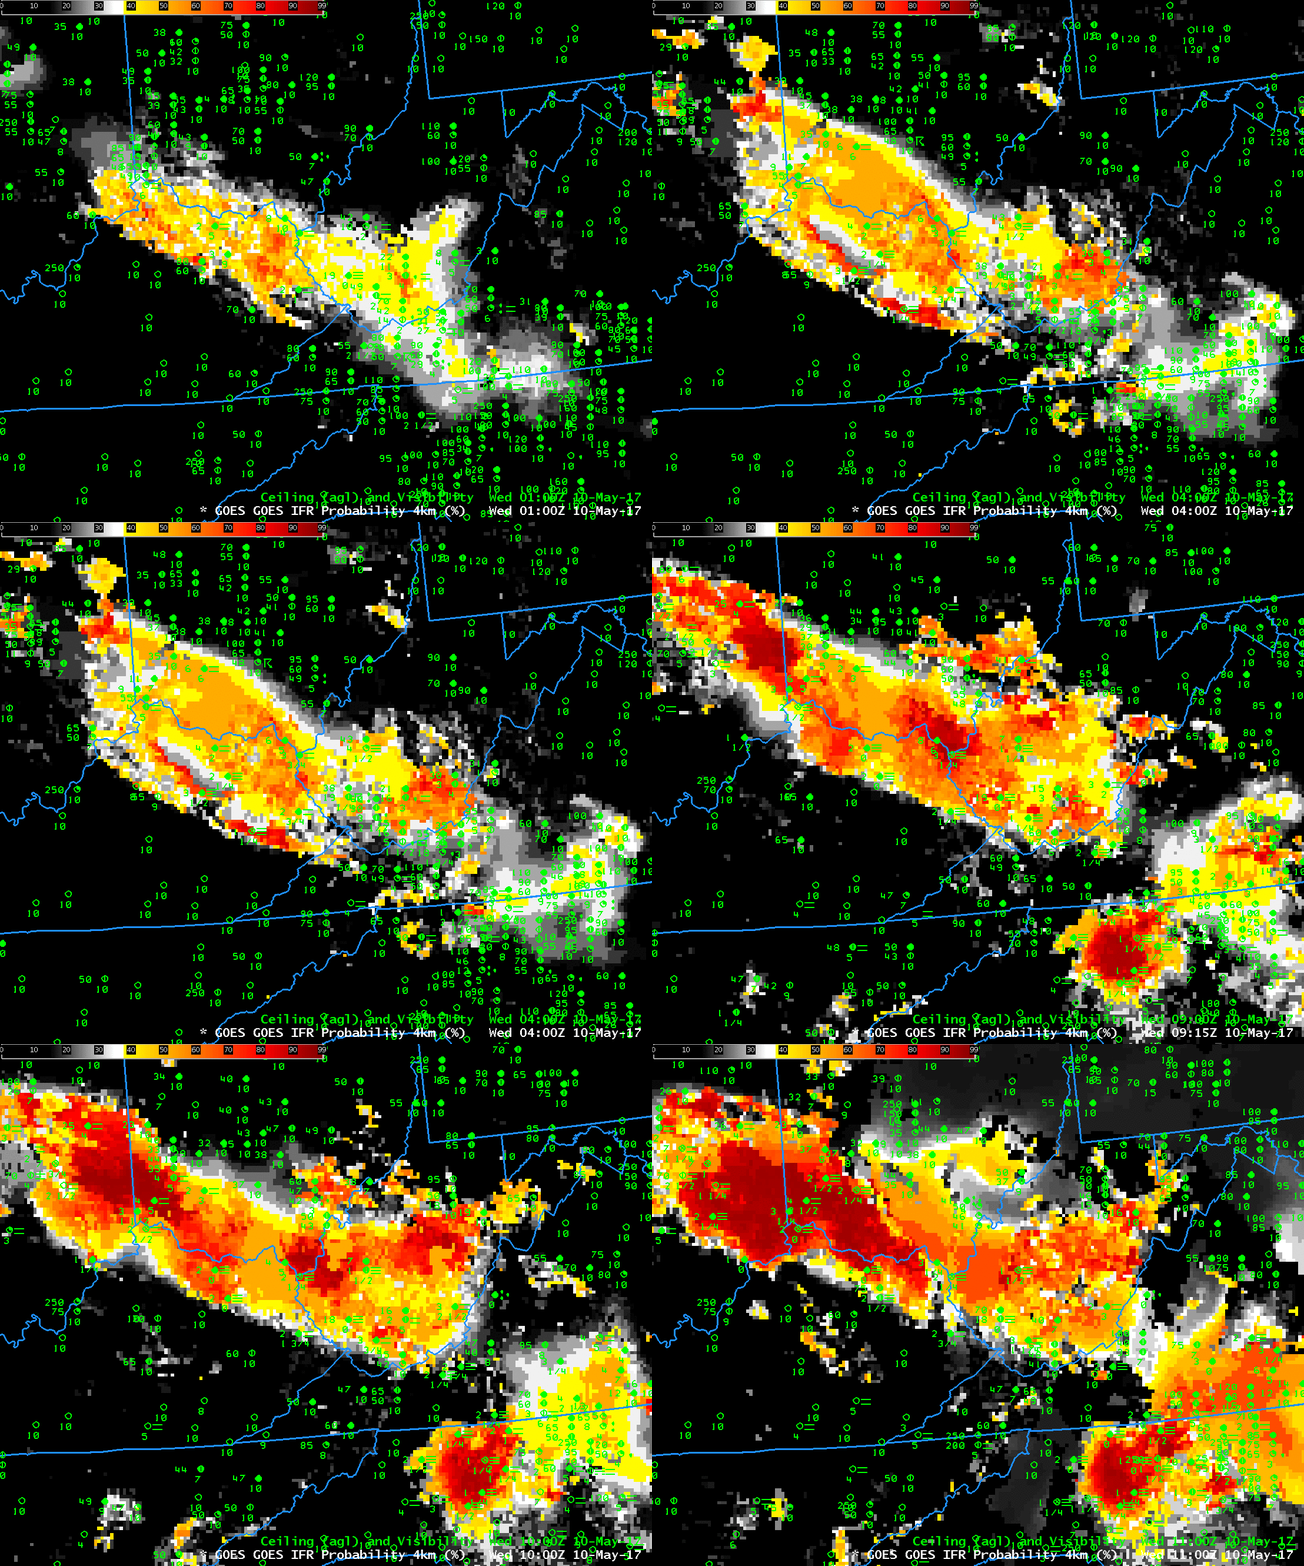
How well did GOES-R IFR Probabilities and GOES-13 Brightness Temperature Difference fields capture this event? The animation of GOES-R IFR Probability, below, computed using data from GOES-13 and the Rapid Refresh Model, shows enhanced probabilities early in the evening that increased with time. The orientation of the field — from west-northwest to east-southeast — aligns well with the regions of developing fog.

GOES-R IFR Probability fields, 0100, 0400 and 0700 – 1100 UTC on 10 May 2017 (Click to enlarge)

The brightness temperature difference field, below, did not perform as well in outlining the region of low ceilings/reduced visibilities because of the presence of high clouds that interfered with the ability to detect low clouds. Consequently, the highest brightness temperature differences (3.9 µm – 10.7 µm) do not align so well with the regions of developing fog. Note also that at the end of the animation — 1100 UTC — increasing amounts of reflected solar 3.9 µm radiation is changing the character of the field from negative to positive. In contrast, the IFR Probability fields (above) maintain a consistent signal through sunrise.

GOES-13 Brightness Temperature Difference fields (3.9 µm – 10.7 µm), 0700-1100 UTC on 10 May 2017 (Click to enlarge)

Dense fog in Ohio, Indiana and Illinois

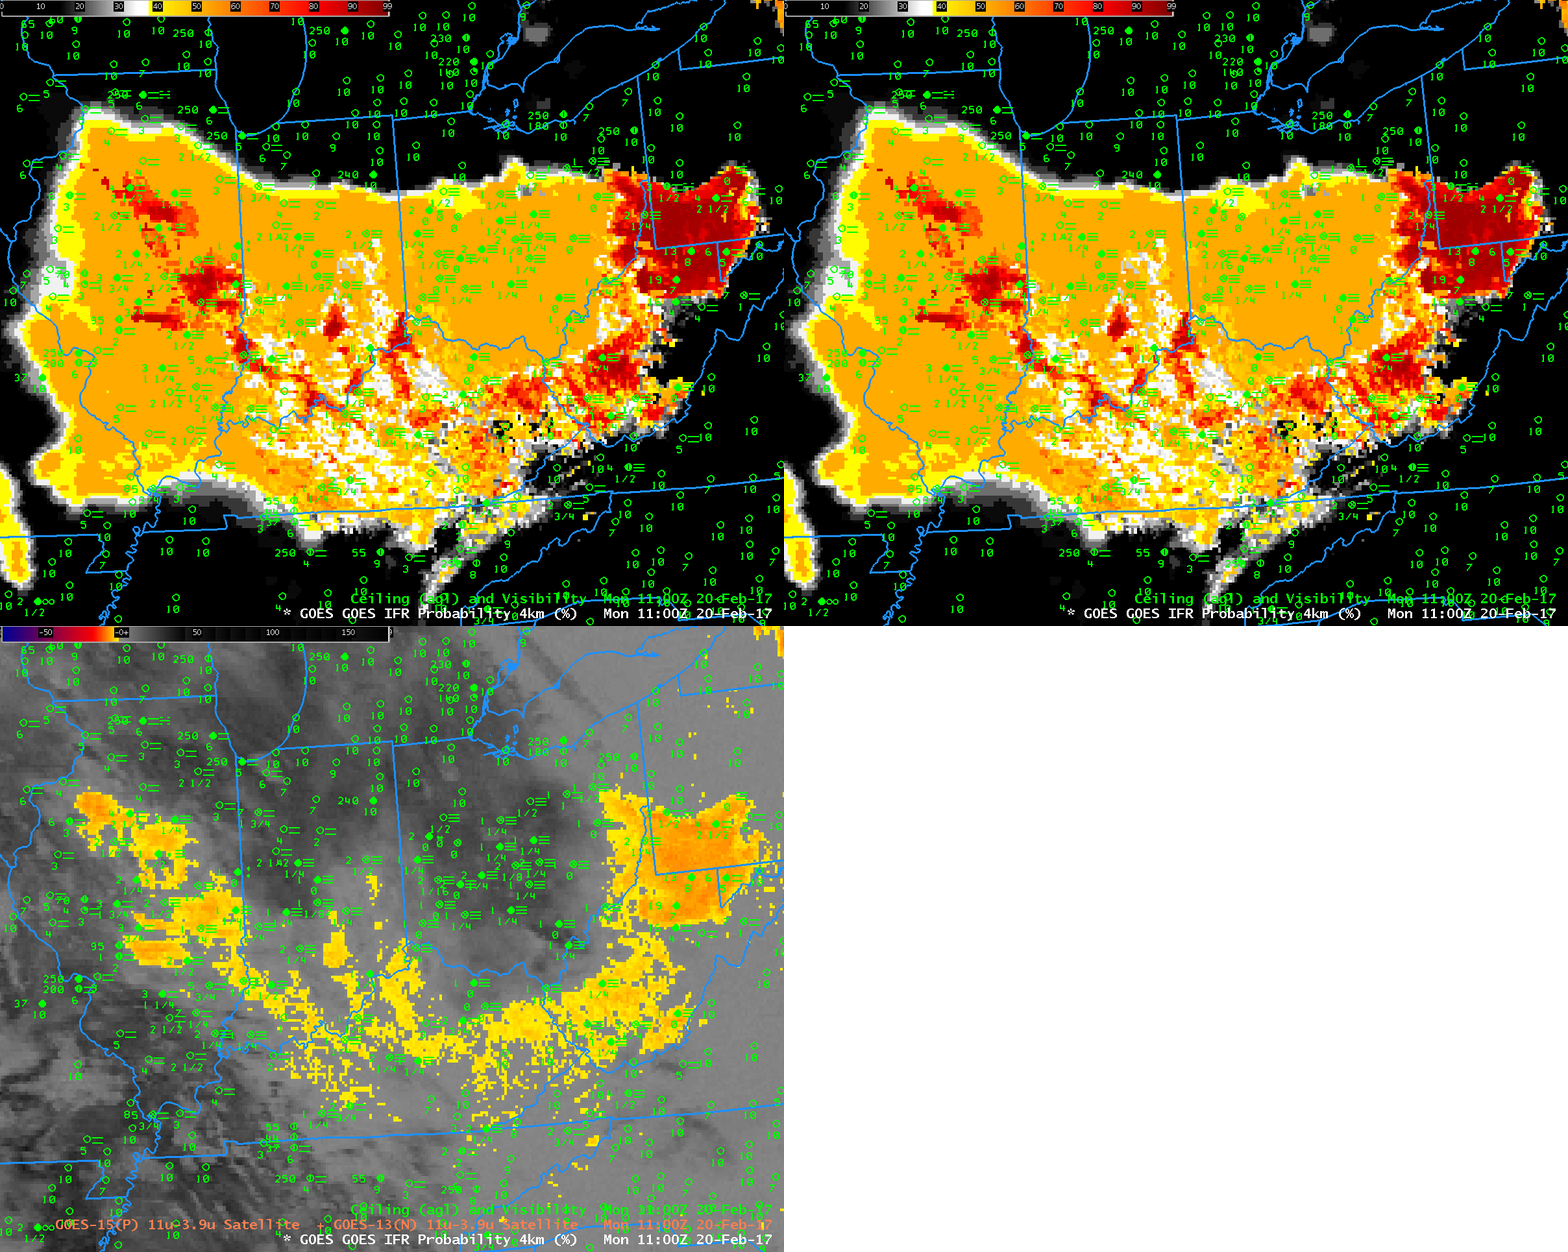
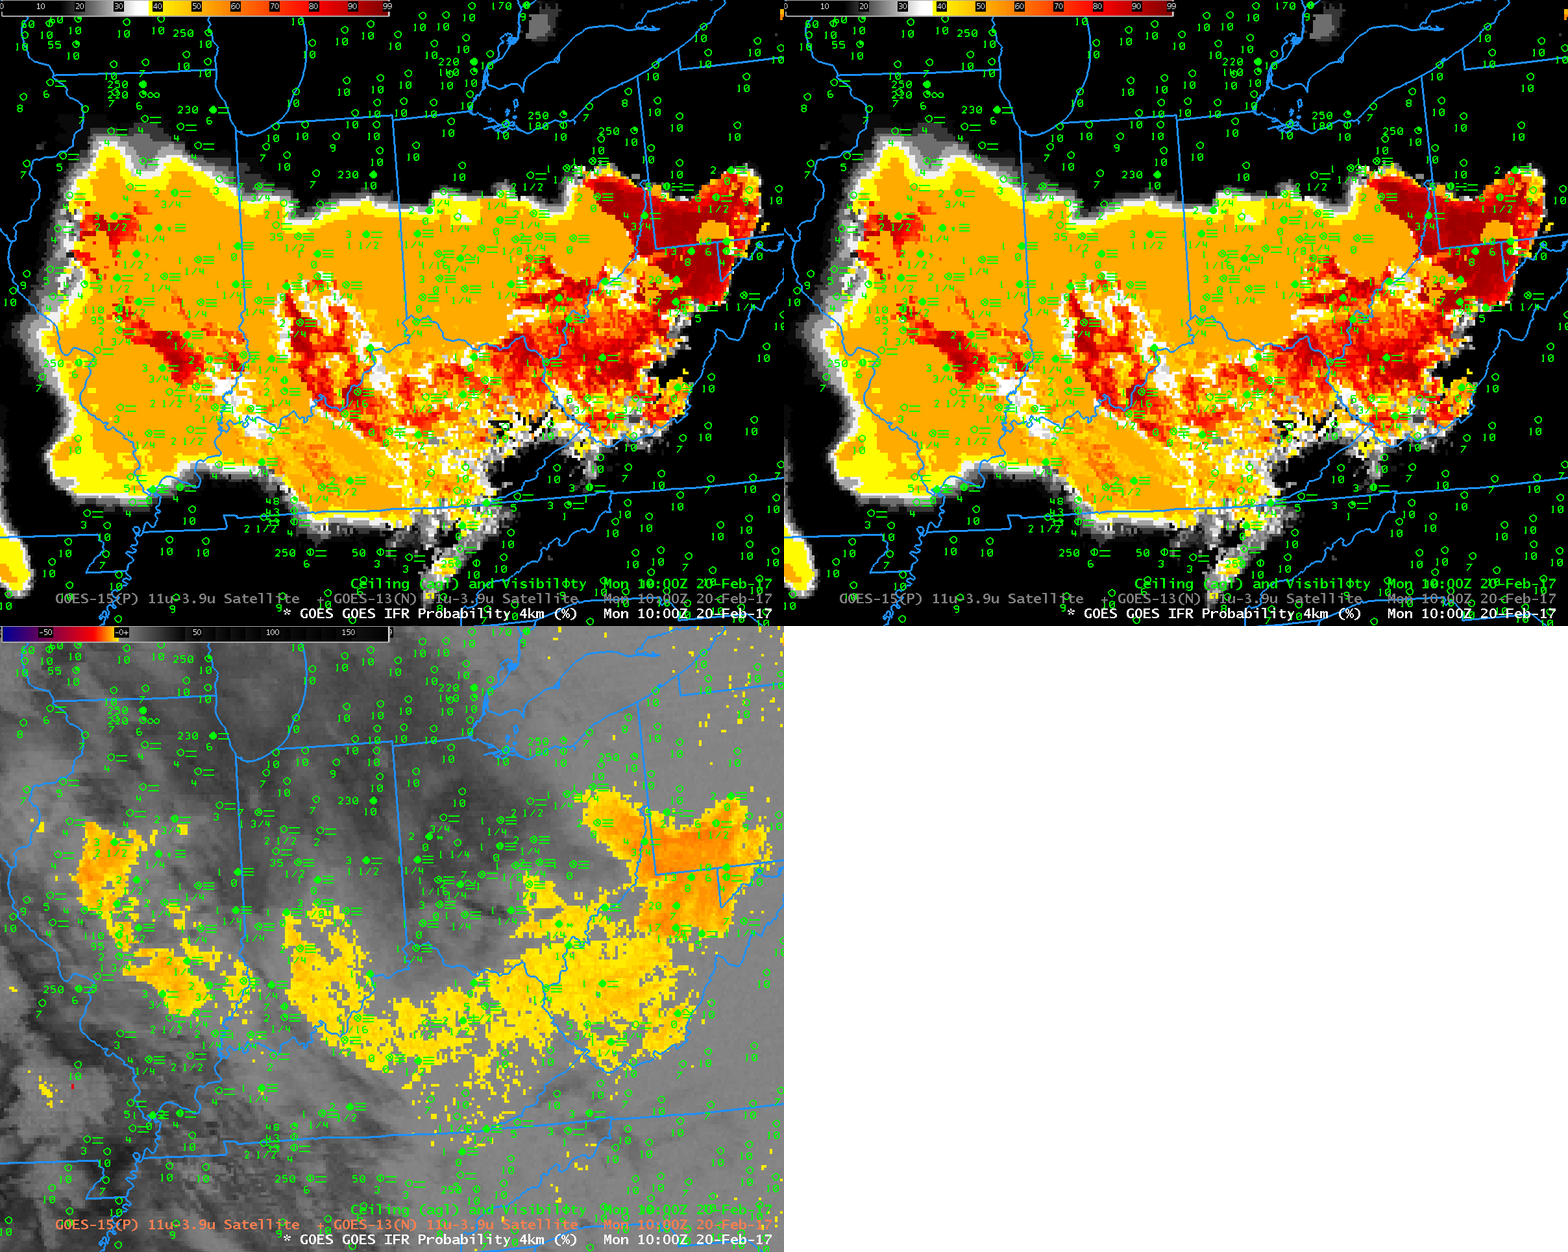
Toggle between 1100 UTC GOES-R IFR Probability fields and GOES-13 Brightness Temperature Difference (3.9 µm – 10.7 µm) fields, with surface observations of ceilings and observations. (Click to enlarge)
Dense Fog developed over central/southern Ohio, Indiana and Illinois on the morning of 20 February 2017 (Screen shot from here; IFR Depiction from here). The toggle above includes the GOES-R IFR Probability fields; large values of IFR Probability overspread the region of low ceilings and visibilities. In contrast, high clouds (dark grey in the enhancement used) are preventing the Brightness Temperature Difference field from articulating where the fog/low ceilings might be occurring. Because satellite data cannot be used as a predictor at 1100 UTC, the character of the IFR Probability field is mostly uniform, lacking the pixelation that occurs when low clouds can be viewed from the satellite (as over southwestern Pennsylvania, West Virginia, central Kentucky, parts of central Illinois, and elsewhere).

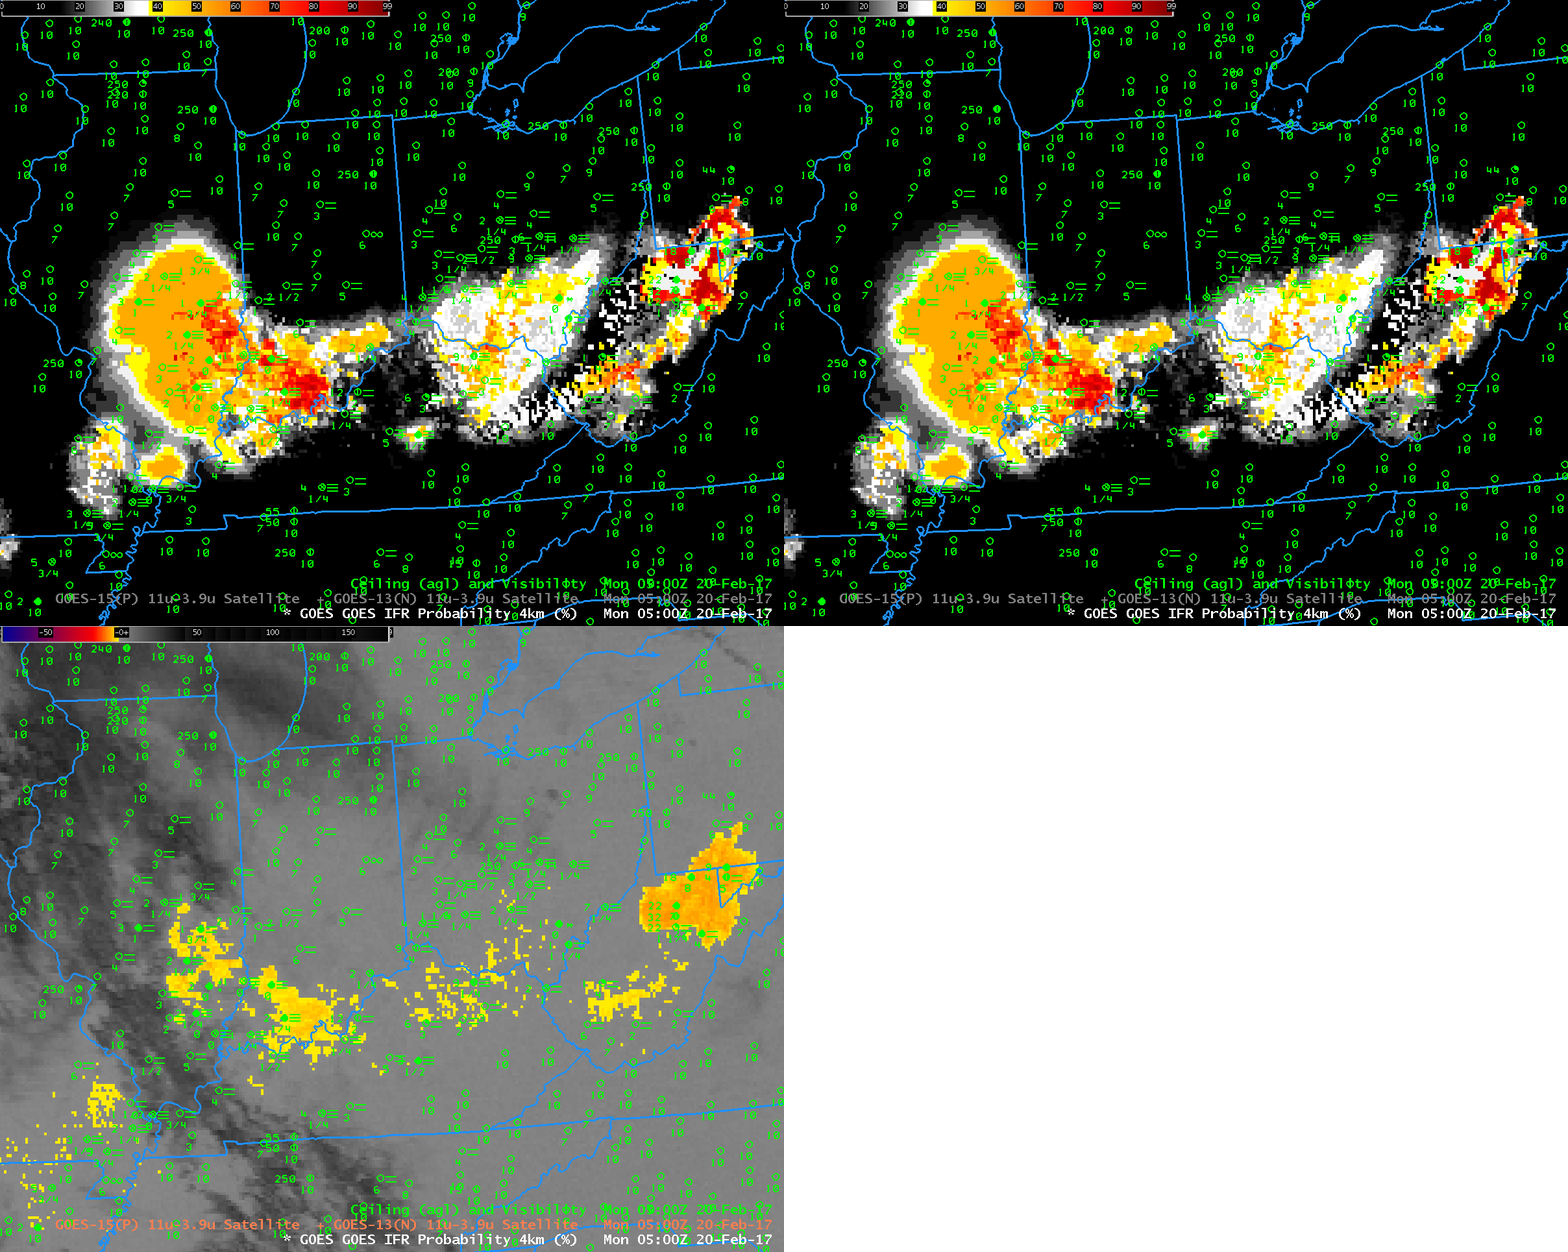
High clouds have not moved into Ohio and Indiana at 0500 UTC on 20 February as the fog was developing (they are present over Illinois, however). The toggle below, from that time, shows low probabilities of IFR conditions over Ohio, and only a few reports of IFR conditions, mostly over central and southern Ohio.

Toggle between 0500 UTC GOES-R IFR Probability fields and GOES-13 Brightness Temperature Difference (3.9 µm – 10.7 µm) fields, with surface observations of ceilings and observations. (Click to enlarge)
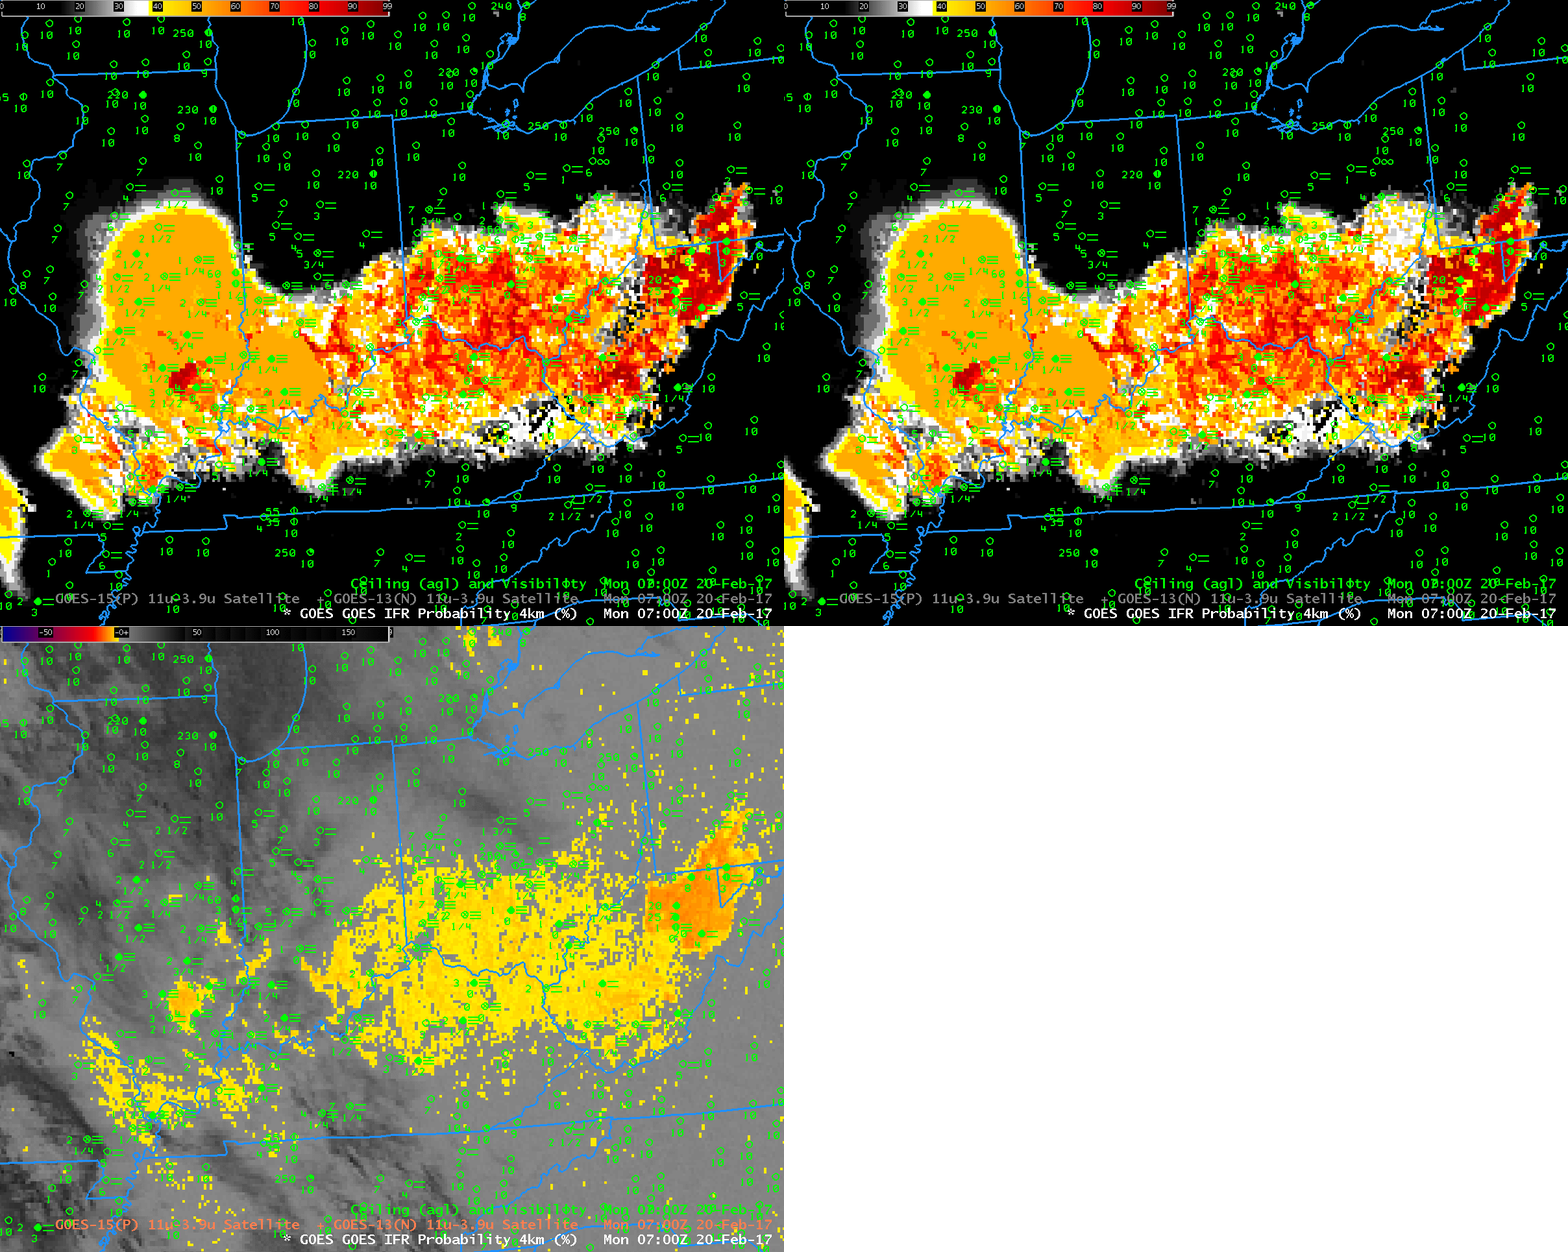
Toggle between 0700 UTC GOES-R IFR Probability fields and GOES-13 Brightness Temperature Difference (3.9 µm – 10.7 µm) fields, with surface observations of ceilings and observations. (Click to enlarge)
By 0700 UTC (above), IFR conditions are becoming more widespread as IFR Probabilities increase.  The dark regions in the Brightness Temperature Difference fields over Wisconsin and Lower Michigan and surrounding regions show the advance of high clouds.  By 1000 UTC, those clouds have overspread Ohio and Indiana, and the brightness temperature difference field loses utility as far as low-cloud detection goes.  Because the IFR Probability fields incorporate low-level saturation information from the Rapid Refresh Model, however, IFR Probability fields can continue to provide a useful signal when high clouds are present or move in.

Toggle between 1000 UTC GOES-R IFR Probability fields and GOES-13 Brightness Temperature Difference (3.9 µm – 10.7 µm) fields, with surface observations of ceilings and observations. (Click to enlarge)
Fog and Ice Fog over the southern Plains

ifrp_0400_1215_05dec2016anim

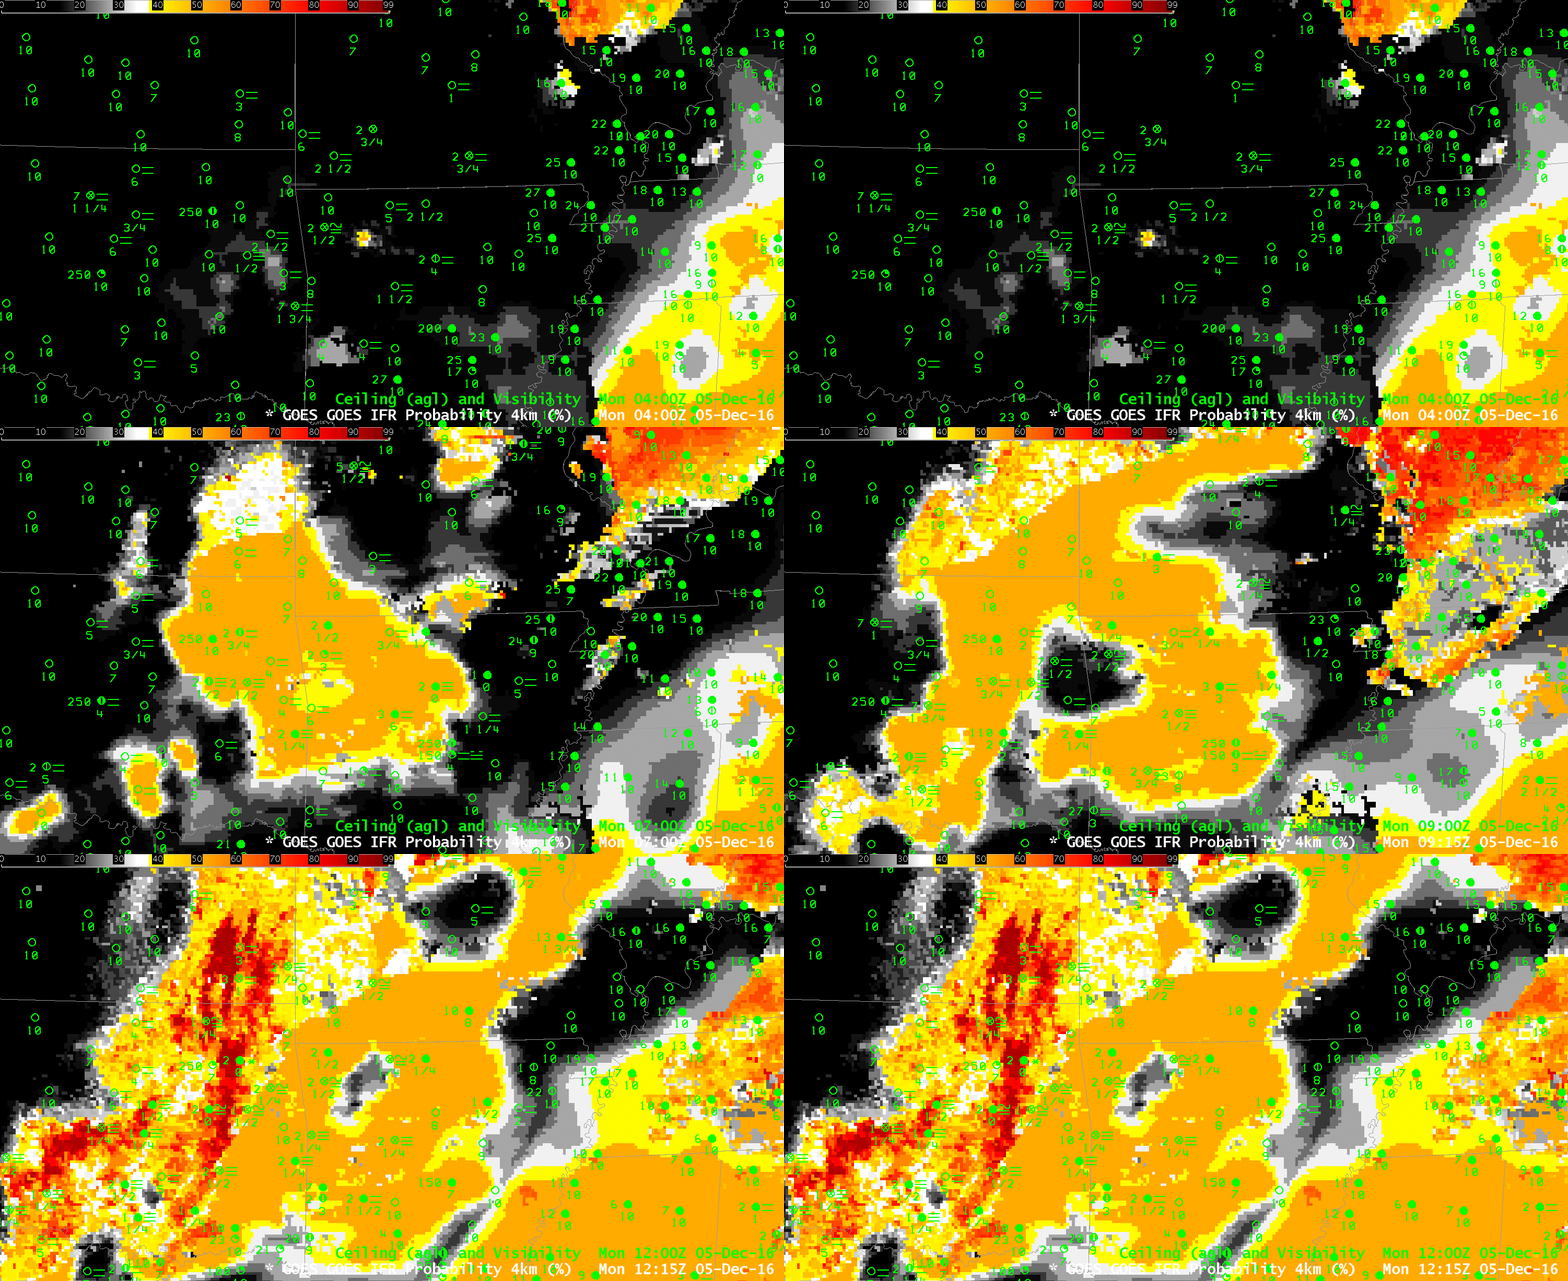
GOES-R IFR Probabilities, hourly from 0400 through 1215 UTC on 5 December 2016 (Click to enlarge)

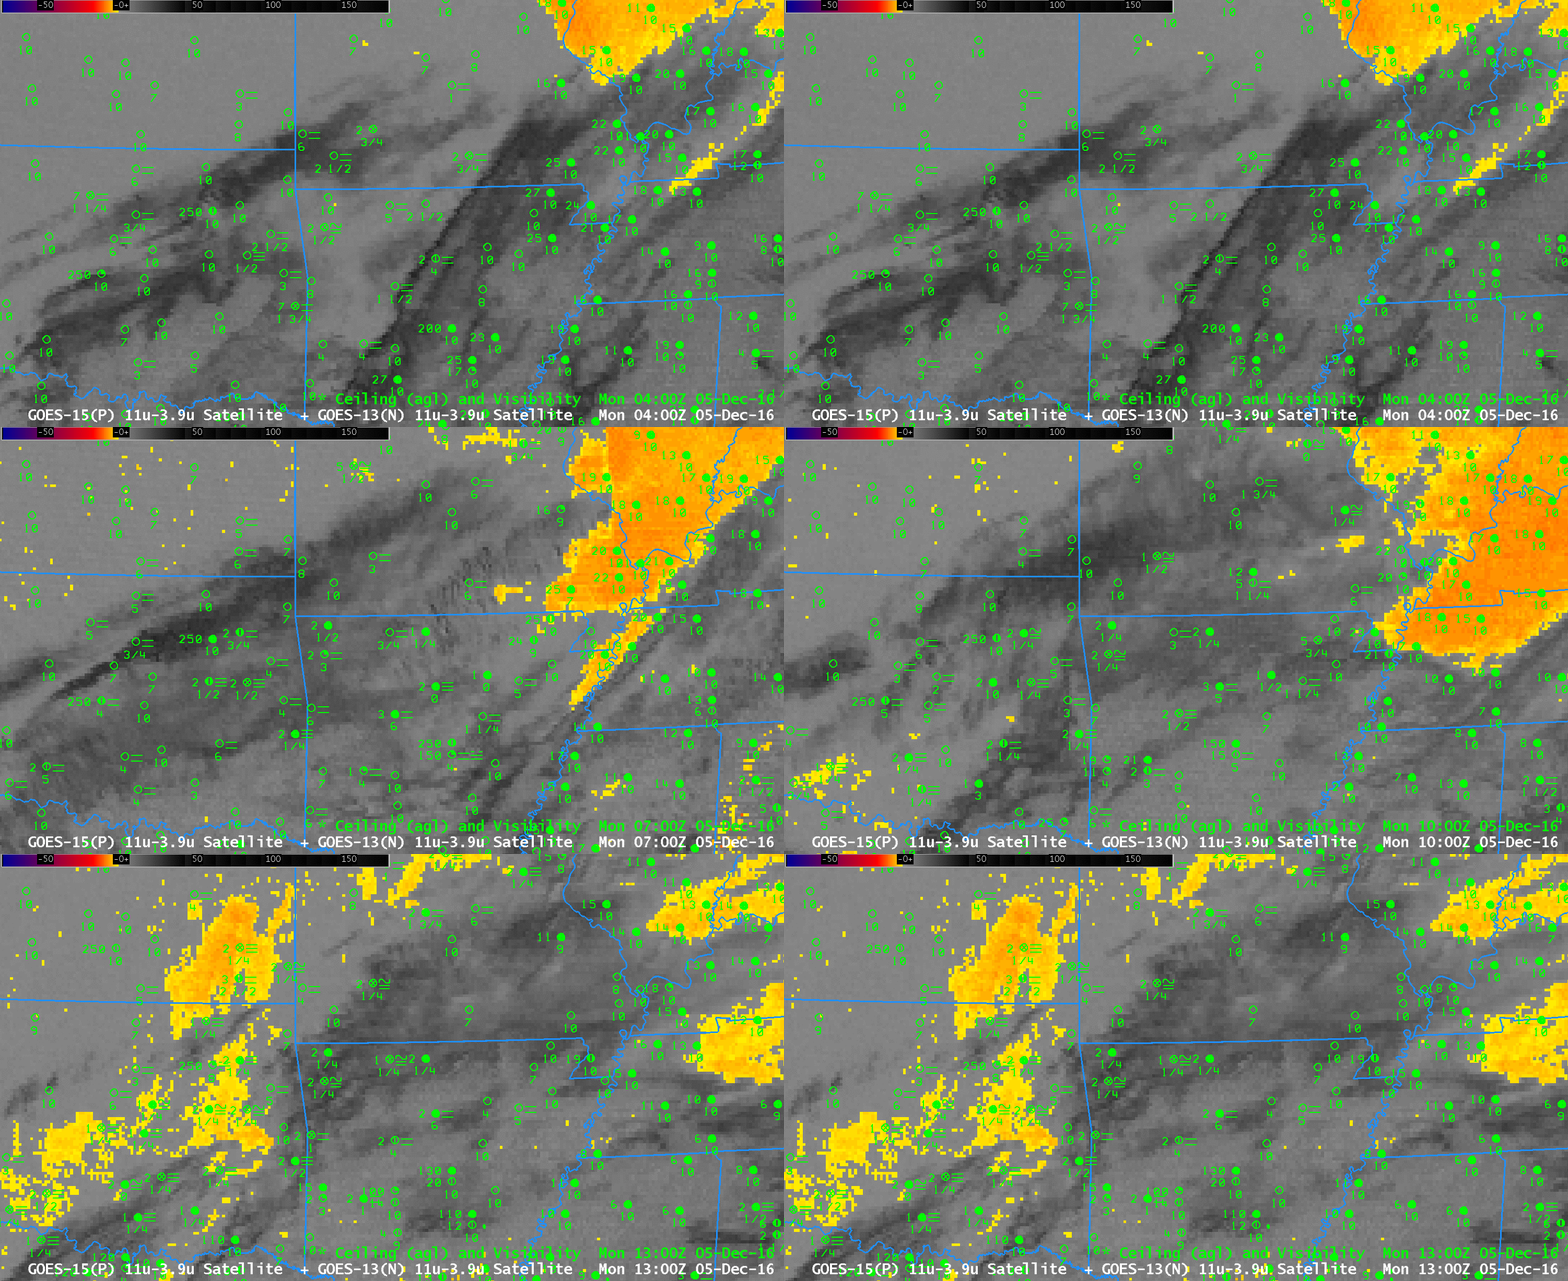
Dense Fog developed over the southern Plains early on Monday 5 December, and the GOES-R IFR Probability fields, above, were a tool that could be used to monitor the evolution of this event. A challenge presented on this date was the widespread cirrus (Here’s the 0700 UTC GOES-13 Water Vapor (6.5 µm) Image, for example) that prevented satellite detection of low clouds. The Brightness Temperature Difference fields, below, at 3-hourly intervals, also show a signature (dark grey/black in the enhancement used) of high clouds, although they are shifting east with time — by 1300 UTC there is a signature (orange/yellow in the enhancement used) of stratus clouds over central and eastern Oklahoma.

The IFR Probability fields, above, have a characteristic flat nature over Arkansas and Missouri, that is, a uniformity to the field, that is typical when model data are driving the probabilities. The more pixelated nature to the fields over Kansas and Oklahoma, especially near the end of the animation, typifies what the fields look like when both satellite data and model data are driving the computation of probabilities. Careful inspection of the fields over Arkansas shows regions — around Fayetteville, for example, around 1000 UTC where IFR Probabilities are too low given the observation at the airport of IFR conditions. This inconsistency gives information on either the small-scale nature of the fog (unlikely in this case) or on the accuracy of the Rapid Refresh model simulation that is contributing to the probabilities. In general, the Rapid Refresh model has accurately captured this event, and therefore the IFR Probabilities are mostly overlapping regions of IFR or near-IFR conditions. The region over southern Illinois that has stratus, and low probabilities of IFR conditions, for example. Adjacent regions have higher IFR Probabilities and lower ceilings and/or reduced visibilities. A screen shot from the National Weather Service, and from the Aviation Weather Center, at about 1300 UTC document the advisories that were issued for this event.

btd_0400_1300_05dec2016step

Brightness Temperature Difference fields (3.9 µm – 10.7 µm), 0400, 0700, 1000 and 1300 UTC on 5 December 2016 (Click to enlarge)

IFR Probability Motion as a forecast tool

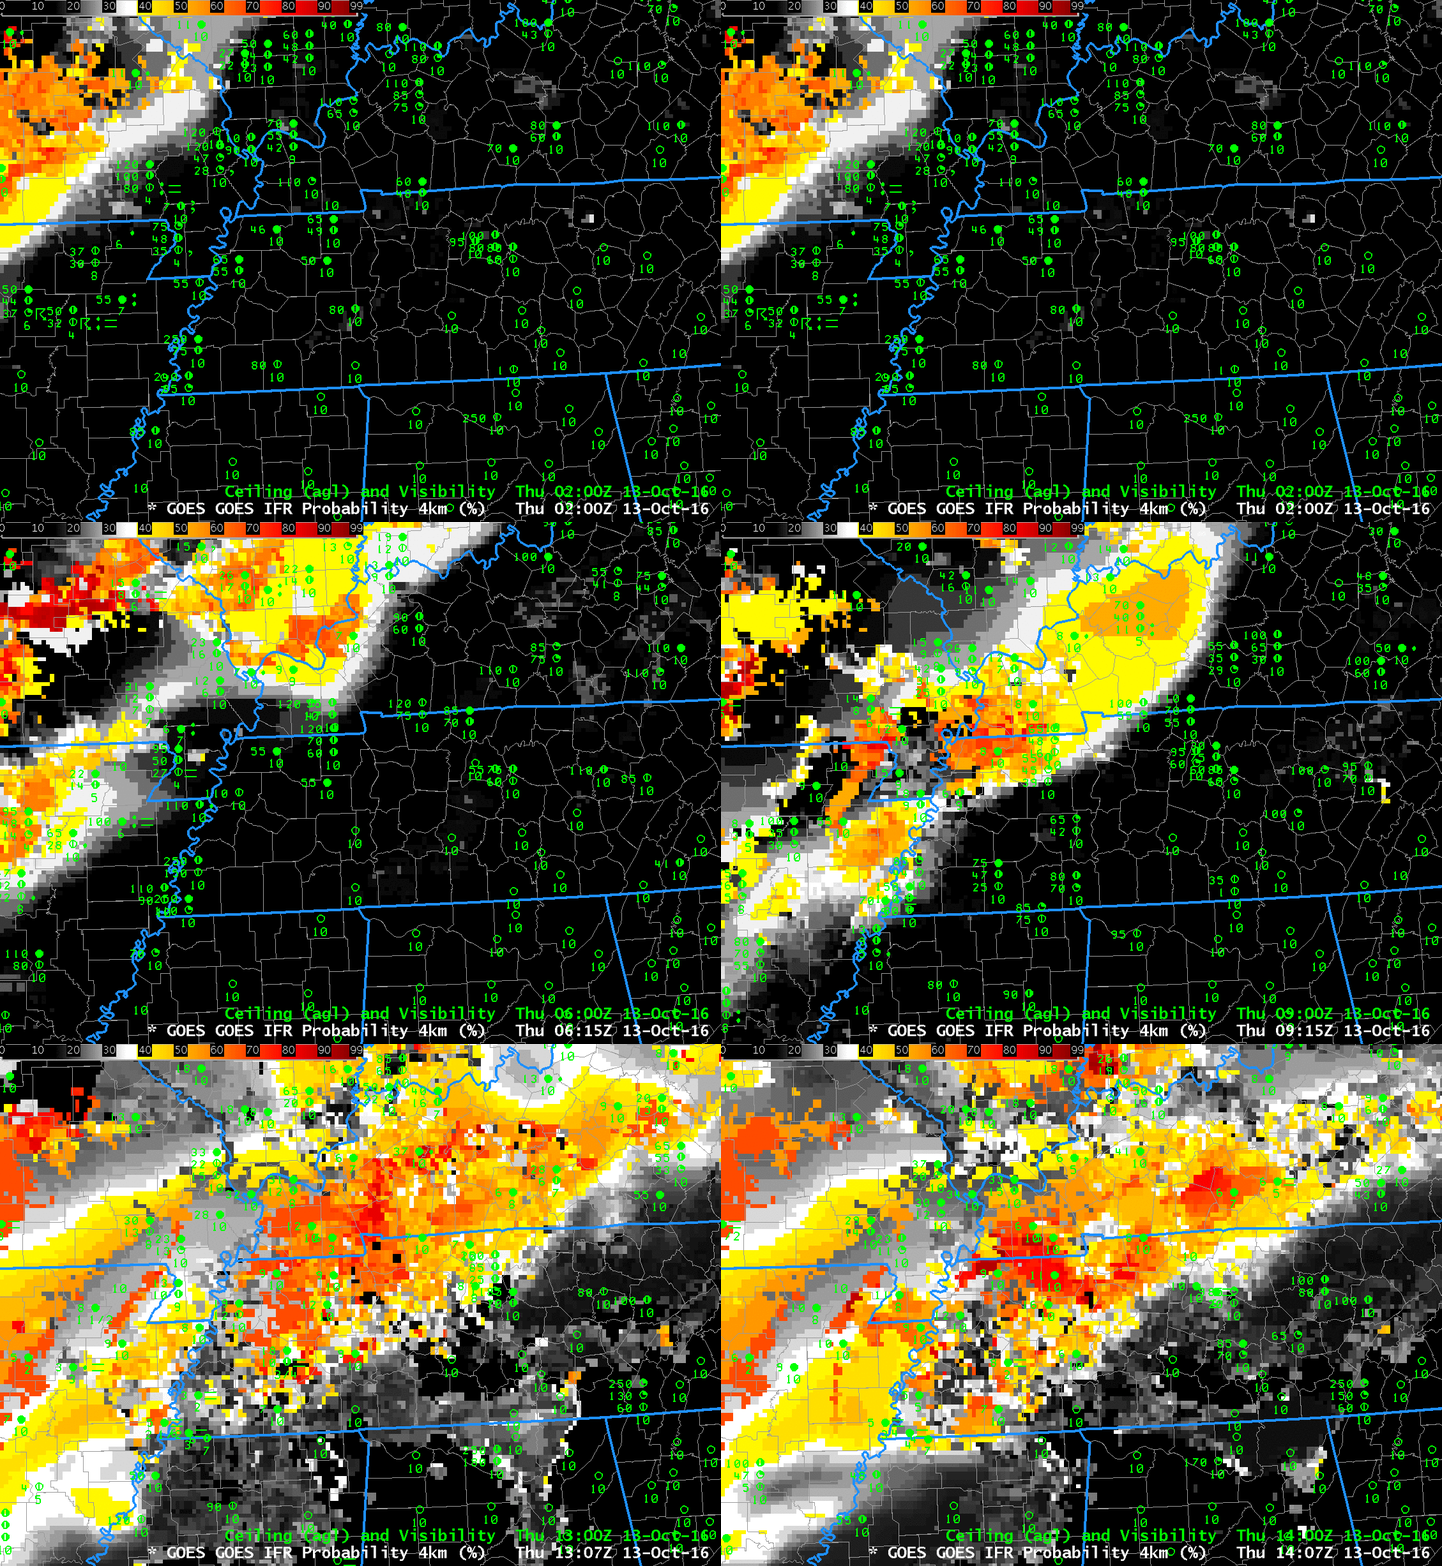
ifrprobability_13oct2016_0200_1407anim

GOES-R IFR Probability Fields, 0200-1400 UTC on 13 October 2016 along with surface observations of ceilings/visibility (Click to enlarge)

Because GOES-R IFR Probability fields are computed with the same time latency as GOES imagery, motion of the IFR Probability fields can have predictive value.  In the animation above, higher GOES-R IFR Probability  is moving eastward;  IFR Conditions are reported as the higher IFR conditions move overhead (consider, for example, Bowling Green, KY, or Clarksville, TN), and ceilings / visibilities improve as the band of higher IFR conditions moves eastward from a station (over southern Illinois, for example).

Fog over the lower Ohio River Valley

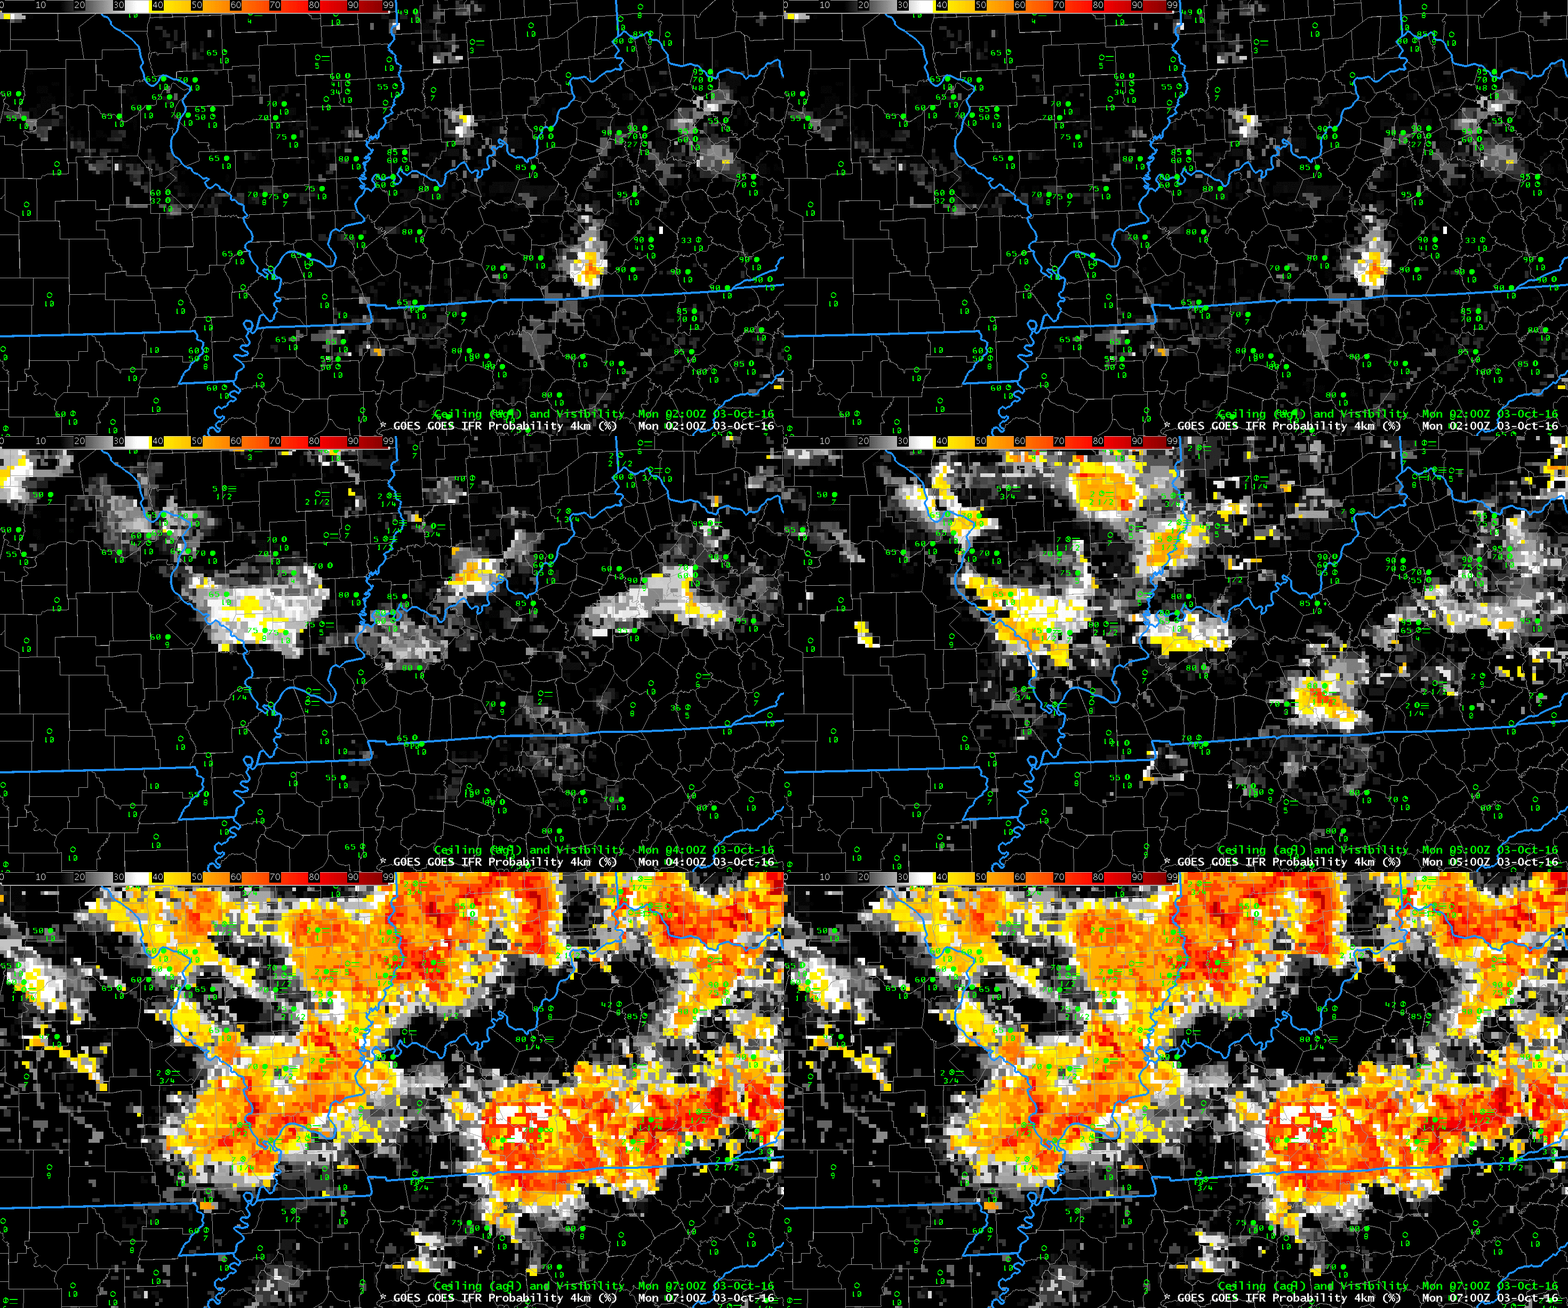
goesr_ifrp_3october2016anim_0100_0700

GOES-R IFR Probability Fields, 0200-0700 UTC on 3 October 2016 (Click to enlarge)

Fog developed over portions of the Ohio River Valley from Indiana westward to the Mississippi River at Cairo IL on the morning of 3 October 2016.   Dense Fog Advisories were issued by the National Weather Service Offices in St. Louis, Lincoln IL and Paducah between 3:30 and 4:15 CDT (0830 to 0915 UTC).  A SIGMET was also issued.  How effective was Satellite detection of this developing fog? 

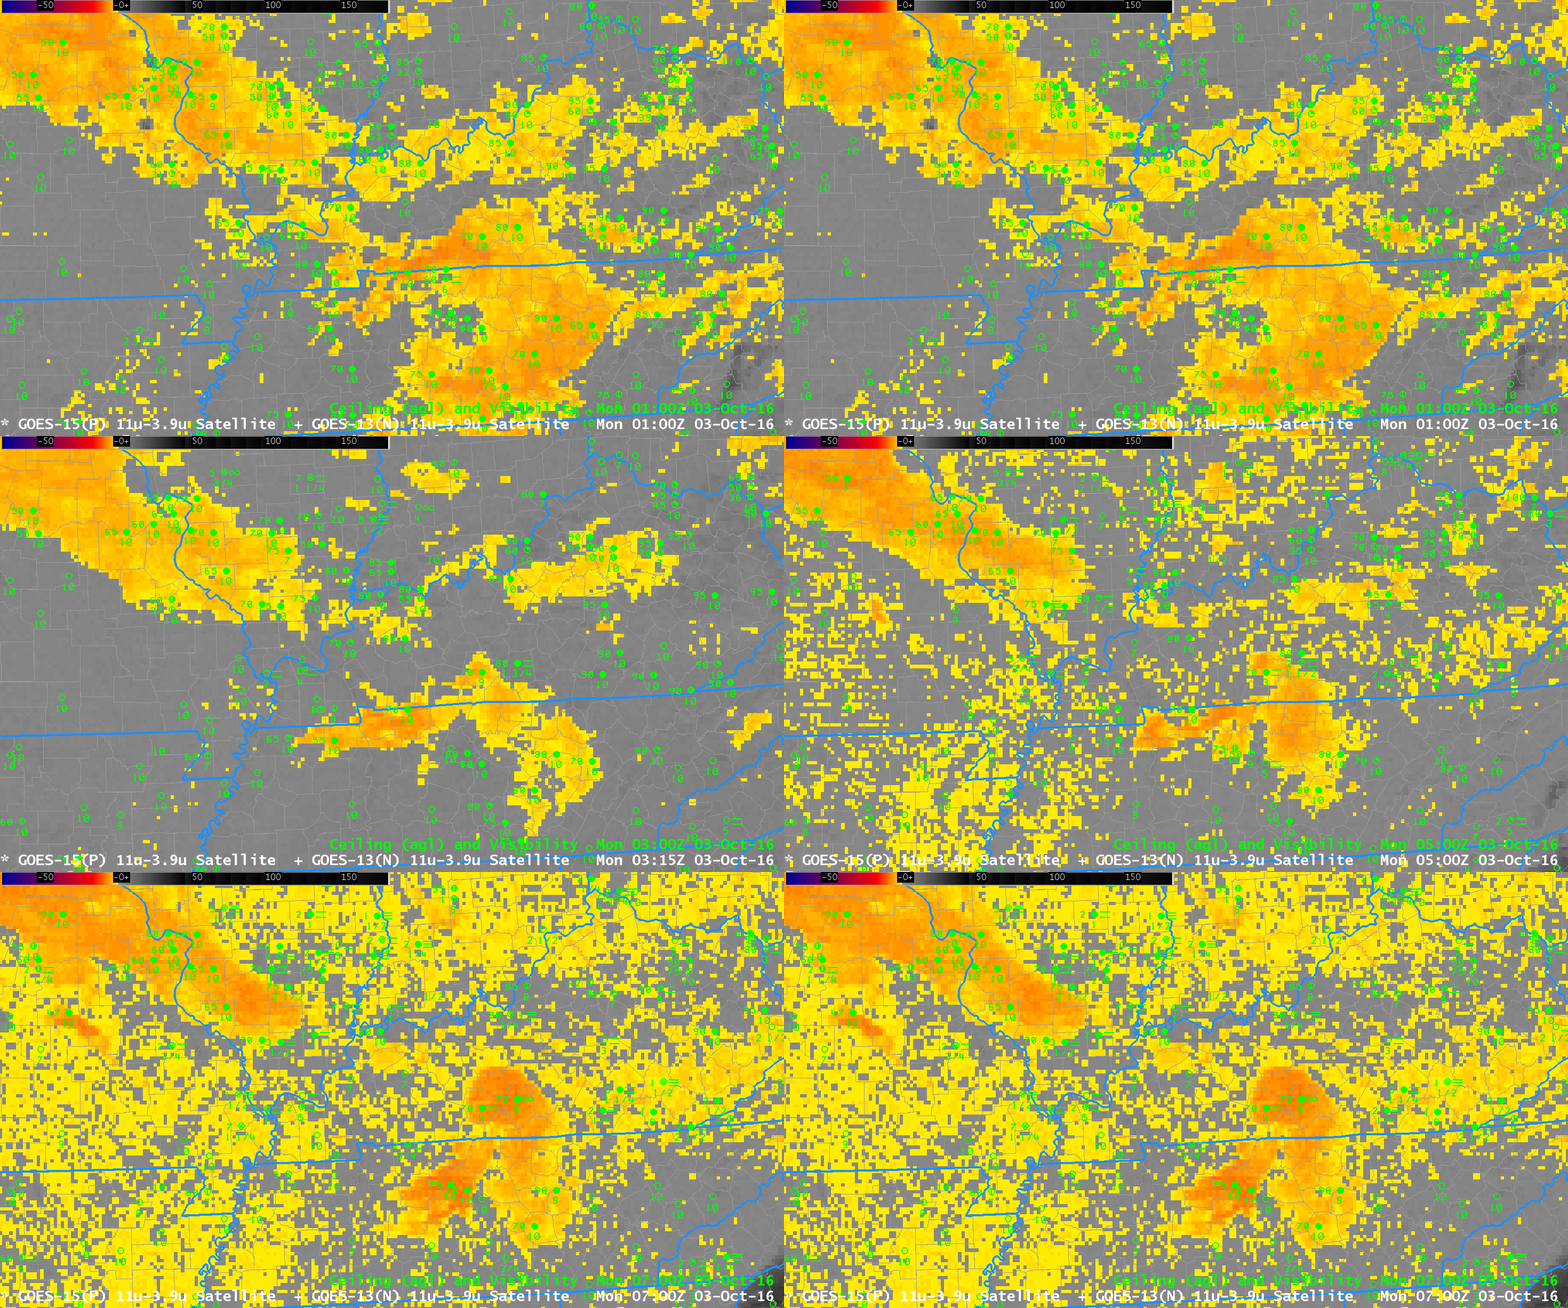
The brightness temperature difference product, below, shows hourly measures of water-based clouds, a detection that keys off the emissivity differences of water based clouds for 3.9 radiation (at which wavelength near-blackbody emission is not occurring) and 10.7 radaiation (at which wavelength near-blackbody emission is occurring).  Significant changes to the brightness temperature difference field did not occur until after 0500 UTC.   In addition, Brightness Temperature Difference fields overestimated the region of developing fog.  In contrast, the GOES-R IFR Probability field, above, showed a more gradual increase from 0200 UTC onward, and the region of the strong signal was better confined to where dense fog developed. On this day, GOES-R IFR Probability fields were better for situational awareness, generating an earlier alert for forecasters to the potential for fog. In addition, the GOES-R IFR Probability fields better defined the region of hazardous ceilings and visibilities.

btd_anim_03octob2016_0100_0700

Brightness Temperature Difference Field (3.9 – 10.7) from 0100 to 0700 UTC on 3 October 2016 (Click the enlarge)