GOES-R IFR Probabilities, hourly from 0400 through 1215 UTC on 5 December 2016 (Click to enlarge)
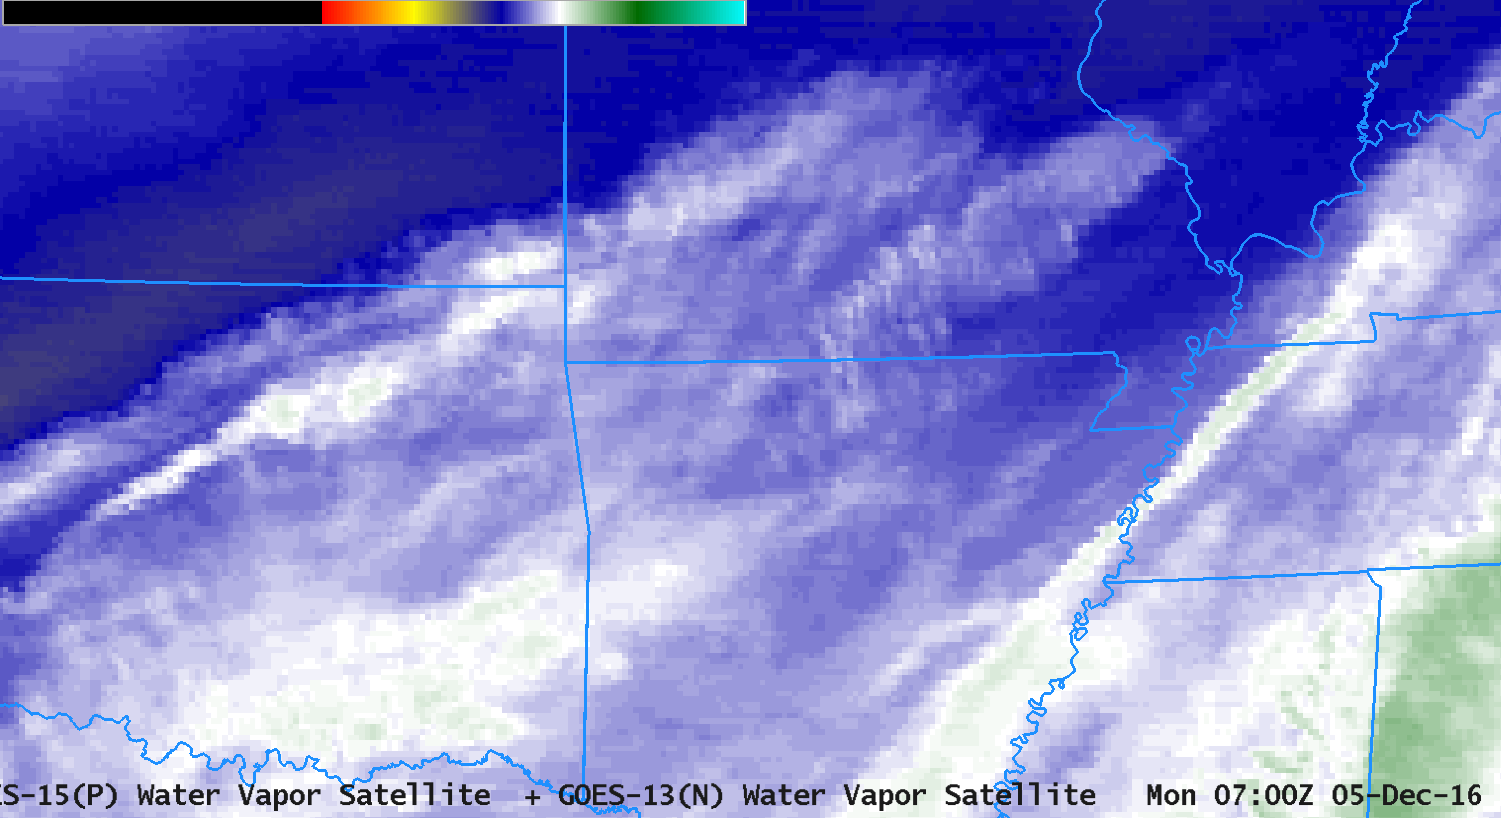
Dense Fog developed over the southern Plains early on Monday 5 December, and the GOES-R IFR Probability fields, above, were a tool that could be used to monitor the evolution of this event. A challenge presented on this date was the widespread cirrus (Here’s the 0700 UTC GOES-13 Water Vapor (6.5 µm) Image, for example) that prevented satellite detection of low clouds. The Brightness Temperature Difference fields, below, at 3-hourly intervals, also show a signature (dark grey/black in the enhancement used) of high clouds, although they are shifting east with time — by 1300 UTC there is a signature (orange/yellow in the enhancement used) of stratus clouds over central and eastern Oklahoma.
The IFR Probability fields, above, have a characteristic flat nature over Arkansas and Missouri, that is, a uniformity to the field, that is typical when model data are driving the probabilities. The more pixelated nature to the fields over Kansas and Oklahoma, especially near the end of the animation, typifies what the fields look like when both satellite data and model data are driving the computation of probabilities. Careful inspection of the fields over Arkansas shows regions — around Fayetteville, for example, around 1000 UTC where IFR Probabilities are too low given the observation at the airport of IFR conditions. This inconsistency gives information on either the small-scale nature of the fog (unlikely in this case) or on the accuracy of the Rapid Refresh model simulation that is contributing to the probabilities. In general, the Rapid Refresh model has accurately captured this event, and therefore the IFR Probabilities are mostly overlapping regions of IFR or near-IFR conditions. The region over southern Illinois that has stratus, and low probabilities of IFR conditions, for example. Adjacent regions have higher IFR Probabilities and lower ceilings and/or reduced visibilities. A screen shot from the National Weather Service, and from the Aviation Weather Center, at about 1300 UTC document the advisories that were issued for this event.
Brightness Temperature Difference fields (3.9 µm – 10.7 µm), 0400, 0700, 1000 and 1300 UTC on 5 December 2016 (Click to enlarge)