Category Archives: Day/Night Band

Radiation Fog over Texas, Day 2

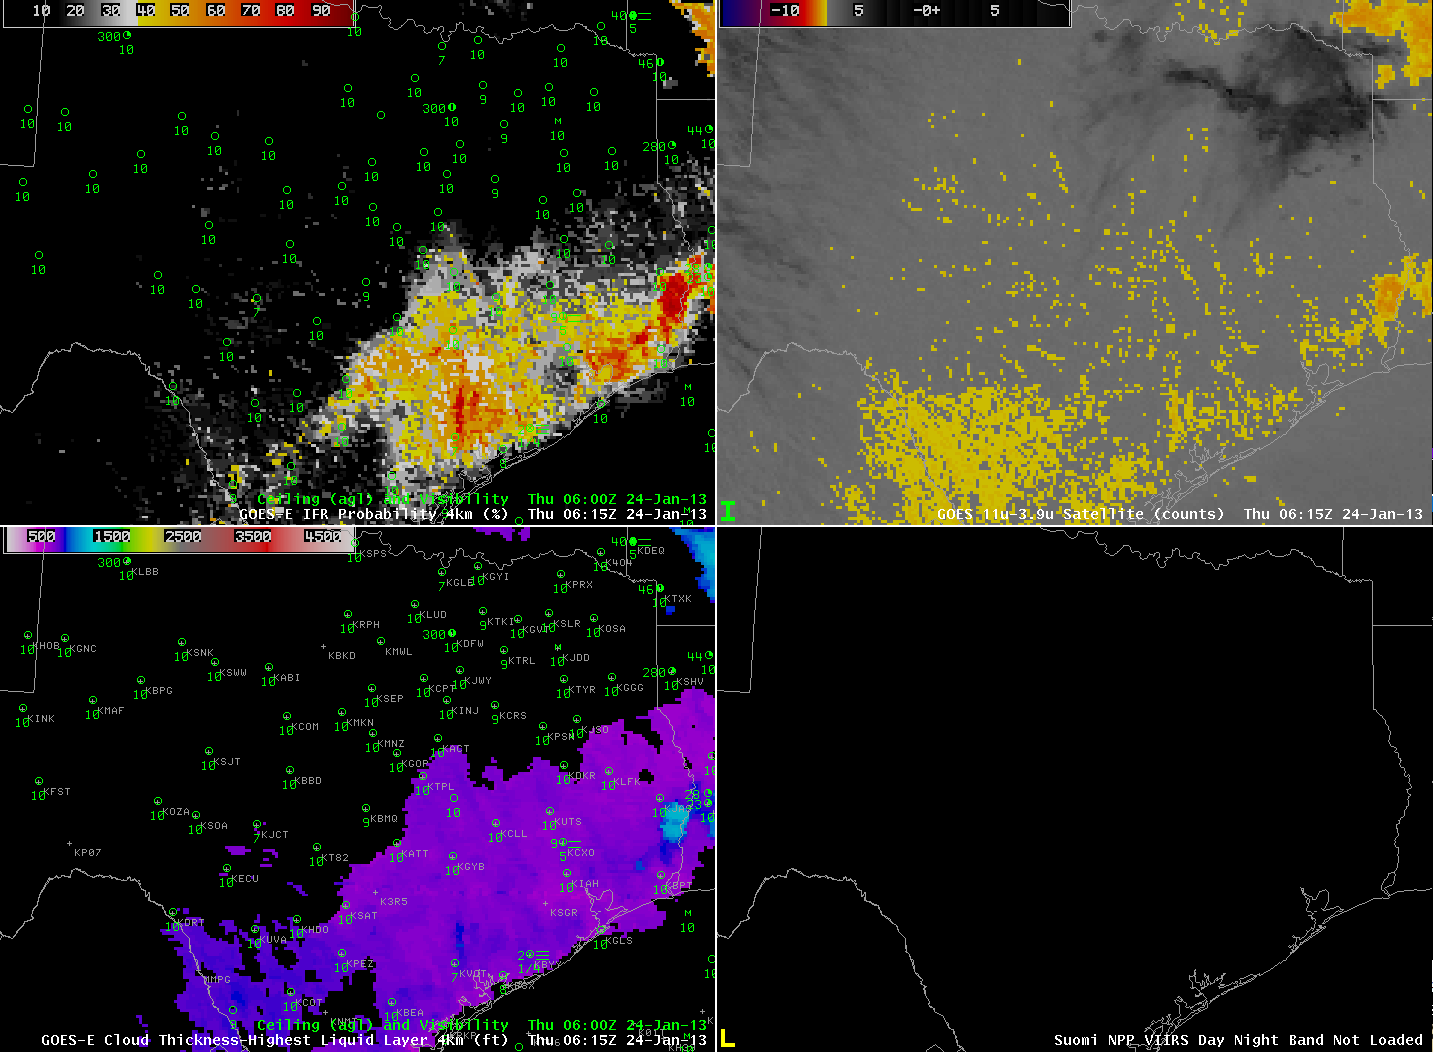
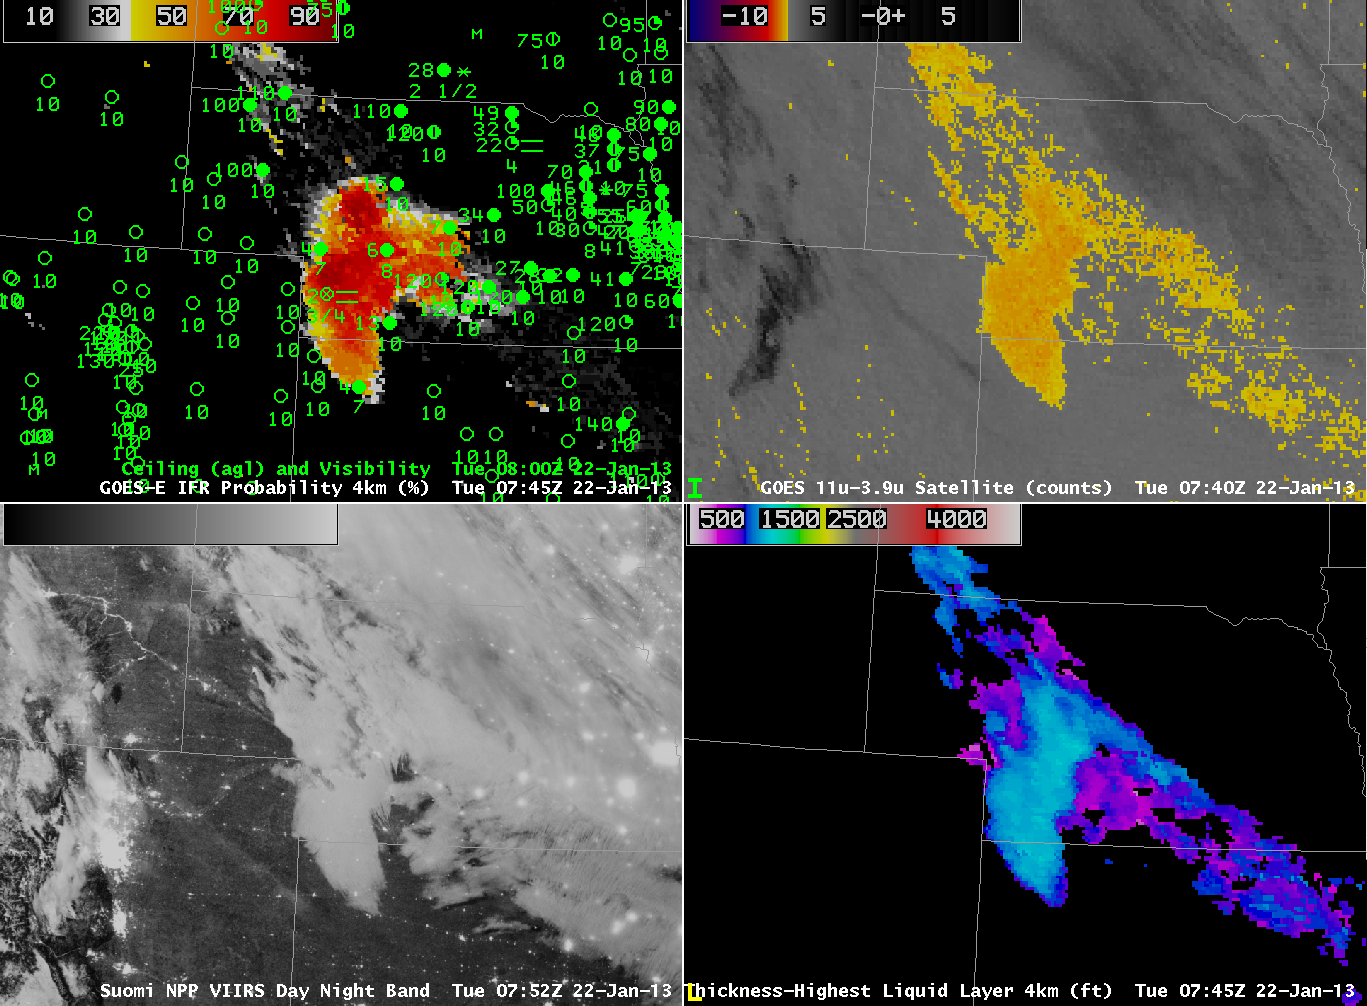
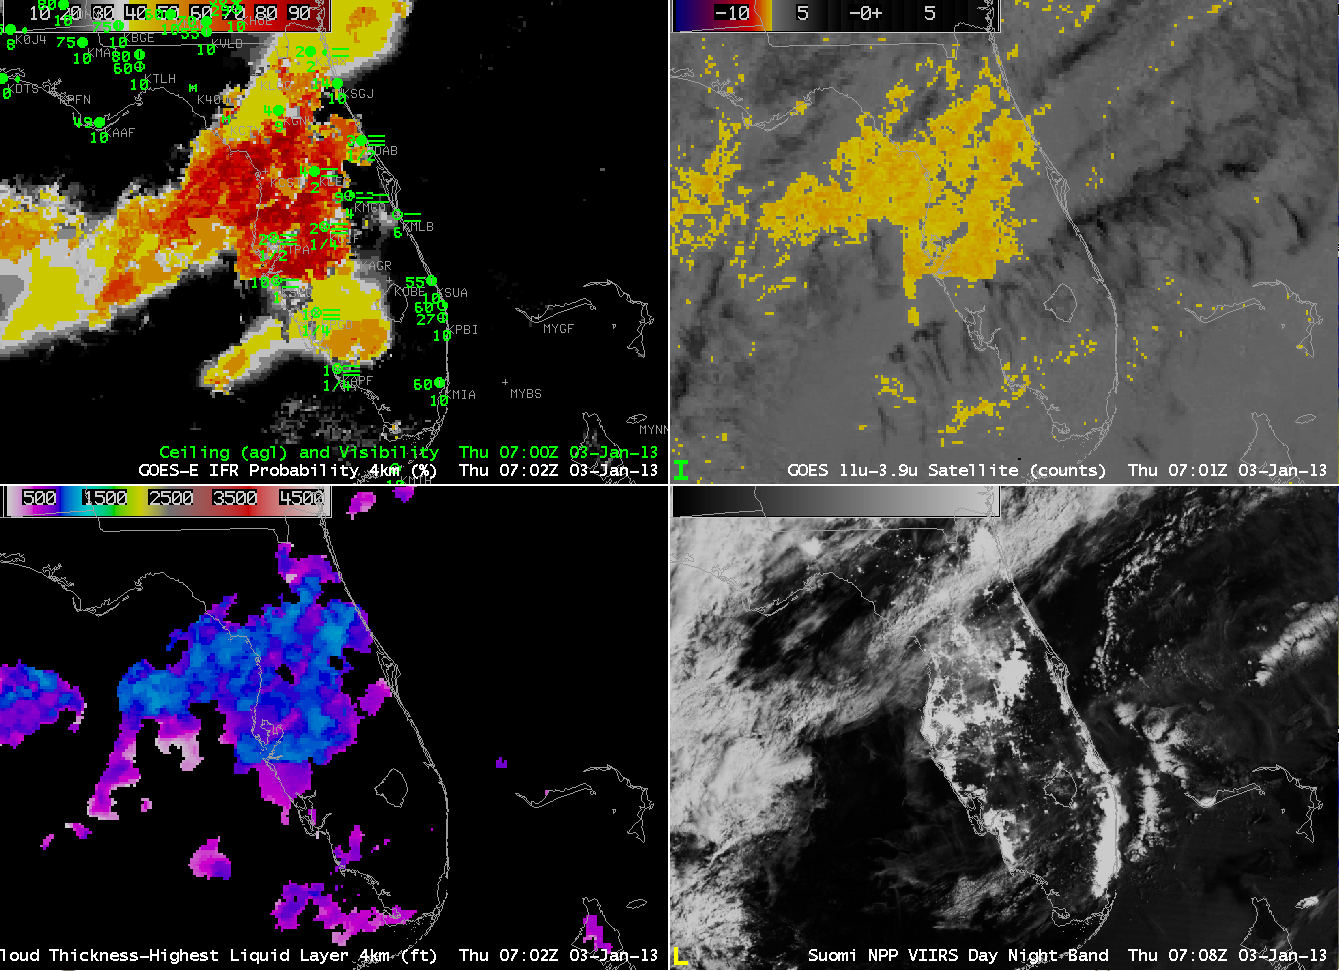
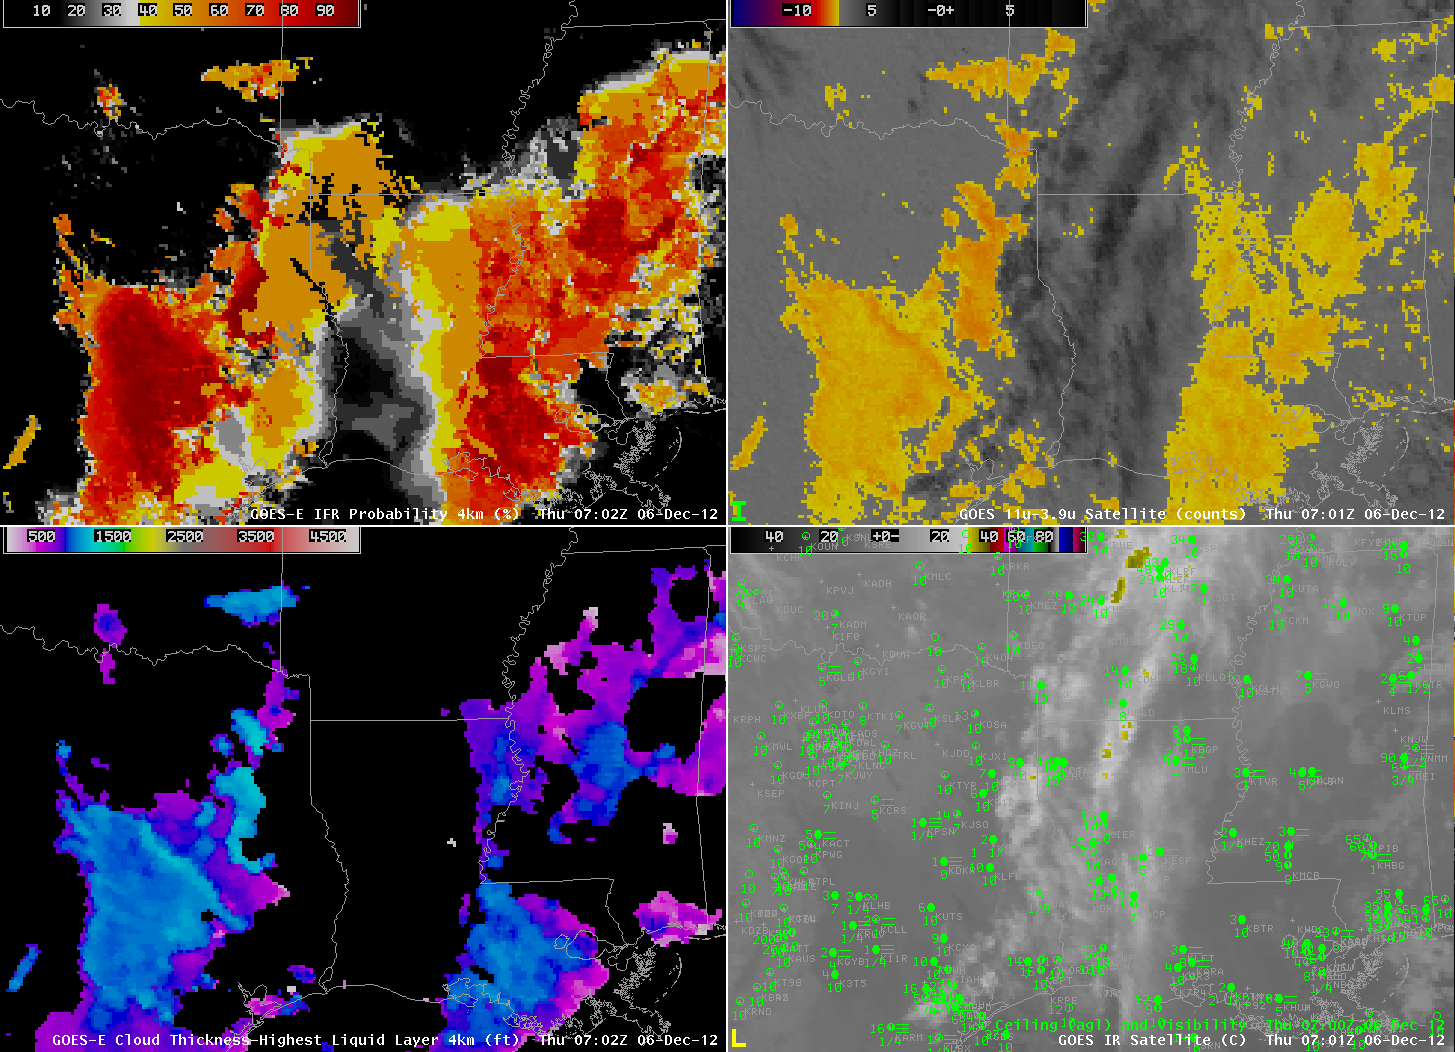
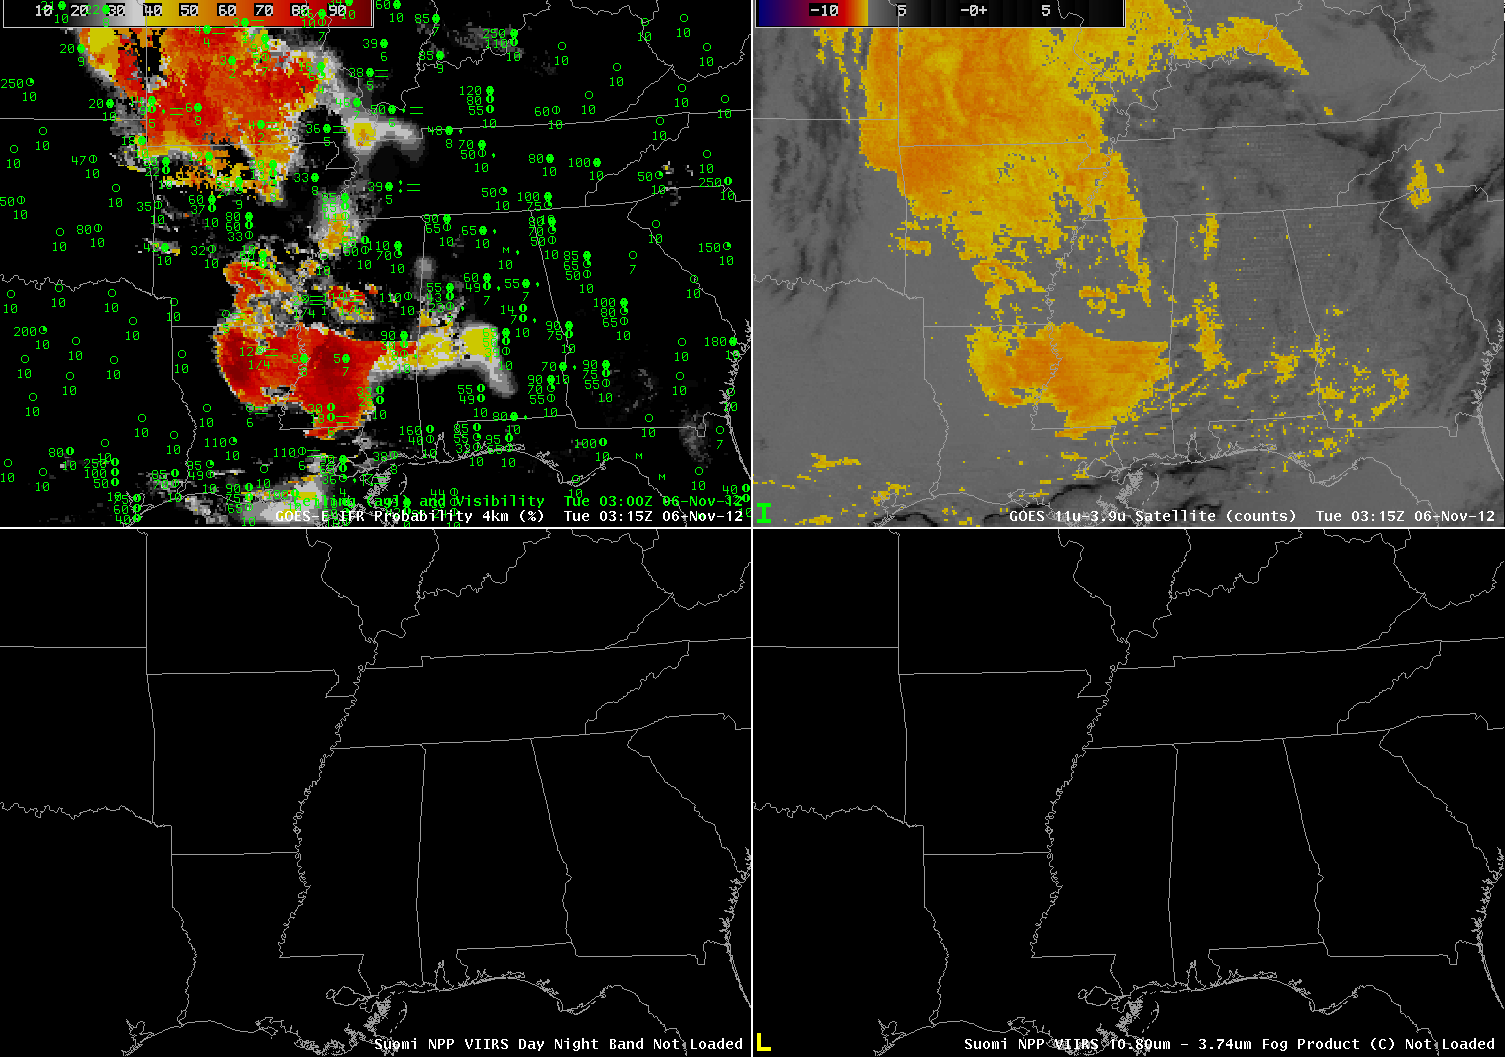
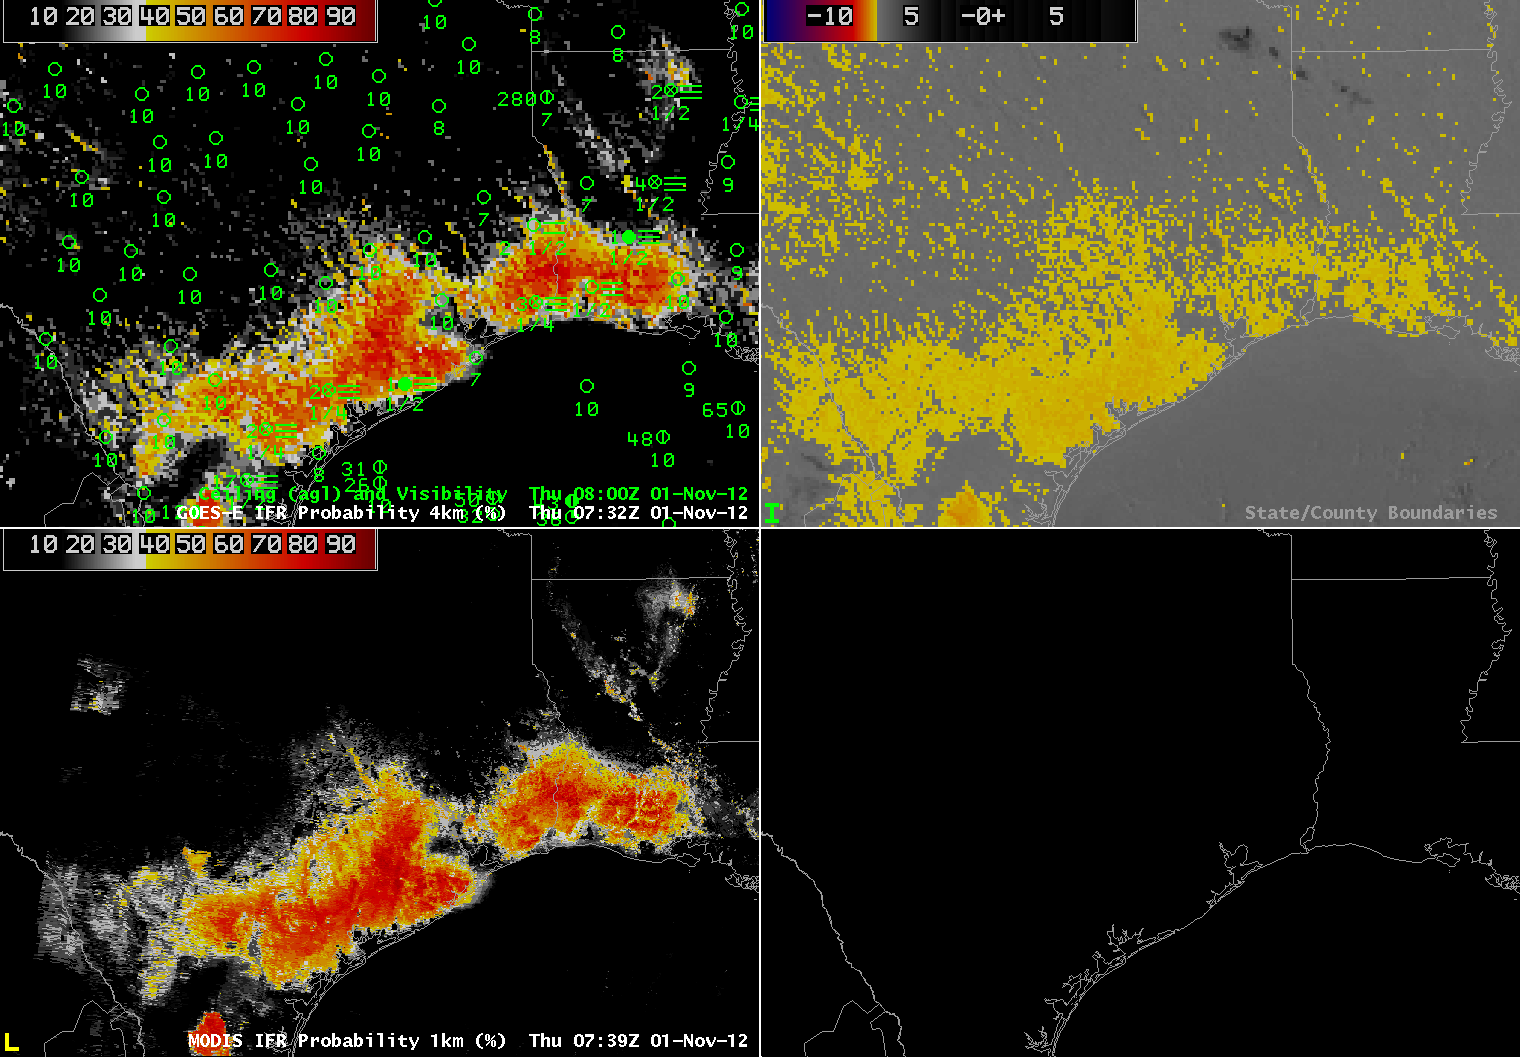
GOES-R IFR Probabilities computed from GOES-East and the Rapid Refresh Model (Upper Left), GOES-East Brightness Temperature Difference (10.7 µm – 3.9 µm) (Upper Right), GOES-R Cloud Thickness computed from GOES-East (Lower Left), Suomi/NPP VIIRS Day/Night Band (Lower Right), 0615 UTC on 24 January 2013

Clear skies and light winds again allowed for the development of radiation fog over southeast Texas.  How did the development, and the detection of fog, differ for this event from the event 1 night previous (as discussed here).  The 0615 UTC imagery, above, shows a separation between where the Brightness Temperature Difference (the heritage fog detection product) and where the GOES-R IFR probabilities are suggesting fog is present.  The Heritage Fog Product is focused on the Rio Grande Valley whereas the GOES-R IFR Probability is focused (correctly, as it turns out) on southeast Texas.  Note also that the Brightness Temperature Difference product has a signal representative of higher clouds (the dark region) over northeast Texas.

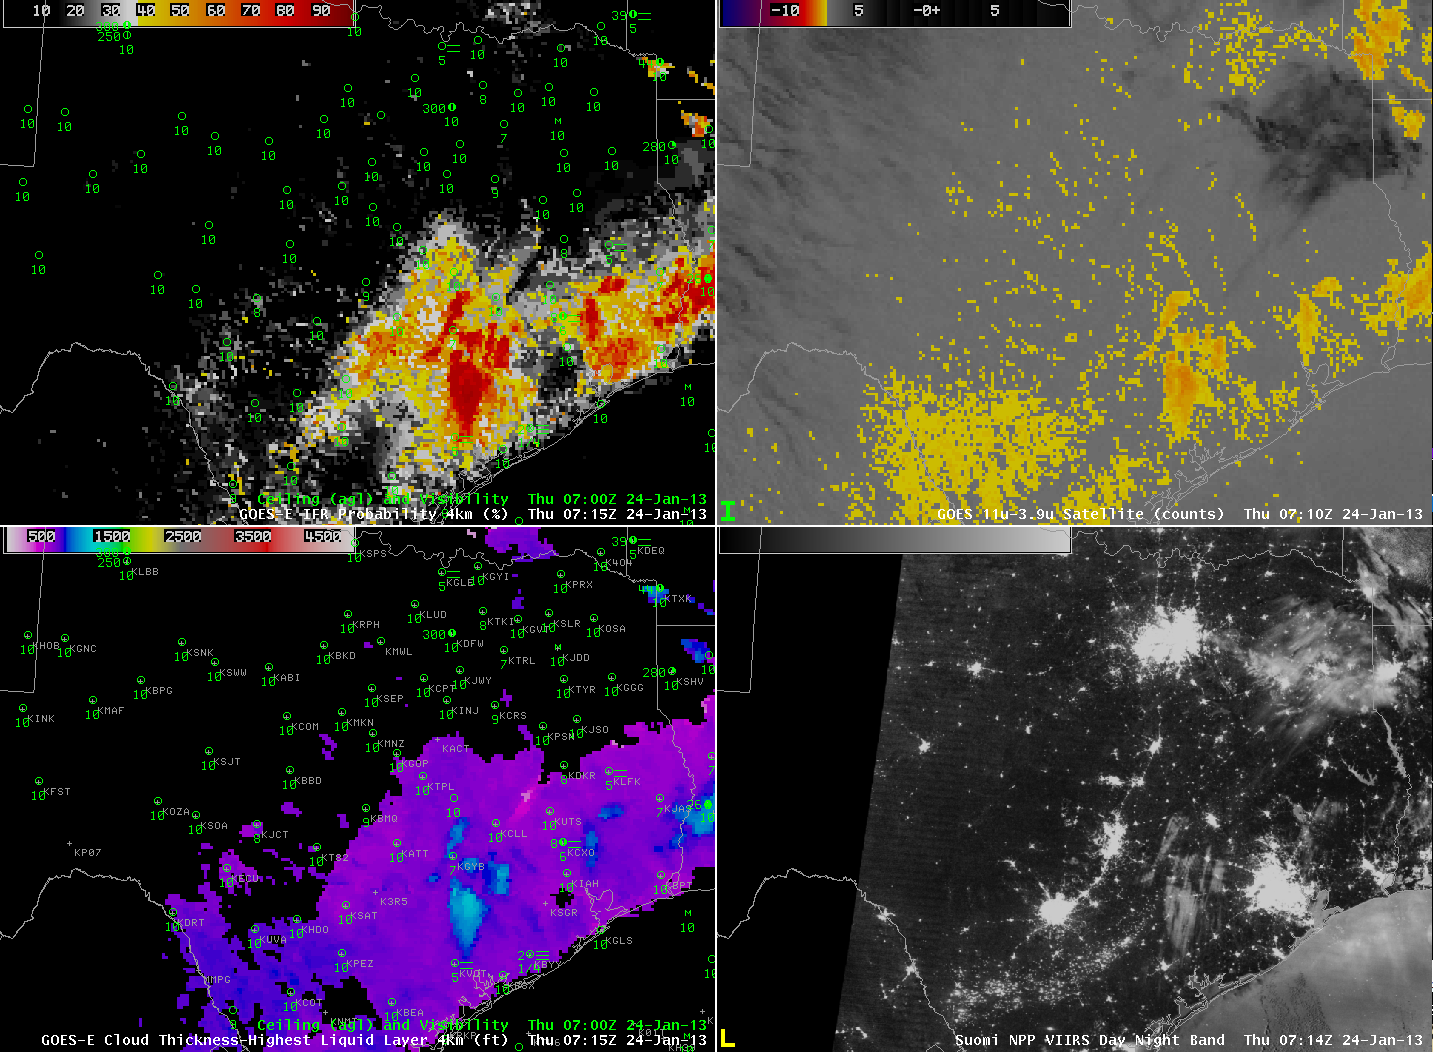
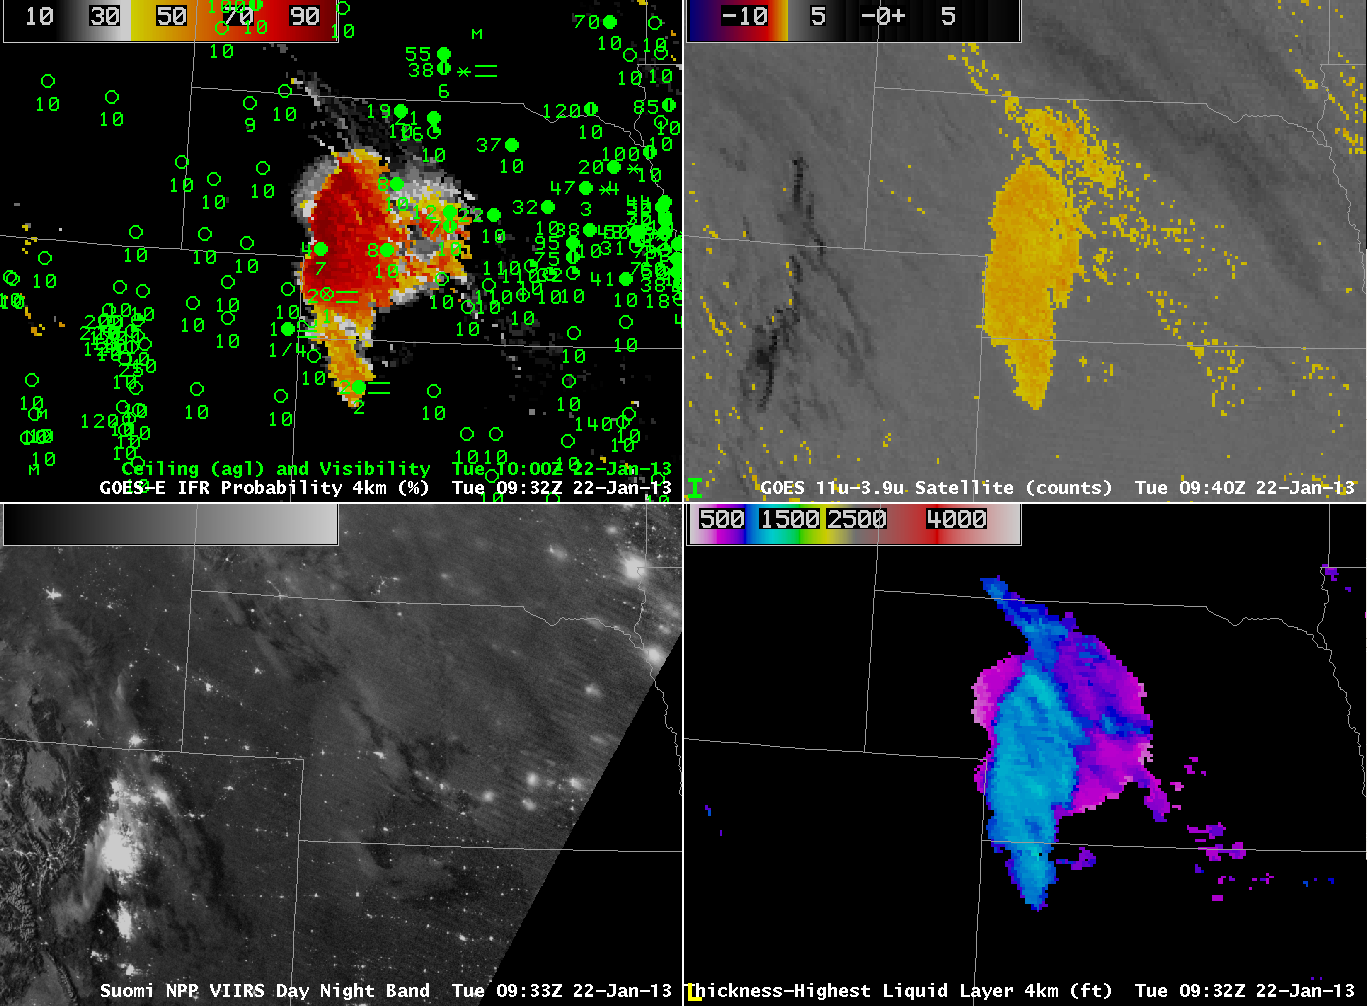
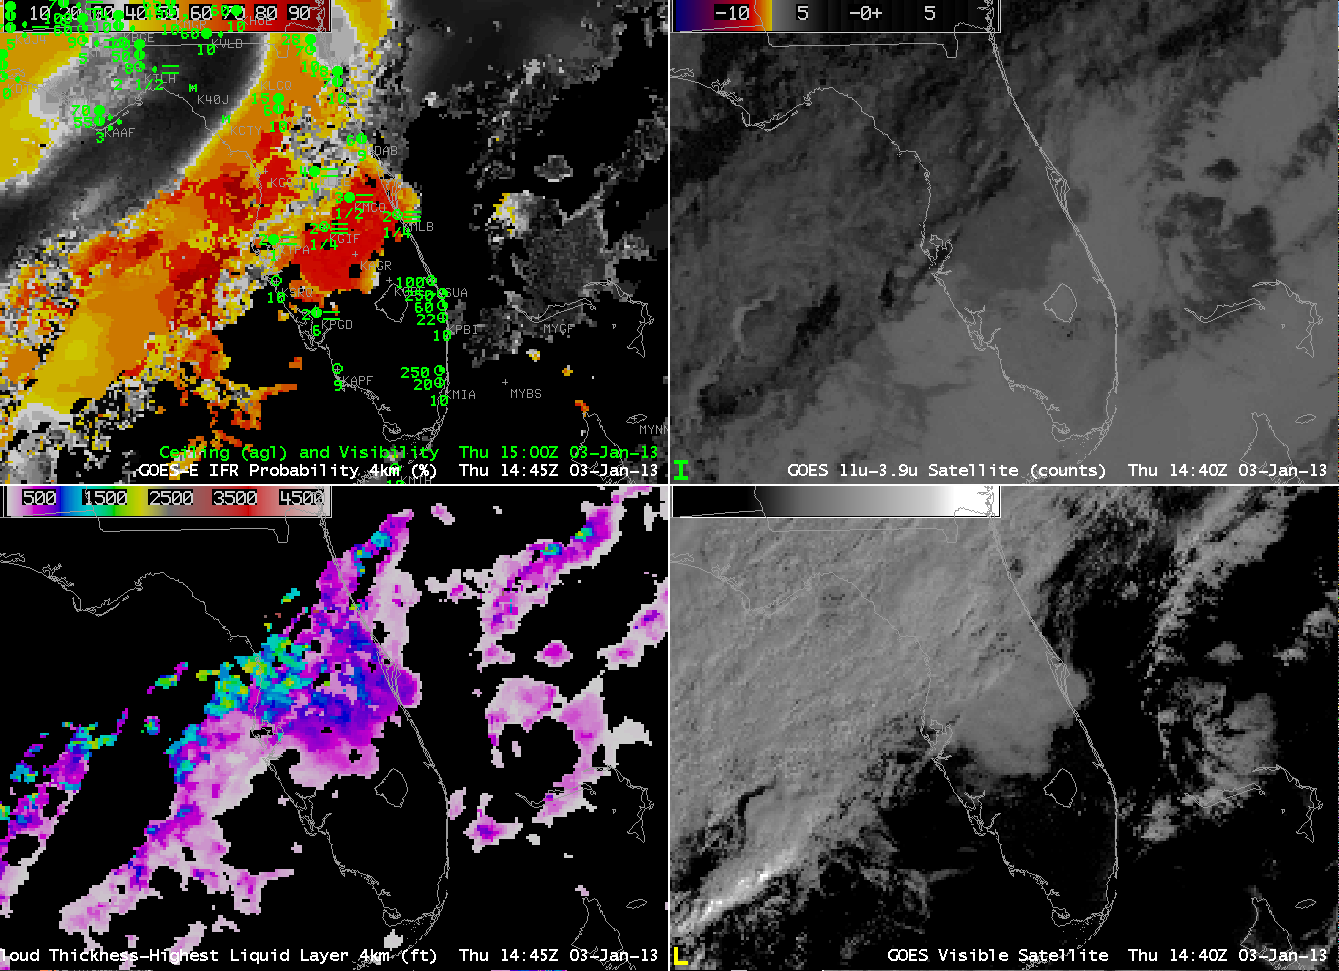
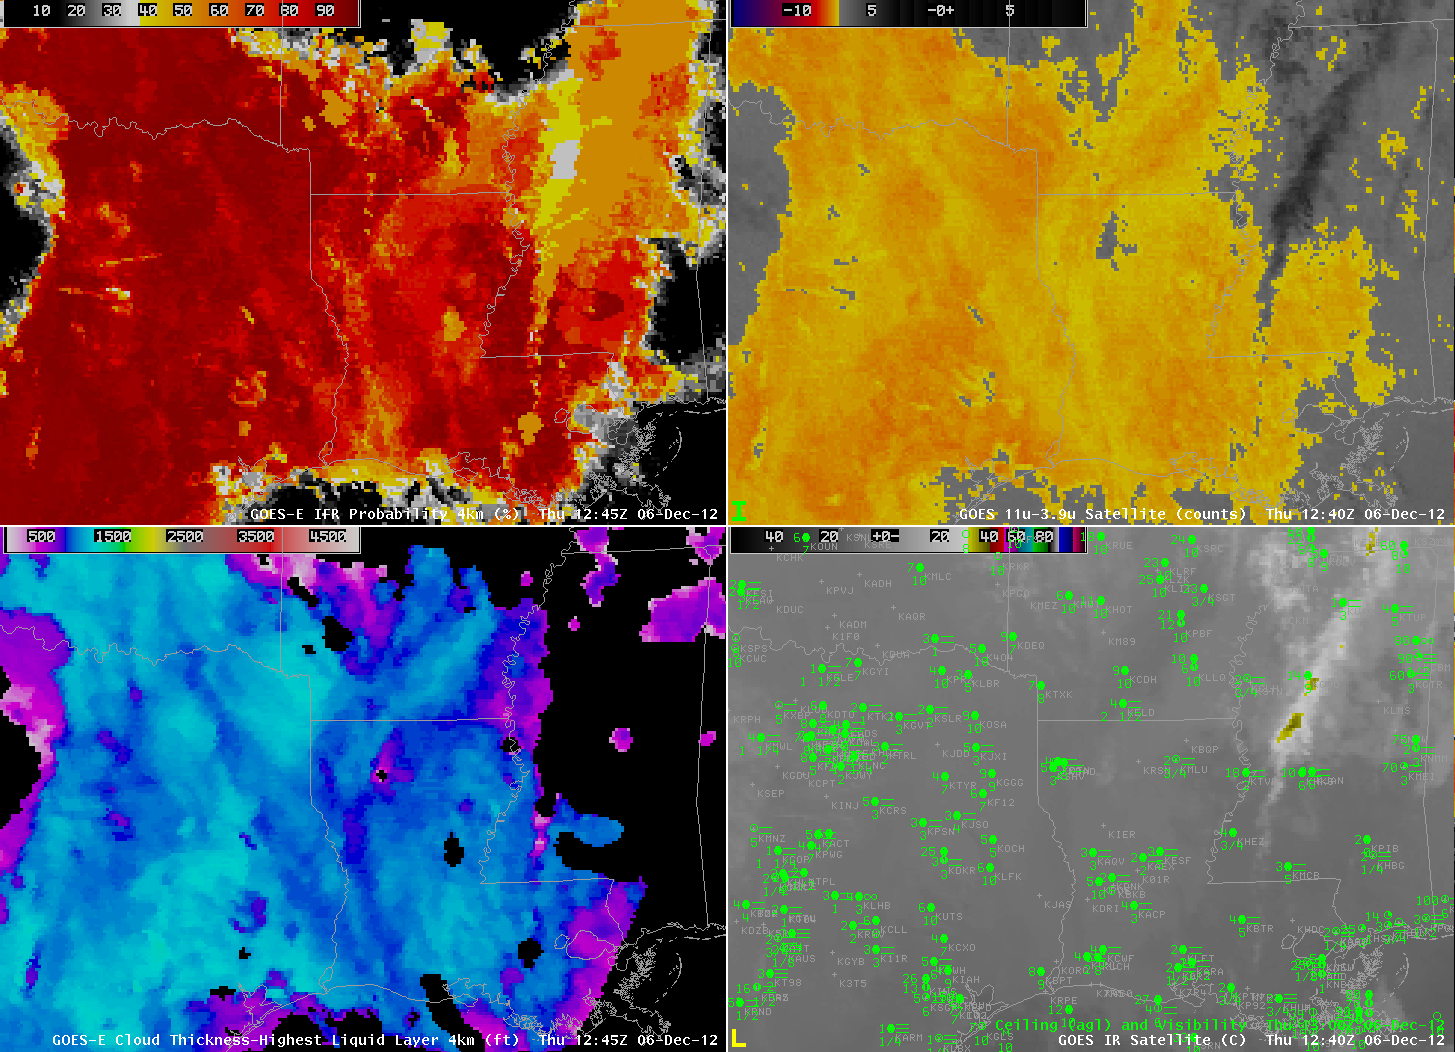
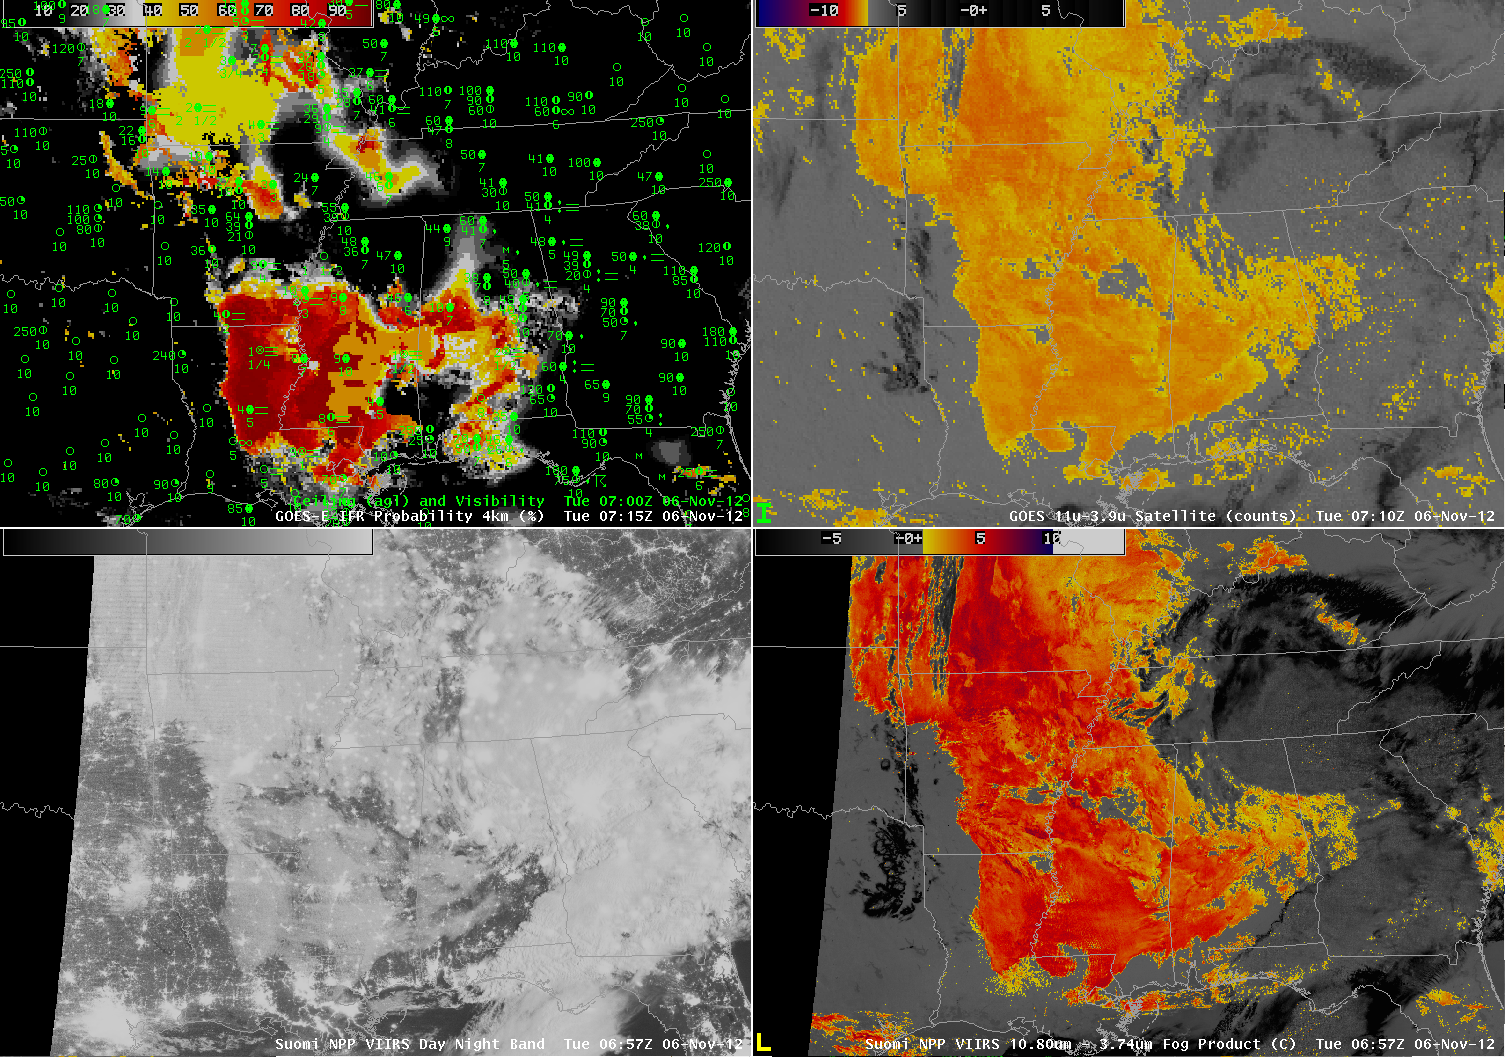
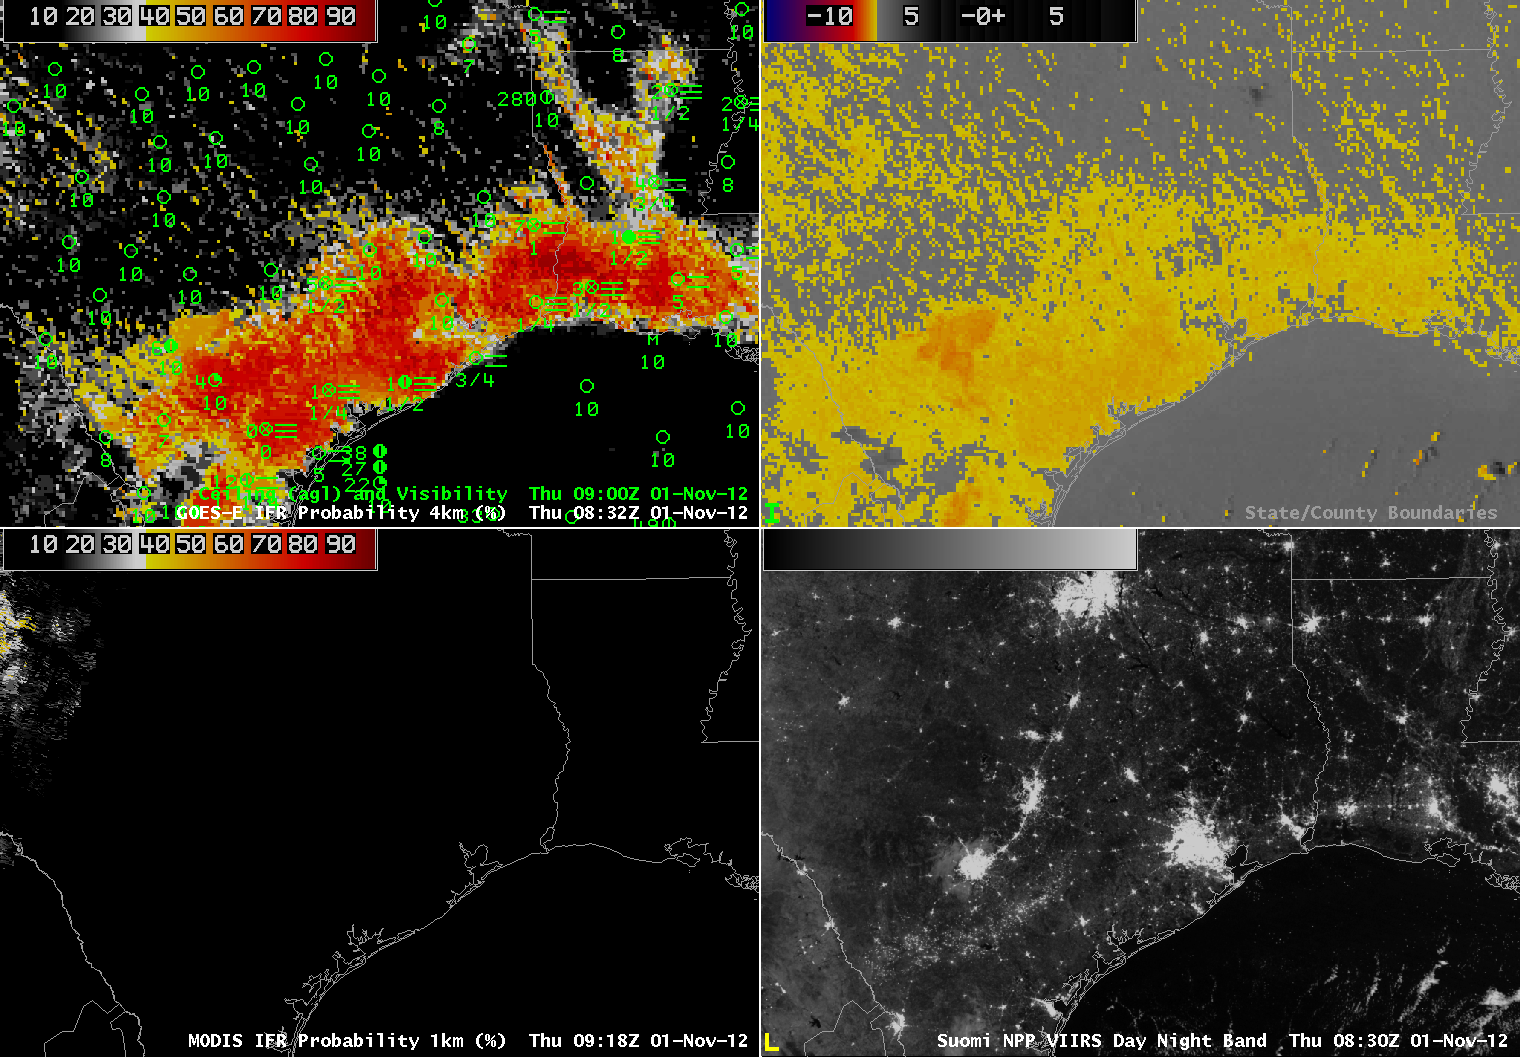
As above, but at ~0715 UTC

 At 0715 UTC, IFR probabilities are increasing over southeast Texas between Houston and San Antonio.  Suomi/NPP Day/Night band imagery at that time shows evidence of clouds in the region of highest IFR probabilities.  The traditional brightness temperature difference product continues to highlight a region near the Rio Grande Valley.

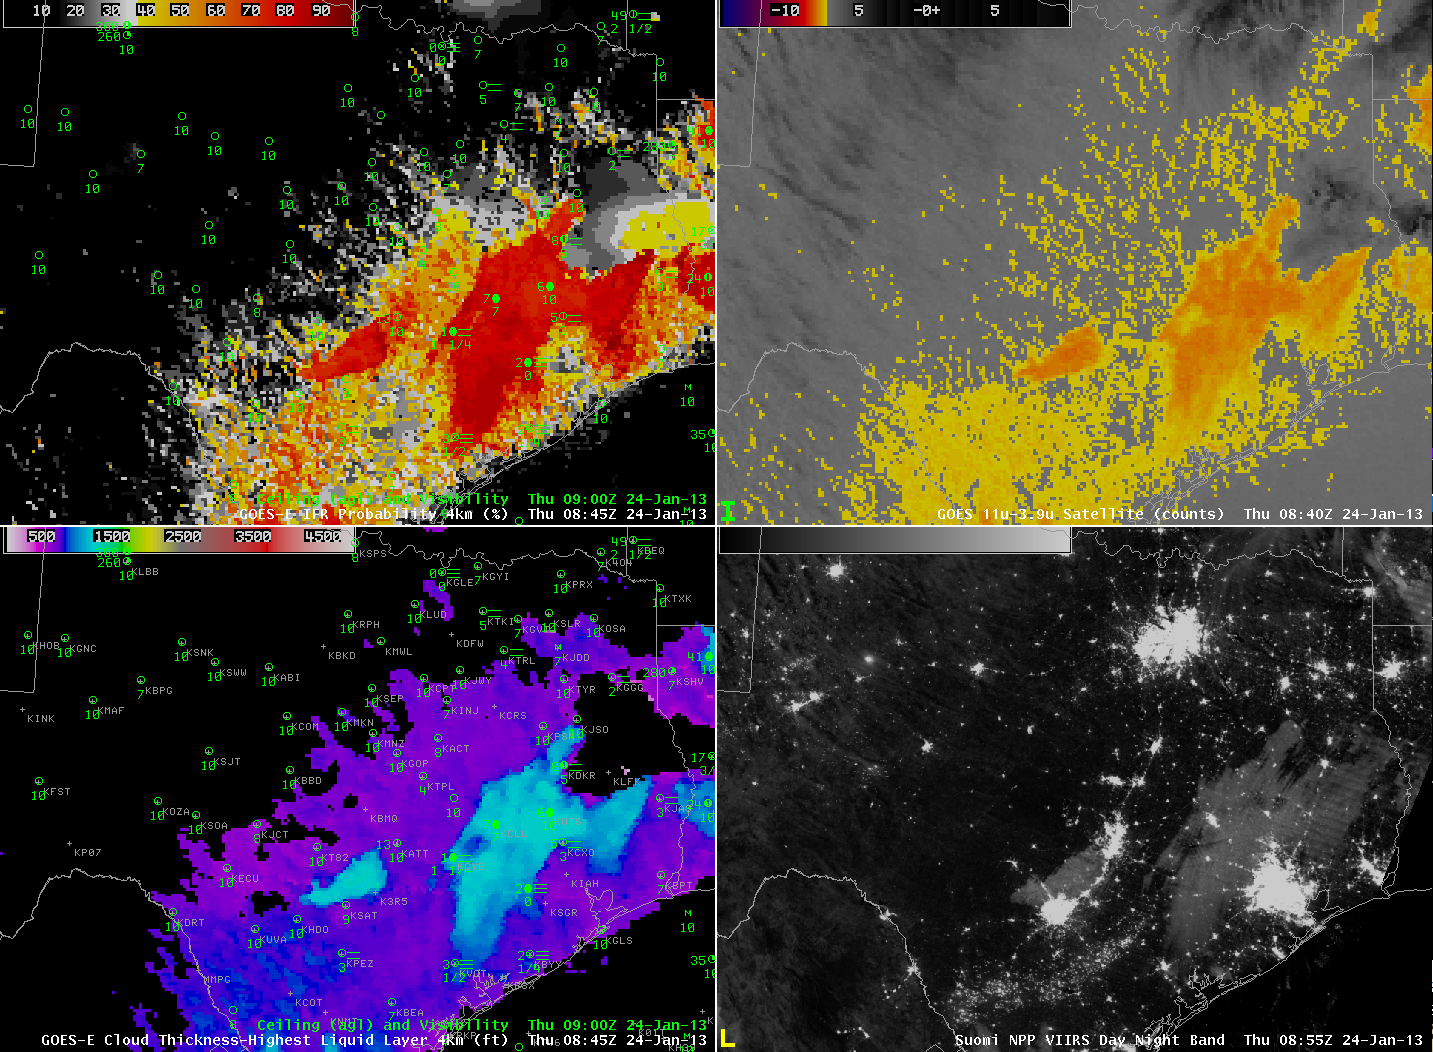
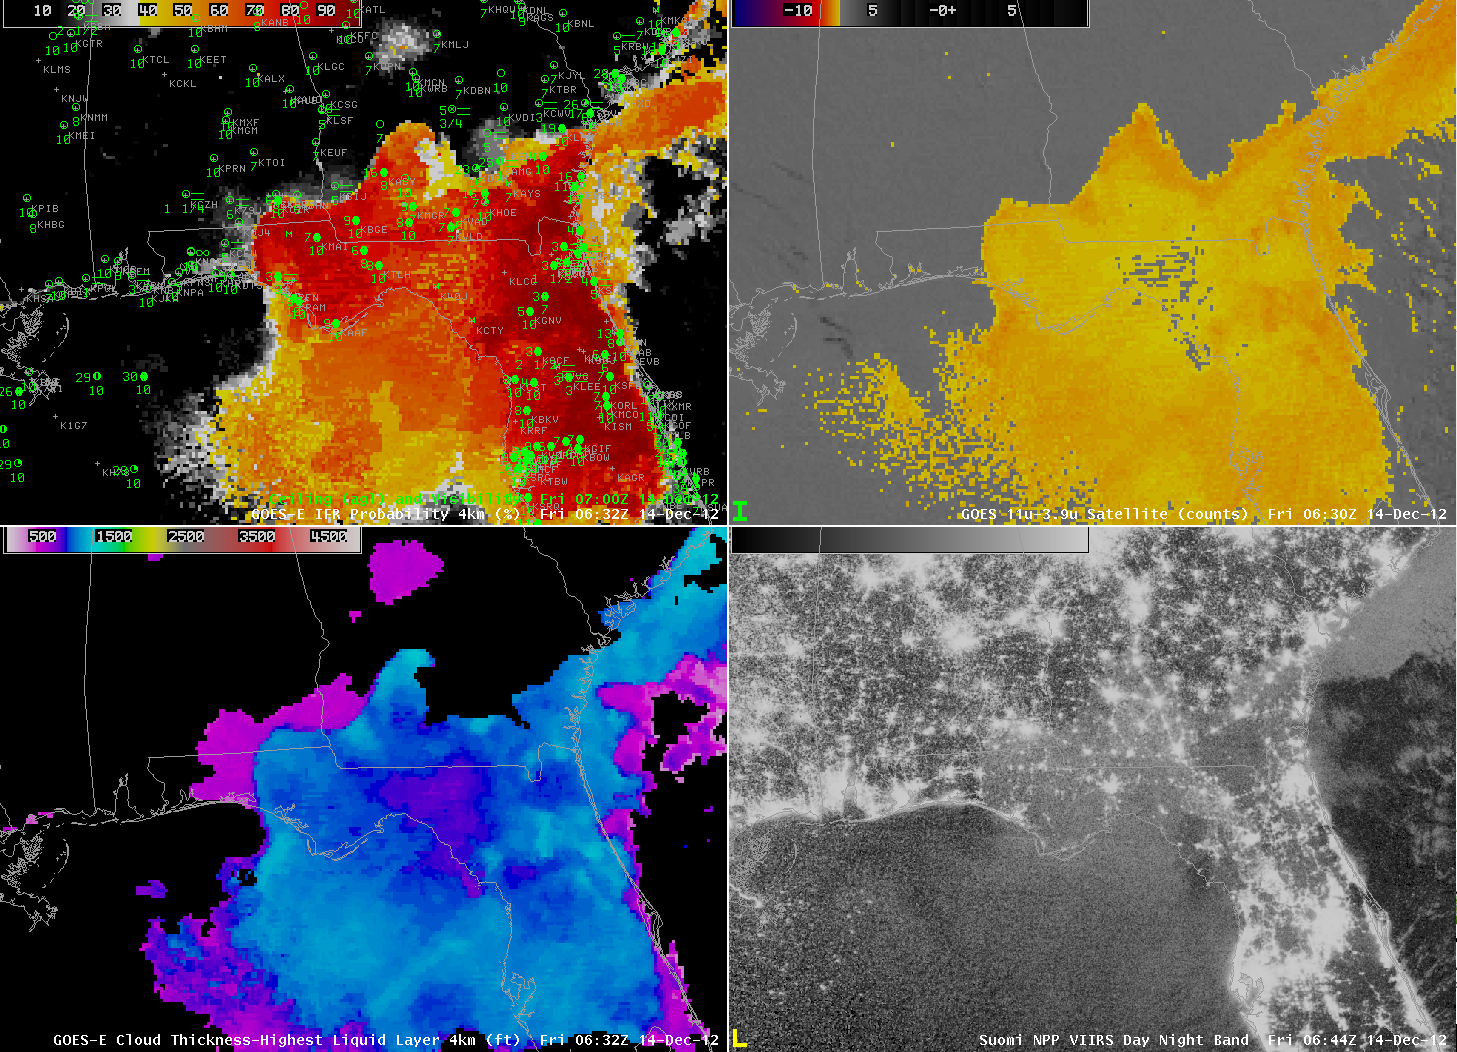
As above, but at ~0845 UTC

At 0845 UTC, IFR probabilities continue to increase over southeast Texas in the region surrounding Houston and a region near San Antonio.  The Day/Night band detects the cloudiness present in those regions.  High clouds persist over northeast Texas.

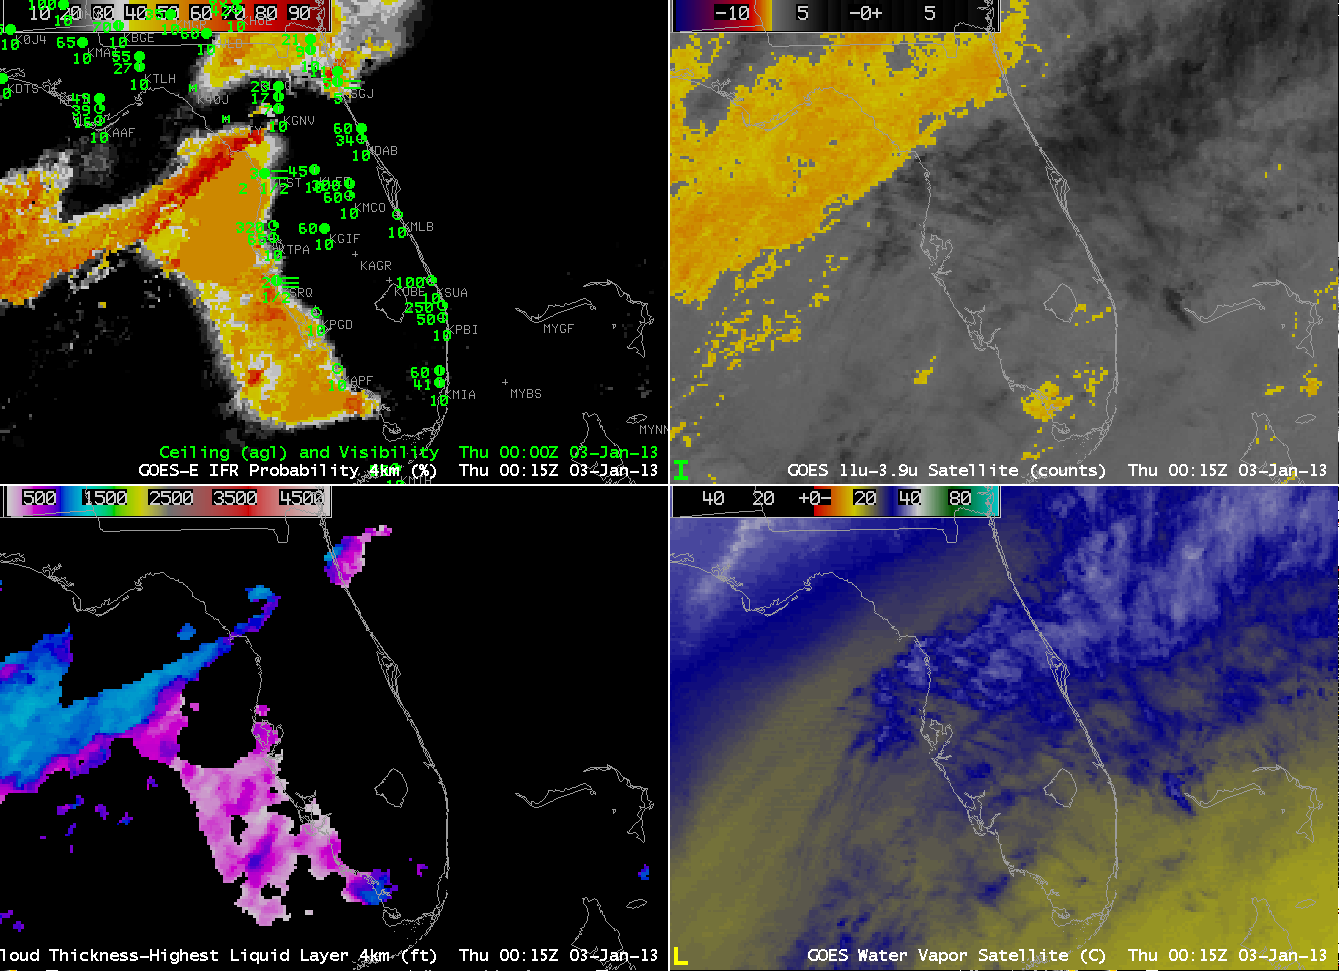
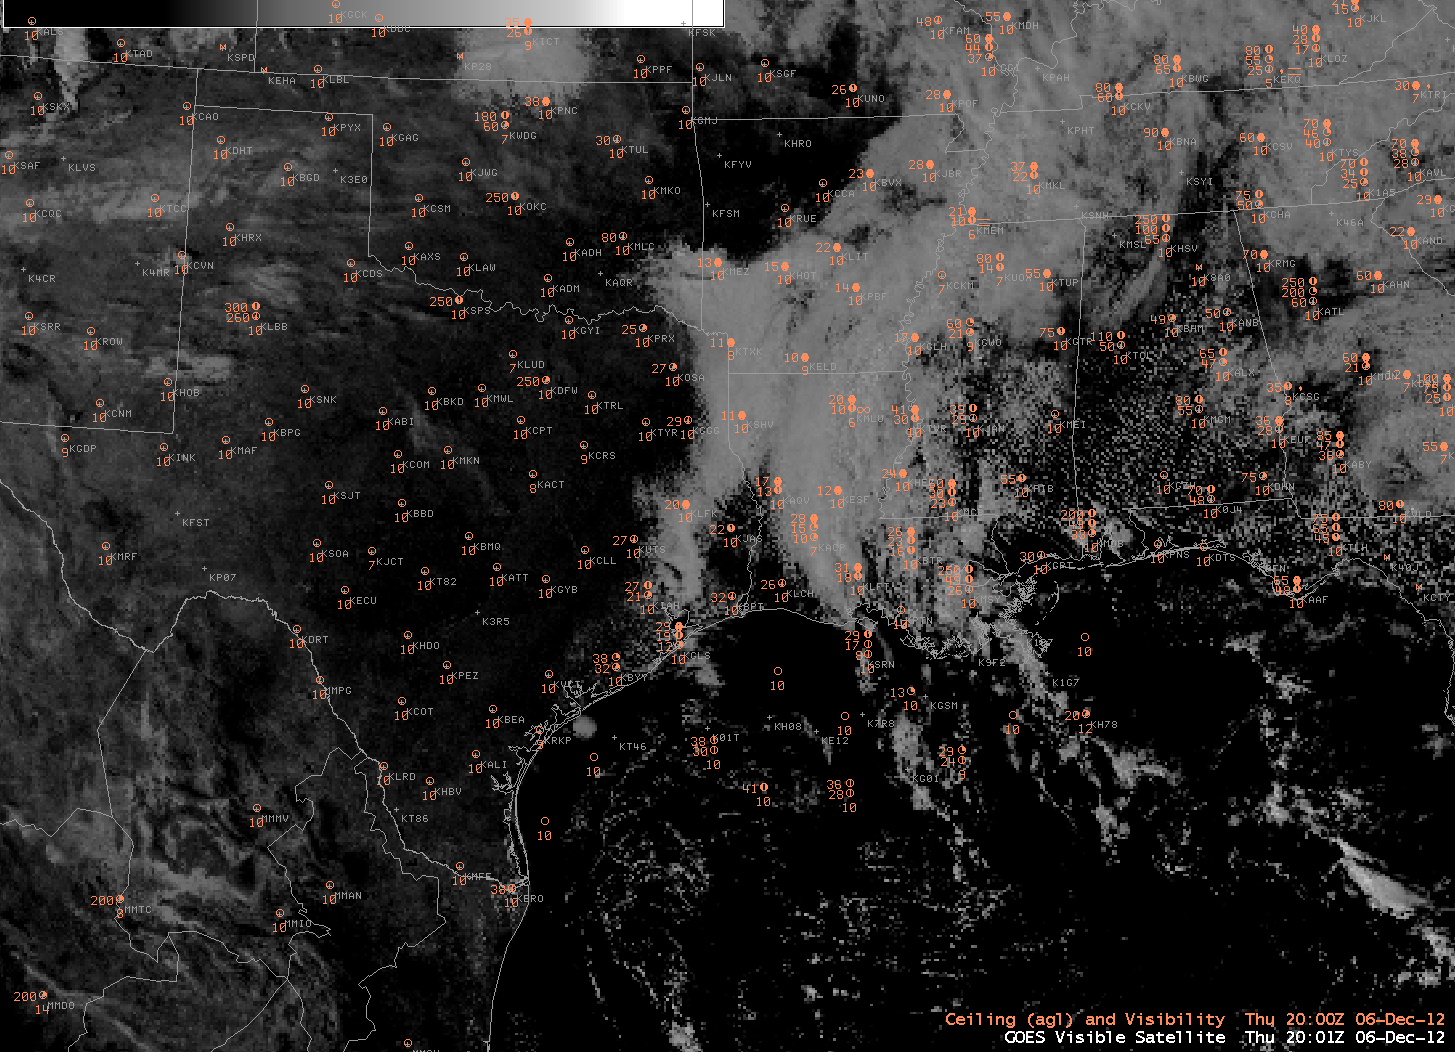
As above, but at 1315 UTC

Shortly before sunrise, fog is widespread over southeast Texas.  IFR probabilities are highest where both model and satellite predictors can be used.  Over northeast Texas, where cirrus clouds are present and where the brightness temperature difference product can therefore not provide guidance, the Rapid Refresh data are suggesting that fog is present (as observed), but IFR probabilities are lower because the satellite predictor is not used.

Fog/Low Stratus over the High Plains

Surface Weather Maps, 0300, 0600 and 0900 UTC on 22 January

High Pressure with origins in the Arctic has pushed cold air into the central United States.  The western edge of the cold dome shows as a stationary front that stretches from central Kansas northwestward into Montana and beyond.  During the early morning hours of 22 January, a small region of IFR conditions developed over western Nebraska.  How did the GOES-R Fog products do in describing this region?

GOES-R IFR Probabilities and surface plots of ceilings/visibilities (Upper Left), GOES-East Brightness Temperature Difference (Upper Right), Suomi/NPP Day/Night Band (Lower Left), GOES-R Cloud Thickness (Lower Right) for various times from 0102 through 1102 UTC 22 January 2013

The animation above shows increasing IFR probabilities over southwest and west-central Nebraska over the course of the night in a region where IFR conditions are developing.  Note how the IFR probabilities are not enhanced in regions where the traditional brightness temperature difference product does have a signal — over eastern Nebraska and northeastern Kansas.  In these regions, the Rapid Refresh Model fields likely include no saturation in the lowest model layers.  Suomi/NPP Night-time Visible imagery, below, at 0752 UTC and at 0933 UTC also show the extent of the fog and low stratus.   However, it’s impossible to tell from the satellite where the visibility obstructions are most likely — that’s why the model data are important in this fused product.  Note the distinct change in illumination between 0752 UTC and 0930 UTC.  The Waxing Gibbous moon set around 0900 UTC.

As above, but for 0745 – 0800 UTC on 22 January 2013

As above, but for 0930 UTC on 22 January 2013

Evolution of Fog/Low Stratus over Florida

GOES-R IFR Probabilities (Upper Left), GOES-East Brightness Temperature Difference (10.7 µm – 3.9 µm) (Upper Right), GOES-R Cloud Thickness (Lower Left), GOES-East 6.5 µm imagery (Lower Right), from ~0000 UTC on 3 January 2013

GOES-R IFR Probabilities captured the evolution of IFR (and Low IFR) conditions over and around the Florida peninsula from late on 2 January through morning on 3 January 2013.  Advection fog over the chilly coastal waters of the eastern Gulf of Mexico stayed mainly offshore (although Sarasota at 00 UTC reports IFR conditions) and is captured well by the GOES-R product.  This is a region underneath high cirrus and as such, the traditional brightness temperature product is blind to the existence of low clouds there.

Over the course of the night, fog and low stratus developed over land, and the GOES-R IFR probability product captured that evolution as well (below, hourly imagery).  Again, there are regions where the brightness temperature difference product is not useable because of multiple cloud layers, and the Rapid Refresh Model output is controlling the IFR Probabilities — these are regions where the IFR probability field is very smooth and typically exhibits lower probability values even though IFR conditions may be observed (For example, at Gainesville and Jacksonville at 0600 UTC).  By morning, visibilities were under 1/4 mile over much of the central Florida Peninsula (For example, Orlando).

As above, but hourly imagery from 0000 UTC through 1400 UTC on 3 January 2013.

The 3/4-full moon allows for plenty of illumination for the Day/Night band on VIIRS, which is flying on Suomi/NPP.  The 0700 UTC imagery, below, demonstrates the difficulty of using the DNB at night to detect fog — city lights that shine through low clouds.  Fog is detected in rural regions, but where city lights exist, the signal is difficult to extract.

GOES-R IFR Probabilities (Upper Left), GOES-East Brightness Temperature Difference (10.7 µm – 3.9 µm) (Upper Right), GOES-R Cloud Thickness (Lower Left), Suomi/NPP VIIRS Day/Night Band 0.7 µm imagery (Lower Right), from ~0700 UTC on 3 January 2013

The visible imagery at 1500 UTC, below, shows the horizontal extent of the stratus deck through central Florida.  The region matches well with the IFR Probabilities because visible imagery during the day is used as a cloud-clearing mechanism in the GOES-R algorithms.  Note also how the reflected 3.9 µm solar radiation during the day renders the brightness temperature difference product ineffectual.

GOES-R IFR Probabilities (Upper Left), GOES-East Brightness Temperature Difference (10.7 µm – 3.9 µm) (Upper Right), GOES-R Cloud Thickness (Lower Left), GOES-East visible (0.63 µm) imagery (Lower Right), from ~1500 UTC on 3 January 2013

Florida Radiation Fog

GOES-R IFR Probabilities (Upper Left) computed from GOES-East, GOES-East Brightness Temperature Differences (10.7 µm – 3.9 µm) (Upper right), GOES-R Cloud Thickness product (Lower Left), GOES-East Visible Imagery (0.63 µm) (Lower Right), hourly from 0615 UTC through 1215 UTC on 14 December 2012

Light north winds over Florida over night were accompanied by the development of low stratus and fog that were captured well by the traditional fog detection product, the brightness temperature difference between 10.7 µm and 3.9 µm that occurs because of emissivity differences in water clouds at the two wavelengths.  Because of the strong satellite signal (upper right), the GOES-R IFR Probabilities over Florida were quite high.  When mid-level and high clouds are absent, IFR probabilities in regions of fog development can easily exceed 90%, as shown above.

Note, however, what happens at sunrise.  The increase in reflected 3.9 µm solar radiation causes the brightness temperature signal to vanish.  (At later times, the sign of the brightness temperature difference will flip).  The GOES-R IFR probability product maintains a coherent signal through sunrise, although values shift somewhat, as can be seen by the southwest to northeast boundary in the final image of the loop over Florida and extreme southeast Georgia.

Cloud thickness, bottom left, can be used to estimate when radiation-induced stratus or fog will ‘burn off’ — thicker clouds will take longer to dissipate.

Note in this loop that the eastern coastline of Mobile Bay shows a signal in the Brightness Temperature Difference.  This signal is likely an artifact of poor co-registration between Bands 2 and 4 (the 3.9 µm and 10.7 µm channels, respectively) on GOES-13.  NESDIS scientists and engineers are working to mitigate this time-dependent error.

The Fog/Low Stratus products can be compared to data from Suomi/NPP.  The VIIRS instrument includes a day/night band that uses reflected moonlight as a light source (below).  Unfortunately, because the moon was new on December 13th, 2012, very little reflected light is available.  Nevertheless, smearing of city lights over Florida does suggest the presence of fog.

As above, but with Day/Night band from VIIRS on Suomi/NPP instead of GOES-13 0.63 µm visible imagery.  Images from ~0630 UTC on 14 December.

The impact of higher clouds

GOES-R IFR Probabilities computed from GOES-East (Upper Left), GOES-East Brightness Temperature Difference (10.7 µm – 3.9 µm) (Upper Right), GOES-R Cloud Thickness (Lower Left), GOES-East 10.7 µm Imagery (Lower Right) at 0700 UTC on 6 December 2012.

Upper-level clouds, such as those apparent in both the 10.7 µm imagery and the brightness temperature difference imagery, above, lower right and upper right, respectively, have an impact on the GOES-R IFR Probability and GOES-R Cloud Thickness products.  The most obvious impact is in the Cloud Thickness product (lower left), which product is not computed in regions where high clouds are present.  The GOES-R IFR Probabilities are computed underneath high clouds, using mostly Rapid Refresh model data to determine the probability of fog and low stratus.  However, because cloud predictors are not used, IFR probabilities are somewhat lower.  In addition, the character of the field is flatter, reflecting the smoother fields that are present in the model.  This is especially obvious over northeast Louisiana and extreme east Texas in the IFR Probability image above.  Thus, the heritage product, the brightness temperature difference, gives no information from southwest Louisiana northward into southern Arkansas, but the fused GOES-R IFR Probabilities do suggest enhanced possibilities of IFR conditions in regions where reduced visibilities are reported:  central and northeast Louisiana and east Texas.  IFR Probabilities are much lower over southwest Louisiana where IFR conditions are not reported.

As above, but for 1245 UTC on 6 December 2012.

By 1245 UTC, the high clouds have lifted northeast and dissipated somewhat, so the heritage brightness temperature difference product gives information over the entire lower Mississippi River valley and over east Texas, where IFR conditions were widespread underneath very high GOES-R IFR Probabilities.  The GOES-R Cloud Thickness product indicates cloud thicknesses up to near 1200 feet, suggesting a burn-off time for radiation fog of around 5 hours.

Day/Night Band (from Suomi/NPP) imagery over Louisiana and East Texas, 0733 UTC on 6 December 2012. 

 The Day/Night band image derived from data from Suomi/NPP from 0733 UTC on 6 December, above, shows the higher and lower clouds over Texas and Louisiana.  The clouds between Houston and Dallas/Ft. Worth are low clouds, but the high clouds over Louisiana inhibit the detection of low clouds.  In addition, although the Day/Night band can give a good outline of where the clouds are, it does not show where the visibility restrictions consistent with IFR conditions are.

Visible Imagery from 2000 UTC

Visible imagery from 2000 UTC, above, shows that, although the fog has lifted, it has not burned off in 5 hours as predicted by the thickness/burn-off time relationship (here).  This may be related to the very low sun angle in December.

(Added:  This image loop shows how thin cirrus can show up in the brightness temperature difference product at night (this example is from Suomi/NPP even when fog-bound valleys are plainly evident in the Day/Night band at the same time!)

Fog over the lower Mississippi River Valley

GOES-East IFR Probabilities (upper left), GOES-East Traditional Brightness Temperature Difference (10.7 µm – 3.9 µm) (upper left), VIIRS Day/Night Band from Suomi/NPP (lower left), VIIRS Brightness Temperature Difference (10.80 µm – 3.74 µm) from Suomi/NPP (lower right) at 0315 UTC on 6 November 2012

IFR Conditions developed over the deep south overnight on the 5th/6th of November.  How did the GOES-R IFR Probabilities capture this event, and how do the fields compare to the traditional brightness temperature difference fields?  At 0315 UTC, near-IFR conditions have developed over central Mississippi and over southwest Missouri, the two regions where IFR probabilities are diagnosed to be highest.  Rapid Refresh Model data are appropriately de-emphasizing the satellite signal in regions where IFR conditions are not reported (northeast Arkansas, for example).

Four hours later (below), at 0715 UTC, the area of IFR conditions over Mississippi has expanded somewhat, and the IFR Probability field continues to suggest — strongly — that IFR conditions are present.  Both the traditional brightness temperature difference field and the IFR probability field suggest a sharp western edge to the fog/low stratus over north-central Louisiana, and that sharp edge is confirmed in the Day/Night band from VIIRS on Suomi/NPP.  The Brightness Temperature Difference fields from both GOES and from VIIRS suggest one large field of fog, but the IFR probability field has two separate fields:  one over Mississippi/extreme southern Arkansas and Louisiana, and one over southern Missouri.

GOES-East IFR Probabilities (upper left), GOES-East Traditional Brightness Temperature Difference (10.7 µm – 3.9 µm) (upper left), VIIRS Day/Night Band from Suomi/NPP (lower left), VIIRS Brightness Temperature Difference (10.80 µm – 3.74 µm) from Suomi/NPP (lower right) at approximately 0715 UTC on 6 November 2012

IFR Conditions under Cirrus in Florida

GOES-R IFR Probabilities from GOES-East (Upper Right), GOES-East traditional ‘fog product’ (Brightness Temperature Difference 10.7 µm – 3.9 µm), GOES-R Cloud Thickness, GOES-East Water Vapor (6.5 µm) imagery

Fog developed over central Florida overnight underneath a thin cirrus (as indicated by both the water vapor and brightness temperature difference imagery).  Cirrus clouds prevent the traditional brightness temperature difference field from identifying low fog/stratus because the high ice clouds are detected rather than the developing low-level water clouds.  This is a case, then, when a fused product gives needed surface information to help diagnose the development of fog and low stratus.  The brightness temperature difference product, the traditional method to detect fog and low stratus, is giving no information where dense fog is forming.

On this date, the development and expansion of the higher IFR probabilities over central Florida neatly matches the development of IFR conditions at the observing stations.  Probabilities are not high because the satellite predictors are not contributing to the algorithm.  It is important when interpreting the IFR probabilities to be aware of the presence of high clouds that will influence IFR probability values.  Where the cirrus clouds are not present, notably over northeast Florida, IFR probabilities are much higher because satellite predictors there are contributing to the final probability.

This case also shows that the Cloud Thickness is only computed where the highest clouds detected is a water-based cloud.  Underneath the cirrus shield, except for a few regions where there are apparently holes, cloud thickness is not computed.

GOES-R IFR Probabilities and Day/Night Band from VIIRS on Suomi/NPP, 0715 UTC 5 Nov

The toggle above flips between the Day-Night band from VIIRS on Suomi/NPP and the GOES-R IFR probability at the same time.  The thin cirrus shield is readily apparent, and the regions of fog are also visible in the Day/Night band over north-central Florida and over coastal South Carolina.

A MODIS-based IFR Probability (shown below) was also created at 0715 UTC, and it shows a pattern similar to that above.  The pixelated part of the image corresponds to where satellite data are being used.  The region with lower values, and a flatter field, was created using only model predictors and, as noted above, is characterized by lower probabilities.  The highest probabilities are in regions where both satellite and model predictors are very confident that IFR conditions are present.

MODIS-based GOES-R IFR Probabilities, Monday 5 Nov 2012, 0714 UTC

Fog on Texas and Louisiana Gulf Coasts

Fog was anticipated to develop over the coastal sections of Texas and Louisiana starting late on Oct 31 2012.  From the 0149 UTC 1 November Houston Forecast Discussion:    The 0921 UTC Forecast Discussion from Lake Charles (above) describes increasing fog possibilities — and the 0453 UTC AFD (below) mentions patchy fog.

For both WFOs, the GOES-R IFR Probability field shows a good picture of the evolving fog/low stratus as it develops.

000
FXUS64 KHGX 010149
AFDHGX

AREA FORECAST DISCUSSION
NATIONAL WEATHER SERVICE HOUSTON/GALVESTON TX
849 PM CDT WED OCT 31 2012

.DISCUSSION...
CURRENT FCST IS ON TRACK. ONLY TWEAKS TO GRIDS WERE TO MOVE UP
TIMING OF FOG FORMATION. WOULDN`T DOUBT IF A DENSE FOG ADVSY
MIGHT BE REQUIRED FOR SOME LOCATIONS...ESP SW. WILL KEEP AN EYE ON
TRENDS. DIFFUSE WIND SHIFT AND SLIGHTLY LOWER DEWPOINTS WILL
PROBABLY MOVE INTO NE ZONES LATER TONIGHT THEN STALL/WASHOUT.


000
FXUS64 KLCH 010921
AFDLCH

AREA FORECAST DISCUSSION
NATIONAL WEATHER SERVICE LAKE CHARLES LA
421 AM CDT THU NOV 1 2012

.DISCUSSION...TRAPPED LOW LEVEL MOISTURE AND CLEAR SKIES HAVE
ALLOWED AREAS OF FOG TO DEVELOP THIS MORNING ACROSS THE CWA. AT THIS
TIME PATCHY DENSE FOG HAS ALSO DEVELOPED IN CALCASIEU PARISH AND
JEFFERSON COUNTY. VISIBILITIES ARE SLOWLY DROPPING ELSEWHERE AND
IF CONDITIONS CONTINUE TO DETERIORATE A DENSE FOG ADV MAY BE NEEDED
THIS MORNING. 


The 0921 UTC Forecast Discussion from Lake Charles (above) describes increasing fog possibilities — and the 0453 UTC AFD (below) mentions patchy fog.


000
FXUS64 KLCH 010453
AFDLCH

AREA FORECAST DISCUSSION
NATIONAL WEATHER SERVICE LAKE CHARLES LA
1153 PM CDT WED OCT 31 2012

.DISCUSSION...
01/06Z TAF ISSUANCE.

&&

.AVIATION...
FEW CHANGES TO THE TAFS THIS EVENING WITH WINDS NEARLY CALM ACRS
THE AREA. T/TD SPREAD NARROWING AT BPT AND LCH AND COULD SEE SOME
PATCHY FOG DEVELOP AT THESE SITES WITHIN THE NEXT HOUR OR TWO.
CANNOT RULE OUT FOG AT OTHER TAF SITES...BUT EXPECT ONSET A LITTLE
LATER AS DEWPOINT DEPRESSIONS ARE SLIGHTLY LARGER. VFR CONDITIONS
EXPECTED TO PREVAIL WITH THE EXCEPTION OF PERIODIC MVFR OR BRIEF
IFR VISBYS BETWEEN NOW AND 14Z. LT WINDS WILL GRADUALLY BECOME
SWLY THURS AFTN. 24 

For both WFOs, the GOES-R IFR Probability field shows a good picture of the evolving fog/low stratus as it develops.  The every-hour loop below, starting at 0315 UTC, shows the steady increase in probabilities along the Louisiana and Texas Gulf Coasts.  Note the relatively low probabilities in and around Houston — an apparent break between IFR conditions to the north and east and those to the south.  The Houston airport observations did not fall to IFR criteria although those criteria were common to the north and south.  Also, the IFR probabilities downplay the brightness temperature difference signal over central Texas where IFR conditions do not occur.

GOES-R IFR Probabilities computed from GOES-East (upper left), Traditional Brightness temperature Difference product (10.7 µm – 3.9 µm) (upper right), GOES-R IFR Probabilities computed from MODIS (lower left), Suomi/NPP Day/Night Band (lower left)

The imagery below shows GOES-R and MODIS imagery at the same time (immediately below) and GOES-R and Suomi/NPP imagery at the same time (bottom).  Note that the fog that develops is not of sufficient thickness to block views of the city lights.

GOES-R IFR Probabilities computed from GOES-East (upper left), Traditional Brightness temperature Difference product (10.7 µm – 3.9 µm) (upper right), GOES-R IFR Probabilities computed from MODIS (lower left), Suomi/NPP Day/Night Band (lower left)
GOES-R IFR Probabilities computed from GOES-East (upper left), Traditional Brightness temperature Difference product (10.7 µm- 3.9 µm) (upper right), GOES-R IFR Probabilities computed from MODIS (lower left), Suomi/NPP Day/Night Band (lower left)


Stratus vs. Fog in Montana/North Dakota

Suomi/NPP VIIRS Day/Night Band Visible imager (upper left), Traditional Brightness Temperature Difference (10.7 µm – 3.9 µm) image (upper right), GOES-R Cloud thickness algorithm (lower left), GOES-R IFR Probability (lower right)

Both the nighttime visible image from the Suomi/NPP VIIRS instrument (which uses moonlight as an illumination source) and the traditional brightness temperature difference product suggest the presence of water-based clouds over eastern Montana and northwest North Dakota on the morning of 31 October 2012.  However, there are no reports in Montana of IFR conditions.  GOES-R IFR Probabilities overlapping the cloud deck are very low.  It is likely that this cloud feature is elevated stratus, and that saturation is not occuring in the lowest levels of the model.  Fusing both model and satellite data yields a product that can be greater than the sum of the two.  Note, however, the IFR conditions that do exist in Bismarck, where IFR probabilities are very low and satellite information shows no fog signal.  This is likely very small scale river fog in the Missouri River Valley that is both too small to be resolved in the model or detected by the satellite.  In addition, very thin cirrus is interfering with the detection of low-level water clouds in much of central North Dakota.

Marine Stratus in the Mid-Atlantic States

GOES-R IFR Probabilities computed from GOES-East (upper left), GOES-R Cloud Thickness in ft (upper right), Brightness Temperature Difference (10.8 µm – 3.74 µm) computed from Suomi/NPP VIIRS data, Brightness Temperature Difference (10.8 µm– 3.9 µm) computed from GOES East, all valid about 0700 UTC 25 October 2012

Marine Stratus has moved inland over Maryland and surrounding states overnight, and the GOES-R IFR probabilities capture the visibility restrictions that have accompanied it.  The imagery above includes the traditional brightness temperature difference fields computed from Suomi/NPP (horizontal resolution:  1 km at nadir) and from GOES (nominal horizontal resolution:  4 km at nadir).  The distinct leading edge of the marine layer is readily apparent in the Susquehanna River Valley.  Note, however, that the strong returns over the Hudson River Valley do not correlate well with reduced visibilities. The GOES-R IFR probabilities do a good job depicting the marine layer in the Susquehanna River Valley (shown by the relatively high probabilities), but return much lower probabilities over the Hudson River Valley where surface observations indicate hazardous low clouds are not present.  Again, this is a benefit of using a fused product.

GOES-R IFR Probabilities (Upper Left) and Cloud Thickness (Upper Right), Suomi/NPP Day/Night Band (Lower left) and MSAS-derived Dewpoint depression on top of Visible imagery.  Times as indicated

The temporal resolution of GOES-R IFR products allow for continuous monitoring of an evolving situation, making up for the relatively poor horizontal resolution (compared to polar orbiting platforms like Suomi/NPP or Terra/Aqua).  The IFR probability field neatly captured the relentless inland push of the marine stratus air, and as the probabilities increase at locations, IFR conditions become more likely.  The loop above includes a Day/Night band image that is reproduced below.  The day/night band, even in low lunar light cases, can distinguish between clear sky and clouds over ocean.  Over land, however, the interpretation is complicated by city lights shining through clouds.  Nevertheless, the cloudy region can be discerned over parts of eastern Pennsylvania and Maryland, where the light signal is more diffuse.