Category Archives: Alaska

FLS Advecting Northwest Towards the Eastern Aleutians

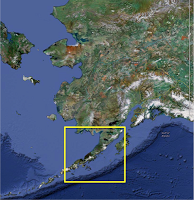
Area of focus in the Eastern Aleutians in Southern Alaska

Due to the location of Alaska, geostationary satellite data can sometimes be difficult to work with. This is because the large satellite angle causes the satellite footprint to increase, thus decreasing the spatial resolution of the data. However, even though the spatial resolution is not ideal the temporal resolution allows geostationary satellite data to remain useful. The example below shows and area of fog/low stratus (FLS) moving northwestward toward the eastern Aleutians in southern Alaska.

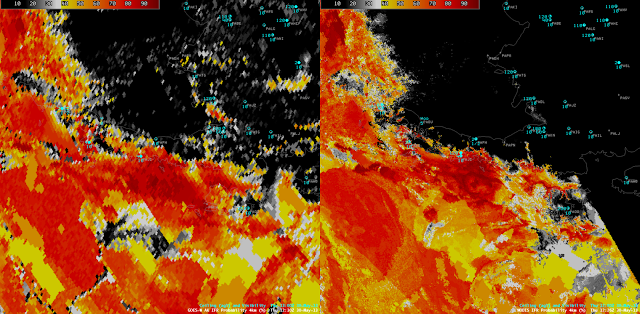
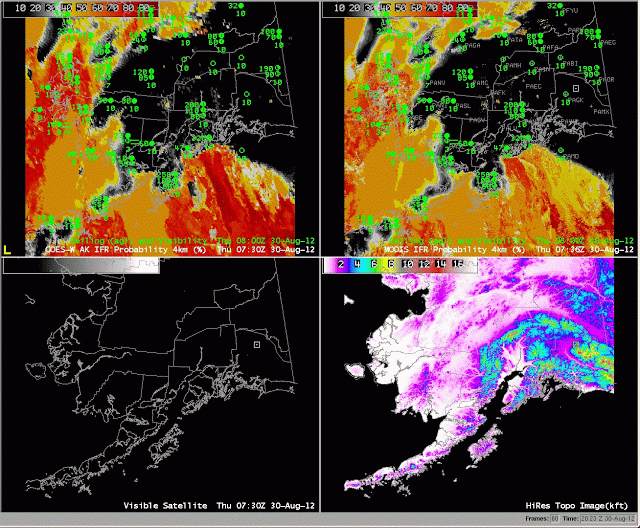
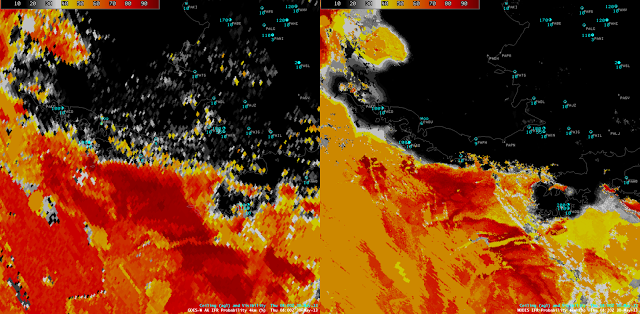
GOES-R IFR probabilities computed using GOES-15 (left) and MODIS (right) around 08:20Z on May 30, 2013. Note that the images are rotated so true north is actually oriented from the lower left corner of the images to the upper right corner.

In the image above the orange and darker red colors indicate areas with a high probability of FLS over the northern Gulf of Alaska. The difference in spatial resolution stands out when comparing the images, however, it should be noted that the same areas of higher probabilities in the MODIS image are also picked up in the GOES image, just at a coarser resolution. Although the MODIS image looks more detailed than GOES, temporal trends can not be discerned from a single image. The next available MODIS pass over the area was at 12:26Z.

GOES-R IFR probabilities computed using GOES-15 (left) and MODIS (right) around 12:26Z on May 30, 2013. Note that the images are rotated so true north is actually oriented from the lower left corner of the images to the upper right corner. 

In the 12:26Z image the FLS deck moved northwest over the eastern Aleutians as indicated by the higher probabilities that are now over the southeastern side of the Aleutians. This is confirmed by the surface station in Chignik, AK, which reported a ceiling of 400 ft at 12:00Z when it reported no ceiling at 08:00Z. Once both MODIS passes were available the NW movement of the FLS could be observed. However, in the 4 hours between the two MODIS passes it would be hard to forecast whether the IFR conditions would move into the area or stay out at sea.

On the other hand, GOES data was available about every 15 minutes. By animating the GOES images such as this, the slow NW movement of the FLS can be tracked and a better approximation of when IFR conditions will reach the Aleutians can be made. IFR conditions were first reported at Chignik, AK at 09:00Z, just as the higher GOES-R IFR probabilities reached the coastline. Also from the animation, it appears that the eastern Aleutians block the movement of the FLS deck from continuing over to the NW side into the Bering Sea. This blocking might be difficult to interpret from the two MODIS images alone.

Alaska has the largest coastline in the U.S. (more than twice the size of the entire lower 48, including Hawaii) where hazardous areas of FLS can move onshore. Although the high spatial resolution available from MODIS provides more detail in a single scene than GOES, the high temporal resolution that GOES offers makes finding trends in the movement of hazardous low clouds possible. This is another example of how looking at the GOES-R FLS products using GOES and MODIS together can be more useful than using only GOES or MODIS.

GOES-produced IFR Probabilities over Alaska

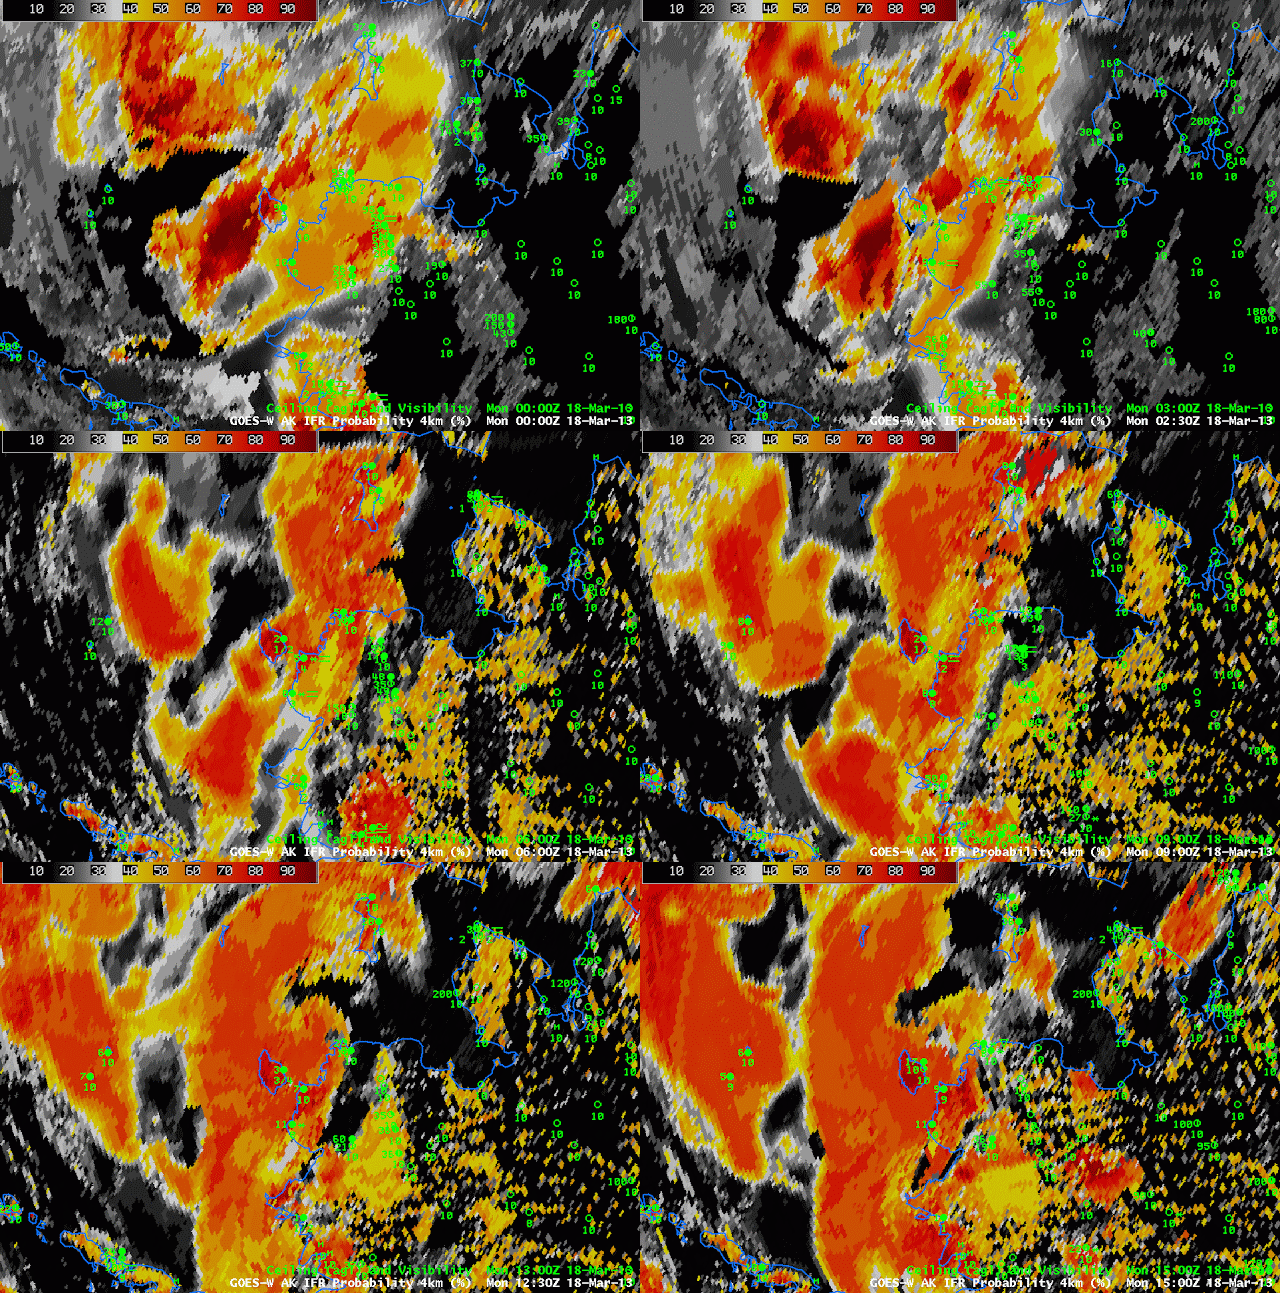
GOES-R IFR Probabilities from GOES-West over Alaska and the Bering Sea, half-hourly from 0000 UTC through 1500 UTC on 18 March 2013

Even though Alaska is at high latitudes, and GOES Imagery there is burdened with degraded resolution, the temporal aspect of the data can give useful information.  As an example, consider the animation of GOES-R IFR probabilities near Bethel Alaska along the west coast of Alaska.  Note that Bethel AK, in the center (nearly) of the image, is reporting MVFR/VFR conditions, with IFR conditions along the coast — at Kipnuk and Toksook — and offshore at Mekoryuk on Nunivak Island as well as St. George and St. Paul Islands.  The fused GOES/Rapid Refresh data is able to delineate correctly the regions with IFR conditions along the coast and offshore from the regions with MVFR/VFR conditions to the east.

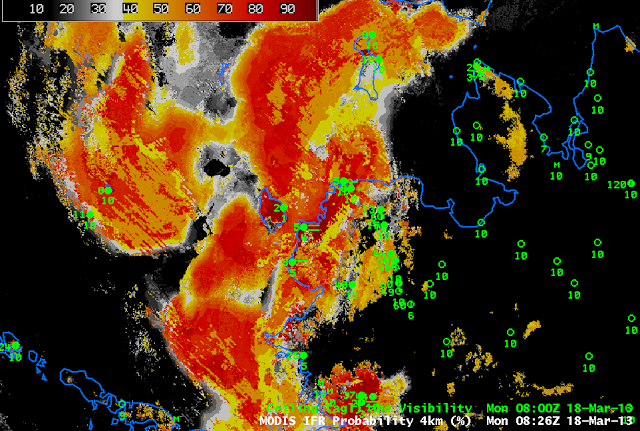
GOES-R IFR Probabilities computed from MODIS data over western Alaska, 0826 UTC 18 March 2013

MODIS data can also give information over Alaska, and the 1-km resolution offers important information.  Bethel sits in the region of relatively low IFR probabilities west of the higher probabilities along the coast.

IFR Conditions over Southwest Alaska

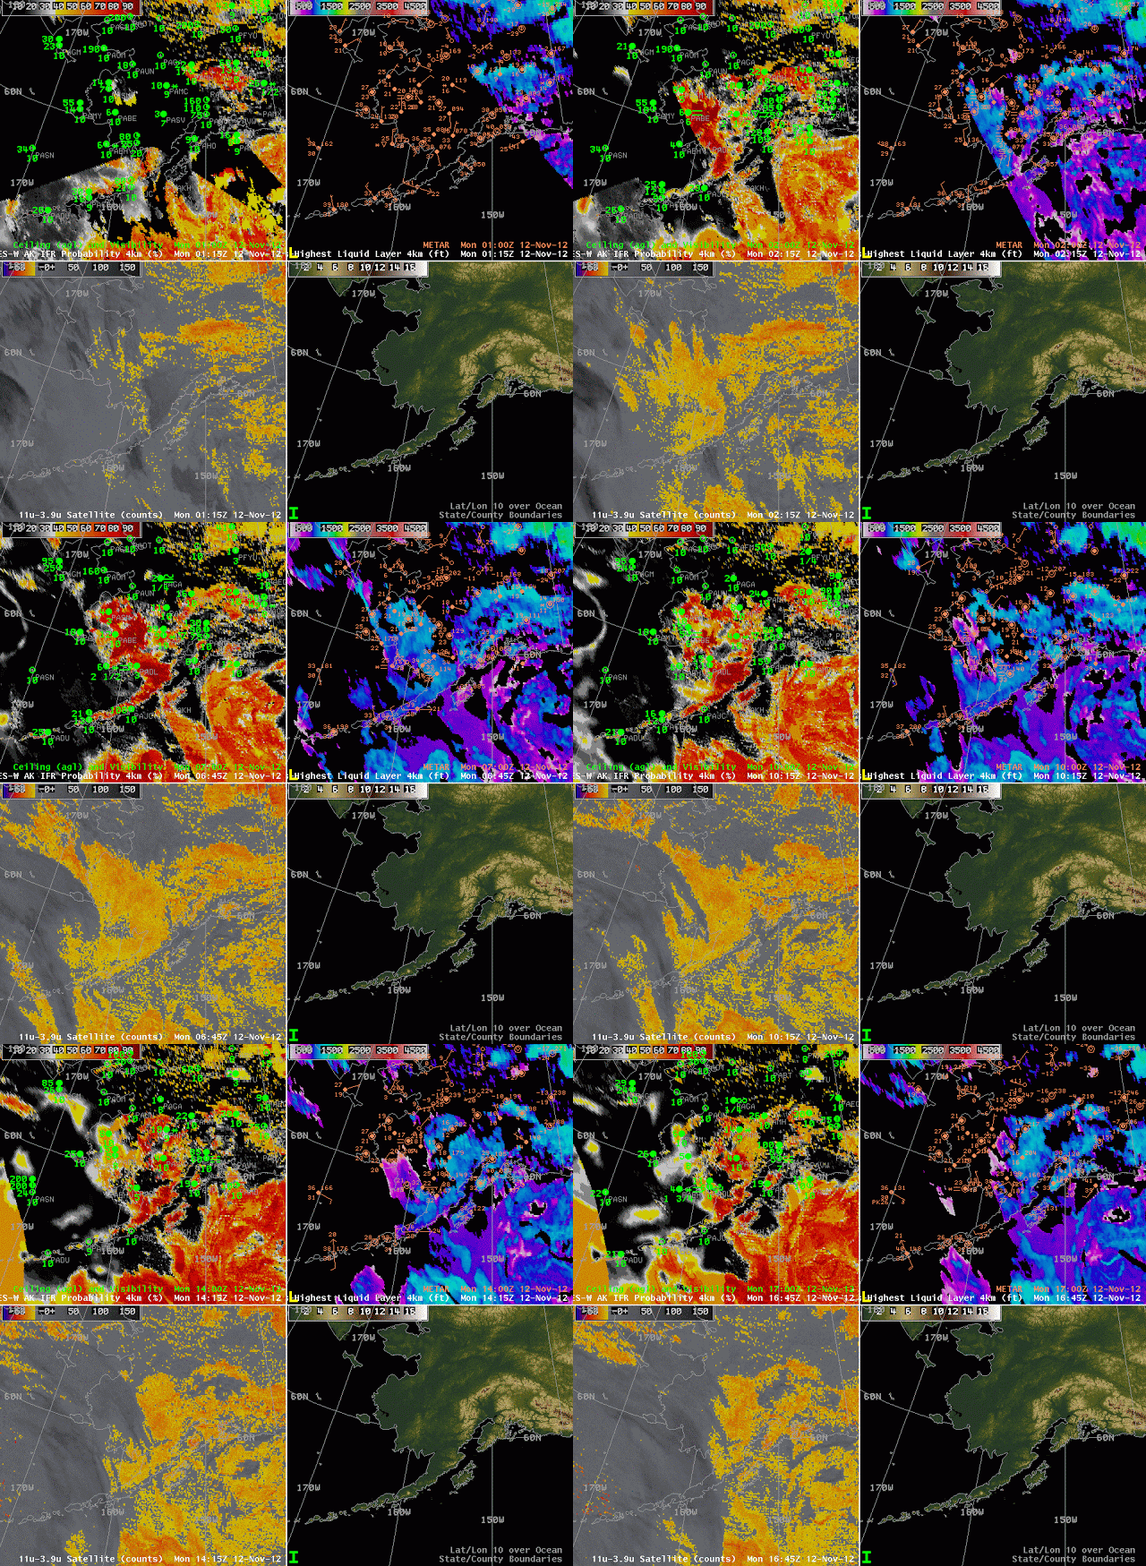
GOES-R IFR Probabilities computed using GOES-West and Rapid Refresh Data (Upper Left), GOES-R Cloud Thickness (Upper Right), GOES-West Brightness Temperature Difference (10.7 µm – 3.9 µm) (Lower Left), Topography over Southwest Alaska (Lower Right).

(Stations discussed below:  Bethel (PABE) and McGrath (PAMC) on the Kuskokwim River, Sparrevohn Air Force Base (PASV), Dillingham (PADL), Cape Newehnam Air Force Base (PAEH) and St. Marys (PASM) on the Yukon River)

Portions of Southwestern Alaska in the Kuskokwim and Yukon River valleys experienced IFR or near-IFR conditions overnight between 11 and 12 November.  How did the half-hourly animations of GOES-R IFR probability and cloud thickness (as well as the traditional brightness temperature difference product) depict those reduced visibilities?

The beginning of this animation shows the effect of twilight conditions on the Cloud Thickness Product (upper right);  this product shows the thickness of the highest boundary layer cloud during non-twilight conditions.  If twilight conditions are occurring, or if higher clouds are moving into a region (as is occurring over Nushagak and Bristol Bays near Dillingham at the end of the animation), then the product is not generated.

The area of IFR conditions over southwest Alaska from St. Marys to Sparrevohn, McGrath and Bethel southwestward to Dillingham is depicted will in the IFR Probability fields.  Light winds in this region are allowing the low clouds to develop.  Relatively high values of IFR Probabilities, and the pixelated look to the field mean that both satellite and model predictors are being used over most of this region in computing the IFR probabilities.  An exception occurs over Cape Newenham near the end of the animation when lower IFR probabilities and a smoother field suggest that satellite-based predictors are not being used (because of the presence of multiple cloud layers).  This is also true of regions in the far southwestern part of the shown domain at the end of the animation.

Fog/Low Stratus along the Yukon River

GOES-R IFR Probabilities from GOES-West and surface observations (Upper Left), Brightness Temperature Difference (Upper Right), Topography (Lower Left), MSAS-derived dewpoint depression and surface observations (Lower Right)

Detection of fog and low stratus in Alaska present some unique challenges related both to the very low sun angle that is common there, and the large GOES-West pixel size.  Nevertheless, the fused product does give important information in a state where small planes are ubiquitous for transport between towns.  The loop above shows the development of IFR conditions within the Yukon River valley in east-central Alaska;  note the reduction in visibility that occurs at Fort Yukon (and only there) as the IFR probabilities increase.  IFR probabilities also increase in the Yukon Territory of Canada.  The lack of surface observations there highlights another challenge in Alaska:  Verification of predictions of IFR conditions.

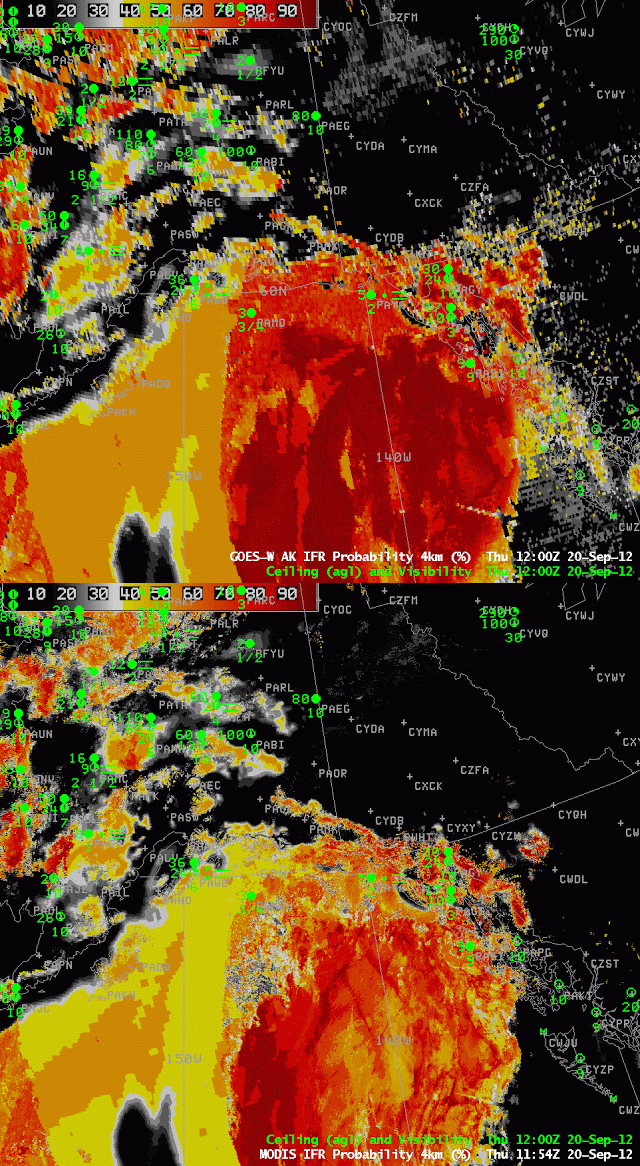
Resolution Differences between GOES and MODIS GOES-R IFR products

Toggle between GOES-R IFR Probabilities computed with GOES-West (at 1200 UTC) and with MODIS (1154 UTC) over the northern Gulf of Alaska and surrounding landmass

In regions where very small-scale terrain effects low cloud distribution — for example, in river valleys — the superior resolution of MODIS (on Terra or Aqua) or VIIRS (on Suomi NPP) allows a much better horizontal definition of cloud boundaries.  In regions of larger scale variability, such as over the ocean, differences between GOES and MODIS IFR estimates aren’t quite so noticeable, as in the imagery above.  Both fields show a large region of low stratus over the northern Gulf of Alaska moving inland.  The regions of lower ceilings and reduced visibilities match the stream of higher IFR probabilities moving northward over the Gulf, from Middlteon Is (PAMD) on the western edge to Sitka (PASI) and Petersburg (PAPG) on the southern/eastern edge.  Note also the break in high IFR probabilities where the Aleutian Peninsula attaches to the mainland, with higher probabilities, and IFR conditions, at PASV (Sparrevohn).

The character of the IFR probability field should alert you to the presence of a stream of high clouds over the western third of this image.  In that region, only model values are being used to compute IFR probabilities, and the total probabilities are therefore lower.

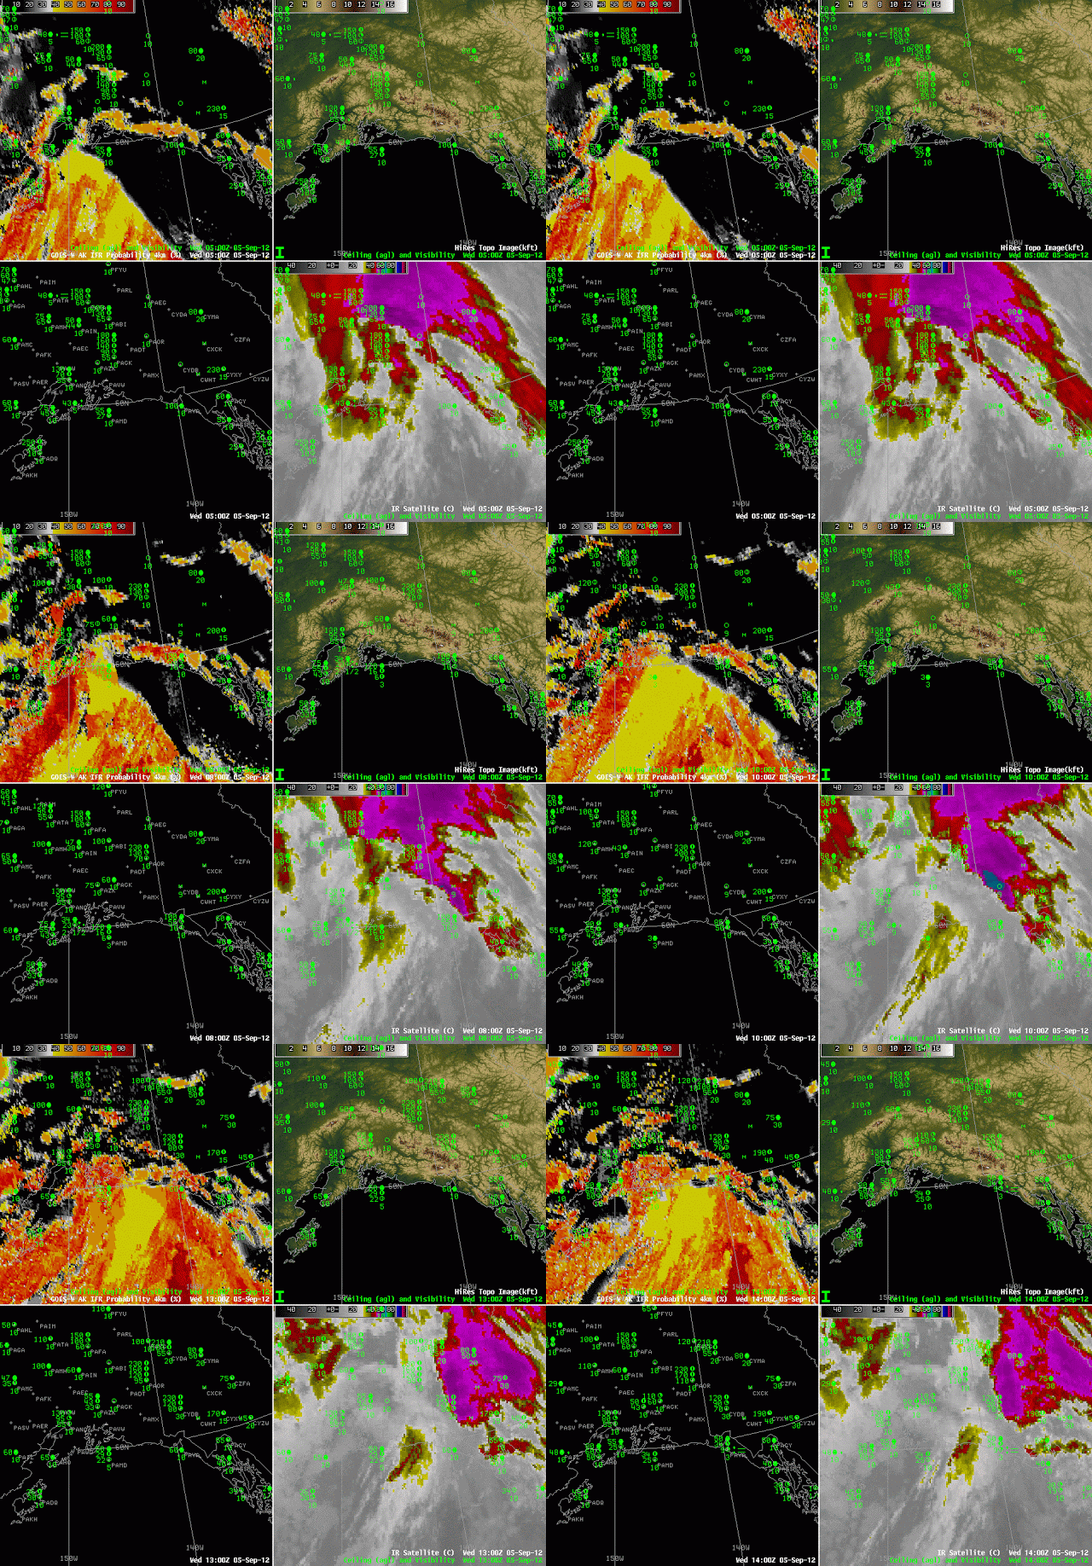
Fog/Low clouds over Alaska

Hourly images of GOES-West GOES-R IFR Probabilities over Alaska, 10 September 2012

IFR Probabilities and how they trend with time can help a forecaster determine the most likely regions where IFR conditions are occurring, and where they may occur in the near future.  The animation above illustrates several key facts about the product.

The region over interior Alaska is one where both Rapid Refresh model data and satellite imagery are being used to produce the IFR product.  This is related to the pixelated aspect of the field in that region.  The high probabilities at the top of the image correspond to the location of the Brooks Range — higher topography there means IFR conditions are more common as the terrain rises into any low clouds that are present.  There is a region of modest IFR probabilities over the Bering Sea north of the Aleutians and west of the mainland.  These values are relatively low (orange and yellow color), and uniform, because they are computed with the Rapid Refresh data only.  There is a region that moves in from the western edge that includes satellite data as well, and that is reflected both in the increased pixelated look to the field, and in the higher probabilities.  (Note that St. Paul Island — PASN — is reporting IFR conditions during this time)  When model data only are used in the computation of GOES-R IFR Probabilities (as occurs, for example, in regions of multiple cloud layers, or where a single high cirrus deck is present), probabilities are lower than in regions where satellite data also is used.  Very high probabilities occur only where satellite data can be used to gauge IFR probabilities.  Note also in this image that the western edge of the Rapid Refresh domain is obvious, west of 170 W longitude.

Note that in the inland region of enhanced IFR probabilities, Galena AK is near the highest values, and it is experiencing reduced visibilities and IFR conditions with freezing fog at 1400 UTC.  Those conditions continued through 1600 UTC (below).

GOES-R IFR Probabilities computed from GOES-West and Rapid Refresh, 1600 UTC 10 September 2012

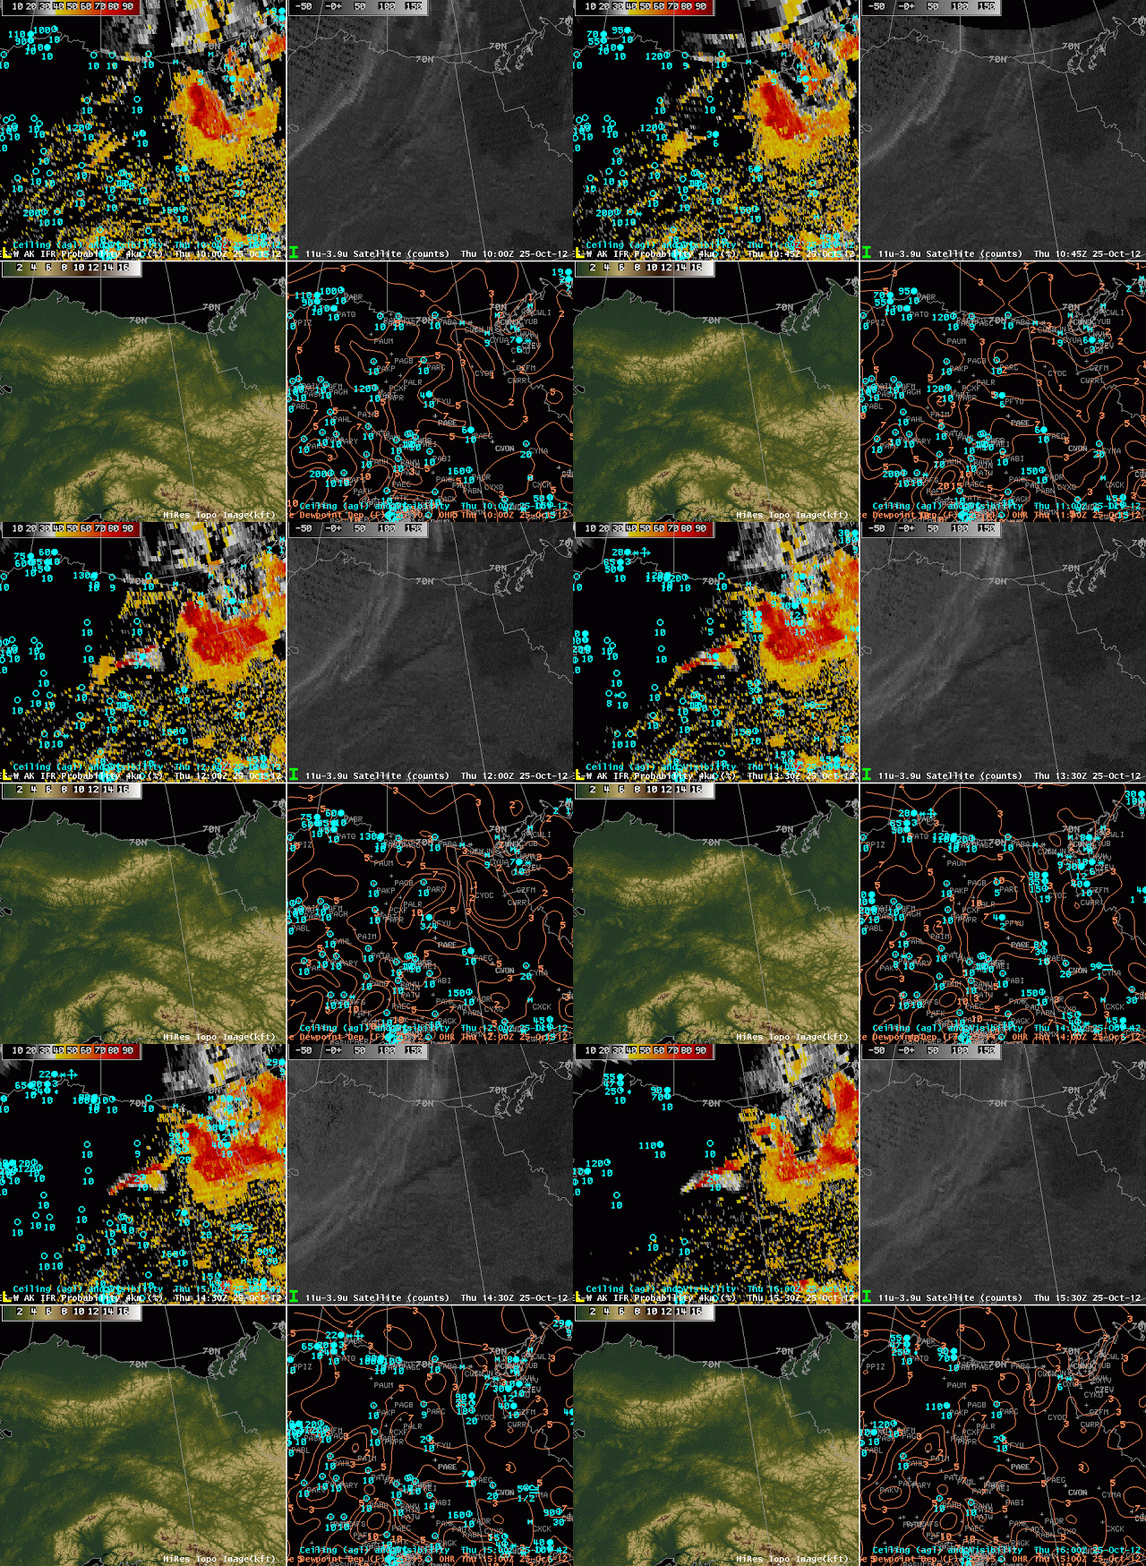
IFR Probabilities during an extratropical cyclone in the Gulf of Alaska

GOES-R IFR Probabilities (Upper left), Color-enhanced Topography (Upper right), Surface Observations and ceilings (Lower Left), Enhanced 10.7 imagery (Lower right)

Oceanic storms will generate IFR conditions, and the GOES-R IFR Probability fields, a fused product that blends satellite and model information, provides an indication of how and when visibilities decrease.  The animation above, at hourly intervals, shows the steady advance of higher IFR probabilities eastward through the Gulf of Alaska.  Note how the observations at Middleton Island (PAMD) and at Yalutat (PAYA) both transition to IFR conditions as the ‘front’ of higher probabilities passes — around 0700 UTC at PAMD and around 1300 UTC at PAYA.

The IFR probability field includes regions that are characteristic of model-only predictors being used (the large yellow region that stretches NNE-SSW over the Gulf of Alaska at 1200 UTC) and regions where both model and satellite data are used (the more pixelated region south of the Aleutians at the end of the animation).  When model predictors only are used, probabilities are typically lower than when both model and satellite predictors are used.

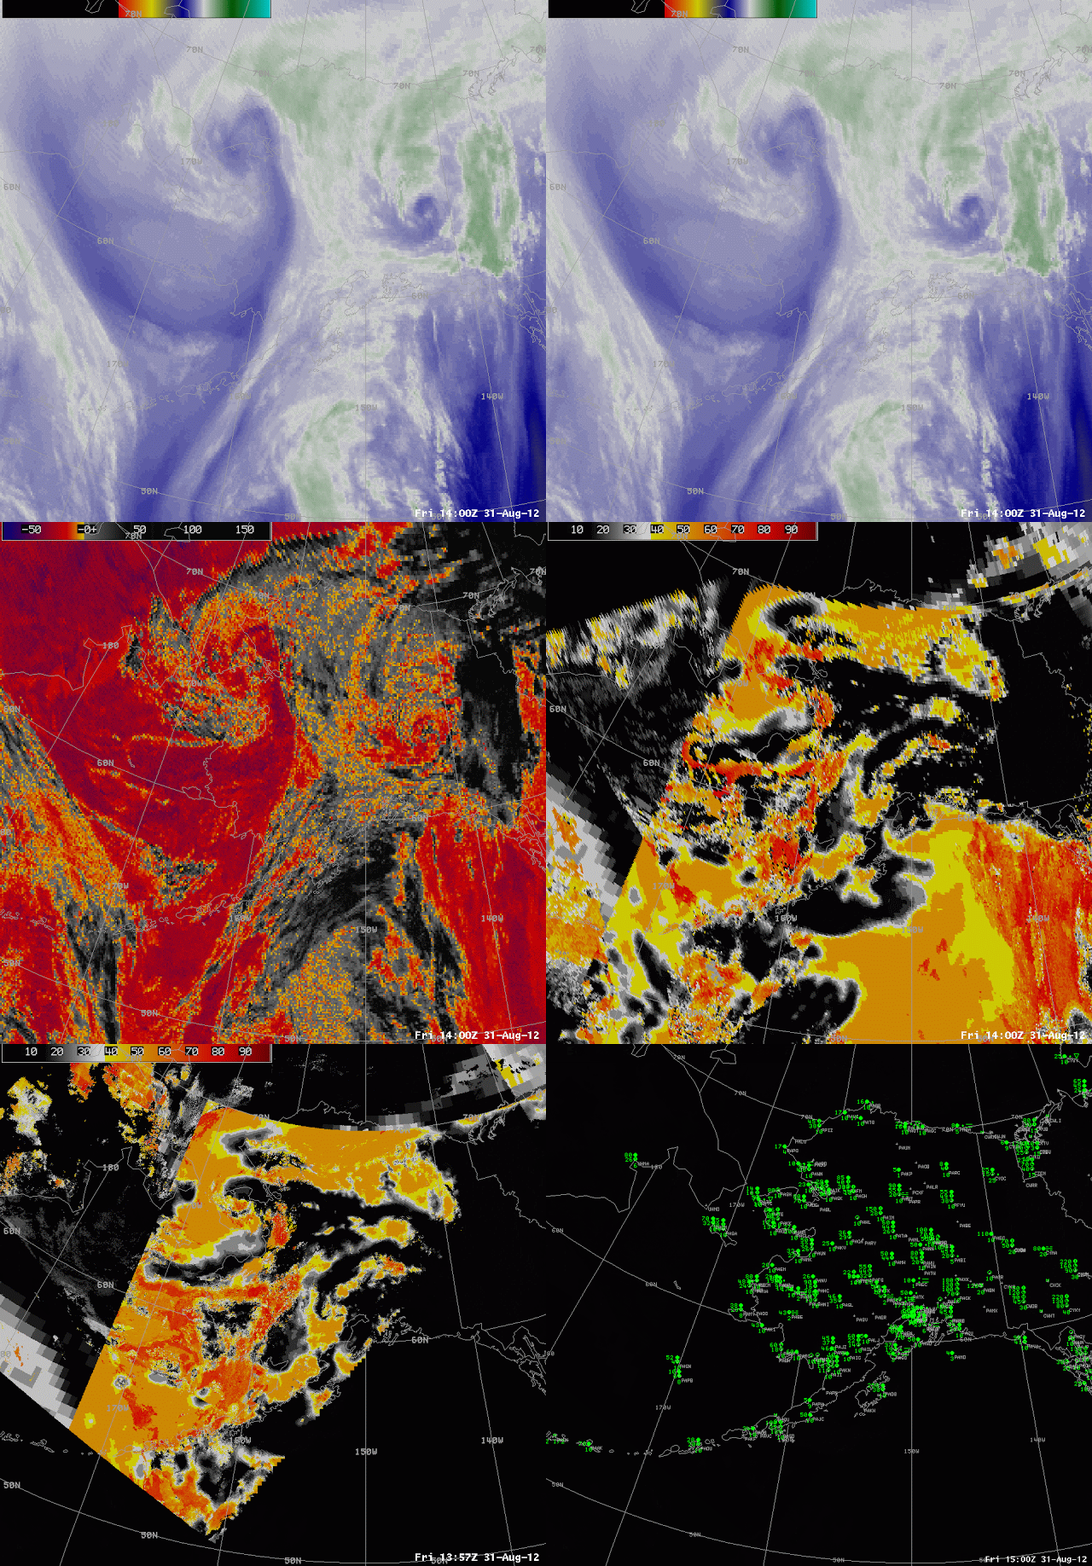
IFR in Alaska when a Large-Scale weather system is present

Animation of 1400 UTC Water vapor imagery, the 10.7 micron infrared image, the brightness temperature difference (10.7 – 3.9), the GOES-R IFR Probabilities computed from GOES data, the GOES-R IFR Probabilities computed from MODIS data, and the surface observations/ceilings.

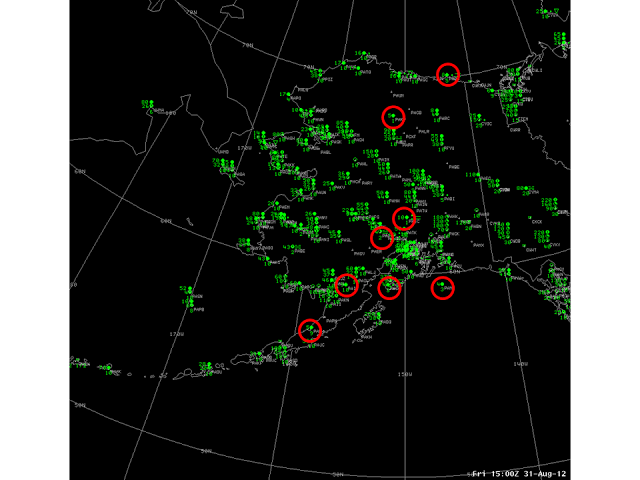
The loop above cycles through the 1400 UTC Water vapor imagery, the 10.7 micron infrared image, the brightness temperature difference (10.7 – 3.9), the GOES-R IFR Probabilities computed from GOES data, the GOES-R IFR Probabilities computed from MODIS data, and the surface observations/ceilings.  The complex large-scale weather system over northwest Alaska is means that southerly winds over eastern Alaska are drawing moisture and cloudiness northward from the Gulf of Alaska.  Multiple cloud layers in this moist flow means that the traditional method of fog/low stratus detection (the brightness temperature difference between 10.7 and 3.9 micrometers) will be challenged.  Furthermore, on this particular day, IFR conditions (the observation map is below;  stations with IFR conditions are circled in red) are most frequent underneath the multiple cloud layers in the eastern part of the state, and at high levels, such as in the Brooks Range.

The GOES-R IFR probability field suggests higher possibilities of IFR conditions in regions where IFR conditions are observed:  near Anchorage, on the Aleutian peninsula and in the Brooks Range.

Observations over Alaska at 1500 UTC 31 August.  IFR conditions highlighted by red circles.

IFR over SW Alaska

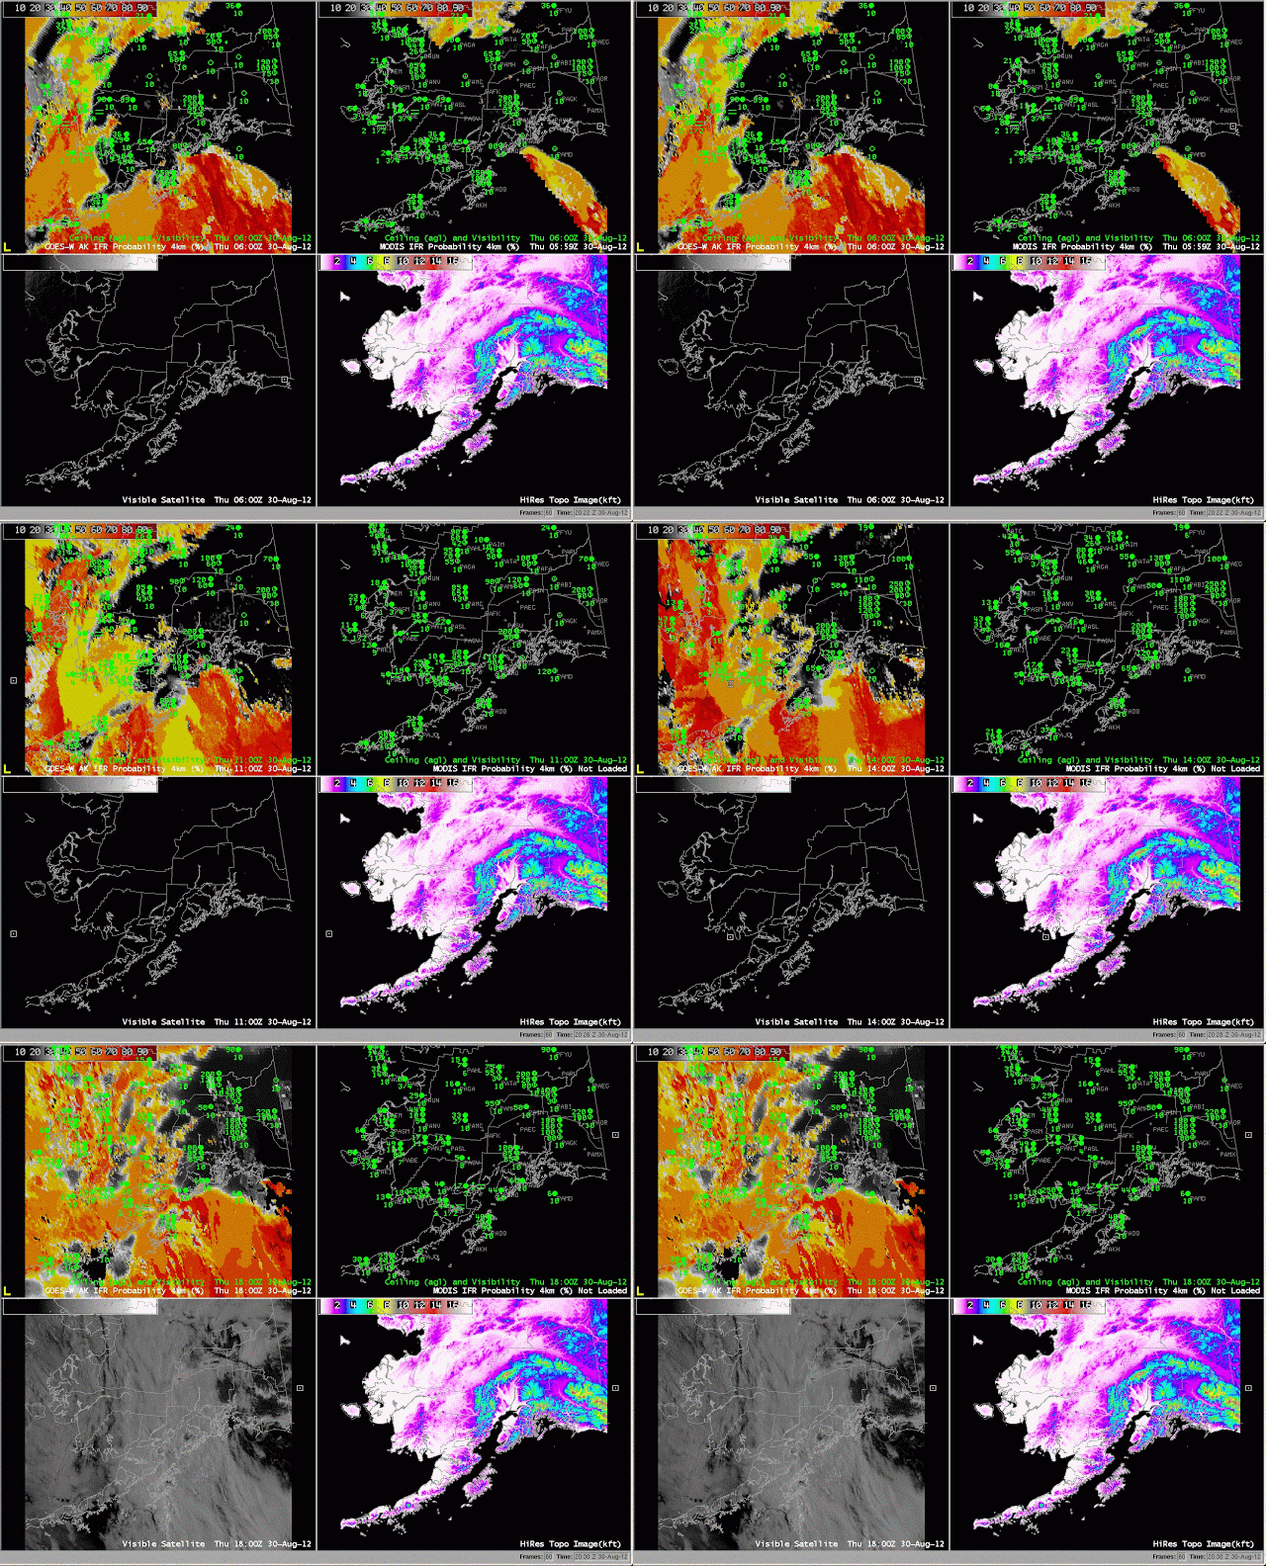
GOES-R IFR Probabilities (upper left) computed from GOES-West, GOES-R IFR Probabilities computed from MODIS (upper right), Visible Imagery (bottom left), Topography (bottom right)

GOES-R probabilities are a fused product between satellite data and the Rapid Refresh model.  Model data are used only where multiple cloud layers are present and or where a single cirrus cloud level exists.  The character of the IFR probability field looks different when model data only is used.  IFR probabilities are lower when only model data are used.

IFR probabilities are well related to observations at Kodiak, for example.  As the higher probabilities increase from the southwest, ceilings lower, and eventually IFR conditions occur.  The better resolution of the MODIS imagery, below, allows far finer-scale structures to be resolved in the imagery.

GOES-R IFR Probabilities (upper left) computed from GOES-West, GOES-R IFR Probabilities computed from MODIS (upper right), Visible Imagery (bottom left), Topography (bottom right)

Note how the smaller probabilities are downwind of the Aleutians.  Visible imagery — at the end of the animation — distinctly shows the clear region.