Monthly Archives: January 2013

IFR conditions with multiple clouds layers over the southeast US

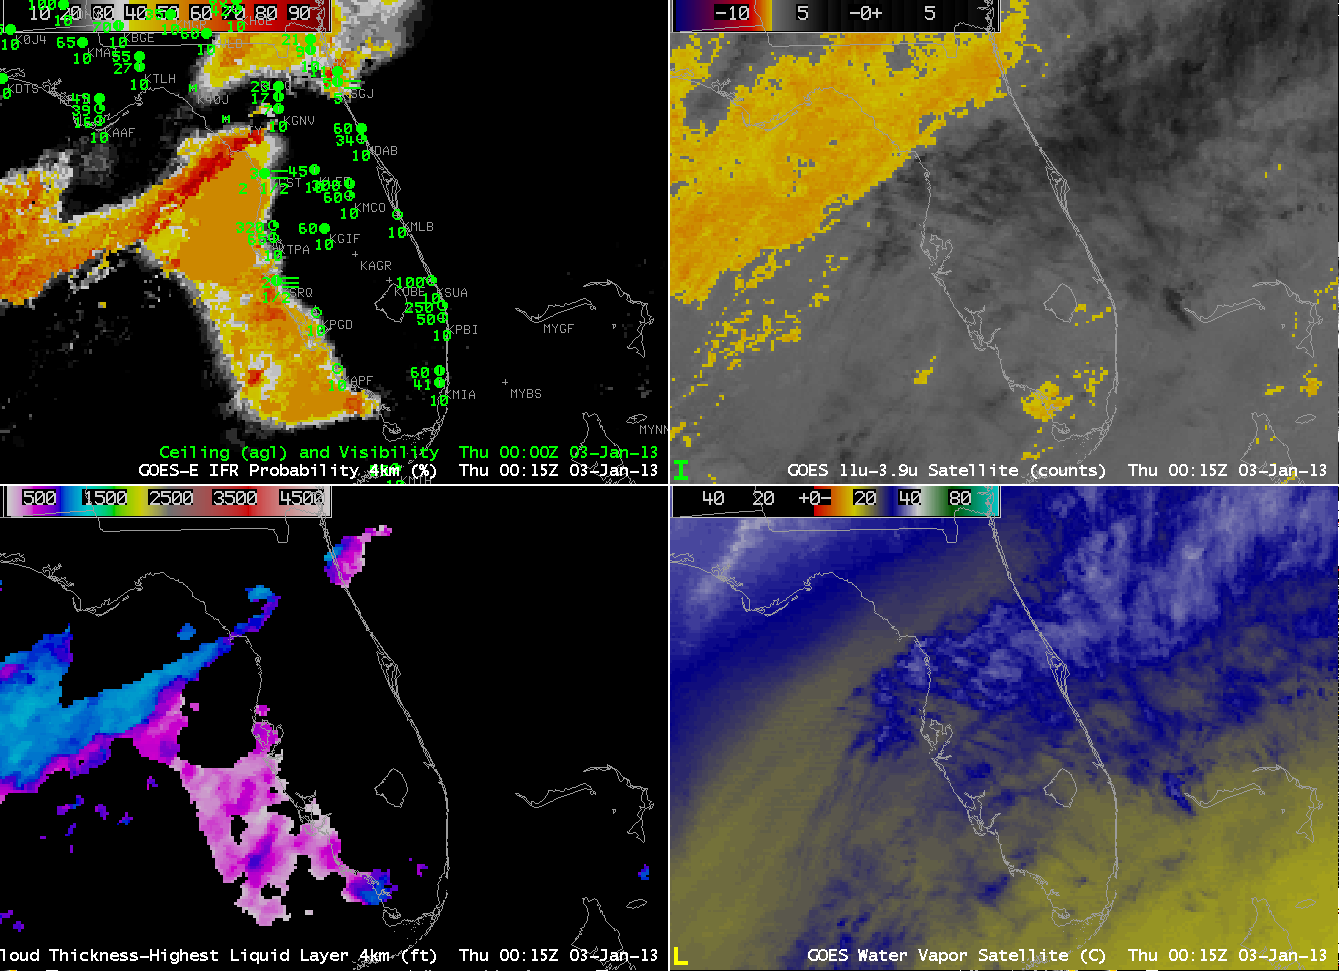
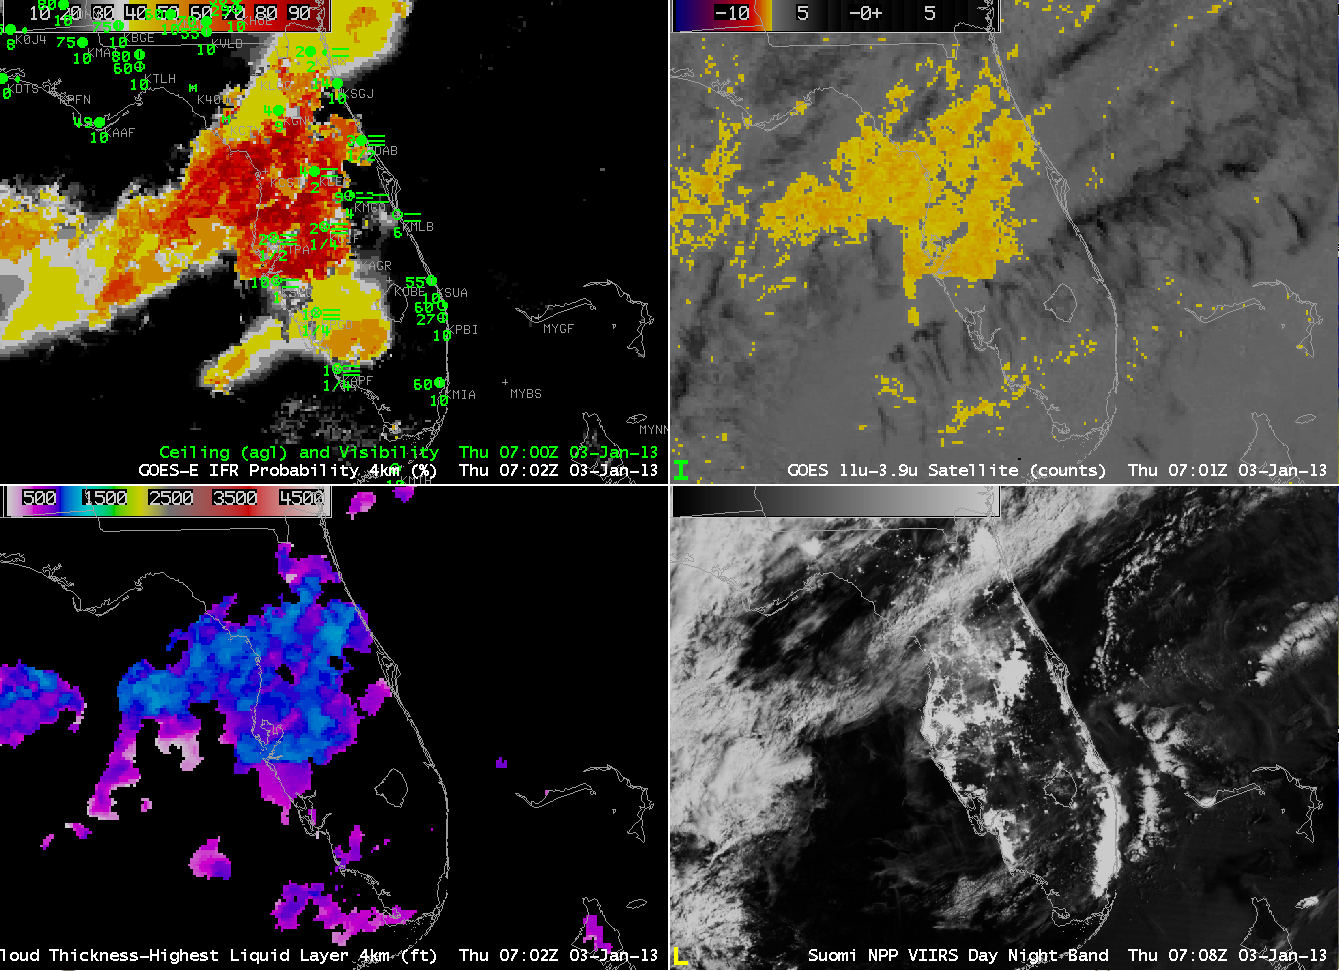
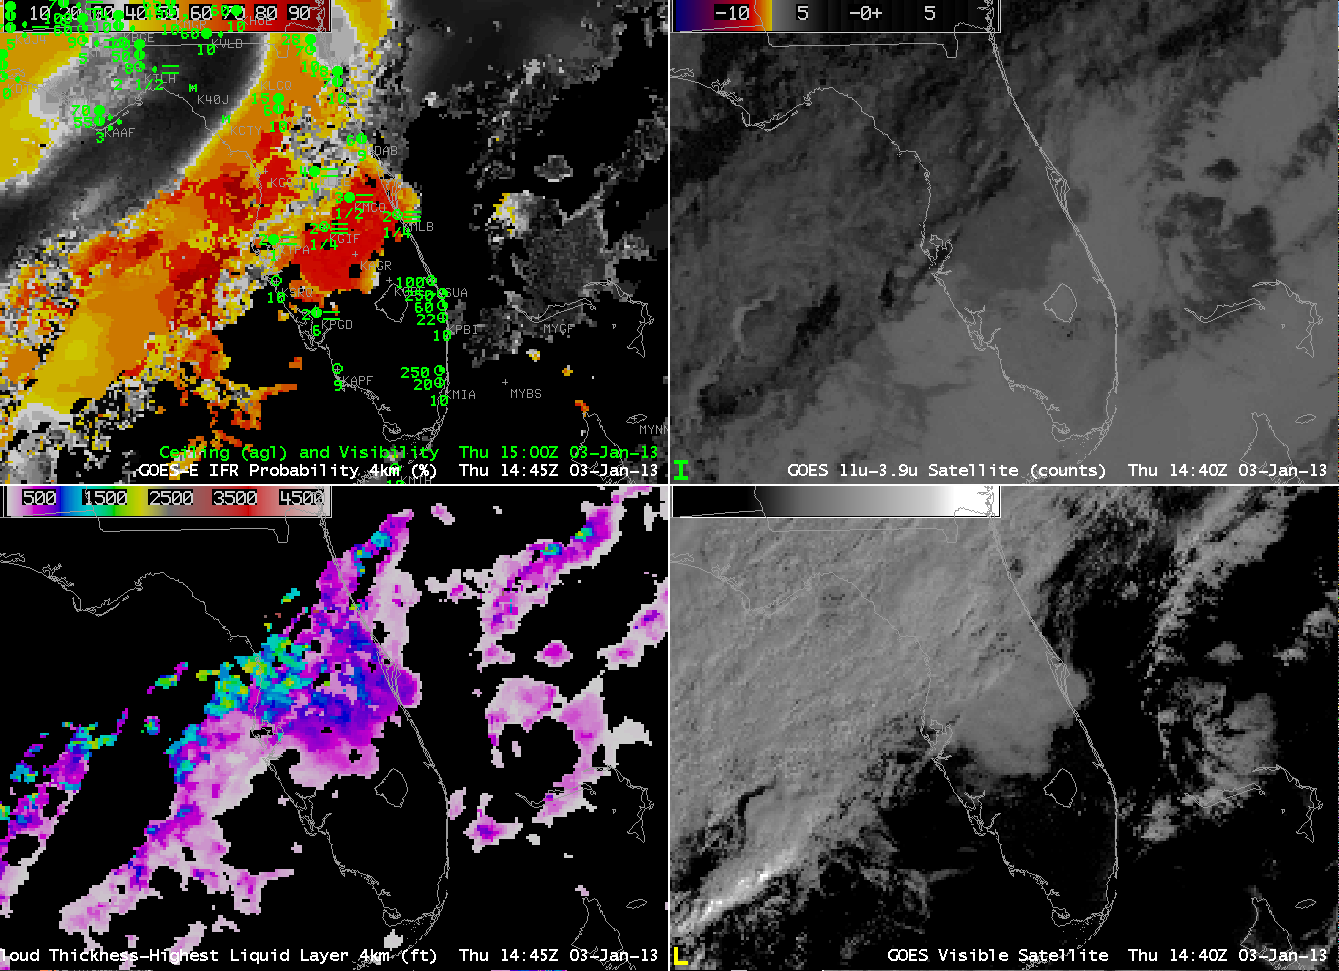
GOES-R IFR Probabilities from GOES-East (Upper Left), GOES-East Brightness Temperature Differences (Upper Right), GOES-R Cloud Thickness (Lower Left), Surface Observations of Ceilings and Visibility (Lower Right), all at 1000 UTC on 16 January 2013

A slowly-moving weather system brought extensive cloudiness and IFR and near-IFR conditions over the southeast part of the United States again on January 16, and provided a good example of how the fused nature of the GOES-R Fog/Low Stratus product — combining both satellite and model information — yields a better signal (than is available from the traditional brightness temperature difference product) of where fog and low stratus are most likely.  The imagery from 1000 UTC, which is characteristic of the entire event, shows a brightness temperature difference signal over the southest that is consistent with the observed multiple cloud layers.  Such a cloud configuration makes it very difficult to relate the brightness temperature difference signal to surface observations.  in contrast, the IFR Probability field show a widespread region of high probabilities, overlapping the regions of near-IFR and IFR observations over Tennessee, and points south.  Cloud thickness, which is computed only where single water-cloud layers are detected from satellite, indicates cloud thicknesses around 1000 feet.  Note that where the cloud thickness is diagnosed, in general, IFR probabilities are relatively larger.  This is because IFR probabilities combine satellite predictors and model predictors.  If the satellite predictors cannot be generated because of multiple cloud layers and/or a single high cirrus deck, then only the model predictors are driving the IFR probability value, and the probability will therefore be lower.  This is the case over western Tennessee and central Georgia.

Dense Fog Event Over the Upper Midwest U.S.

False color image of  a winter storm system moving across the upper Midwest U.S. on 11 January 2013.

A strong winter storm system moved over the upper Midwest on 11 January 2013 bringing heavy snow to the Dakotas. Rain and warm air moved in over the mostly snow covered areas of eastern Nebraska, Minnesota, Iowa, Wisconsin and northern Illinois resulting in a large area of locally dense fog. GOES-R IFR probabilities were used to monitor the large-scale event as it moved over the Upper Midwest U.S.

Due to a large amount of overlaying clouds a satellite only product such as the traditionally-used 11-3.9 micron Brightness Temperature Difference (BTD) only sees the top cloud layer and therefore can not detect fog/low stratus (FLS) beneath. The GOES-R IFR probabilities, however, combine both satellite and mesoscale NWP model data to create a blended product that can estimate the probability that IFR conditions are present even where overlaying clouds obscure all or part of the scene. This animation of the weather system shows that the traditional 11-3.9 micron BTD product only detects a small portion of the fog event, confirmed by the surface observations of ceiling and visibility. The GOES-R FLS product provides relatively high probabilities (>50%) that IFR conditions are present over the entire extent of the fog event with significantly high probabilities (>90%) when satellite data is useful.

GOES-R IFR probabilities (Upper Left), GOES-R Cloud Thickness (Upper Right), GOES-East Brightness Temperature Difference (10.7µm – 3.9µm) (Lower Left) and GOES-East Visible Satellite Imagery (Lower Right) on 11 January 2013. Surface observations of ceiling (100’s of ft) and visibility (miles) are shown in blue.

In the scene above the large change in probability seen in the GOES-R IFR product is a direct result of where the overlaying clouds obstruct the view of the lower clouds from the satellite. Where the satellite is able to see the low level clouds both satellite and model information are combined to determine the probability that IFR conditions are present. For this scene a strong satellite component and strong model component result in extremely high probabilities (>90%) that provide high confidence that IFR conditions are present over parts of the region. In areas where the overlaying clouds obstruct the satellite view only model data is used to determine the IFR probabilities. Without a strong satellite component the resulting probabilities are lower, however, they are still relatively high (>50%) and when used in conjunction with surface observations also provide high confidence that IFR conditions are present. The IFR probabilities show the extent of the fog over central Nebraska, southern Wisconsin and Illinois better than the traditional BTD product with very little false detection (high probabilities where surface obs do not indicate IFR conditions). Looking over the Dakotas and Nebraska the GOES-R IFR probabilities closely match the surface observations with relatively high probabilities over all of Nebraska and the eastern Dakotas where IFR conditions are present and very low probabilities in central N. Dakota and western S. Dakota where surface obs indicate VFR conditions.

GOES-R IFR probabilities (Upper Left), GOES-R Cloud Thickness (Upper Right), GOES-East Brightness Temperature Difference (10.7µm – 3.9µm) (Lower Left) and GOES-East Visible Satellite Imagery (Lower Right) on 11 January 2013. Surface observations of ceiling (100’s of ft) and visibility (miles) are shown in blue.

The traditional BTD product is mostly a nighttime only product as solar contamination in the 3.9 micron channel during the day makes it much more difficult to use. As daylight approaches the scene from 11 January 2013 the traditional BTD product appears to drop out. The GOES-R IFR product has no such issues and works smoothly through the night-to-day transition with consistently high probabilities accurately showing the full extent of the area of fog that continued through the rest of the afternoon.

Evolution of Fog/Low Stratus over Florida

GOES-R IFR Probabilities (Upper Left), GOES-East Brightness Temperature Difference (10.7 µm – 3.9 µm) (Upper Right), GOES-R Cloud Thickness (Lower Left), GOES-East 6.5 µm imagery (Lower Right), from ~0000 UTC on 3 January 2013

GOES-R IFR Probabilities captured the evolution of IFR (and Low IFR) conditions over and around the Florida peninsula from late on 2 January through morning on 3 January 2013.  Advection fog over the chilly coastal waters of the eastern Gulf of Mexico stayed mainly offshore (although Sarasota at 00 UTC reports IFR conditions) and is captured well by the GOES-R product.  This is a region underneath high cirrus and as such, the traditional brightness temperature product is blind to the existence of low clouds there.

Over the course of the night, fog and low stratus developed over land, and the GOES-R IFR probability product captured that evolution as well (below, hourly imagery).  Again, there are regions where the brightness temperature difference product is not useable because of multiple cloud layers, and the Rapid Refresh Model output is controlling the IFR Probabilities — these are regions where the IFR probability field is very smooth and typically exhibits lower probability values even though IFR conditions may be observed (For example, at Gainesville and Jacksonville at 0600 UTC).  By morning, visibilities were under 1/4 mile over much of the central Florida Peninsula (For example, Orlando).

As above, but hourly imagery from 0000 UTC through 1400 UTC on 3 January 2013.

The 3/4-full moon allows for plenty of illumination for the Day/Night band on VIIRS, which is flying on Suomi/NPP.  The 0700 UTC imagery, below, demonstrates the difficulty of using the DNB at night to detect fog — city lights that shine through low clouds.  Fog is detected in rural regions, but where city lights exist, the signal is difficult to extract.

GOES-R IFR Probabilities (Upper Left), GOES-East Brightness Temperature Difference (10.7 µm – 3.9 µm) (Upper Right), GOES-R Cloud Thickness (Lower Left), Suomi/NPP VIIRS Day/Night Band 0.7 µm imagery (Lower Right), from ~0700 UTC on 3 January 2013

The visible imagery at 1500 UTC, below, shows the horizontal extent of the stratus deck through central Florida.  The region matches well with the IFR Probabilities because visible imagery during the day is used as a cloud-clearing mechanism in the GOES-R algorithms.  Note also how the reflected 3.9 µm solar radiation during the day renders the brightness temperature difference product ineffectual.

GOES-R IFR Probabilities (Upper Left), GOES-East Brightness Temperature Difference (10.7 µm – 3.9 µm) (Upper Right), GOES-R Cloud Thickness (Lower Left), GOES-East visible (0.63 µm) imagery (Lower Right), from ~1500 UTC on 3 January 2013

Reduced Visibilities over Minneapolis

GOES-R IFR Probabilities, and ceiling/visibility observations, at 2-hourly intervals from 0615 UTC through 1415 UTC on 2 January 2013.

GOES-R IFR Probabilities show the movement of a region with IFR and near-IFR conditions, initially over southwest Minnesota and extreme northwest Iowa, northeastward towards the Minneapolis/St. Paul metropolitan area on 2 January 2013.  The deepest red colors in that region correspond to IFR probabilities around 94%, in contrast to the values over central Minnesota that are closer to 80%.  As the region of higher probabilities approaches the Twin Cities, ceilings and visibilities lower.  Tracking the motion of the highest probabilities can be an excellent method to make a short-term forecast of flight conditions.