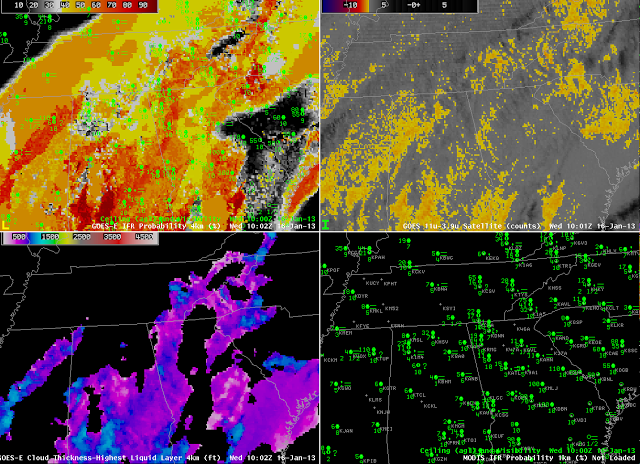
 |
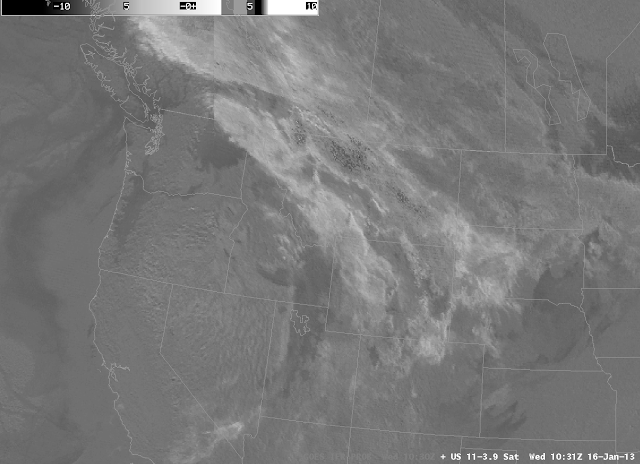
| Brightness Temperature Difference plot over the NW USA, 1031 UTC 16 January |
The plot above shows the default enhancement the brightness temperature difference product traditionally used to highlight regions of low clouds and fog. The greyscale nature of the product can make interpretation difficult. However, if a suitable enhancement is applied (below), such that fog and low clouds are enhanced, interpretation is easier.
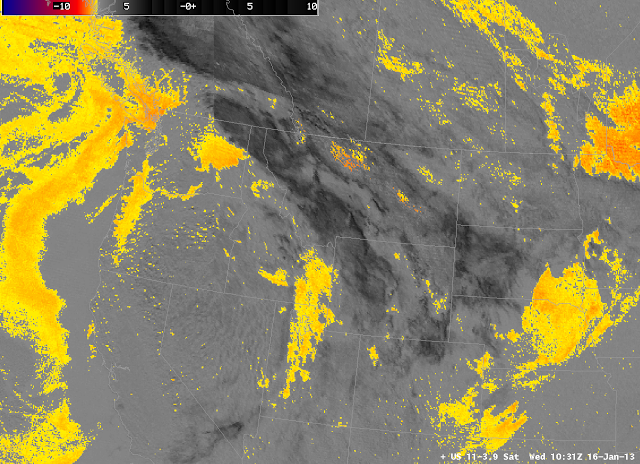 |
| As above, but color-enhanced. |
This image suggests the presence of fog or low stratus (or both) off the west coast of the US, in and around Salt Lake City, near Spokane, and in the Willamette Valley and Columbia River Valley. It is difficult to tell if the regions are associated with restrictions in visibility because an elevated stratus deck and a fog bank look very similar in the brightness temperature difference field. Therefore, the GOES-R Fog/Low Stratus IFR Probability field was developed to highlight regions where IFR conditions are most likely. That product is shown below.
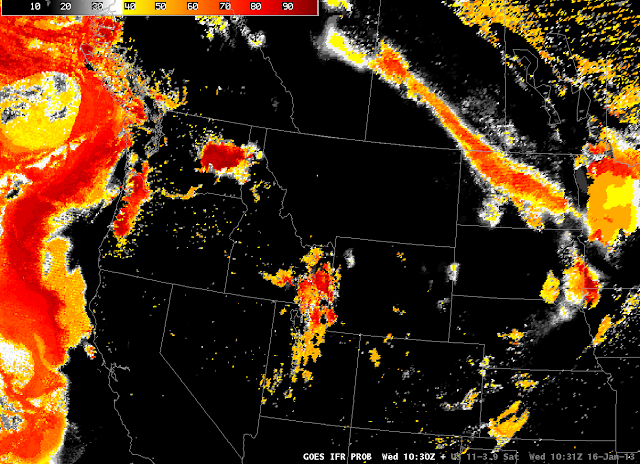 |
| GOES-R IFR Probabilities, 1030 UTC on 16 January |
Compare the IFR probability field to the Brightness Temperature Difference field above it. Several things are apparent. Highest probabilities for visibility restrictions are centered near Spokane, WA. There is a region of higher IFR probabilities in North Dakota that is missing entirely in the Brightness Temperature Difference product. IFR probabilities over Utah vary more than the Brightness Temperature Difference signal. The differences all arise from the model data that are used to better highlight where low-level saturation is occurring.
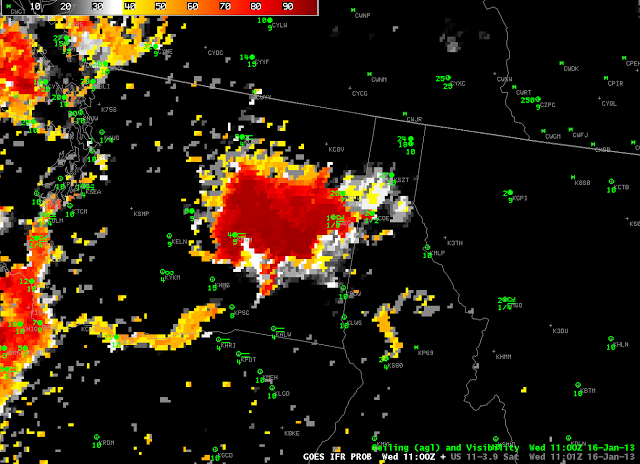 |
| IFR Probabilities and observations of Ceilings/visibilities from 1100 UTC on 16 January. |
This zoomed-in imagery shows that, indeed, visibility restrictions (IFR conditions) are occurring in eastern Washington. The strength of the fused product is that is provide a coherent signal over a larger area, so you can better define the region of IFR conditions than is possible with surface observations alone. The region of higher IFR probabilities over North Dakota is also associated with IFR and near-IFR conditions in a northwest-southeast oriented strip including Harvey and Jamestown, ND (not shown).

