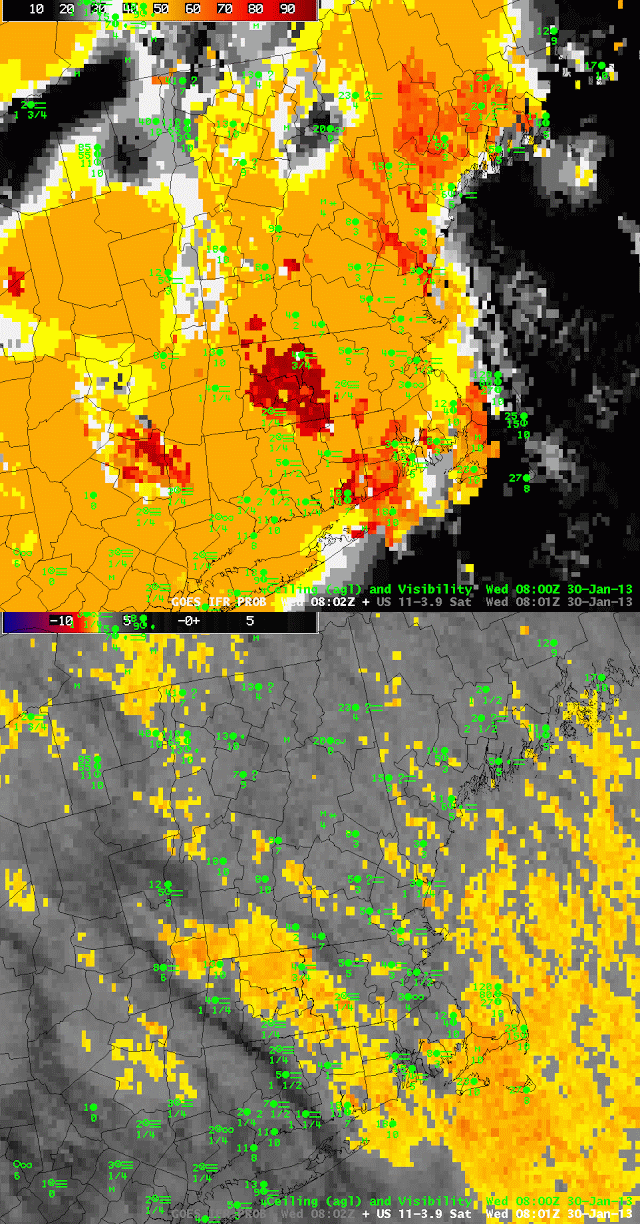
The two images looping, above, show two different schemes used to detect fog and low stratus. The one that highlights mostly land over New England is the GOES-R Fog/Low Stratus product, and it shows mostly uniform probabilities over southern New England, with a patch of higher probabilities in central Massachusetts and over southern Maine. In contrast, the Brightness Temperature Difference Product — the traditional method of detecting fog — highlights a large area over the ocean (as well as a region in central Massachusetts that stretches southeastward to Block Island). Note that the regions of IFR conditions are over land. The offshore islands, and Cape Cod, do not show IFR conditions even though the heritage fog detection product has a strong signal offshore.
GOES-R IFR Probabilities are highest in central Massachusetts. This is where both predictors — the Rapid Refresh Data and the satellite data — strongly indicate the presence of fog and low stratus. The interpretation that should be given where roughly homogenous regions of IFR probability surround a region of higher, more variable IFR probability, as is happening in central Massachusetts, is that higher clouds (or multiple cloud layers) have parted over the region of highest IFR probabilities, allowing the satellite signal to be a factor. This would also be a region where GOES-R Cloud Thickness could be computed. In regions offshore, IFR probabilities are low despite the strong satellite signal becaure the Rapid Refresh data is not modeling (properly) atmospheric conditions conducive to IFR conditions.

