River Fog over Wisconsin

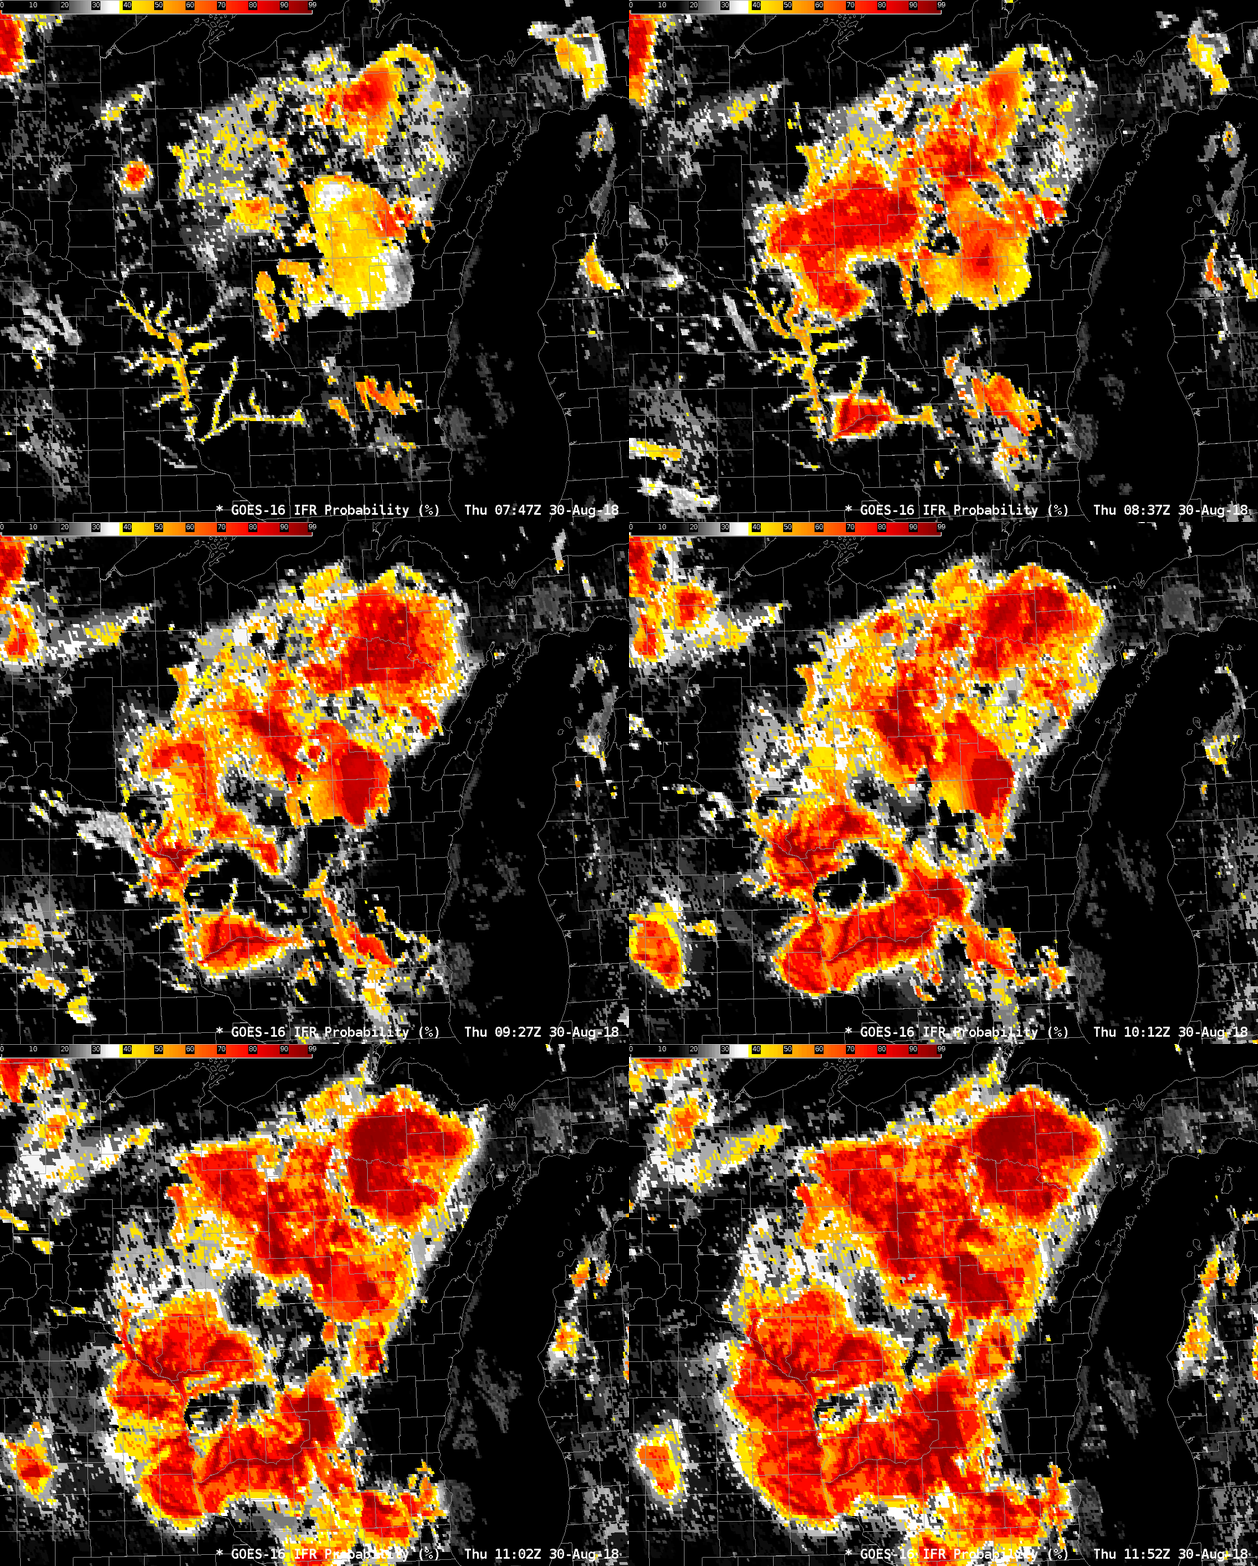
GOES-16 IFR Probability, 0747-1152 UTC on 30 August 2018 (Click to enlarge)

GOES-16 IFR Probability incorporates information about low-level saturation from the Rapid Refresh Model. The model data used changes hourly, and that can cause an hourly change, a pulsing, in the IFR Probability animation in cases when the forecast model evolution is changing.

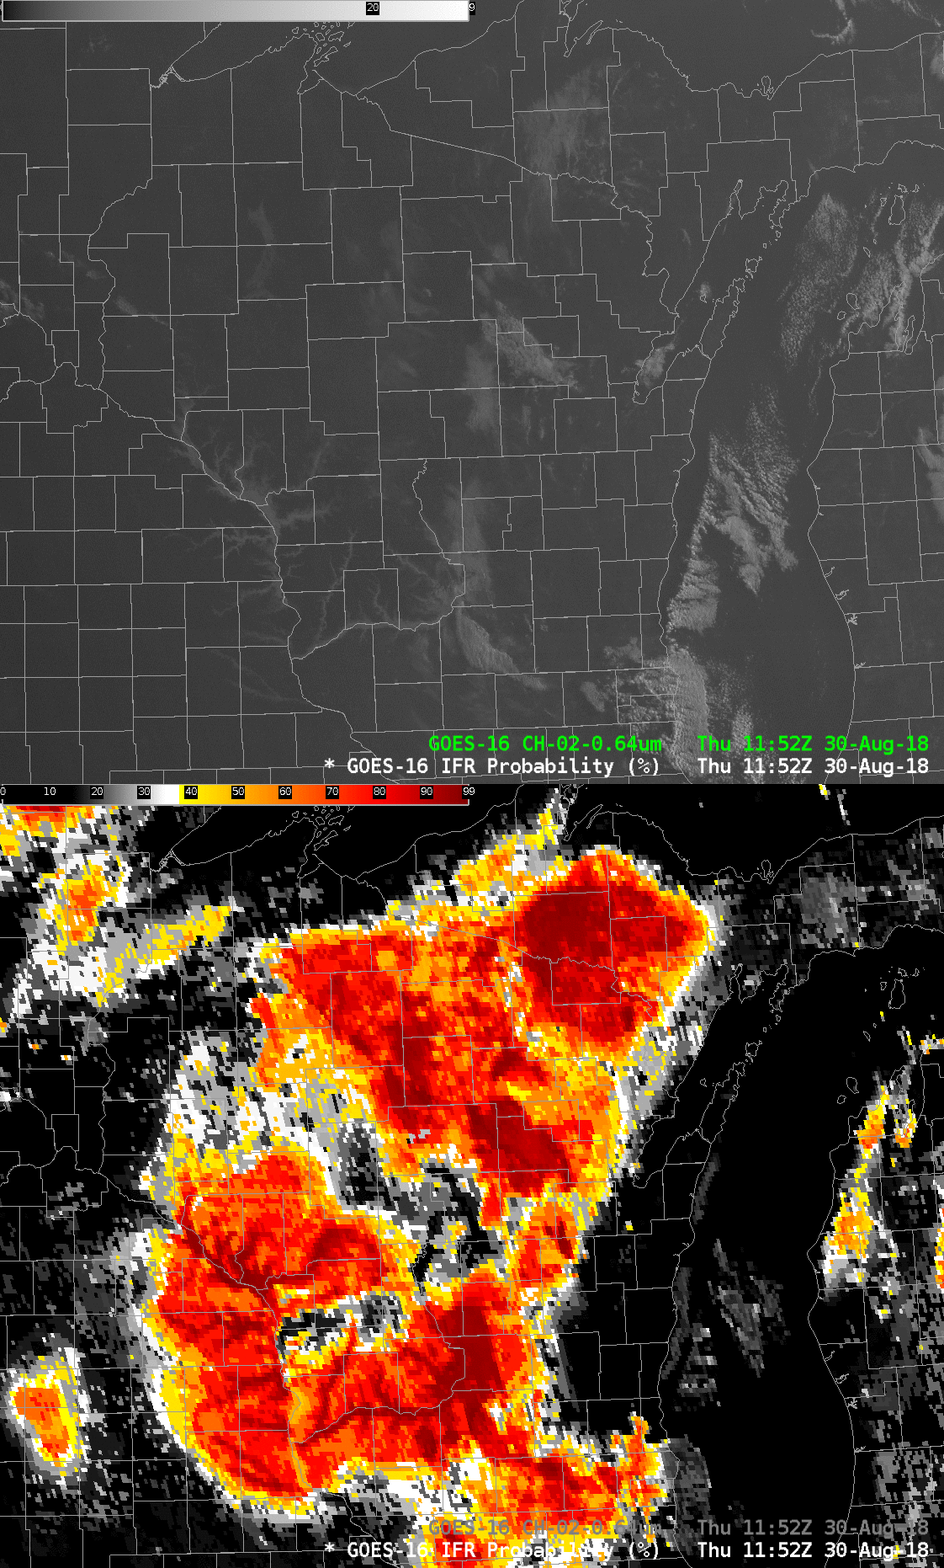
In this case, visible imagery at sunrise (enhanced because of the low light) suggests the IFR Probability field is overpredicting the extent of River Fog in southwest Wisconsin. Note, however, that the highest IFR Probabilities do align with river valleys where fog is observed.

GOES-16 ABI Band 2 (0.64 µm) and GOES-R IFR Probabiilty, 1152 UTC on 30 August 2018 (Click to enlarge)

Dense Fog over the Midwestern United States

GOES-R IFR Probability Fields, 0337 – 1332 UTC on 8 August 2018 (Click to enlarge)

The longer August nights over the upper Midwest (for example, Madison Wisconsin’s night is about 70 minutes longer now than it was at the Summer Solstice) can allow for dense fog to form when light winds and clear skies follow a cloudy, damp day. The animation above shows the evolution of the GOES-R IFR Probability fields as the dense fog develops, a fog for which advisories were issued.  The horizontal extent of the widespread fog is captured well in the IFR Probability fields.  There are a couple of things worth noting.

There is a subtle — but noticeable — change in the IFR Probability Fields each hour in the animation. That change is related to model data in this fused product. Rapid Refresh Model output are used to identify regions of low-level saturation that must occur with fog. (The inclusion of this data helps IFR Probability better distinguish — compared to satellite imagery alone — between elevated stratus and fog). When output from newer model runs is incorporated (and that happens every hour), the IFR probability fields are affected. The amount of change is testimony to whether the sequential runs of the Rapid Refresh are consistent in capturing the developing fog. In this case, there were differences from one model run to the next.

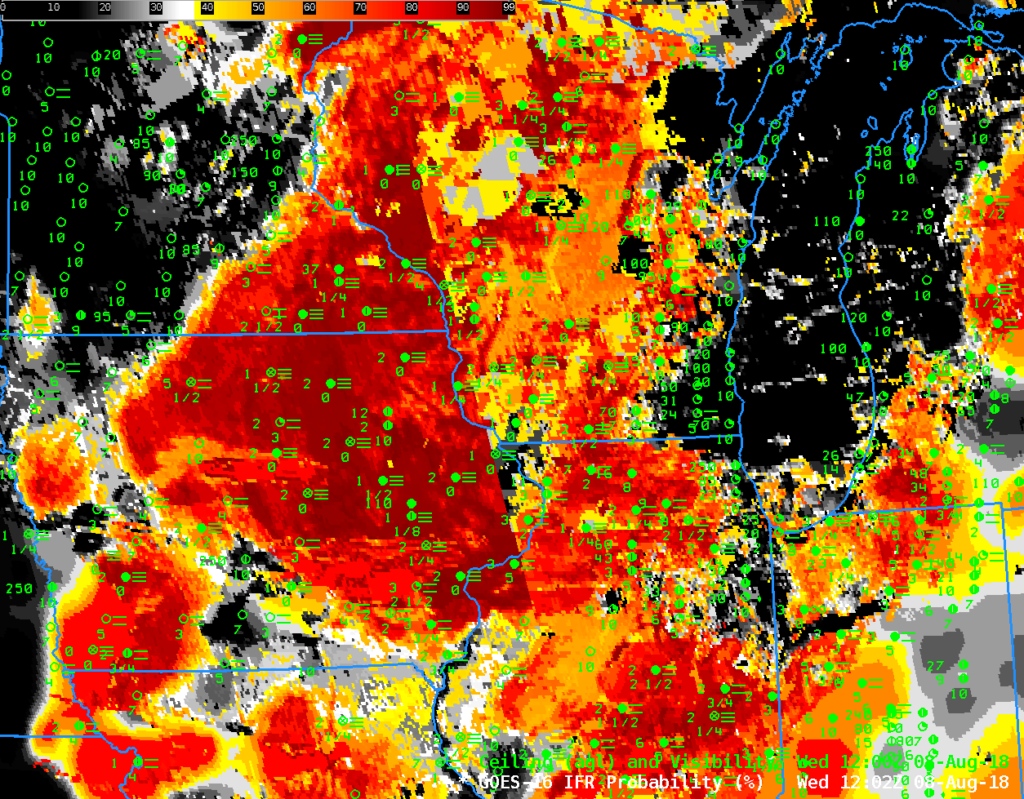
GOES-R IFR Probability fields, 1202 UTC on 8 August 2018 (Click to enlarge)

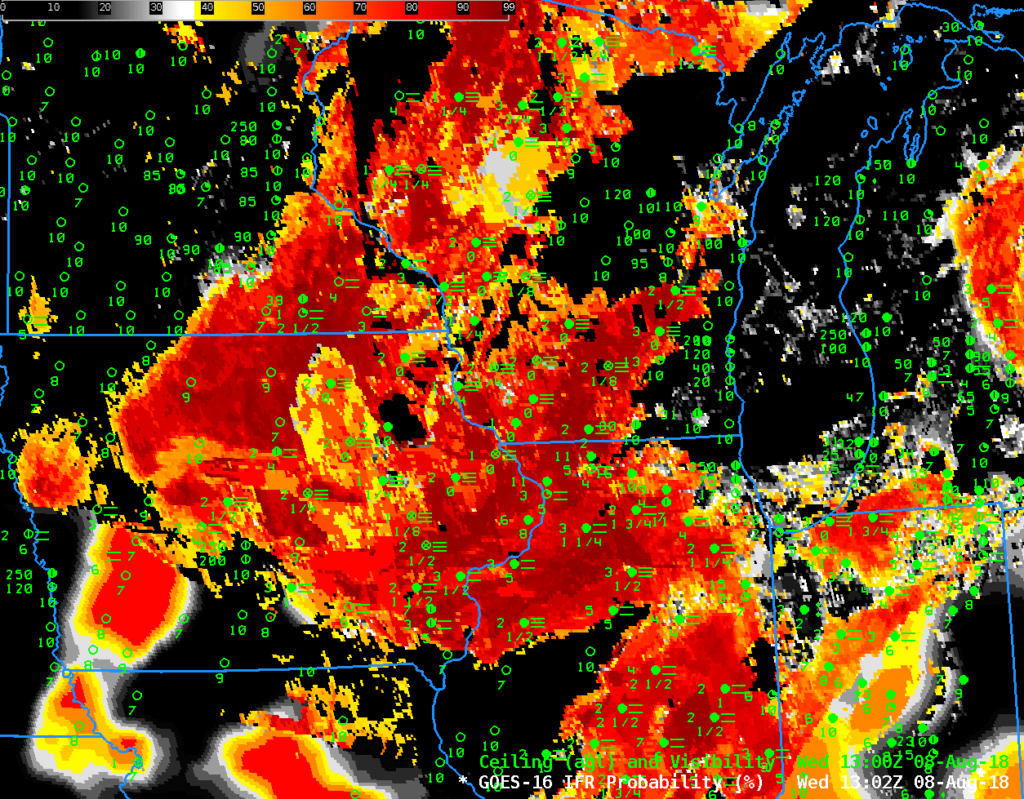
Two boundaries are apparent in the animation above, captured in the 1202 UTC image above, and in the 1302 UTC image below. These boundaries are related to the Terminator, the dividing line between night and day. During an hour around sunrise, rapid changes in reflected 3.9 µm solar radiation make the detection of low clouds difficult. Temporal adjustments are incorporated into the IFR Probability fields to create a cleaner field. In the 1202 UTC image, above, the effects of sunrise are occurring along the NNW-SSE oriented boundary near the Mississippi River in southwestern WI (The boundary is parallel to the Terminator line, so it will be vertical — parallel to a Longitudinal Line — on the Equinoxes).   In the 1302 UTC image, below, the second boundary is over far northwestern Wisconsin, far southeastern Minnesota, and eastern Iowa.  The region between these two westward-propagating boundaries is where information from previous times is used in the IFR Probability fields.  Thus, when the second boundary passes, you may observe rapid changes in IFR Probability fields.

GOES-R IFR Probability fields, 1302 UTC on 8 August 2018 (Click to enlarge)

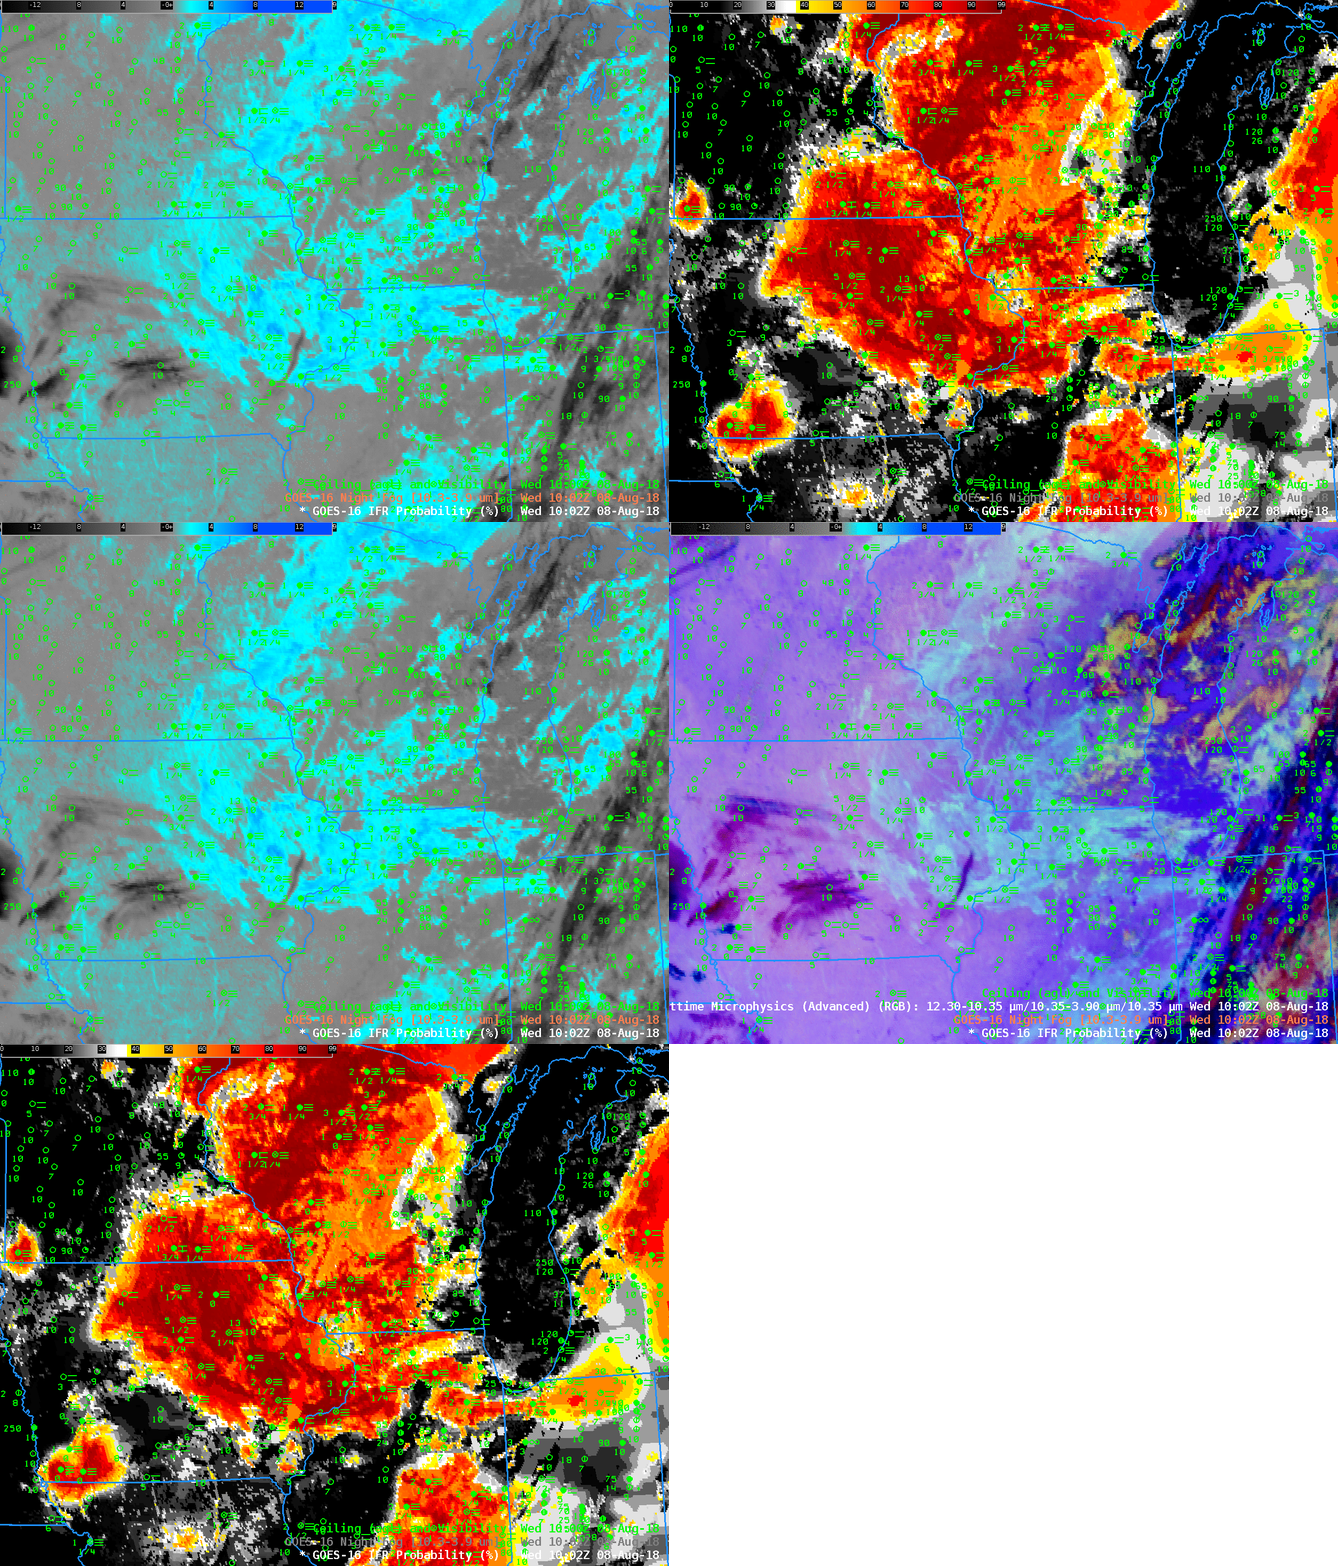
The Night Fog Brightness Temperature Difference (10.3 µm – 3.9 µm) can be used to detect stratus, and that field is also a constituent (the ‘green’ part) of the Advanced Nighttime Microphysics RGB. The animation below compares these two products used to detect stratus with IFR Probability at 1002 UTC on 8 August 2018.  The Night Fog Brightness Temperature Difference fails to highlight regions of fog over central WI (and elsewhere), so neither it nor the RGB give a consistent signal over the entire fog-shrouded region.

Night Fog Brightness Temperature Difference (10.3 µm – 3.9 µm), GOES-R IFR Probability, and Advanced Nighttime Microphysics RGB at 1002 UTC on 8 August 2018 (Click to enlarge)

Detecting Fog under a Pall of Smoke in the Pacific Northwest

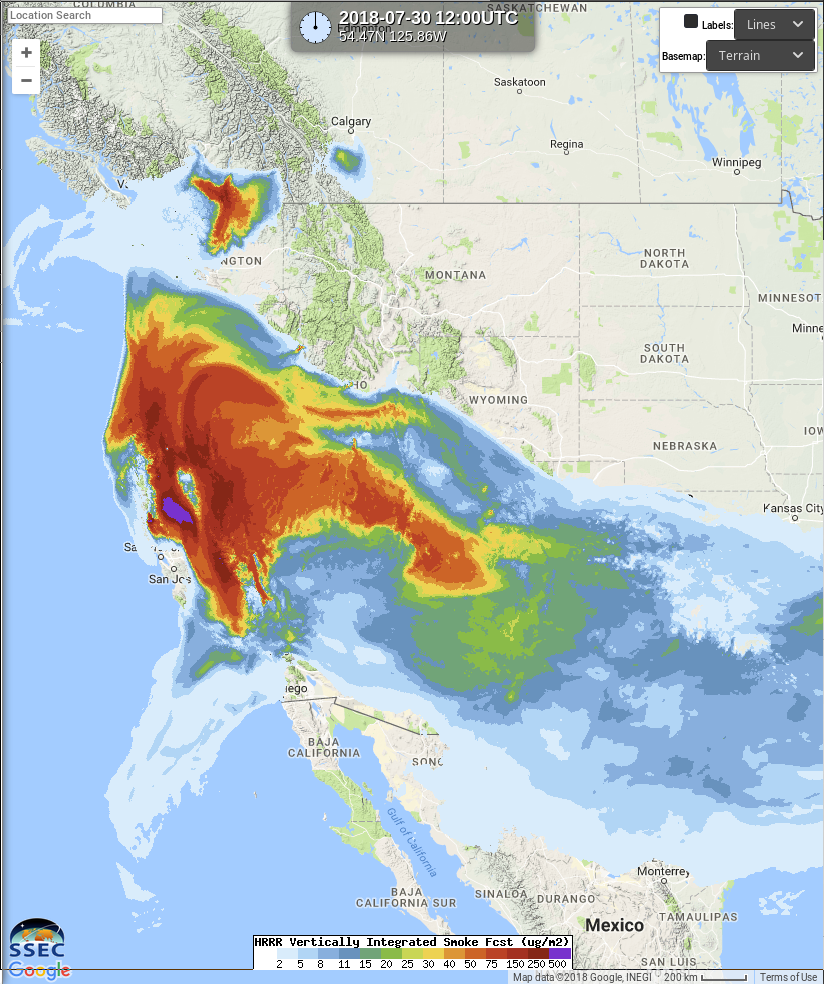
HRRR forecast of Vertically-Integrated Smoke over the Pacific Northwest (for more information see text), forecast valid at 1200 UTC on 30 July 2018 (Click to enlarge)

When smoke covers a geographic region, visible detection of low-level fog is difficult because smoke can scatter or obscure the signal from the low-level clouds.  The image above shows a Vertically Integrated Smoke Forecast from a High-Resolution Rapid Refresh Model simulation in Real Earth (link). Thick smoke was predicted to occur over the coast of Oregon.

The animation below steps through the GOES-R IFR Probability, and then the ‘Blue Band’ (0.47 µm), the ‘Red Band’) (0.64 µm), the ABI channel with the highest spatial resolution, the ‘Veggie Band’ (0.86 µm) and the ‘Snow/Ice Band’ (1.61 µm). Two things of note: Because of the low sun angle, and the enhanced forward-scattering properties of smoke at low sun angle, it is very hard to detect fog through the smoke in the visible wavelengths near Sunrise. As the wavelength of the observation increases, scattering is less of an issue. In addition, smoke is more transparent to longer wavelength radiation. Thus, the cloud edges become more apparent under the smoke in the 0.86 µm and especially the 1.61 µm imagery compared to the visible.
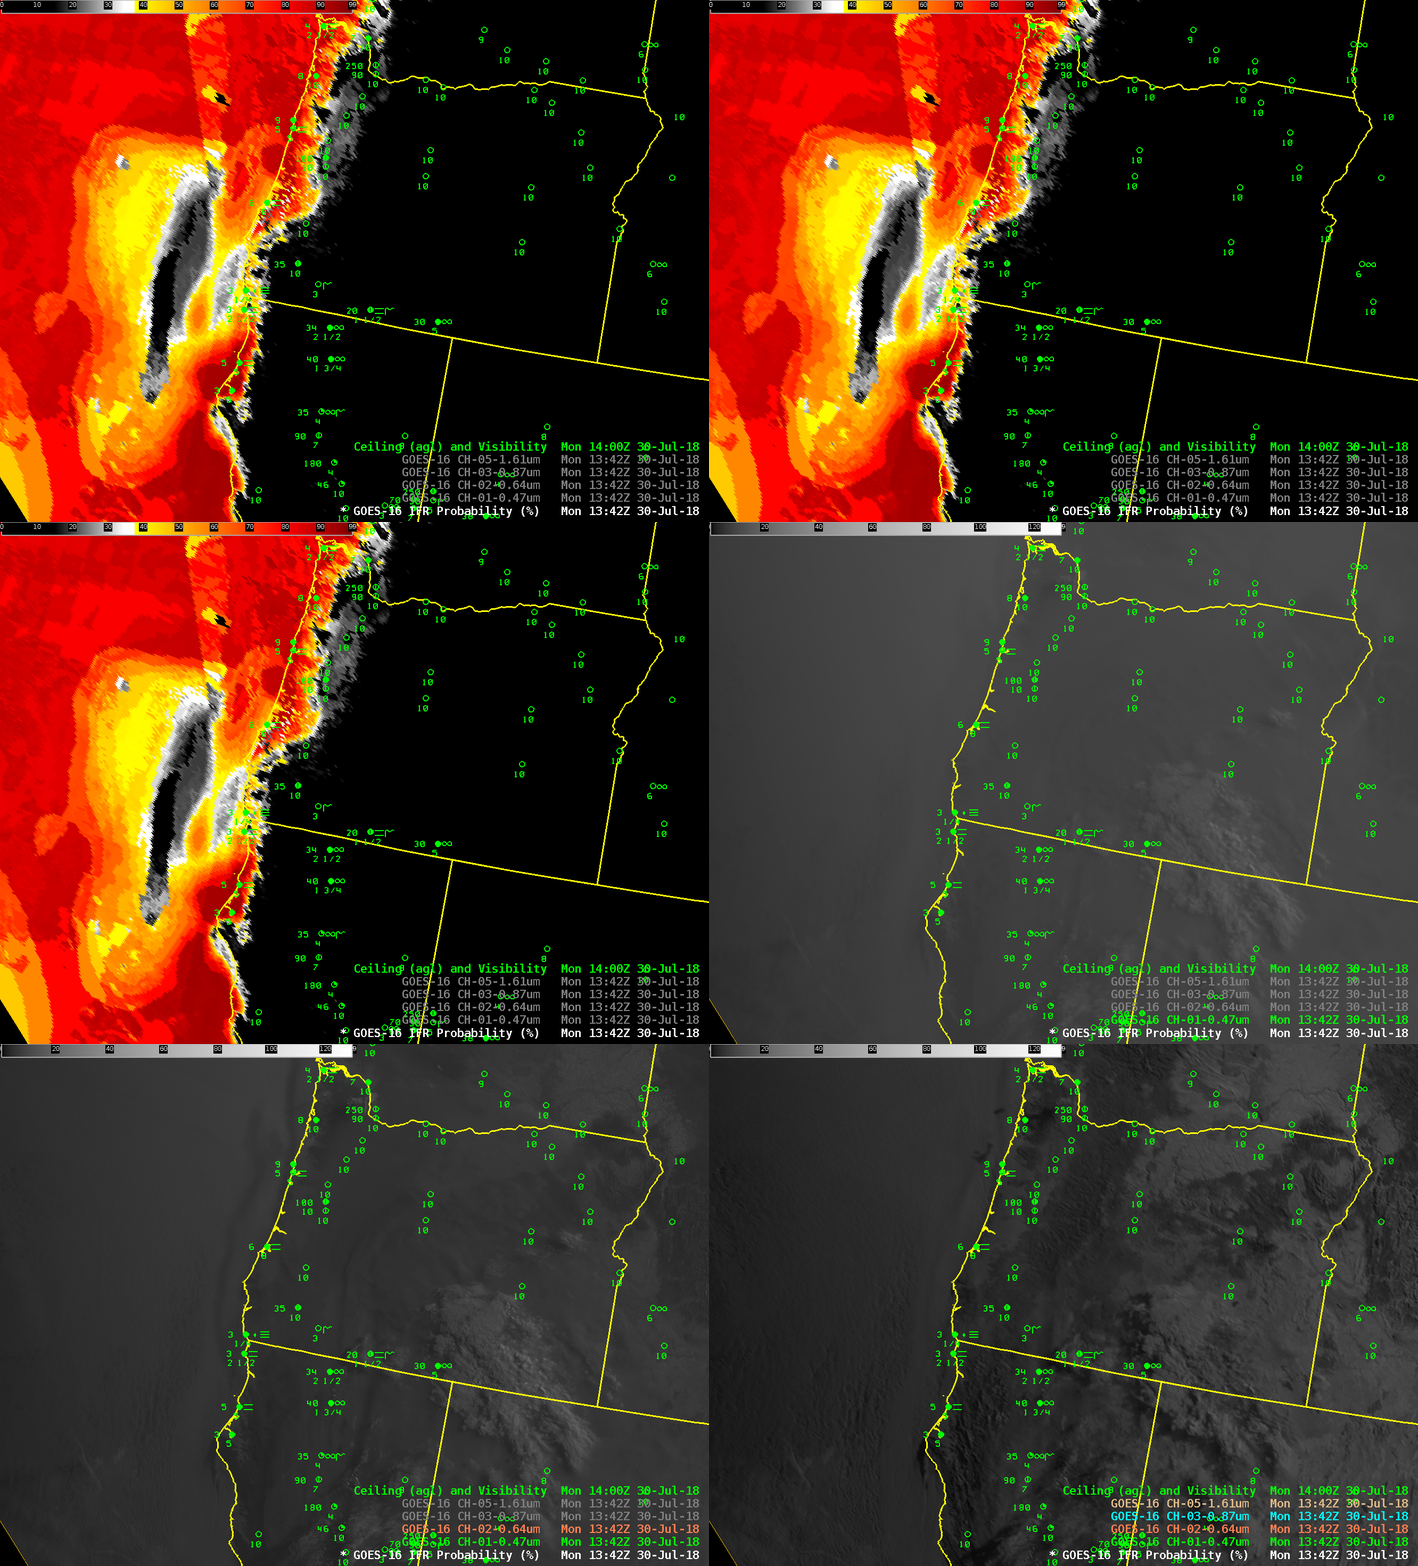
GOES-16 IFR Probability, and GOES-16 Single Bands (Band 1, 0.47 µm, Band 2, 0.64 µm, Band 3, 0.86 µm and Band 5, 1.61 µm) at 1342 UTC on 30 July 2018, along with surface observations of Ceilings, Visibility, and Visibility Restrictions at 1400 UTC. (Click to enlarge)

GOES-16 IFR Probability can indicate the regions of fog and corresponding restrictions in visibility because it relies on longer wavelength observations from GOES-16 (3.9 µm and 10.3 µm, principally) and information about low-level saturation from the Rapid Refresh model.  Smoke is mostly transparent to radiation in the infrared unless it becomes extraordinarily thick  (indeed, that is one reason why smoke is difficult to detect at night);  thus, the brightness temperature difference between the shortwave (3.9 µm)  and longwave (10.3 µm) infrared channels on GOES-16’s ABI can highlight cloud tops made up of water droplets that occur underneath elevated smoke.

As the Sun gets higher in the sky, fog edges beneath the smoke become more apparent because forward scattering decreases.  The animation below of the visible confirms this. In contrast, the fog edge in the IFR Probability is well-represented during the entire animation (although the horizontal resolution of the infrared channels on GOES-16 (at the sub-satellite point) is only two kilometers vs. 1/2-km for the Red Visible).

Note that IFR conditions are also occurring during this animation due to smoke over southwest Oregon.  GOES-R IFR probability detects only cloud-forced IFR conditions, but not IFR conditions because of thick smoke only.  Again, this is because smoke detection in the infrared is a challenge for ABI Channels and Rapid Refresh Model output does not as yet predict visibility restrictions due to smoke.
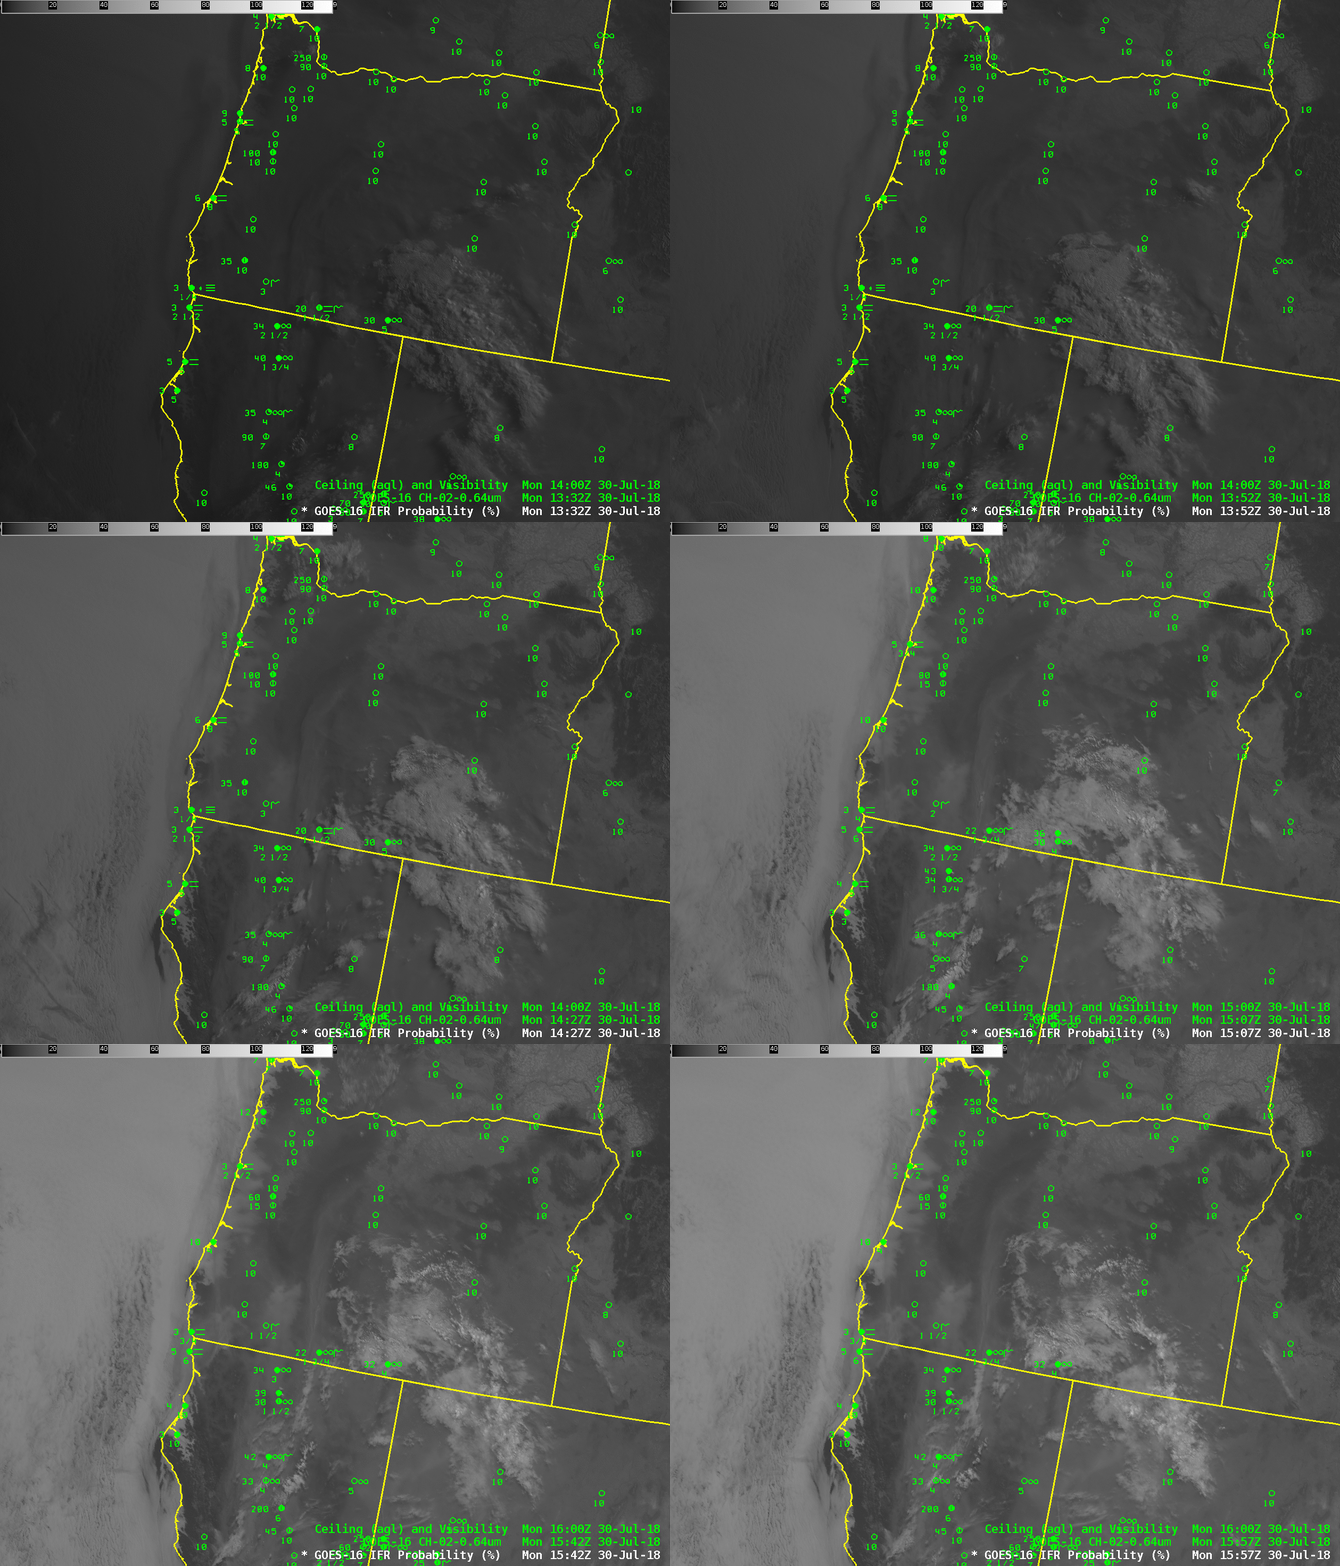
GOES-16 ABI ‘Red Visible’ Imagery (0.64 µm), 1342 – 1557 UTC on 30 July 2018, along with surface observations of Ceilings, Visibility, and Visibility Restrictions (Click to enlarge)
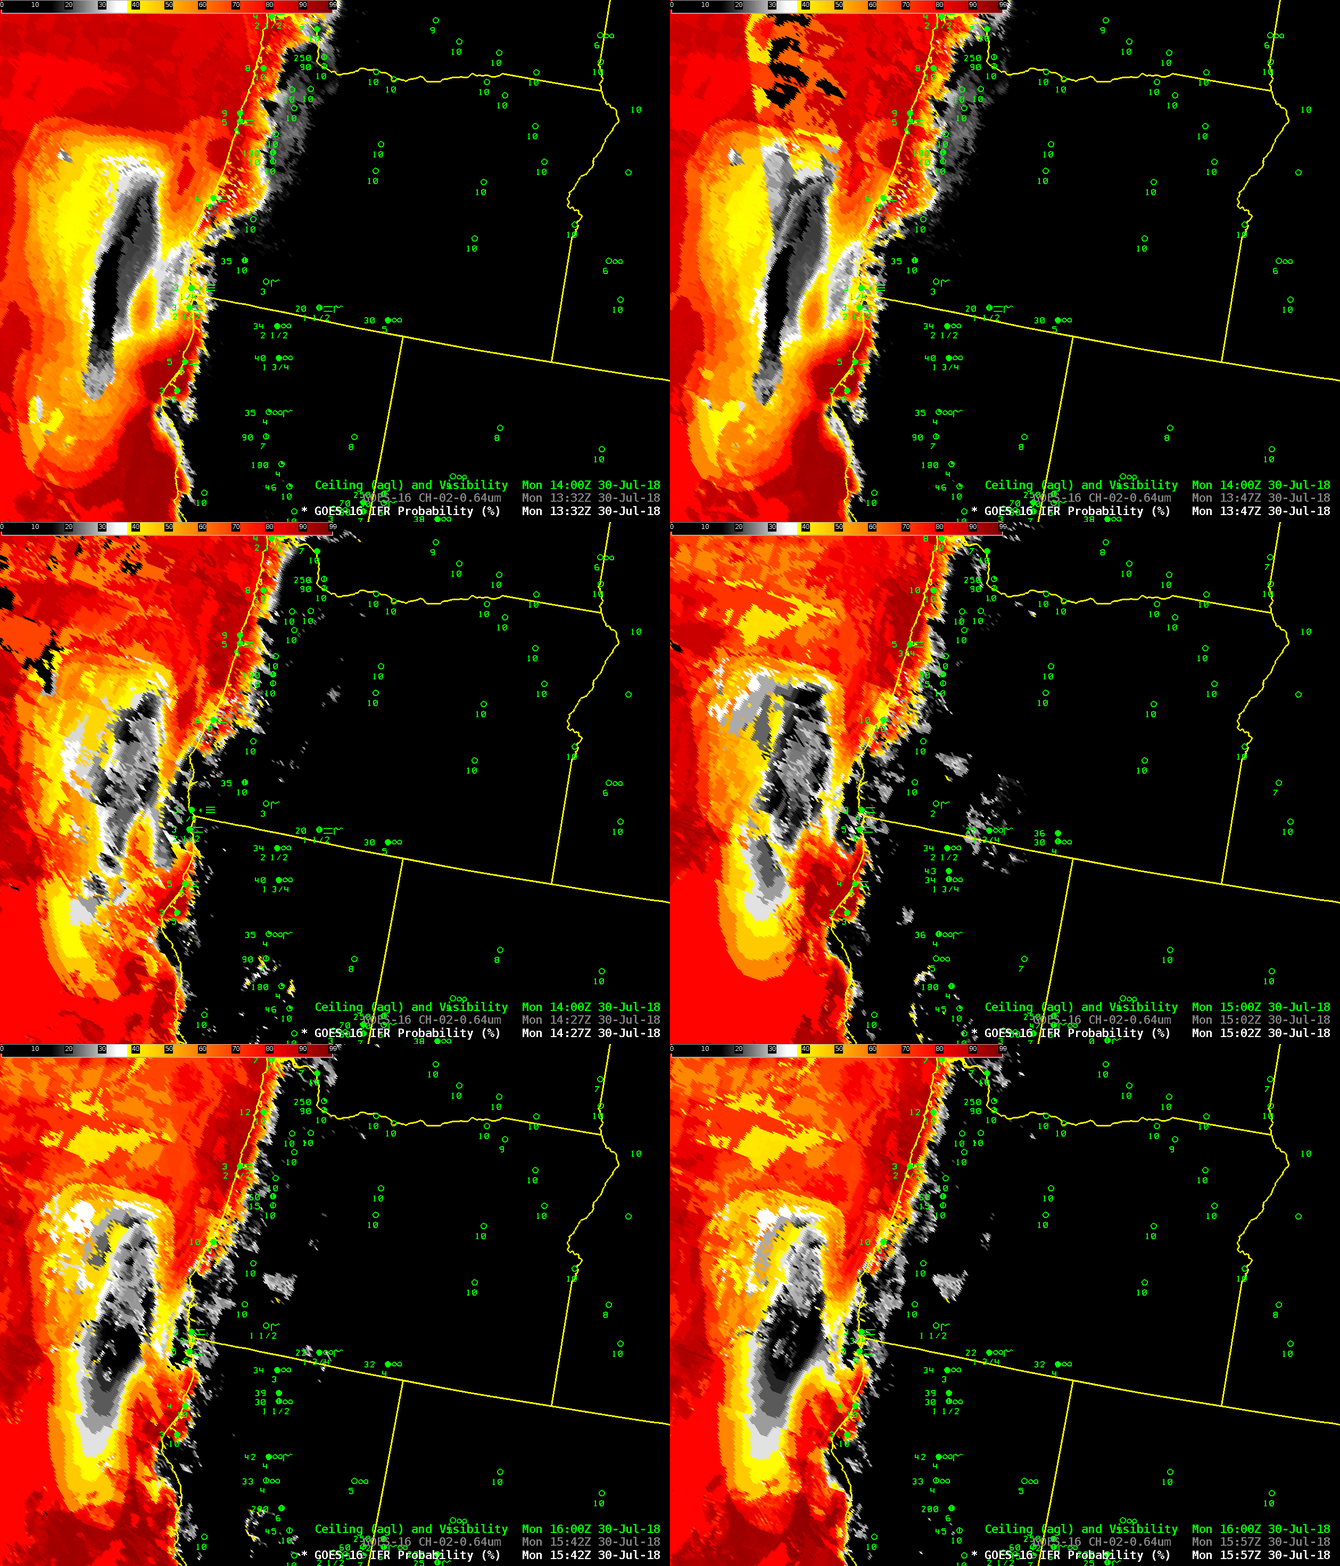
GOES-16 IFR Probability, 1342 – 1557 UTC on 30 July 2018, along with surface observations of Ceilings, Visibility, and Visibility Restrictions (Click to enlarge)

IFR Probability indicating a Cold Front

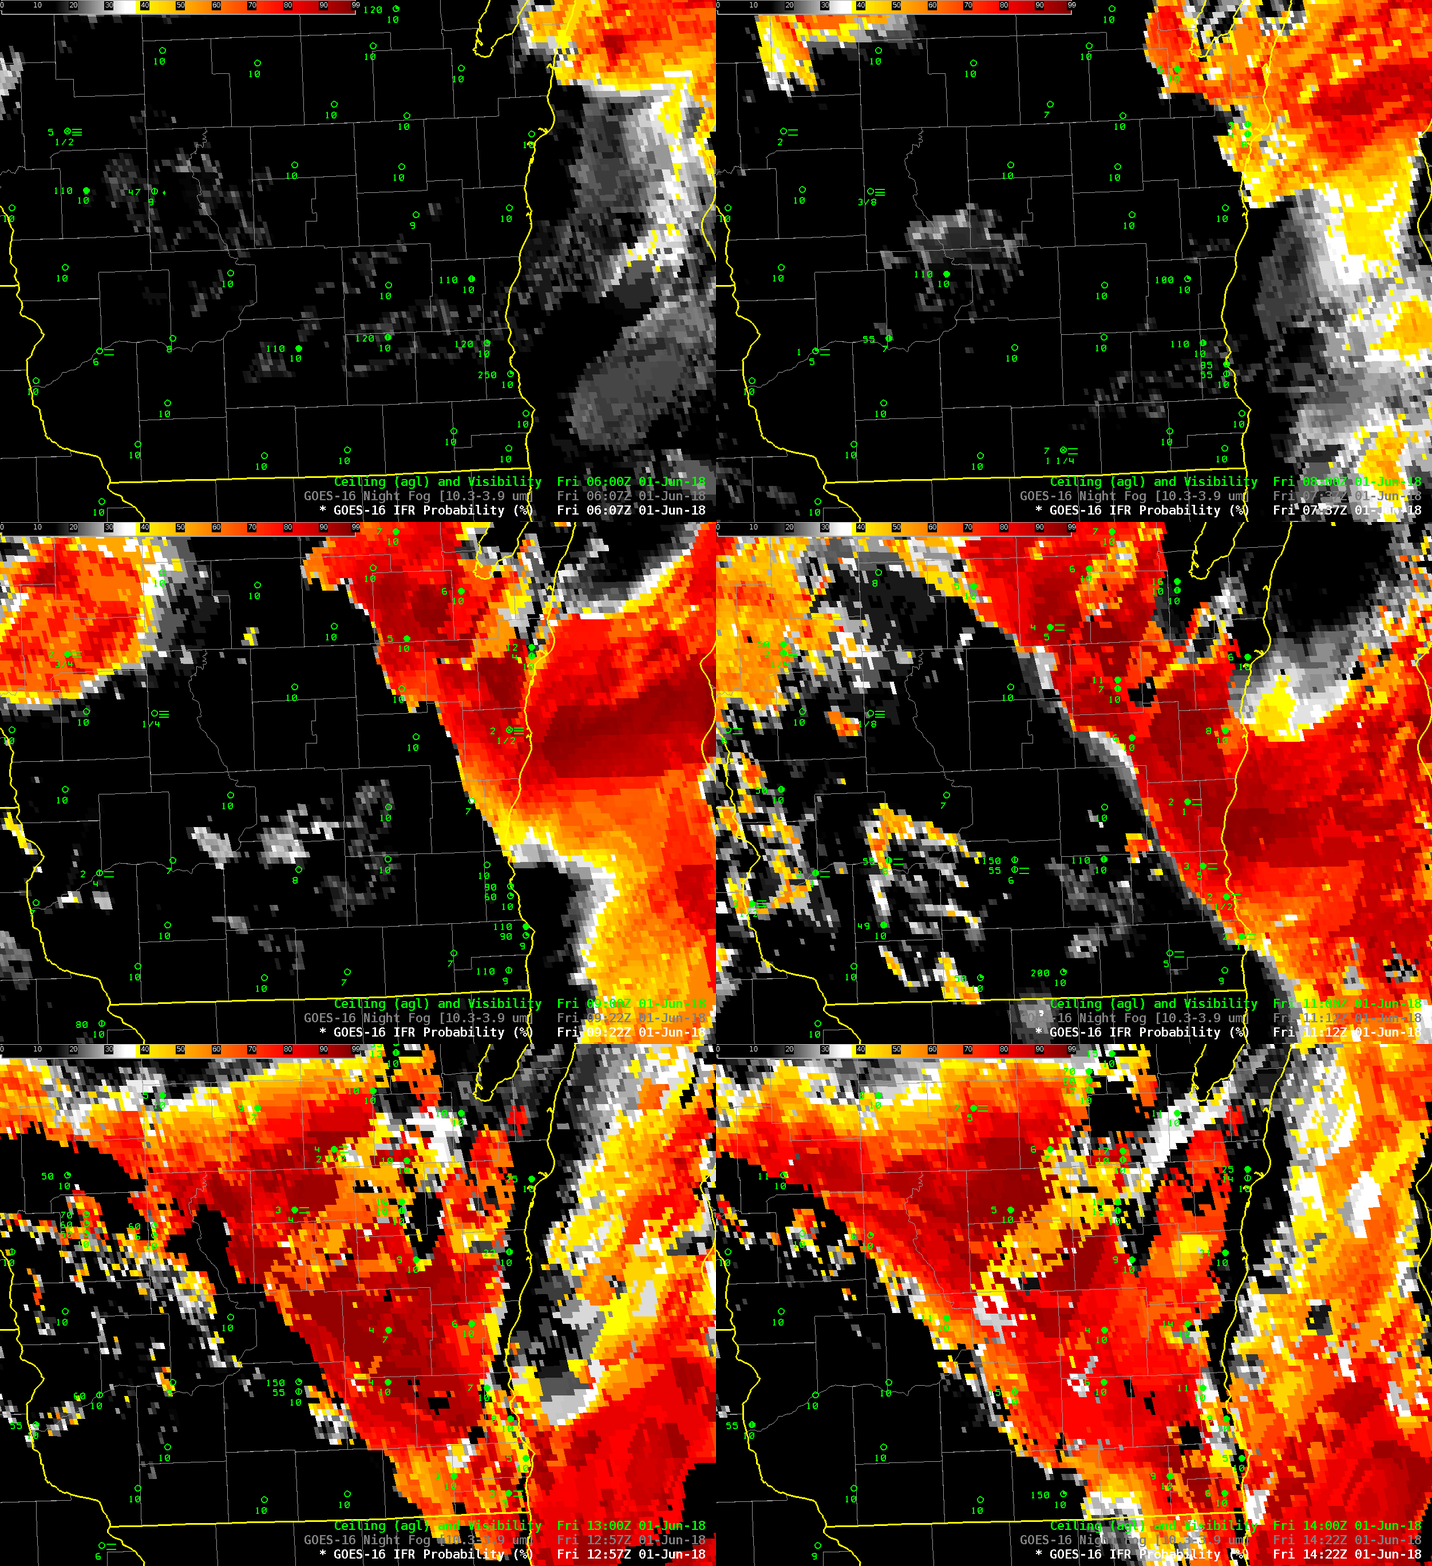
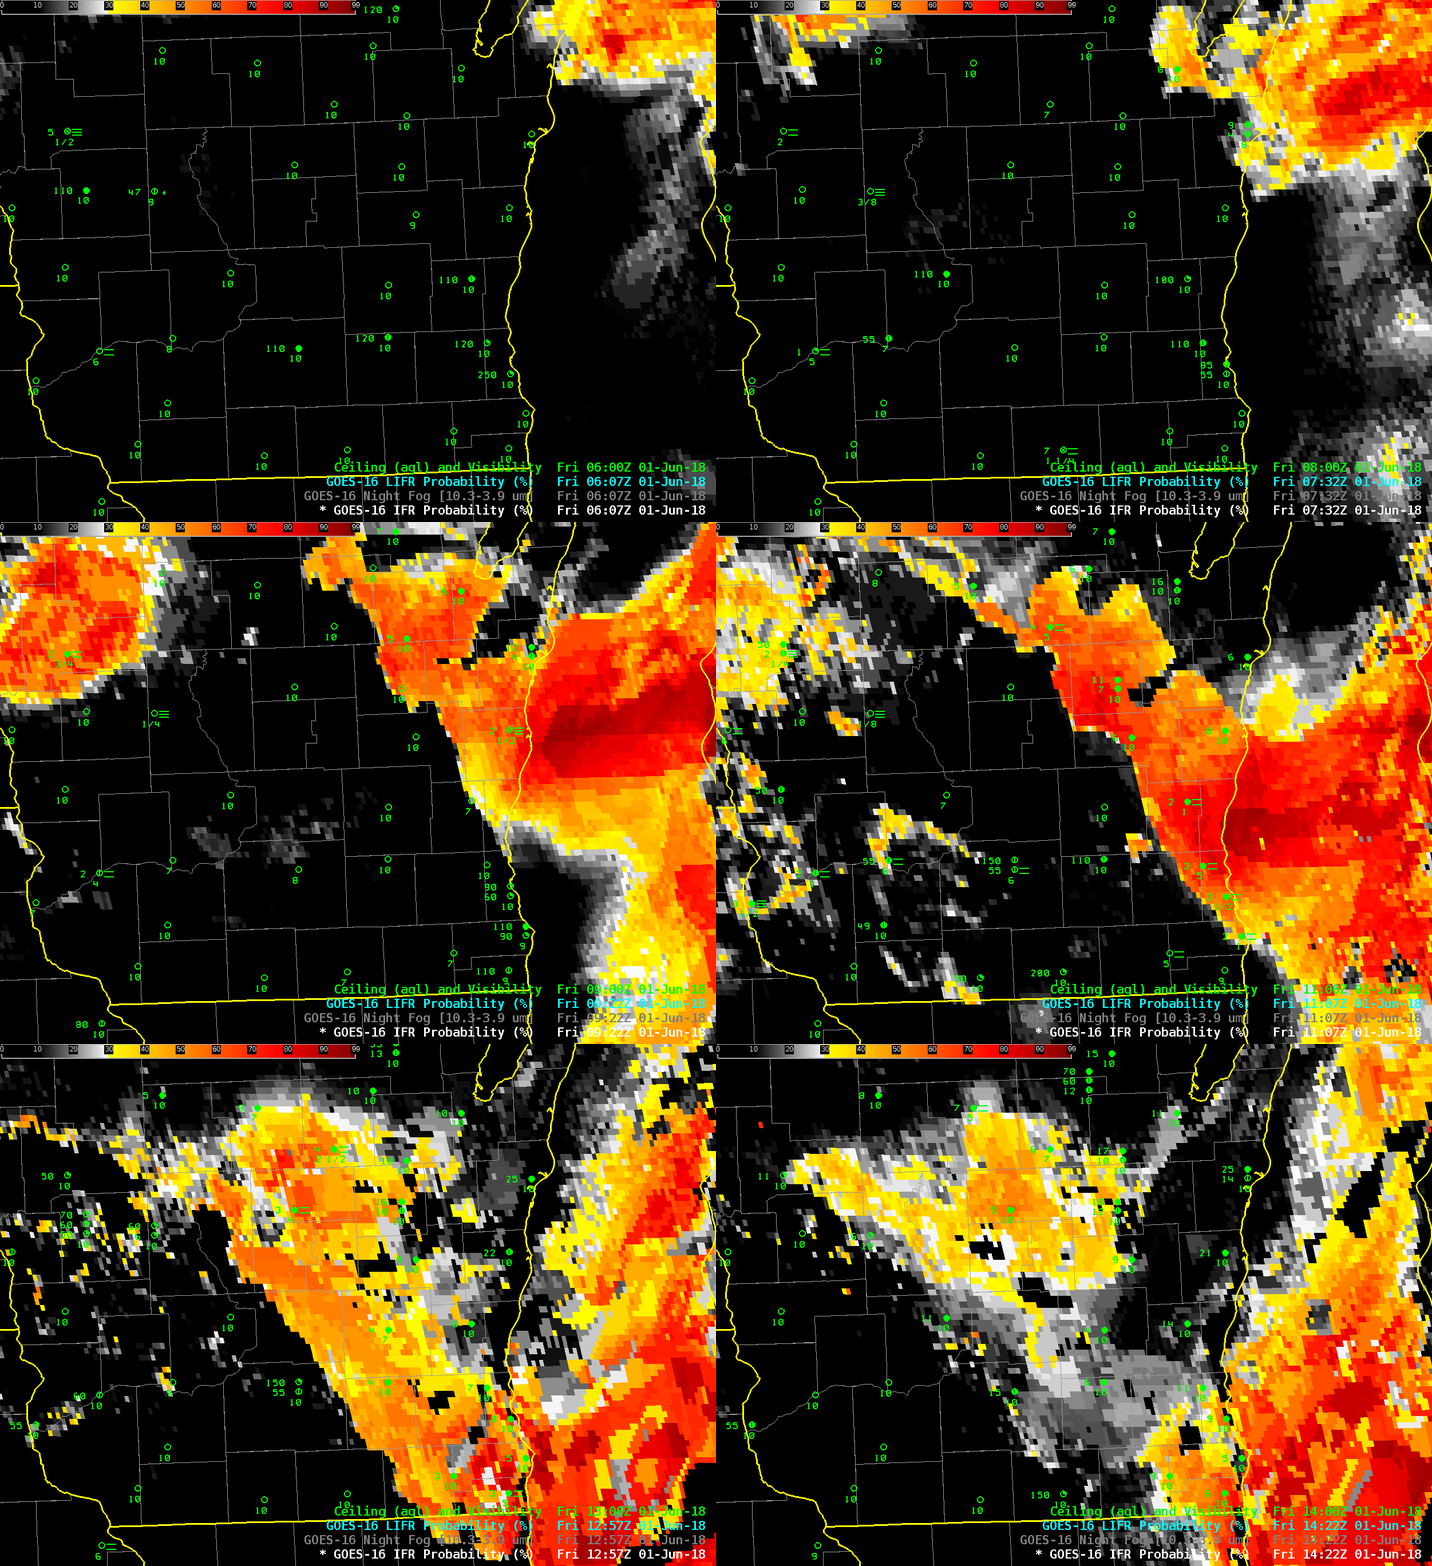
GOES-16 IFR Probability Fields, 0607-1422 UTC on 1 June 2018 (Click to enlarge)

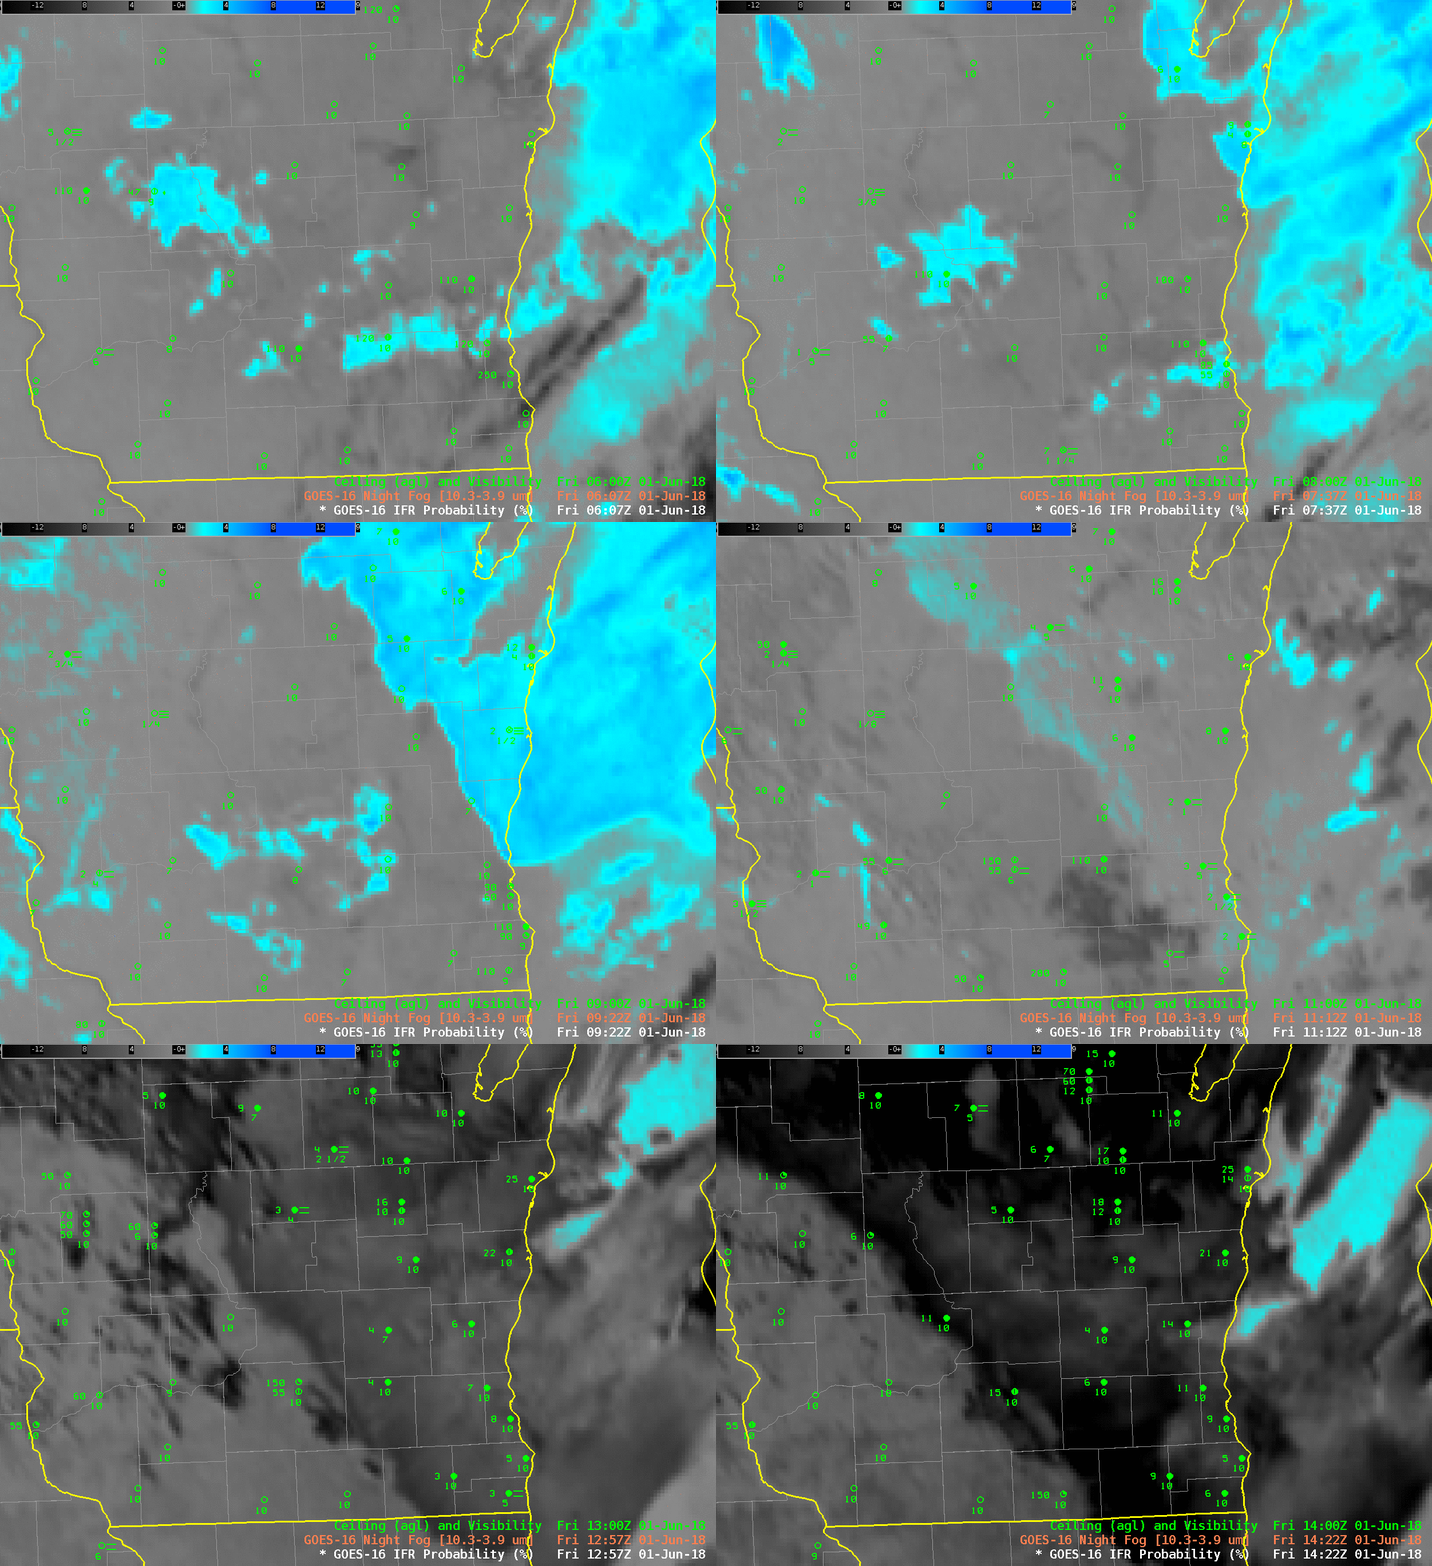
The animation above shows increasing amounts of IFR Probability moving southward and westward over eastern Wisconsin as a cold front with Lake-influenced air pushed inward. Ceilings lowered and visibilities reduced as the front passed, and the IFR probability field’s motion could be used to predict when the temperature change occurred. High clouds did not impede the satellite view of this event, so the brightness temperature difference field, below, also showed the stratus deck as it moved inland. Missing from the satellite-only view of this event, of course, is the information on whether the cloud is extending to the surface. Furthermore, the cloud signal vanishes from the brightness temperature difference product at sunrise, as it flips sign from positive at night to negative during the day as amounts of reflected solar 3.9 µm radiation increase.

GOES-16 Night Fog Brightness Temperature Difference (10.3 µm – 3.9 µm), 0607-1422 UTC on 1 June 2018 (Click to enlarge)

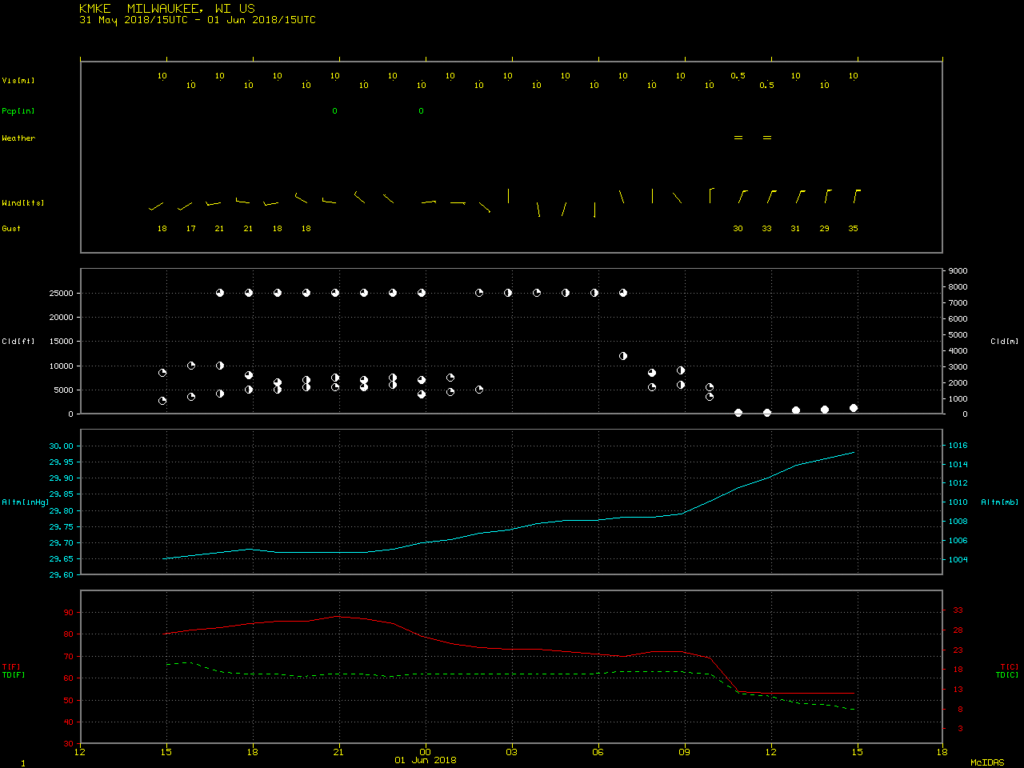
A Meteorogram for Milwaukee for the 24 hours ending at 1500 UTC on 1 June shows the dramatic change in ceilings, temperature and wind between 10 and 11 UTC on 1 June. A similar meteorogram for Madison (here), shows a less dramatic change at 1400 UTC on 1 June.

Meteorogram for KMKE (Mitchell International Airport, Milwaukee, WI) from 1500 UTC 31 May through 1500 UTC 1 June. Note the abrupt change in surface conditions at 1100 UTC on 1 June as the front moved through (Click to enlarge)

An animation of Low IFR Probabilities is shown below.

GOES-16 Low IFR Probability Fields, 0607-1422 UTC on 1 June 2018 (Click to enlarge)

Fog over Kansas

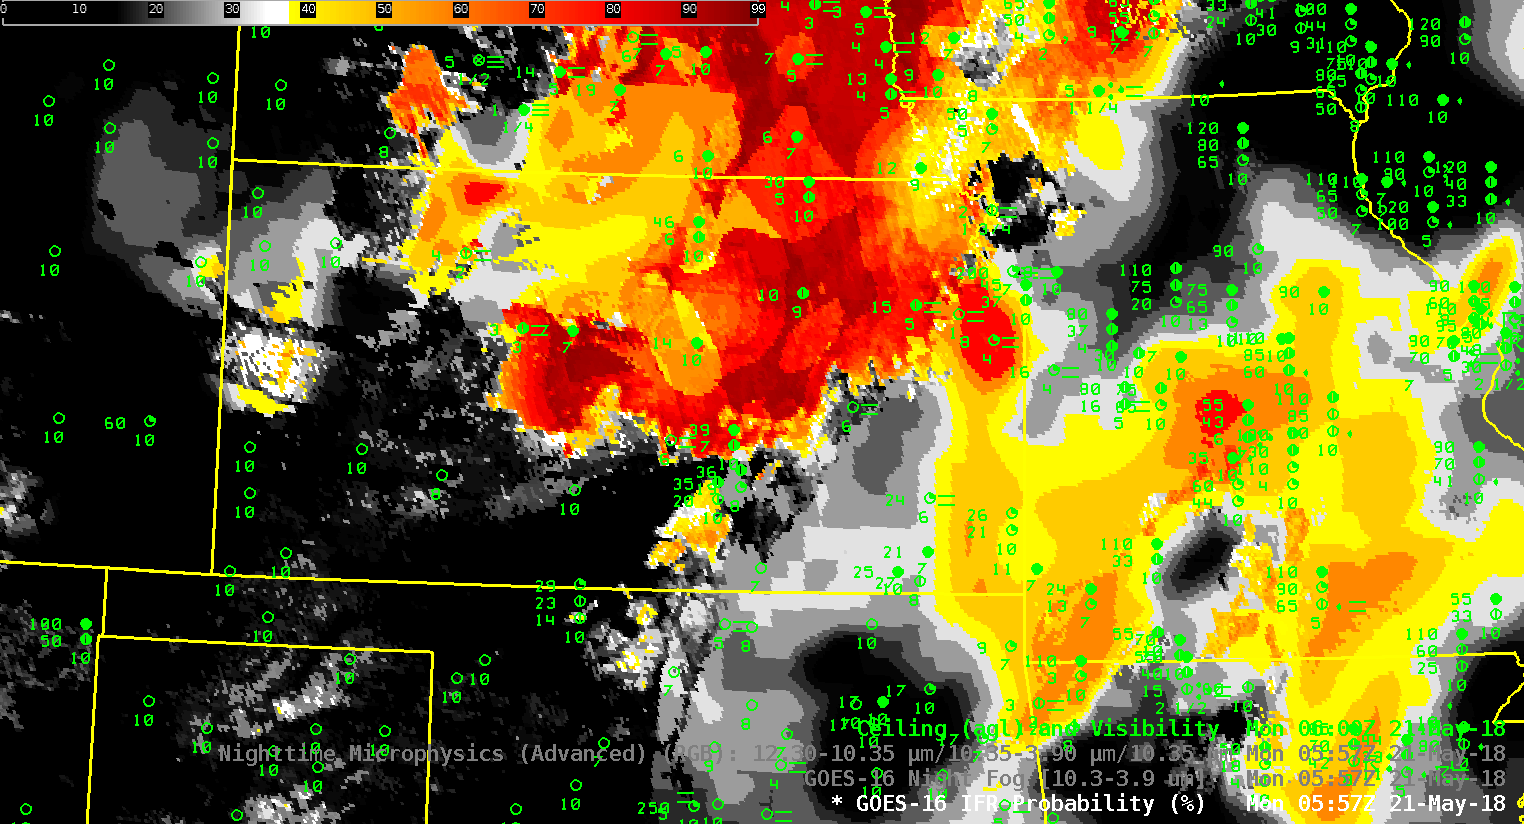
GOES-16 IFR Probability fields, 0557 – 1157 UTC on 21 May 2018 (Click to animate)

Dense Fog Advisories were issued over Kansas by the Goodland KS Forecast Office on Monday 21 May 2018. The IFR Probability field, above, computed using GOES-16 and Rapid Refresh Model output shows the development of fog as it developed westward across Kansas. (Surface winds in the region were light (source); Plot 2 (from here)).

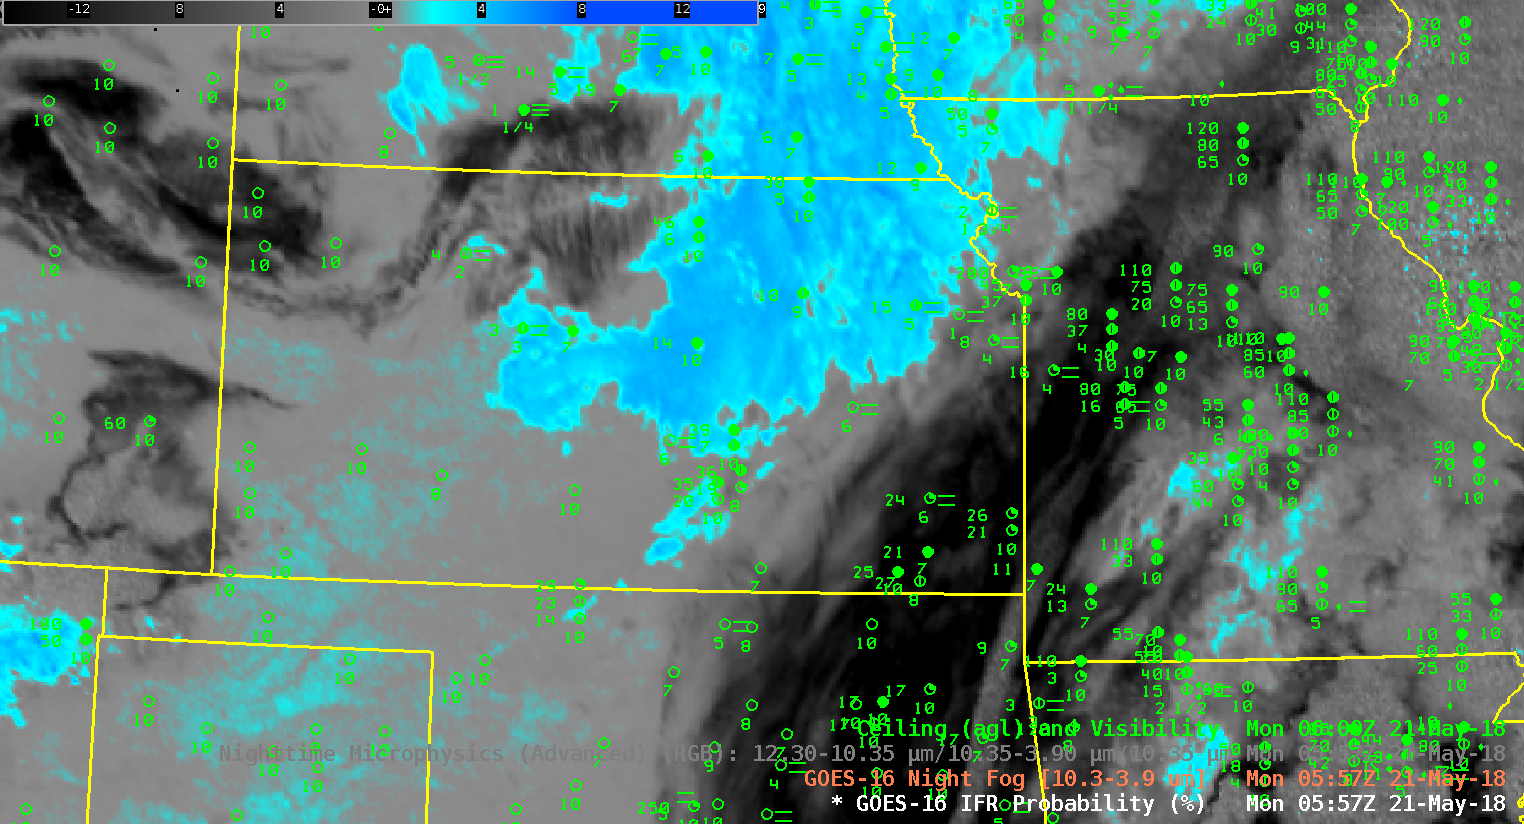
High clouds around Kansas impeded the detection of low stratus/fog from satellite in some regions.  Those regions benefit from the fused data methods of IFR Probability:  where satellite data alone cannot be used, model data can give important information.  Consider the ‘Night Fog’ Brightness Temperature Difference field, below (10.3 µm – 3.9 µm) for the same period as shown above.  High clouds are apparent over southeast Kansas and Missouri, and also occasionally over Nebraska.  High clouds over McCook, Nebraska, just north of the Kansas-Nebraska state line in southwest Nebraska, prevent the satellite detection of fog even as the ceilings and visibilities decrease. (Here is a toggle of the three products at 1002 UTC).

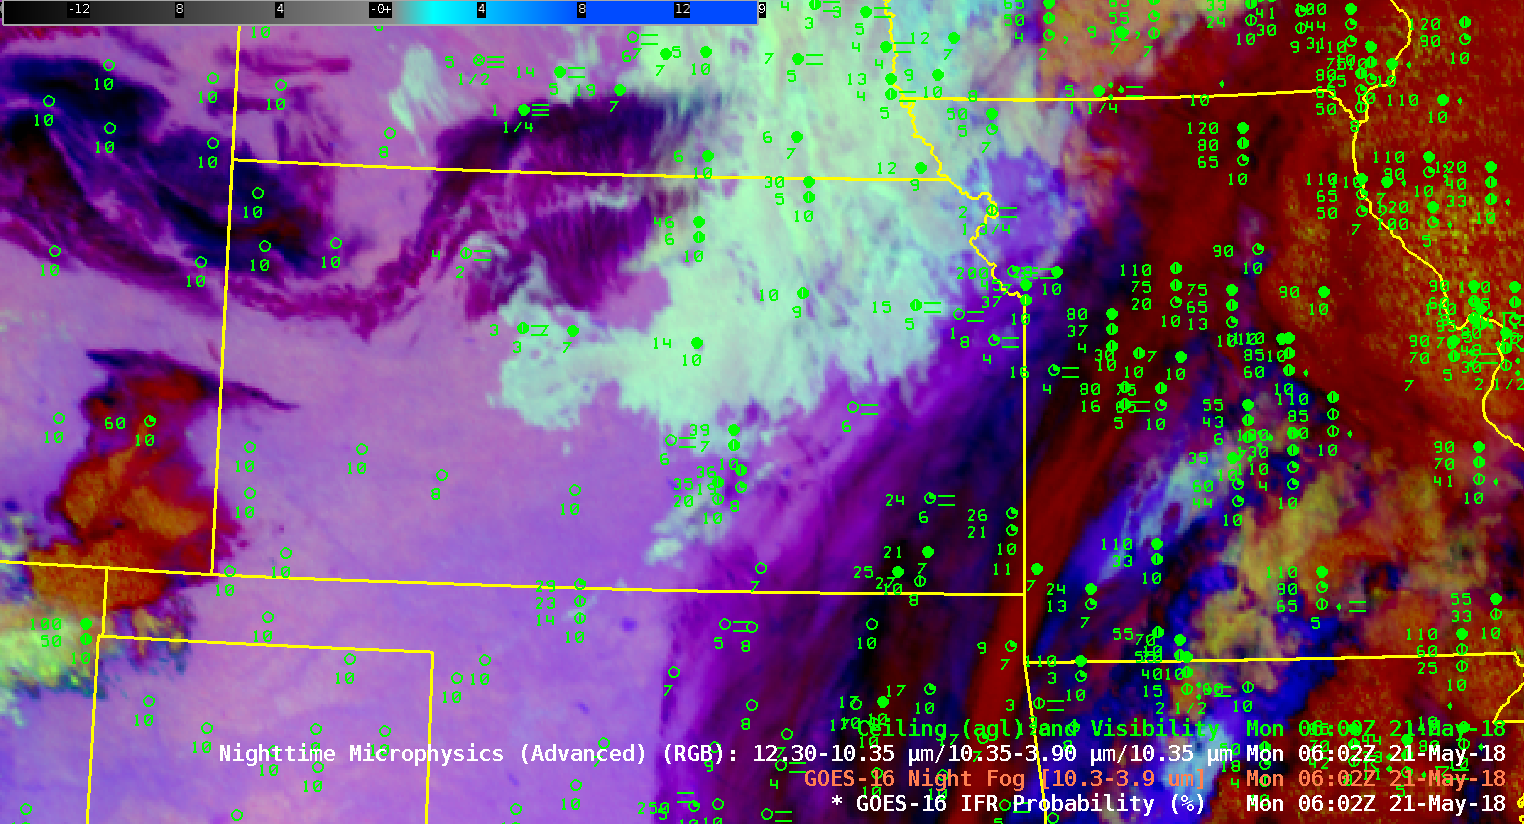
Similarly, IFR or near IFR conditions develop over southwestern Missouri, but a cirrus shield there means that Brightness Temperature Difference (10.3 µm – 3.9 µm) fields, and the Nighttime Microphysics RGB (that relies on the Brightness Temperature Difference field) cannot observe the low clouds.

GOES-16 ‘Night Fog’ Brightness Temperature Difference (10.3 µm – 3.9 µm), 0557 – 1157 UTC on 21 May 2018 (Click to animate)

GOES-16 Nighttime Microphysics RGB, 0557 – 1157 UTC on 21 May 2018 (Click to animate)

When you use a product to ascertain the presence of fog/low stratus, be certain that you understand its limitations.

Fog in the Canadian Maritimes

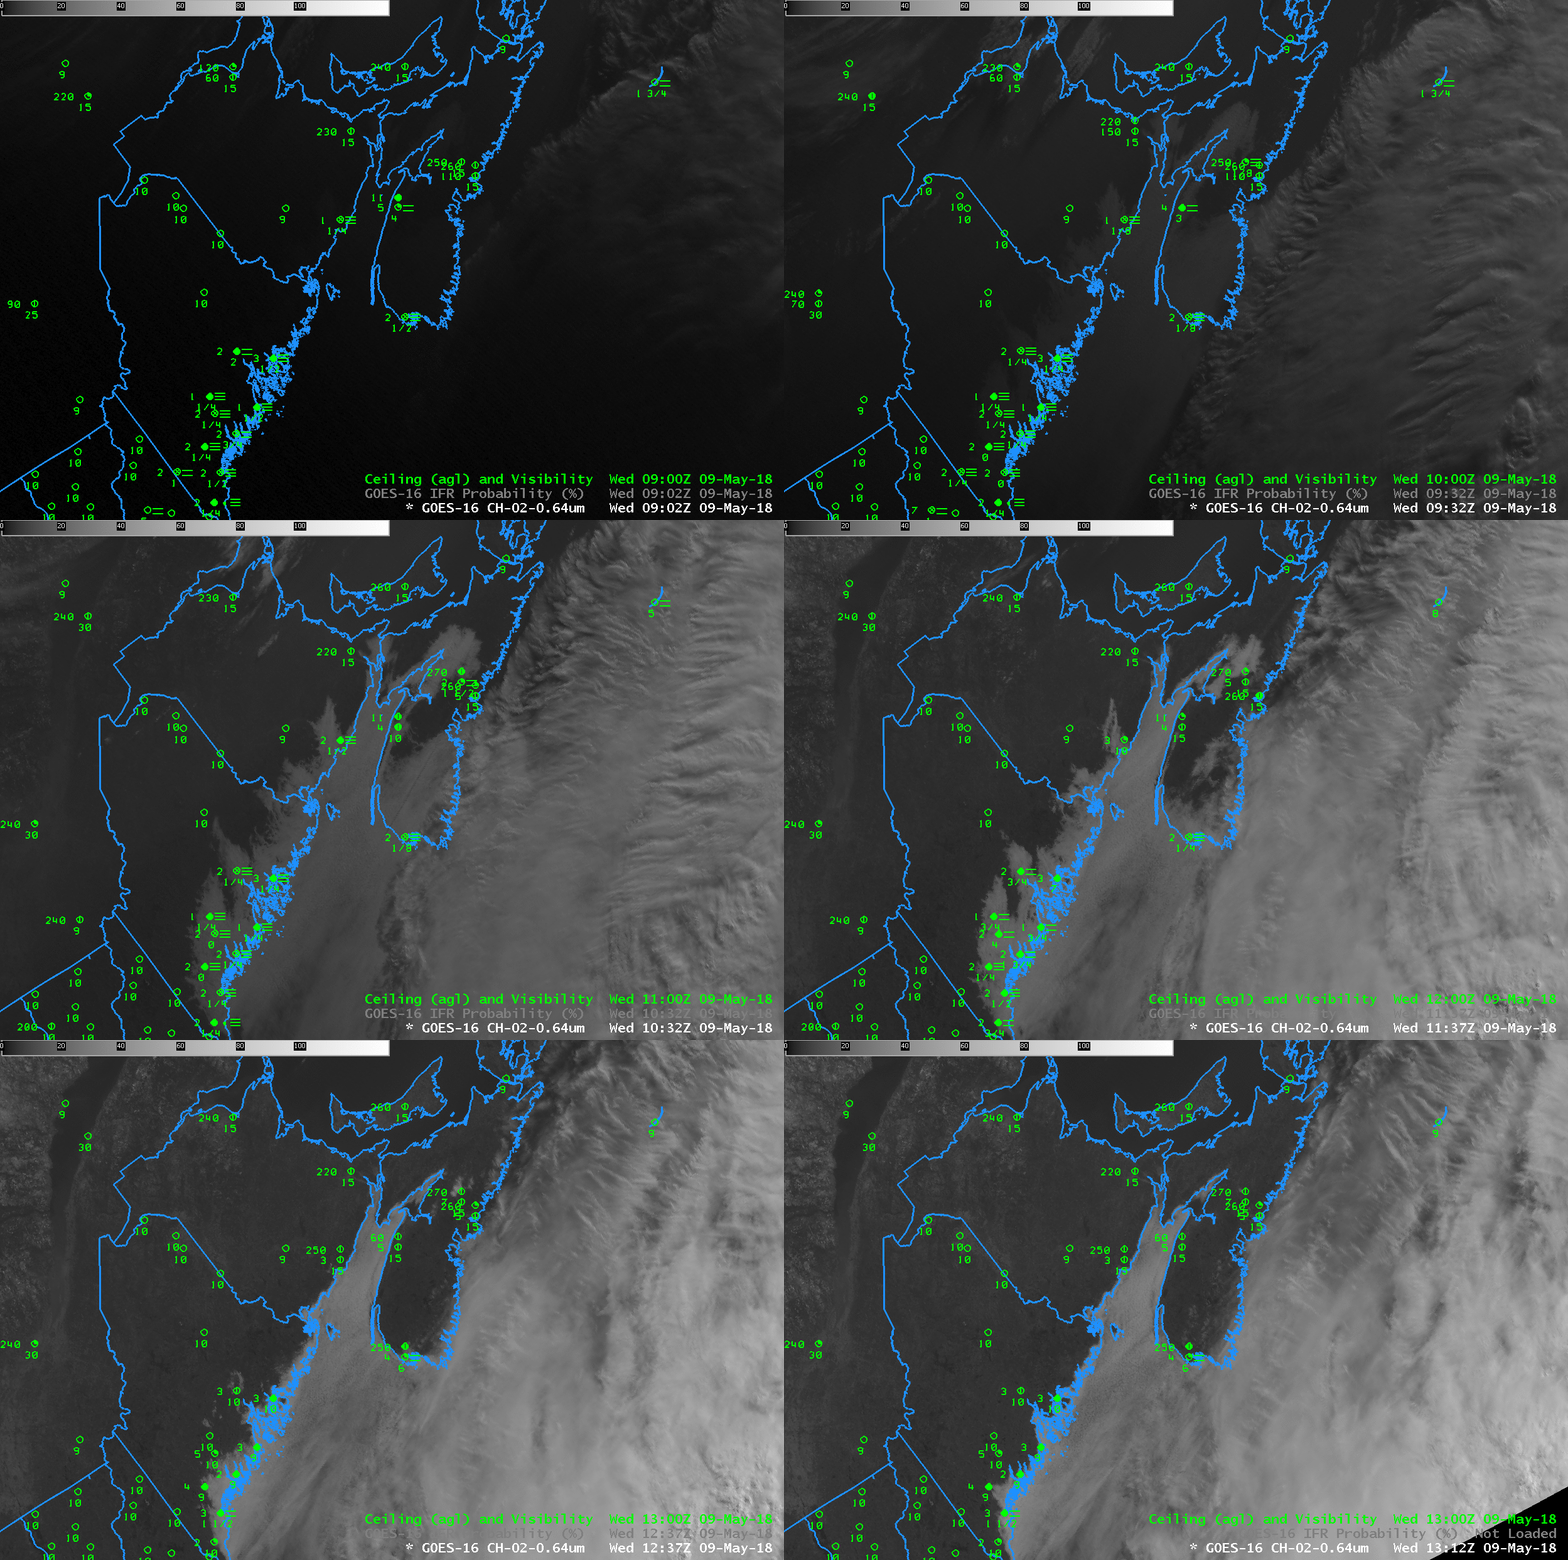
GOES-16 ABI Band 2 (0.64 µm) from 0902-1312 UTC on 9 May 2018 (Click to enlarge)

GOES-16 Visible Imagery on the morning of 9 May 2018 shows the steady erosion of fog in/around the Bay of Fundy, and along coastal Maine.  The default 5-minute temporal cadence with the CONUS GOES-16 sector allows for a precise observation for when coastal fog will clear.

The satellite view of the fog in the bay was unobstructed by high clouds.  (except to the east of Nova Scotia, where a cirrus shield is apparent in the visible animation above, and in animation below)    Thus, the GOES-16 Night Fog Brightness Temperature Difference field (10.3 µm- 3.9 µm), below, could ably capture the fog’s presence and evolution.  The animation of that product, below, shows how the signal changes at sunrise as reflected solar 3.9 µm radiation overwhelms the brightness temperature difference (driven at night by differences in emissivity at 3.9 and 10.3 µm from cloud droplets): the sign flips.  Because the fog was captured in the Night Fog Brightness Temperature Difference, it was also present in the Nighttime Microsphysics RGB Composite (here), although the color associated with fog  changes as the sun rises, and clear skies also allowed the Day Snow Fog RGB Product to show the fog during the day (here).

None of the Satellite-based products can provide information on the likelihood of fog over the ocean to the east of Nova Scotia, however, because the presence of cirrus clouds there prevents the satellite from viewing low clouds.  What products can help with that?

GOES-16 ABI Night Fog Brightness Temperature Difference (10.3 µm – 3.9 µm) from 0817-1312 UTC on 9 May 2018 (Click to enlarge)

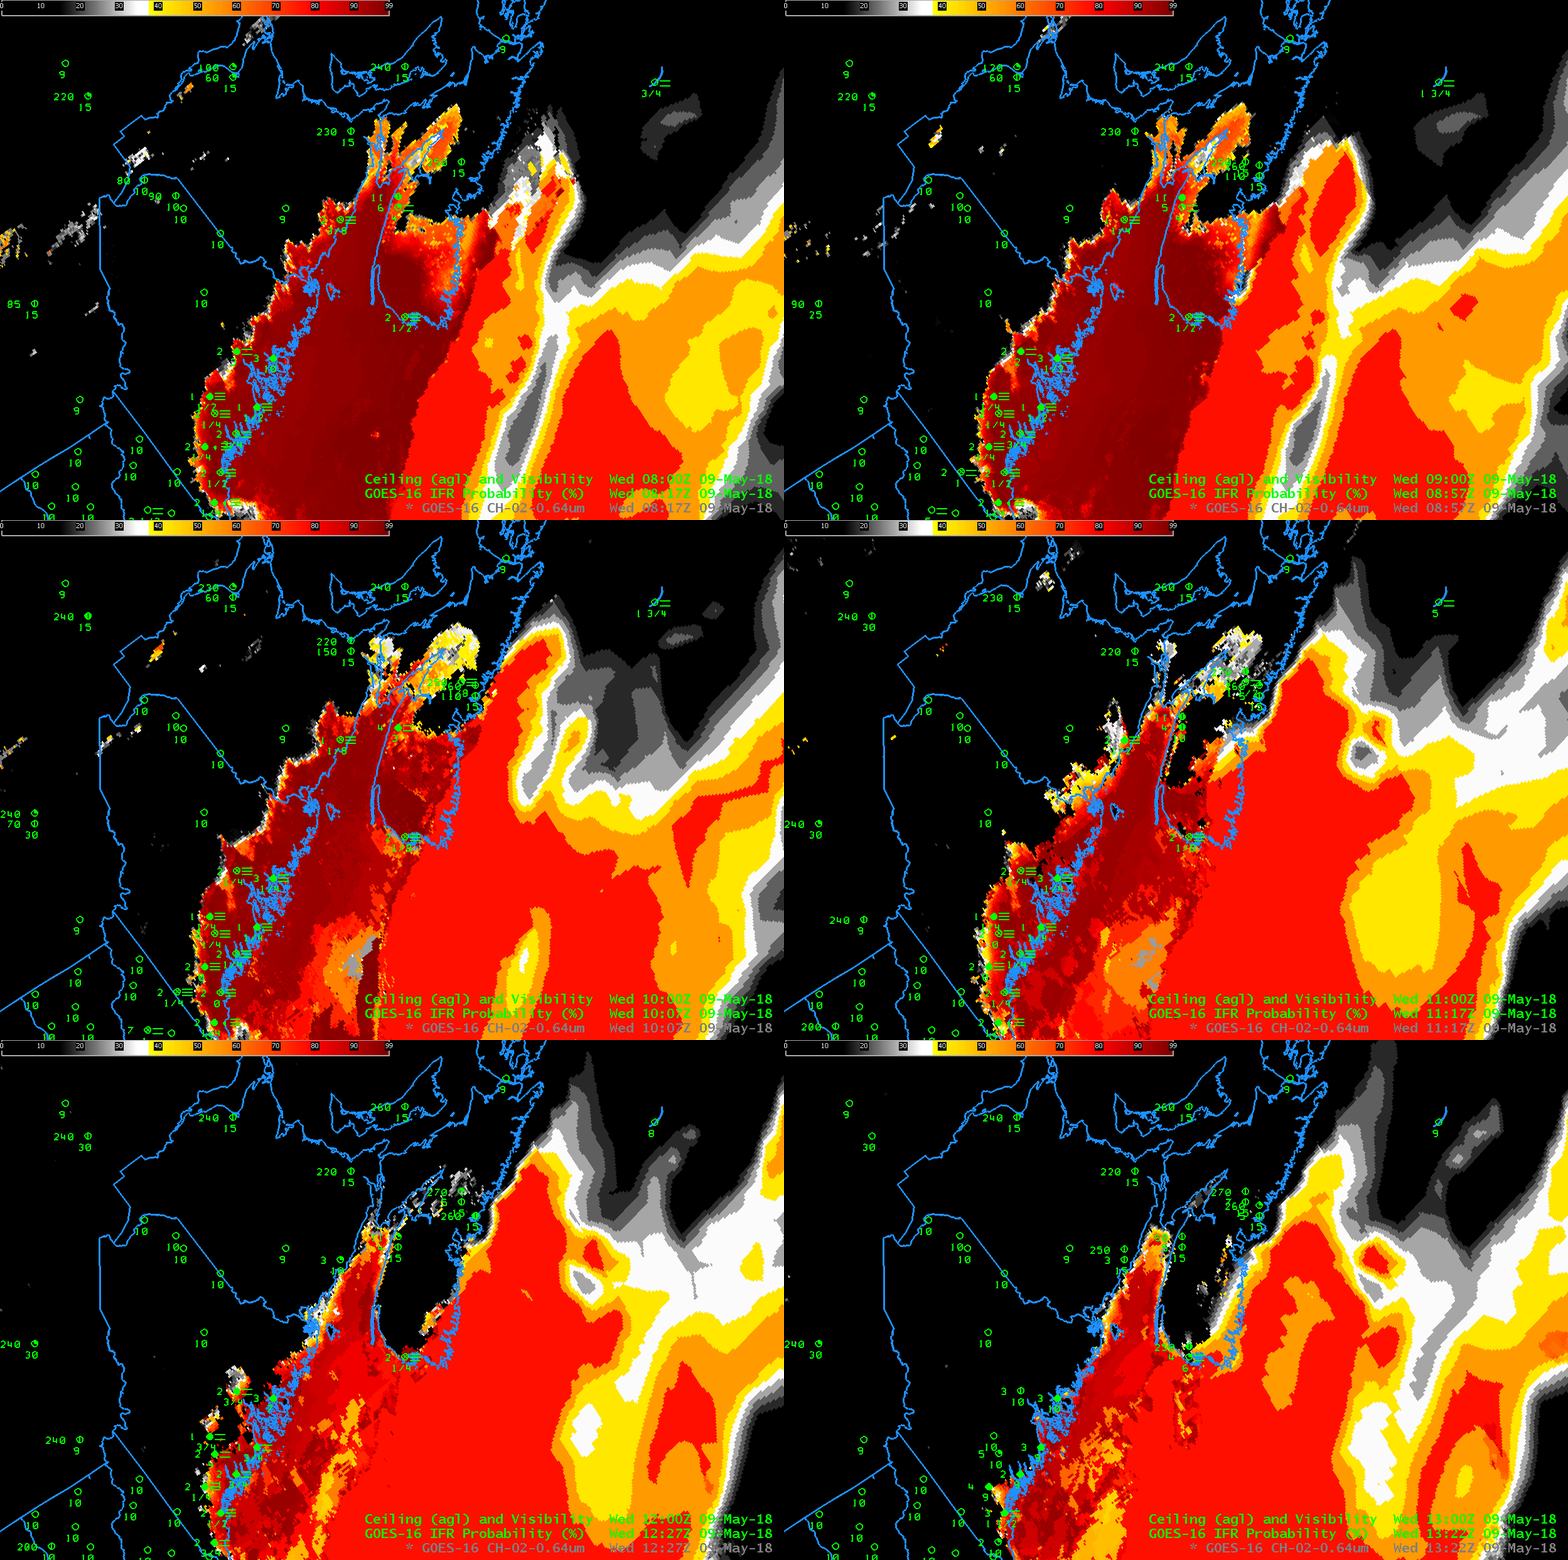
GOES-16 IFR Probability fields, below, combine together satellite and model information to determine where IFR Conditions are most likely.  Very high probabilities exist where other satellite fog detection products suggest the presence of fog/low stratus (and where surface observations confirm the presence of fog).  But there are also high probabilities over the ocean east of Nova Scotia where satellite-only fog detection fails because of the presence of high clouds;  this large signal is derived from Rapid Refresh data there that suggests low-level saturation. IFR Probability combines the strengths of both satellite data and model output to provide useful information to a forecaster.

GOES-16 IFR Probability (10.3 µm – 3.9 µm) from 0817-1322 UTC on 9 May 2018

(Thanks to Paul Ford, ECC Canada, for alerting us to this event)

Added: The GOES-16 ABI Band 3 (0.86 µm) “Veggie” Band, which has great land/sea contrast, shows the fog encroaching into the Bay of Fundy during the day on 8 May. Note in particular how the low clouds race up the west coast of Nova Scotia near sunset.

GOES-16 ABI Band 3 (0.86 µm) from 1512-2257 UTC on 8 May 2018 (Click to enlarge)

Fog over the mid-South

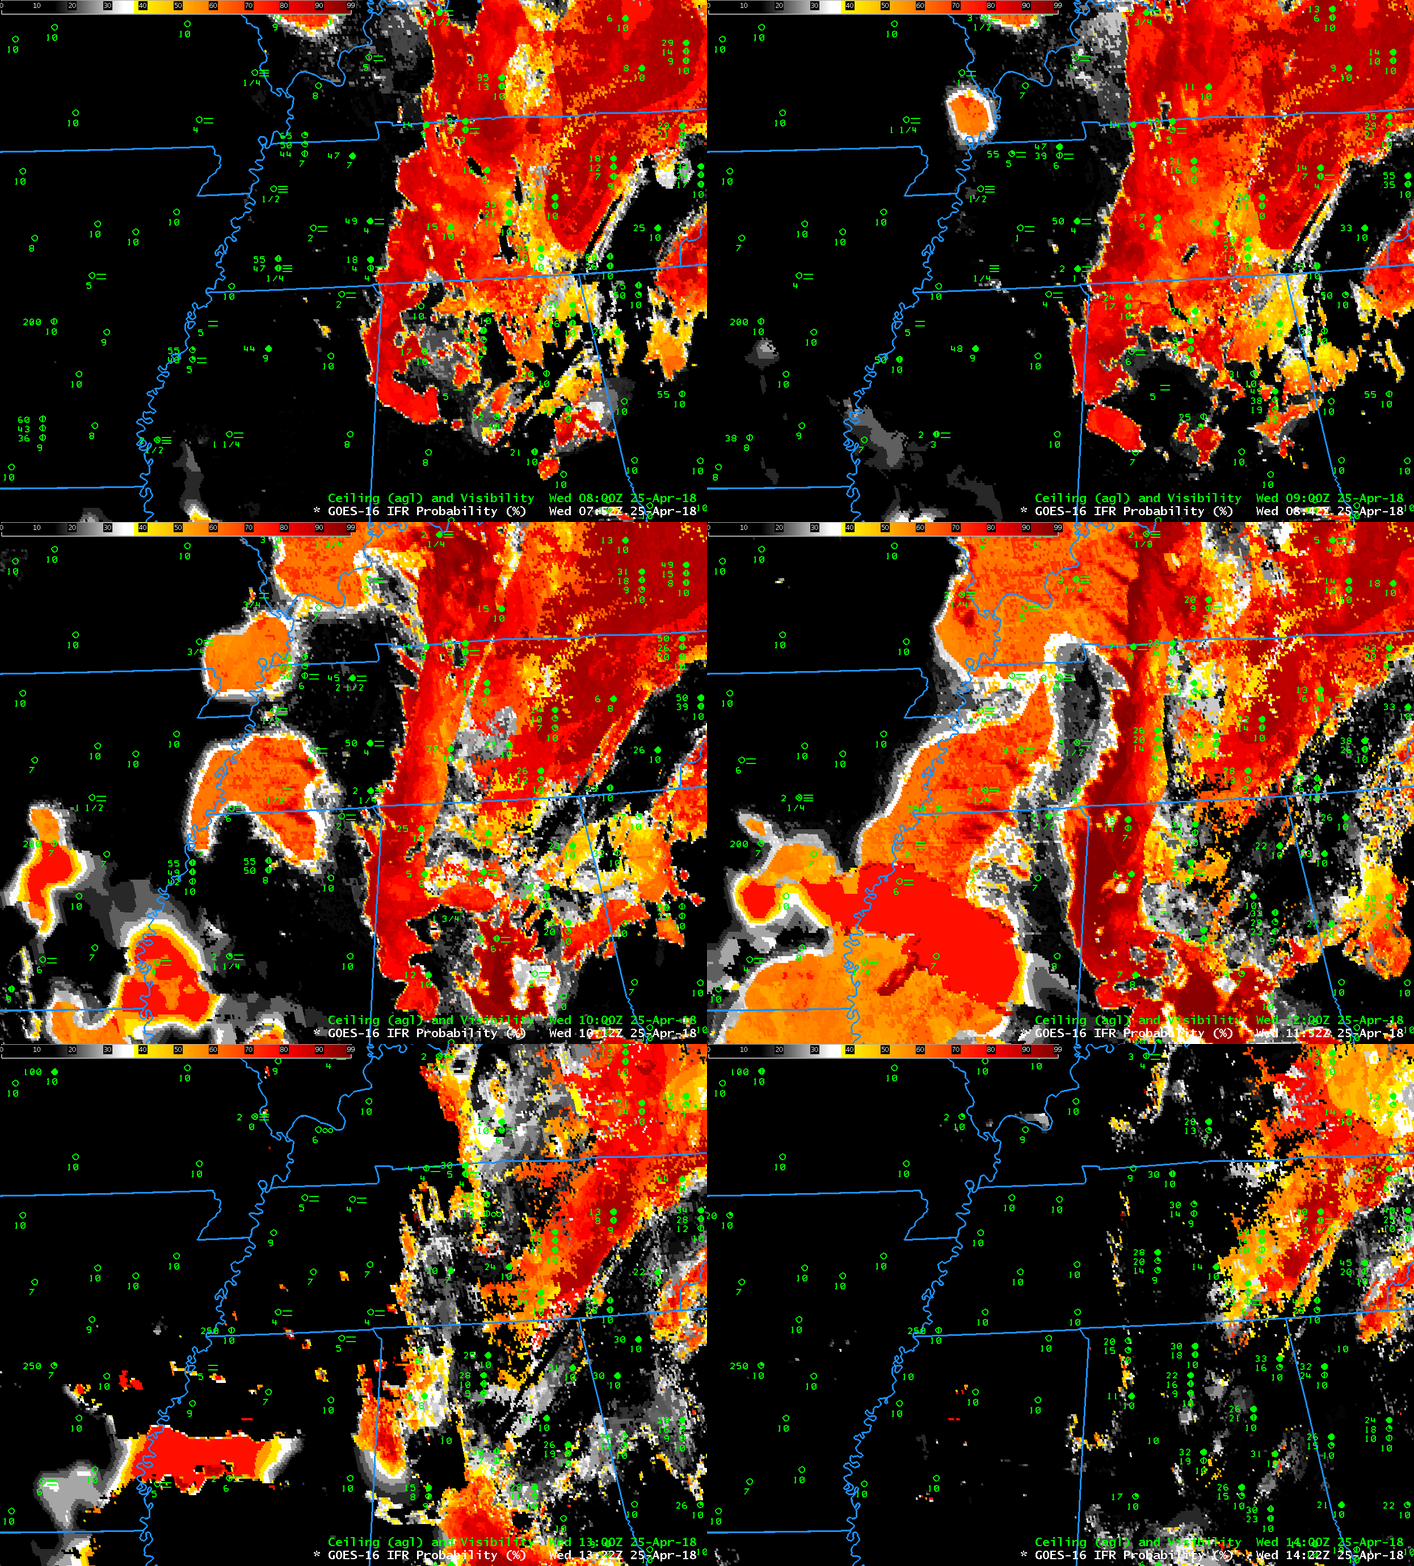
GOES-16 IFR Probability fields with a 10-minute time step from 0752-1422 UTC on 25 April 2018 (Click to enlarge)

Dense Fog developed over the mid-south on April 25th, and Dense Fog Advisories were issued by the National Weather Service Forecast Office in Memphis for portions of western Tennessee and northern Mississippi.  GOES-16 IFR Probability fields above, show the development of strong signal in IFR Probability over western Tennessee starting after 0900 UTC.  The satellite signal for this event was weak (see below); the sudden appearance of an IFR Probability signal at 0900 UTC suggests that the Rapid Refresh model simulation quickly changed from insufficient saturation for a strong signal to a better signal of fog when the model simulation valid at 0900 UTC was used.  When IFR Probabilities suddenly change absent a big change in satellite signal, the cause is likely a change in the Rapid Refresh model output.

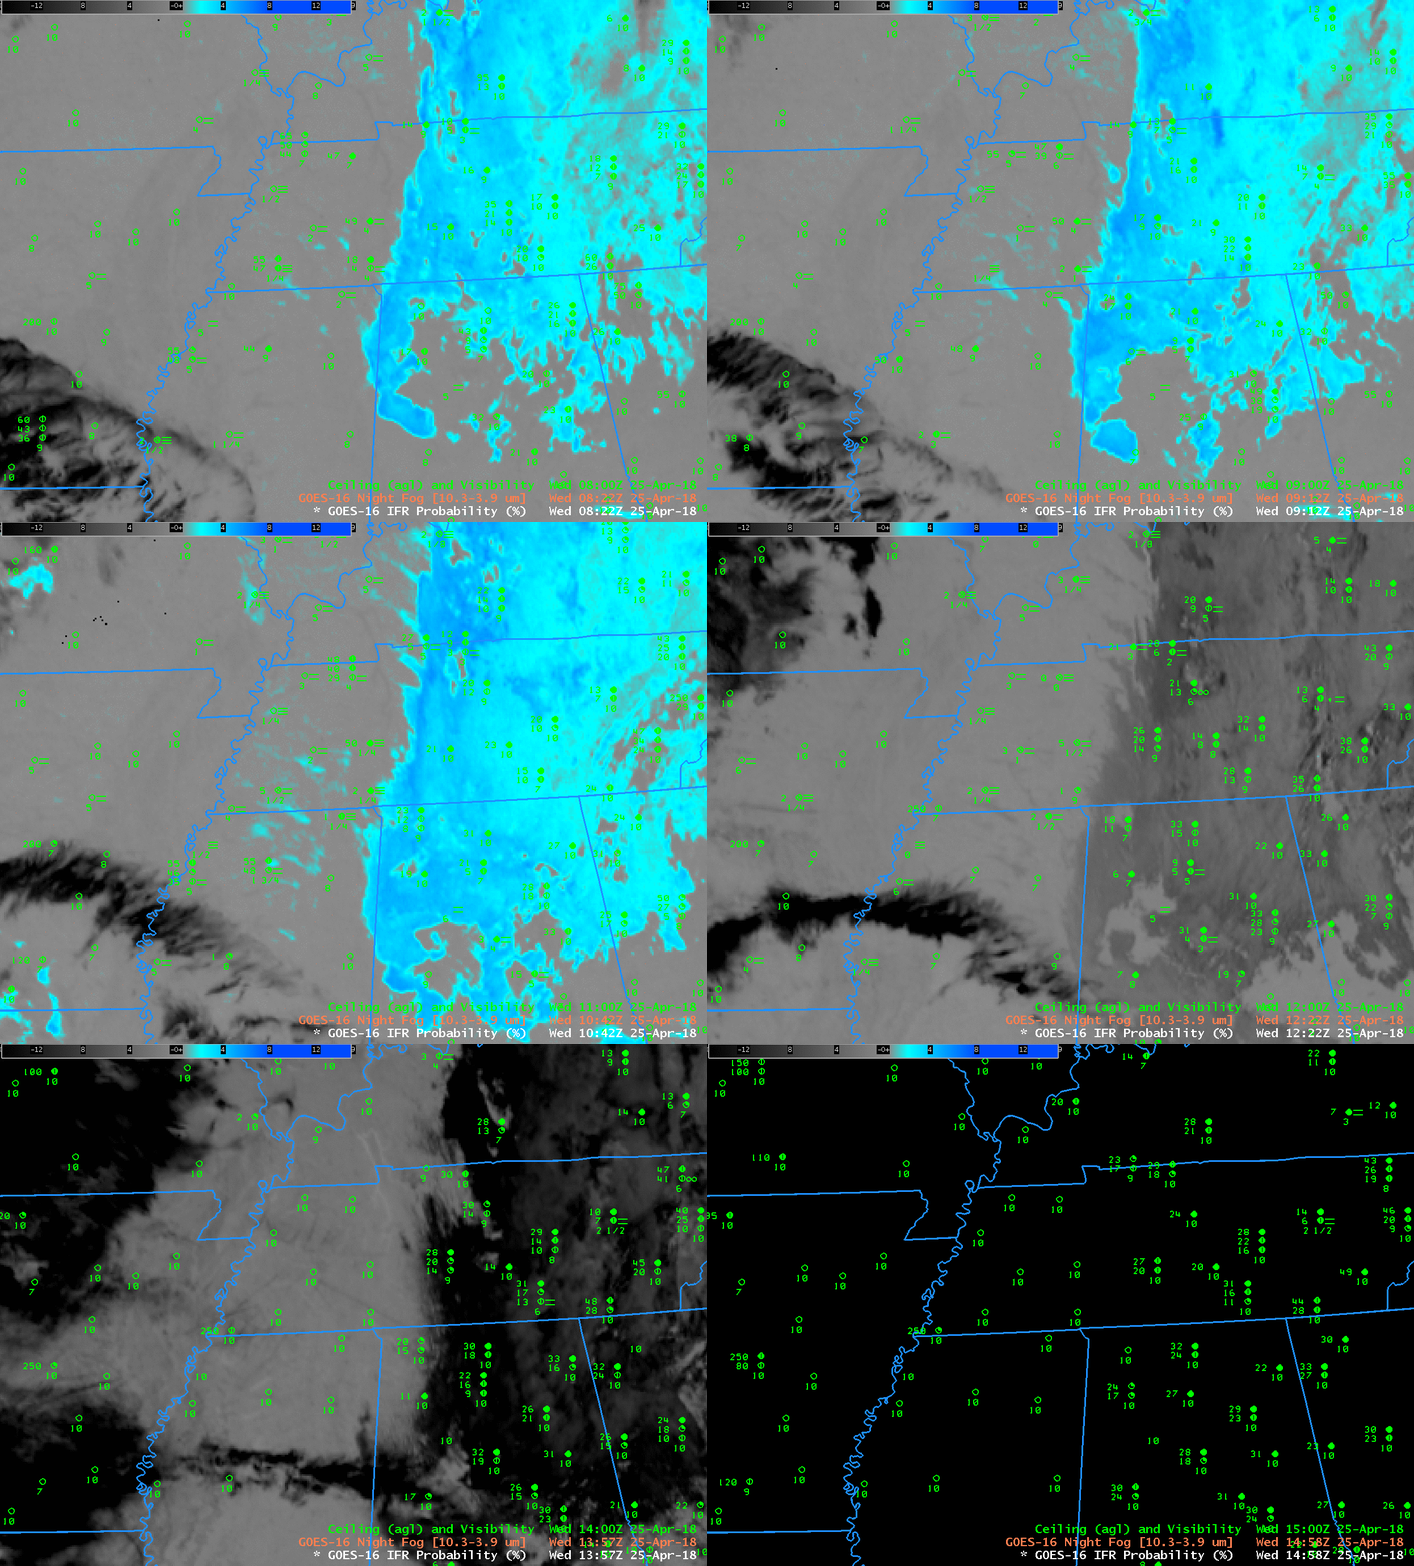
Night fog Brightness temperature difference, below, shows a weak signal over river valleys of western Tennessee and northwestern Mississippi.

GOES-16 Night Fog Brightness Temperature Difference (10.3 µm – 3.9µm) 0822-1452 UTC on 25 April 2018 (Click to enlarge)

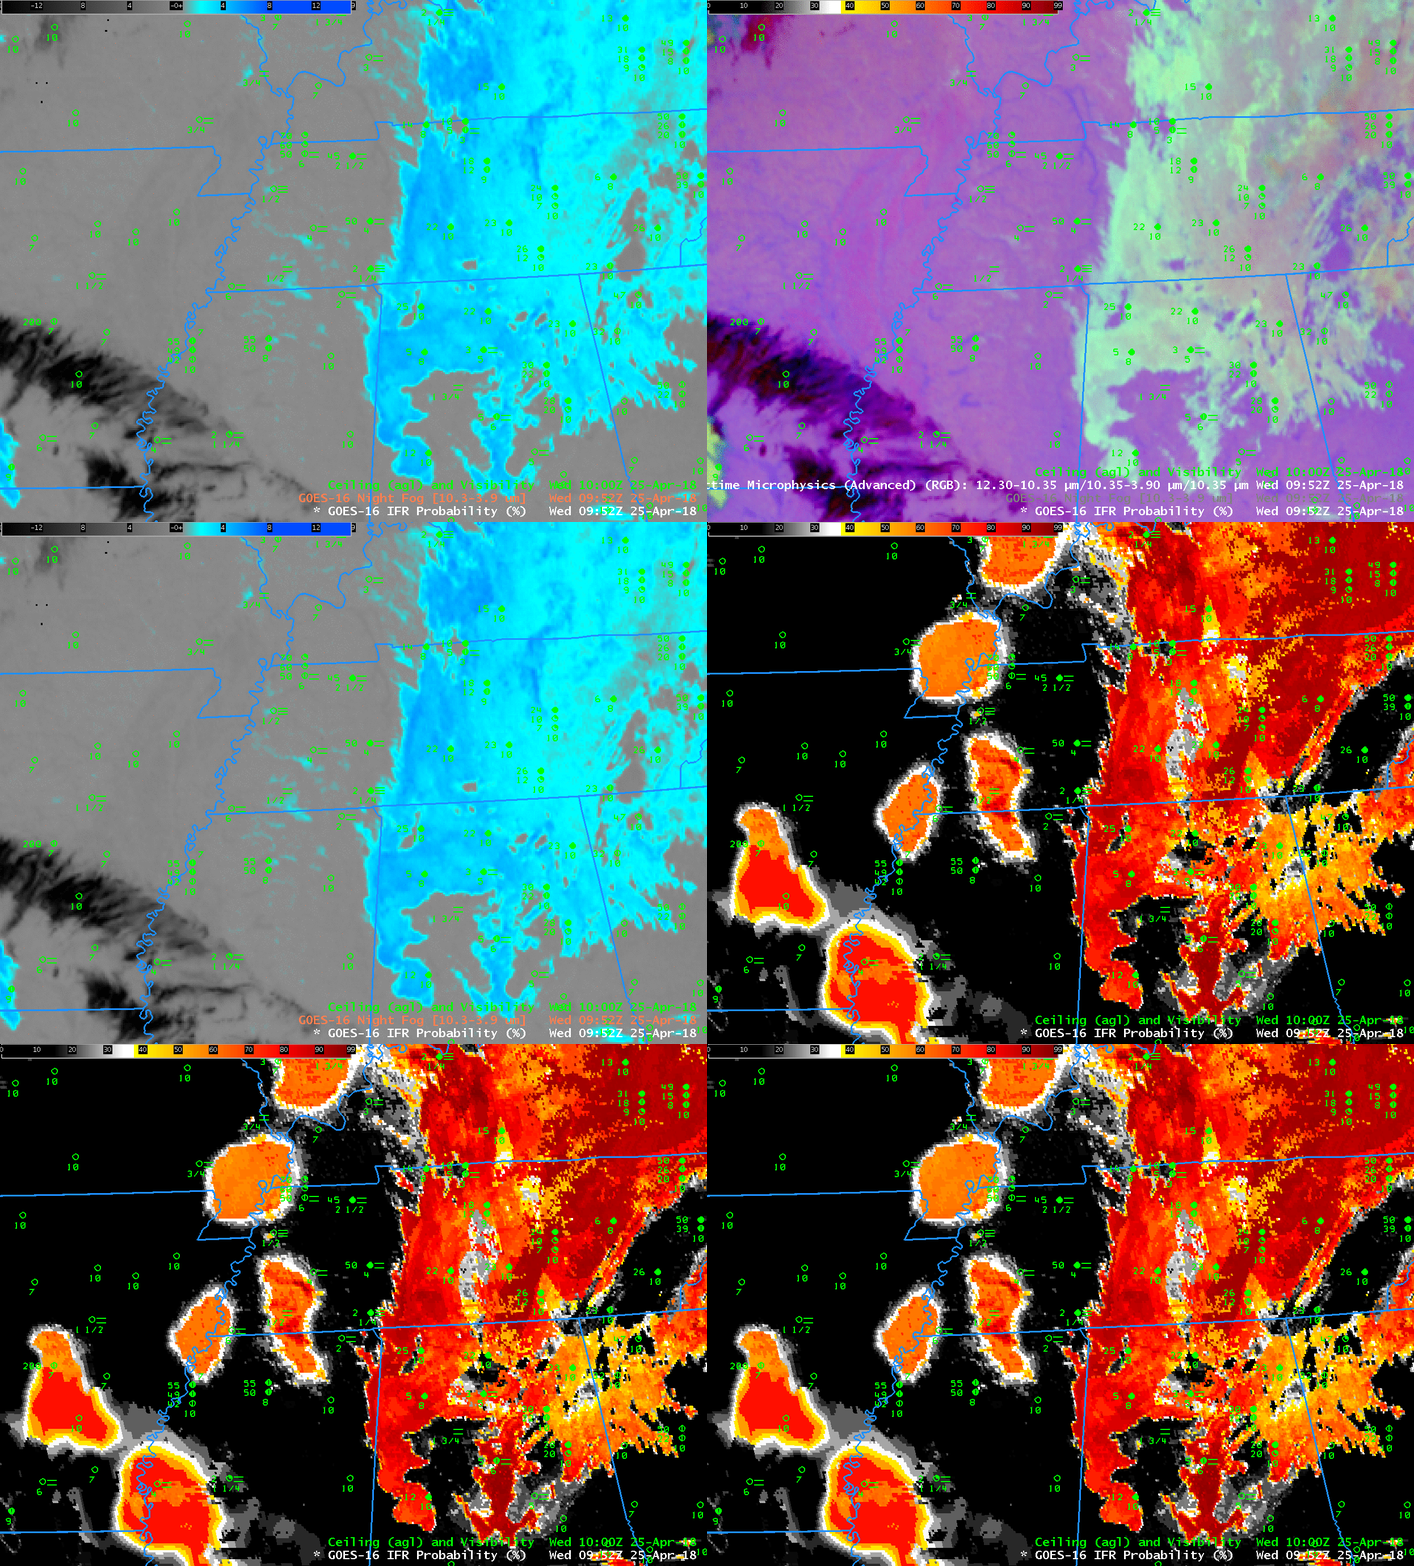
Because the signal in the brighntess temperature difference field is weak, the signal for fog in the Nighttime Microphysics RGB (which has as its green component the Night Fog Brightness Temperature Difference) is also weak. The toggle below shows the Night Fog Brightness Temperature Difference, the RGB, and the IFR Probability fields, all at 0952 UTC on 25 April.

GOES-16 Night Fog Brightness Temperature Difference (10.3 µm – 3.9µm), NIghttime Microphysics RGB and GOES-16 IFR Probability fields, all at 0952 UTC on 25 April 2018 (Click to enlarge)

Cloud Thickness as a Fog Dissipation Predictor

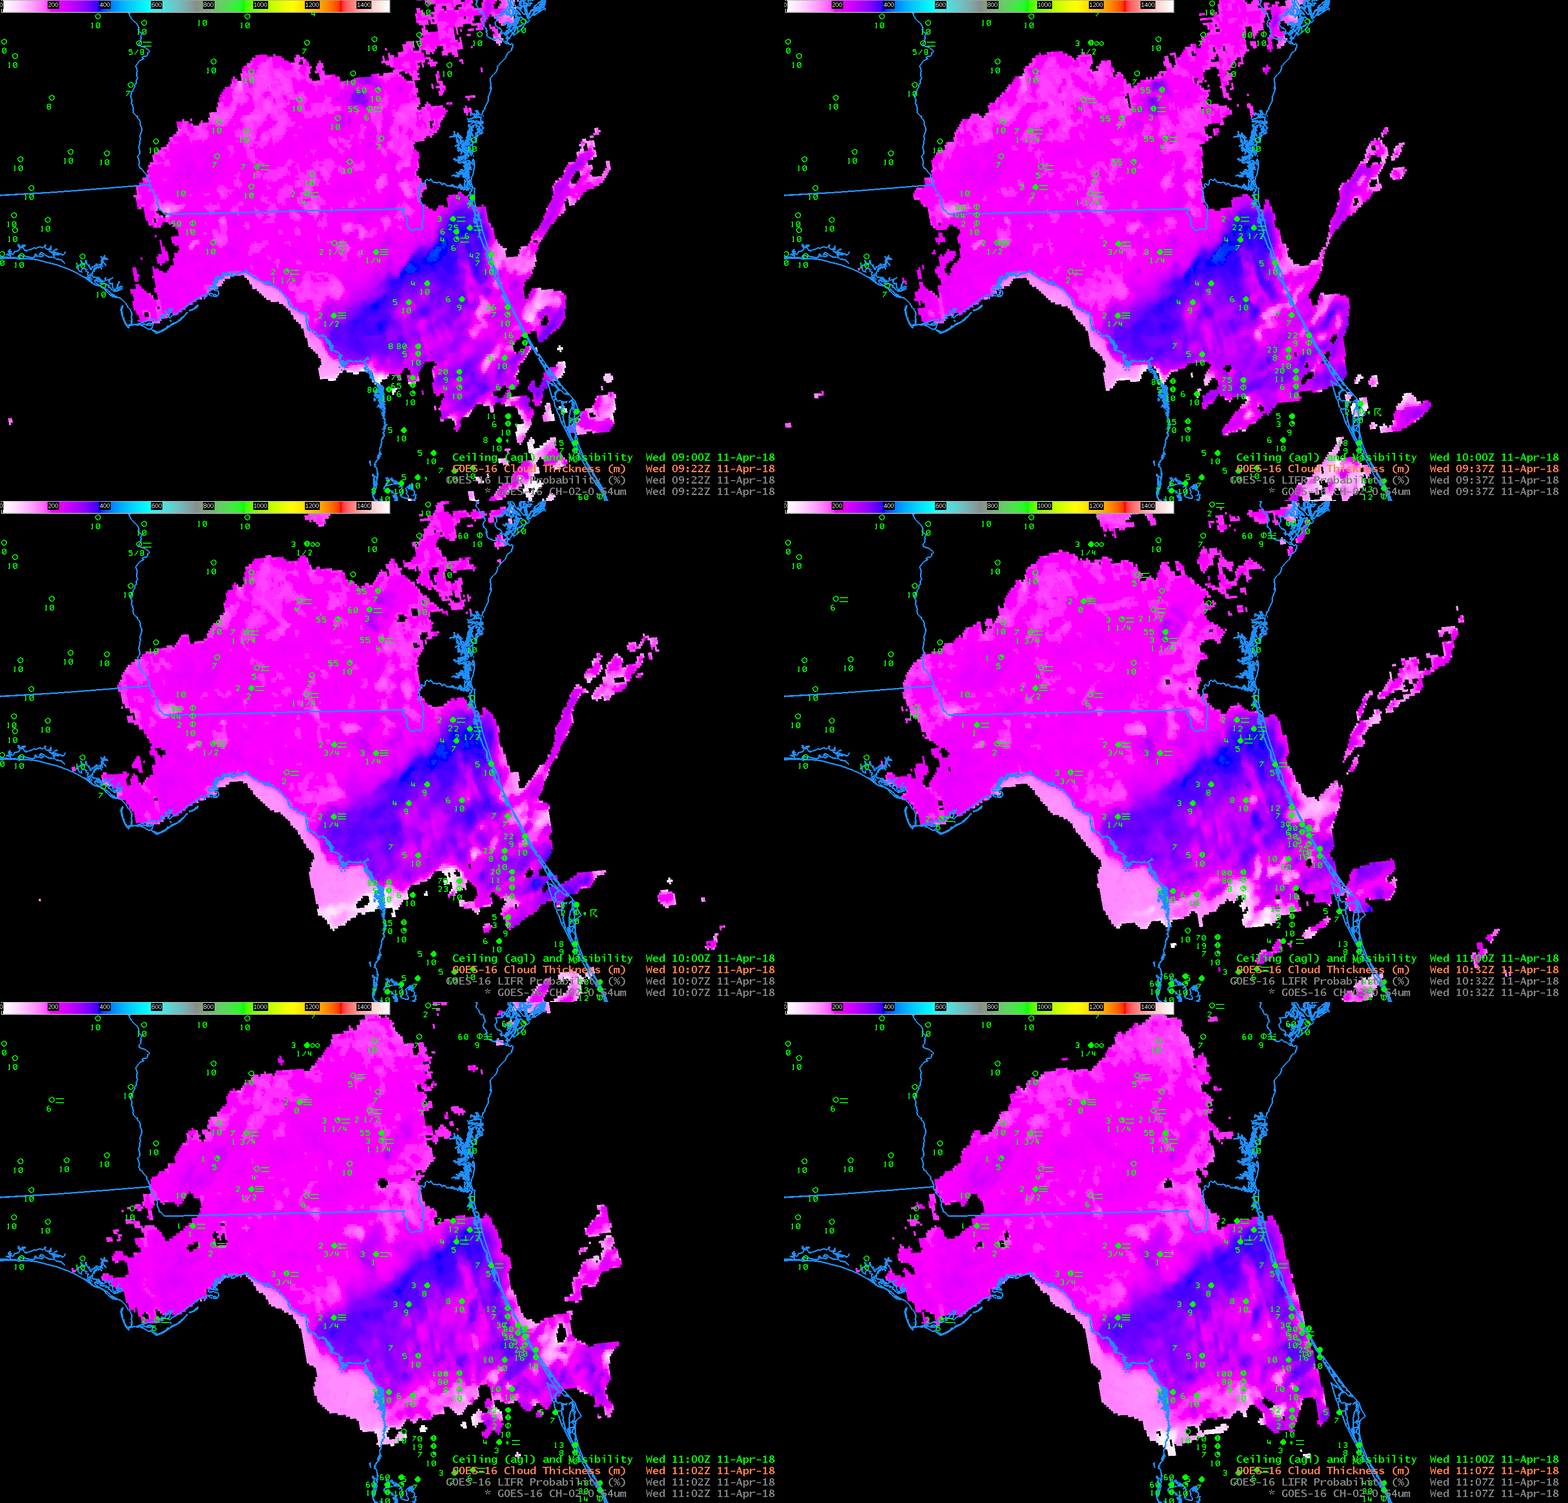
GOES-R Cloud Thickness, 0922-1107 UTC on 11 April 2018 (Click to enlarge)

GOES-R Cloud Thickness can be used (along with this scatterplot) to estimate when fog or low clouds in a region will burn off. This look-up table is most appropriate when used with Radiation Fogs. GOES-R Cloud Thickness is created from a look-up table that was developed using SODAR observations of low clouds off the west coast of the USA and GOES-West (Legacy GOES) observations of 3.9 µm emissivity. These thickness values just before sunrise were then compared to subsequent imagery to determine when the observed fog/low clouds dissipated and the scatterplot was created.

In the case above, the final GOES-R Cloud Thickness field before sunrise conditions occurred at 1107 UTC (Note in the image how low clouds have vanished just off the coast of northeast Florida)   Values over southern Georgia and most of northeast Florida were in the 200-m range:  Very thin!  The scatterplot suggests that such a thickness (equal to about 700 m) will dissipate within an hour. A small strip of somewhat thicker clouds (blue enhancement, suggesting a thickness of 350-400 m) stretched southwestward from Jacksonville to the Gulf of Mexico.

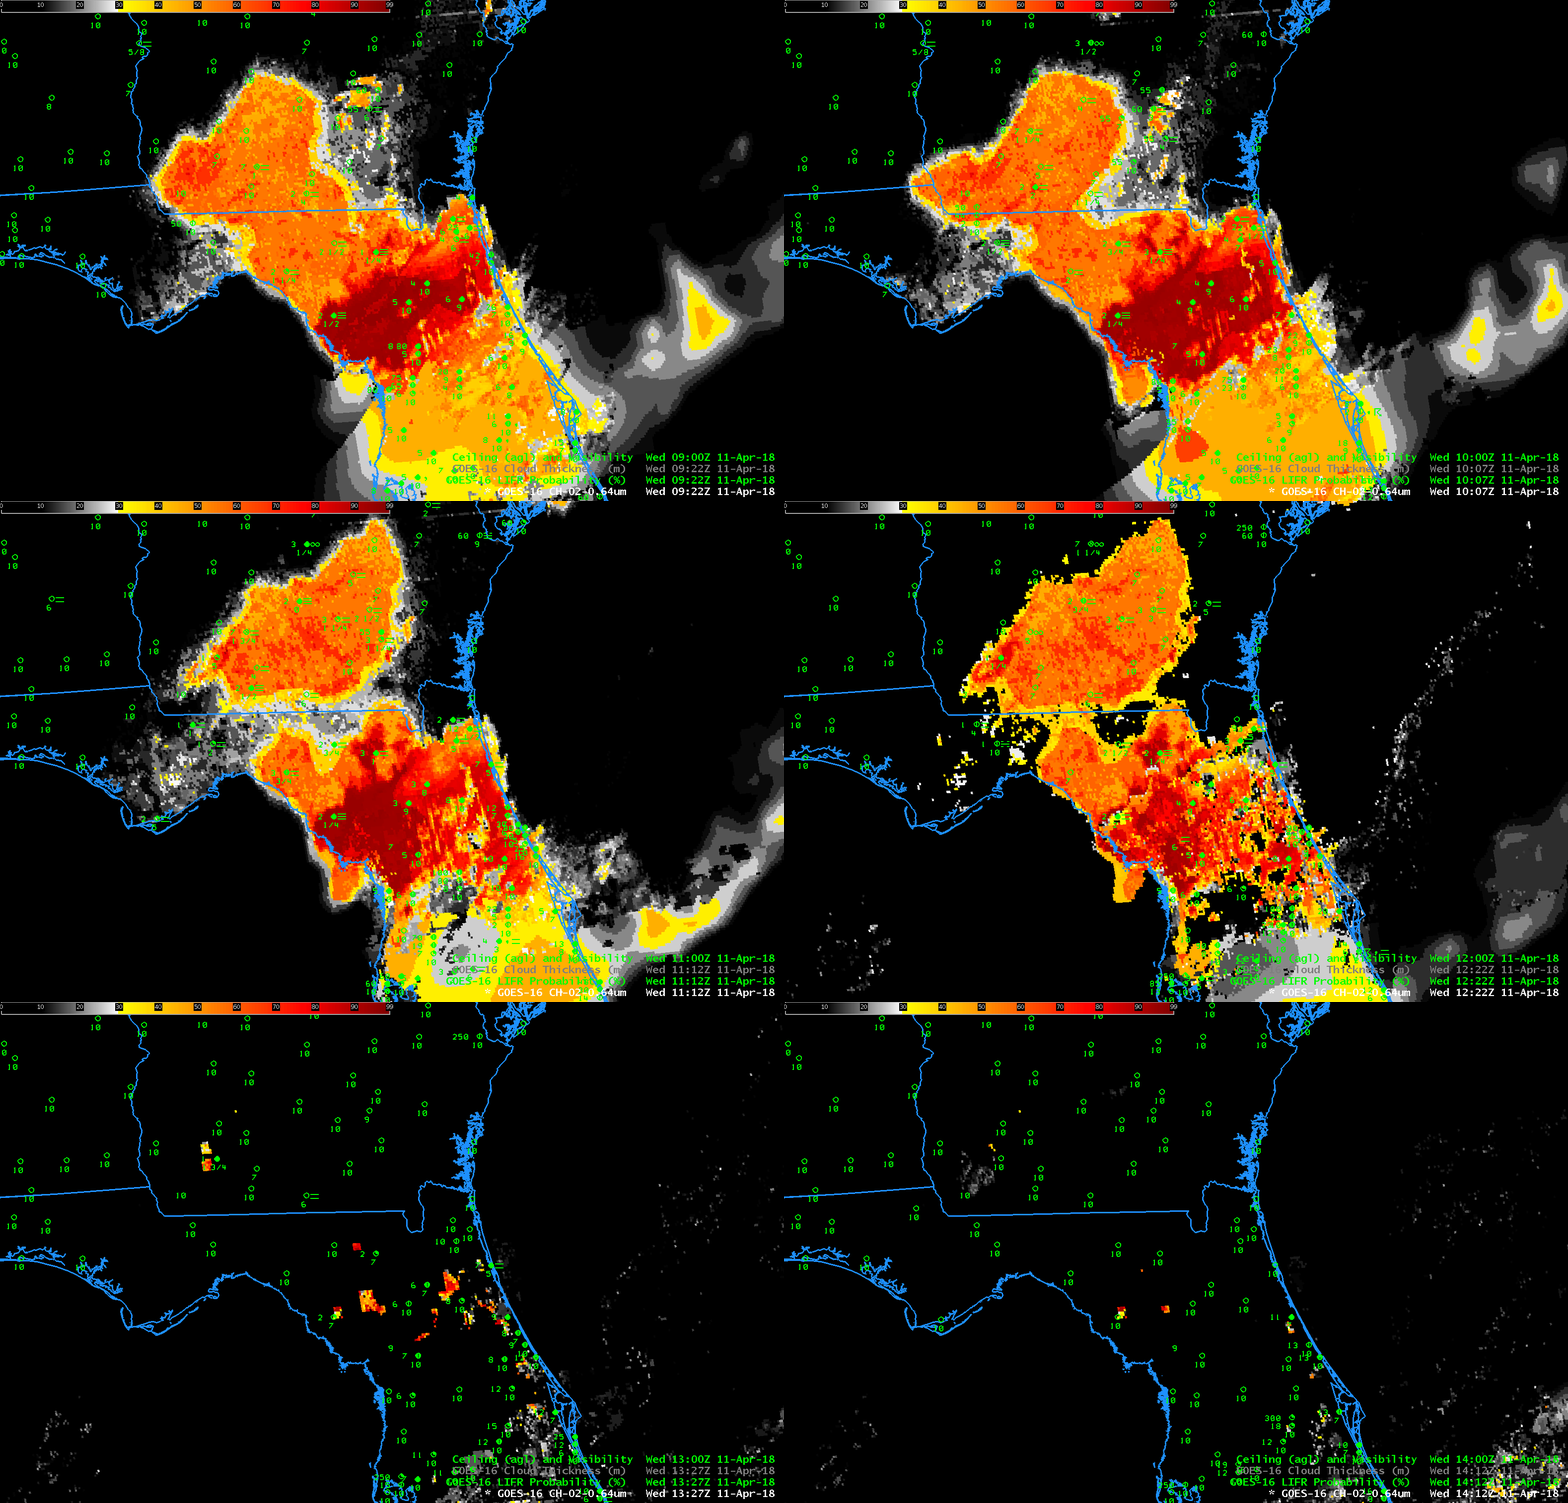
IFR Probabilities during this time before sunrise show enhanced values where IFR and near-IFR conditions are present.  Note that that region of thicker clouds (thicker as diagnosed by the GOES-R Cloud Thickness product) shows higher IFR Probabilities.

GOES-16 IFR Probabilities, 0922 UTC to 1412 UTC on 11 April 2018 (Click to enlarge)

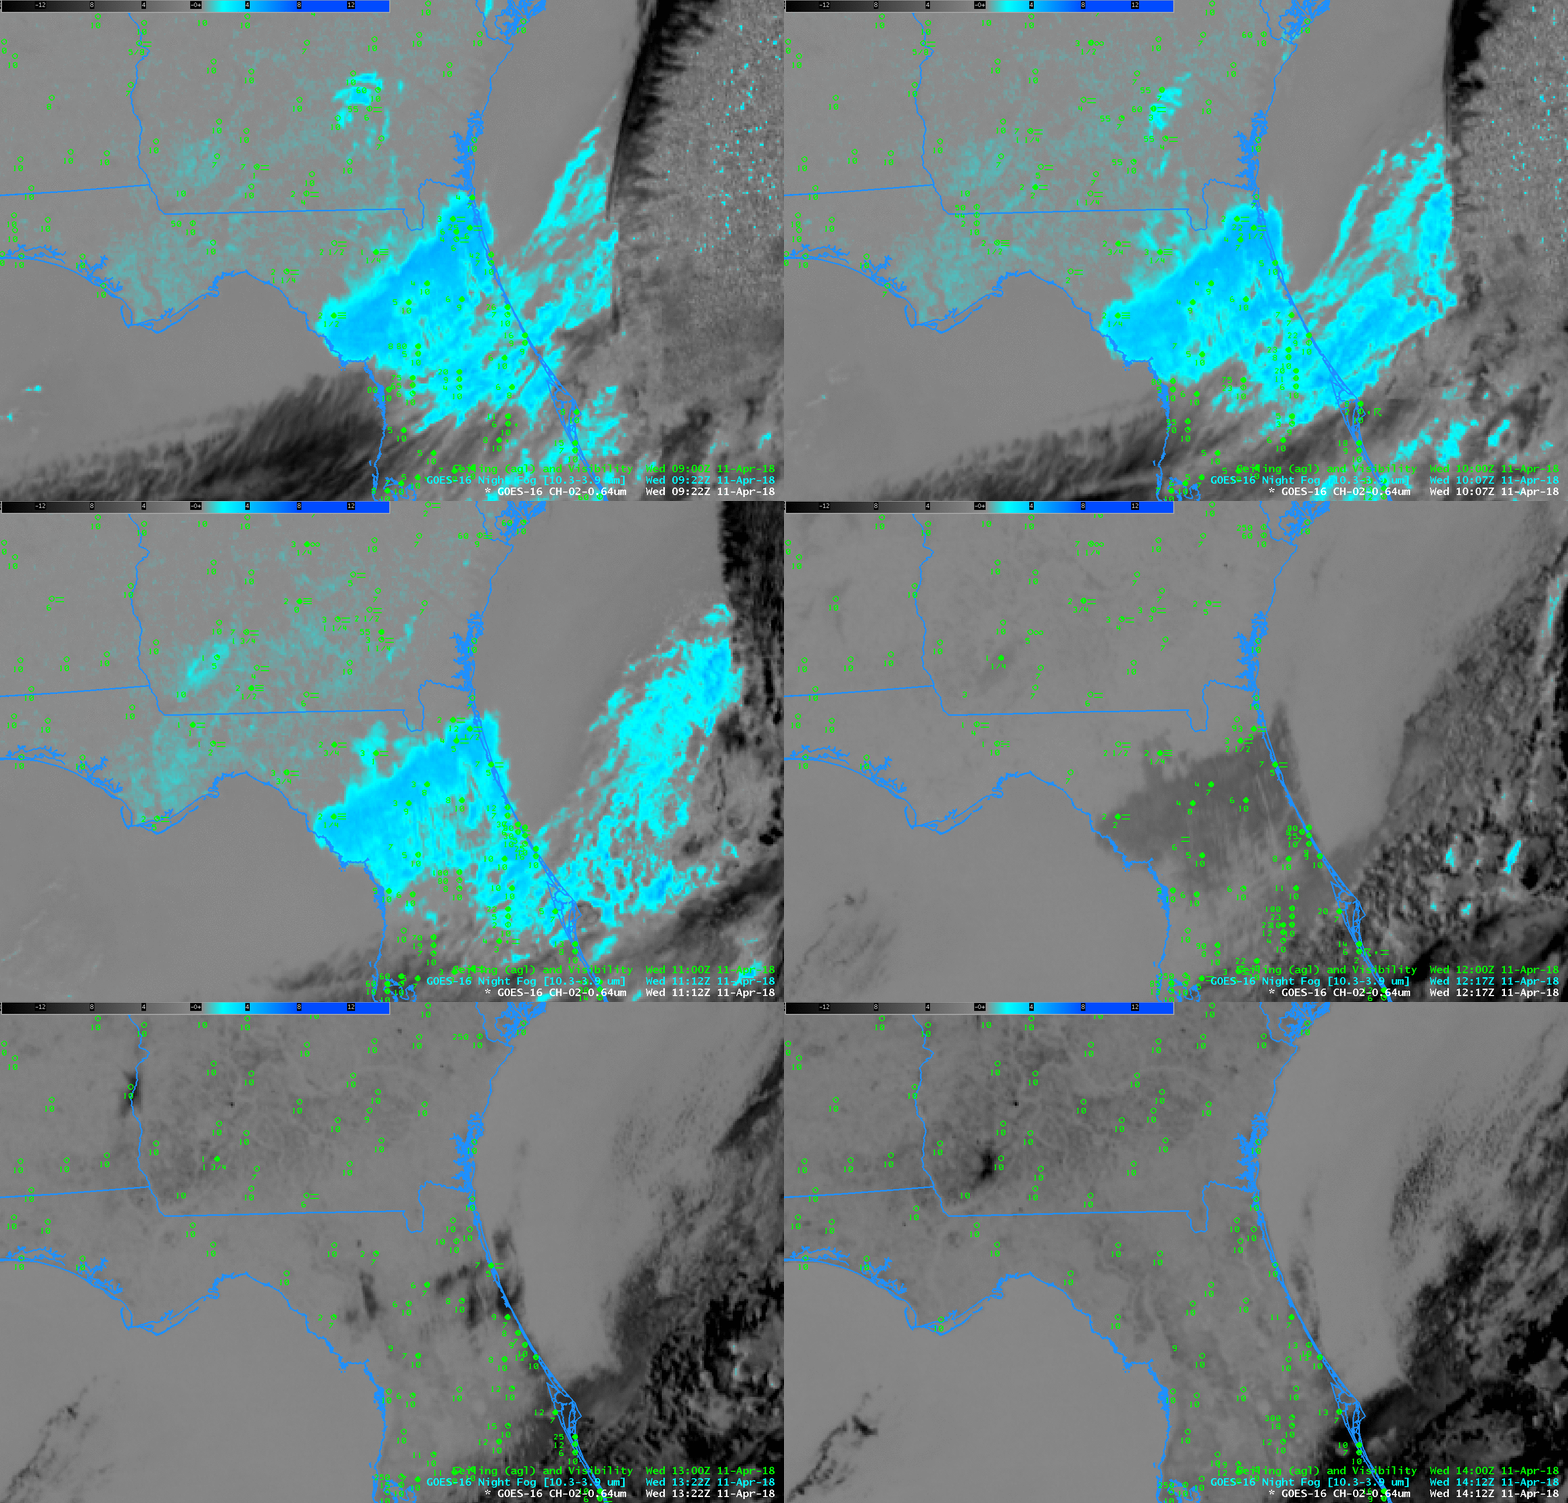
The GOES-16 ‘Night Fog’ Brightness Temperature Difference product, below, shows a small signal over southern Georgia where IFR Conditions are present, and where Cloud Thickness is small.  There is a stronger signal southwest of Jacksonville, which may be one reason that the IFR Probability value there are somewhat stronger than over southern Georgia and extreme northern Florida.  Note also : (1) the sign of the Brightness Temperature Difference flips when the sun rises as increasing amounts of reflected solar 3.9 µm radiation overwhelm the emissivity-driven differences and (2)  the Brightness Temperature Difference field gives little surface information under the cirrus shield over central Florida (or over the Atlantic Ocean).

GOES-16 ‘Night Fog’ Brightness Temperature Difference (10.3 µm – 3.9 µm) from 0922 through 1412 UTC on 11 April 2018 (Click to enlarge)

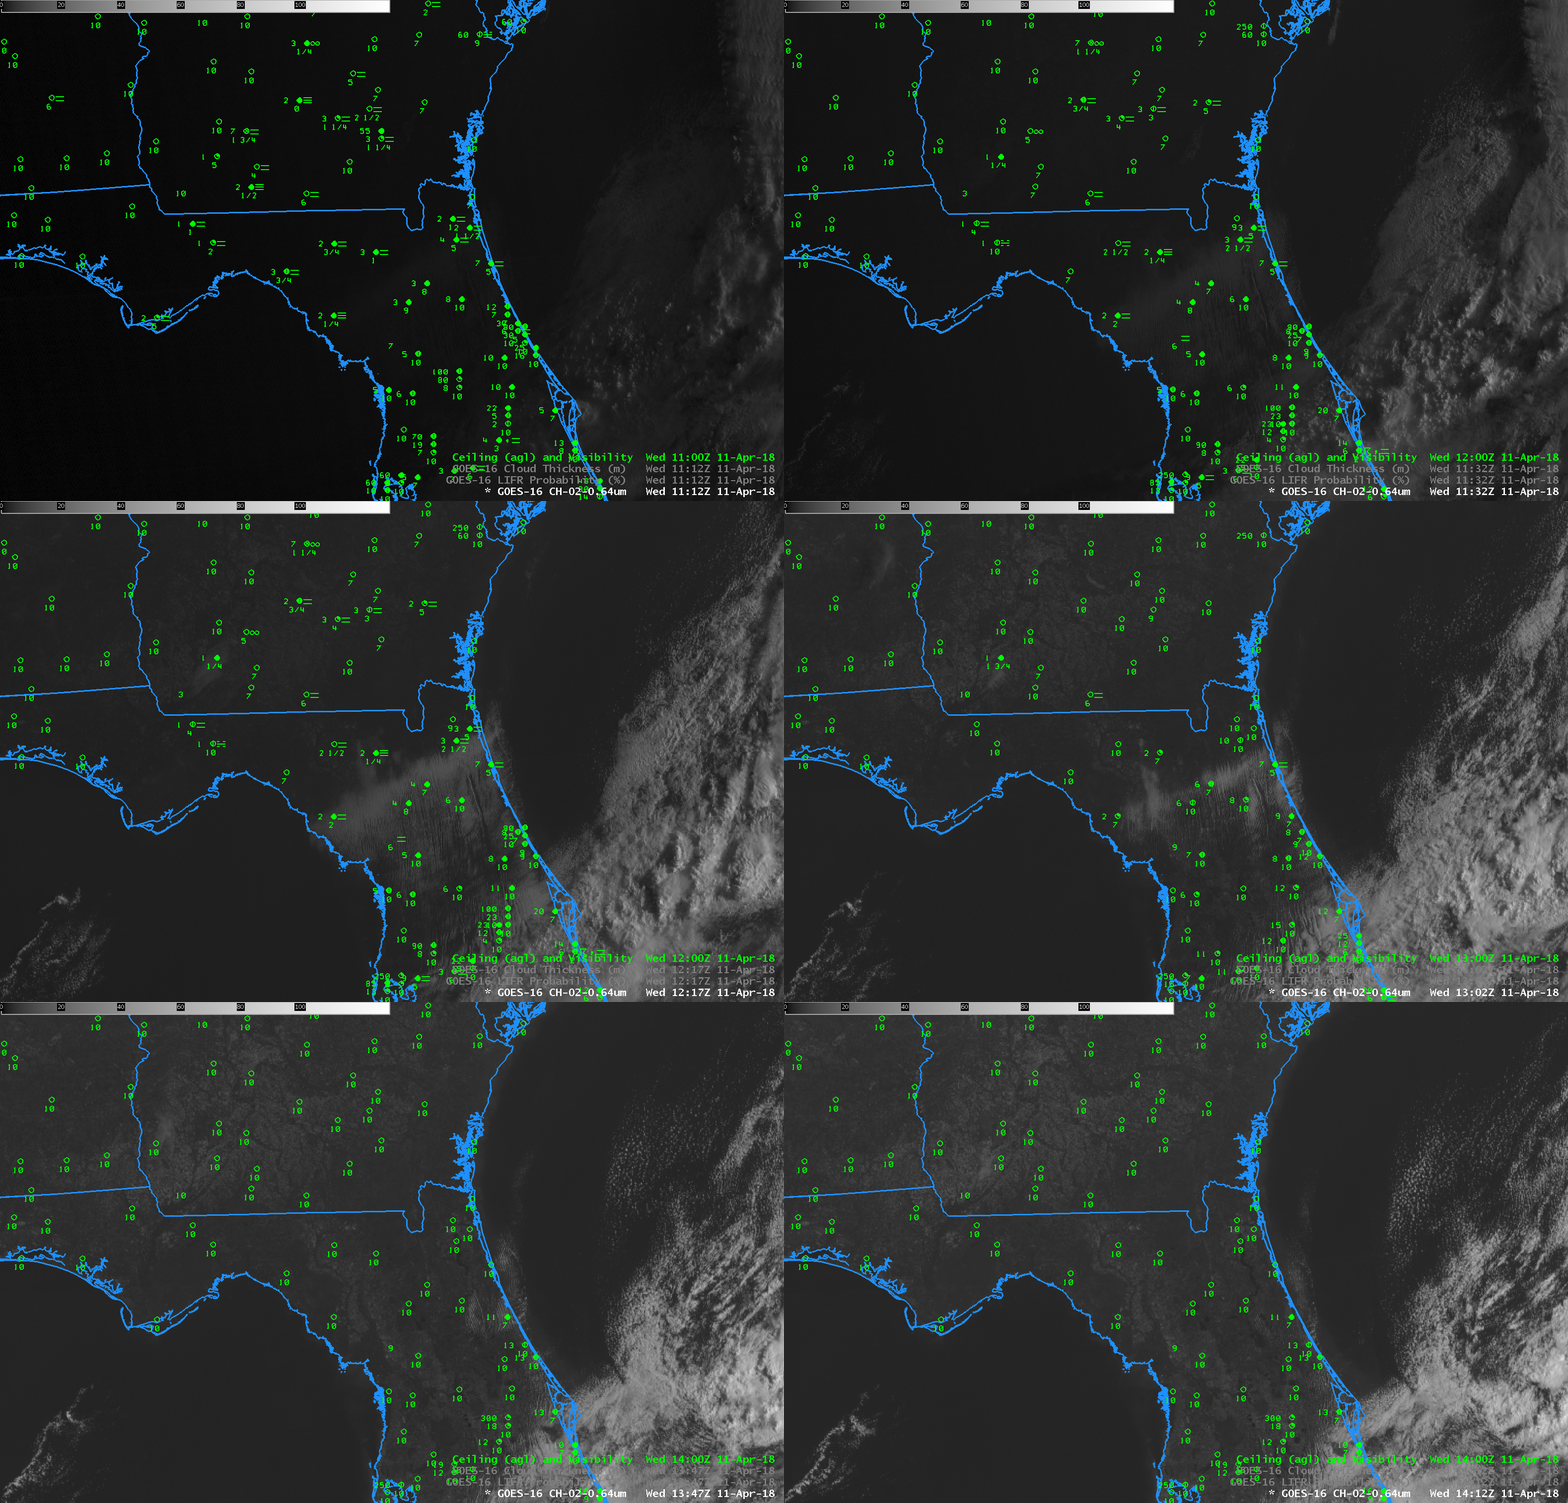
Visible imagery, below, shows a quick dissipation to the fog and low clouds as expected given their diagnosed thin nature by the Cloud Thickness product.

GOES-16 ABI Visible (0.64 µm) imagery, 1112-1412 UTC on 11 April 2018 (Click to enlarge)

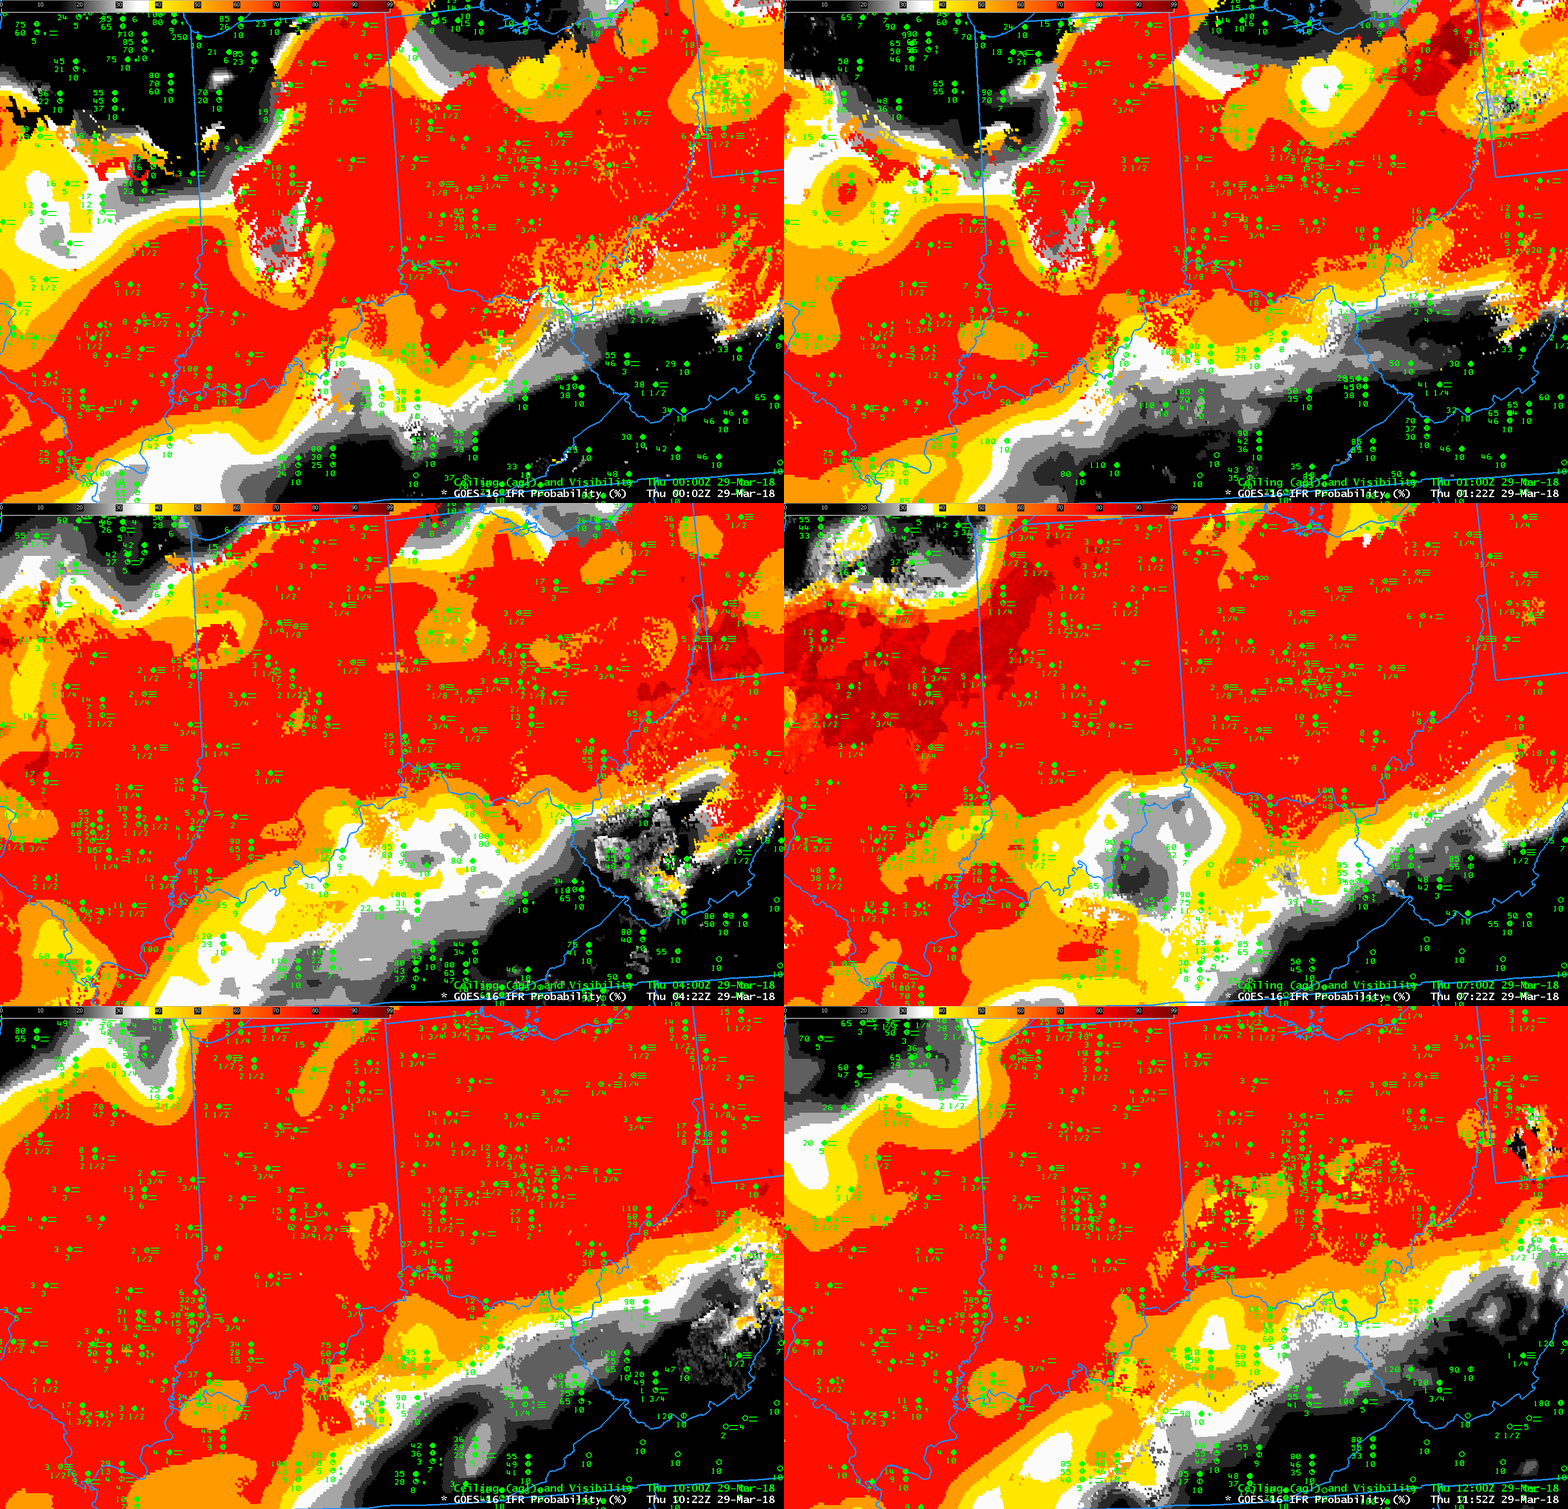
Advection Fog with a Spring Storm in the Ohio River Valley

GOES-16 IFR Probability fields, 0002 UTC through 1152 UTC on 29 March 2018, every 20 minutes (Click to enlarge)

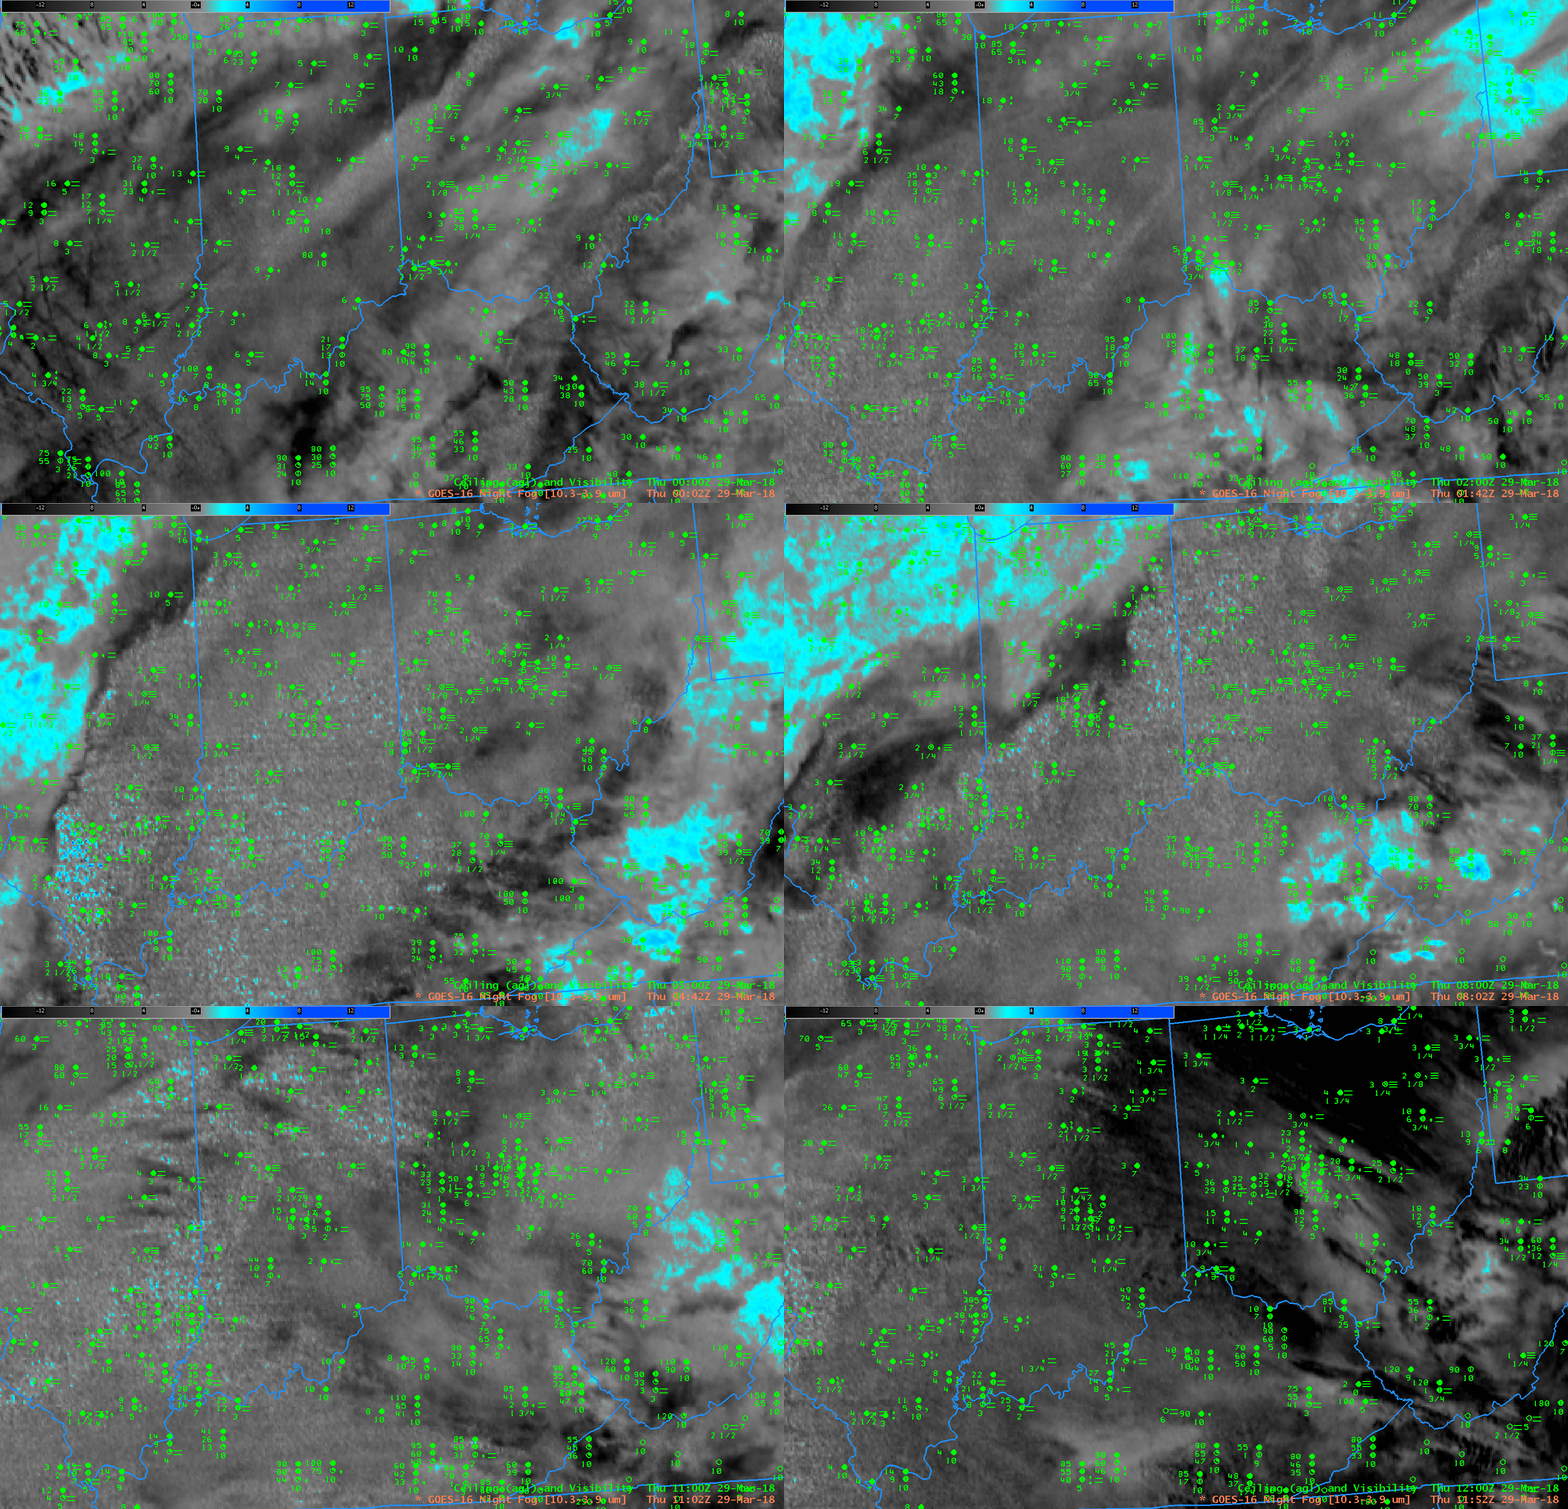
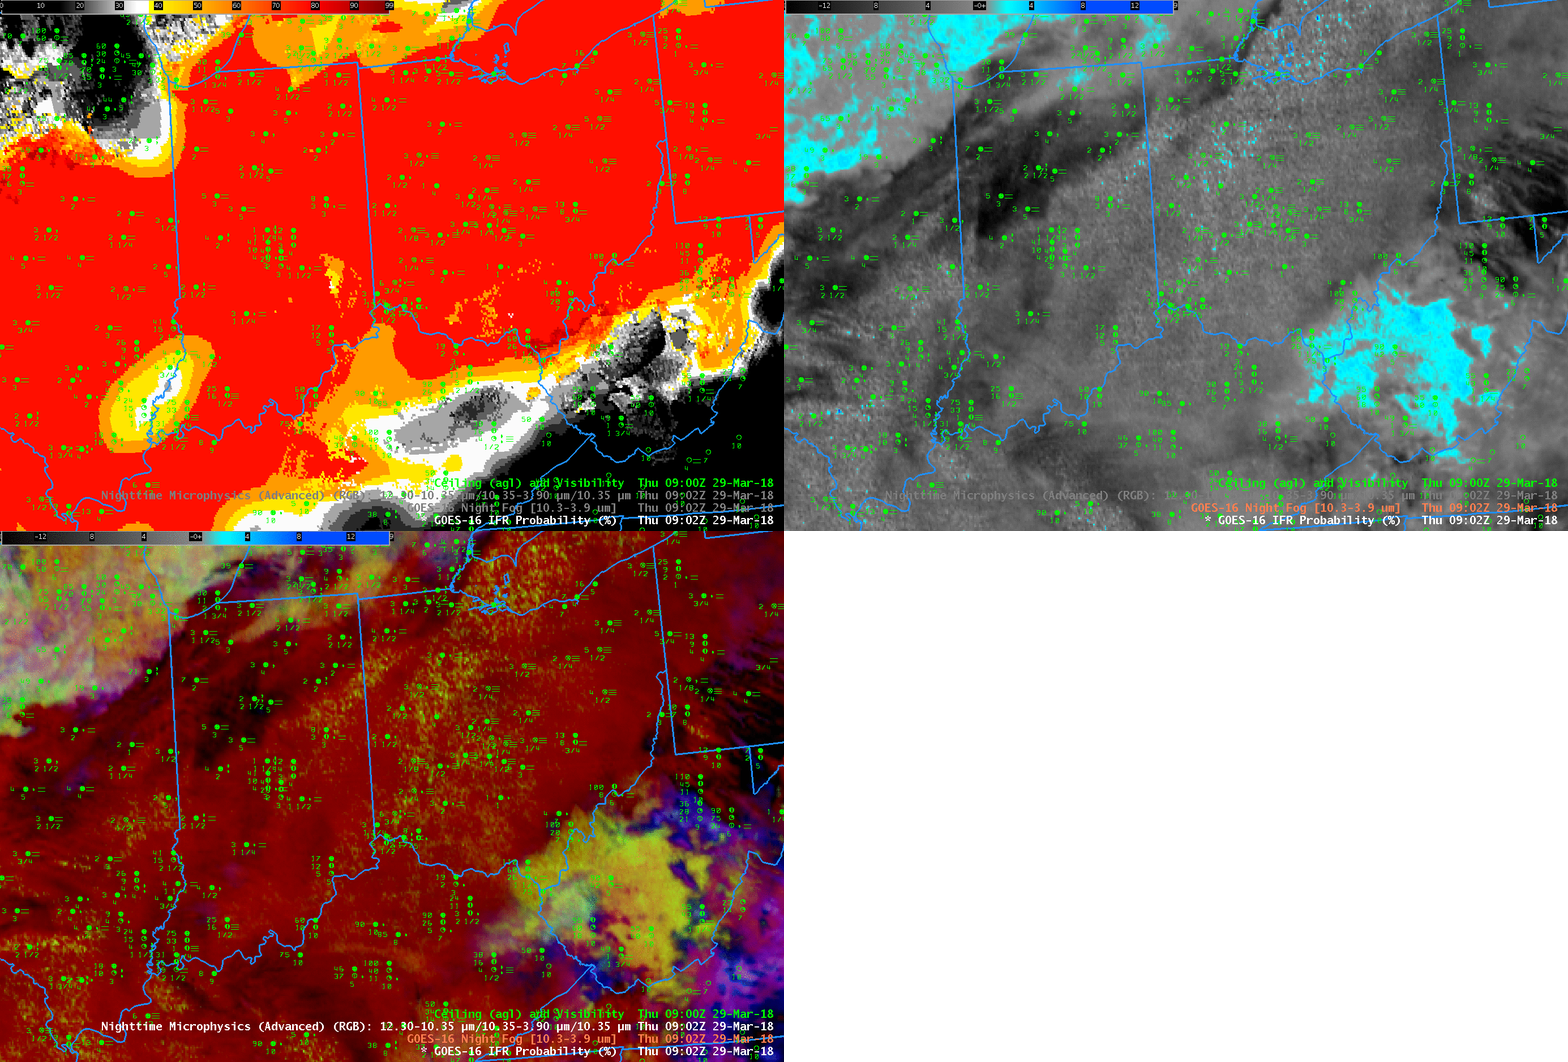
Advection fog in the Spring, when high dewpoints overrun very cold ground surfaces, usually in association with an extratropical cyclone, are very difficult to detect using satellite-only products, as shown in the Brightness Temperature Difference field animation below (Click here for the same animation but with a 5-minute time step as observed in the CONUS domain by GOES-16). GOES-16 IFR Probability, above (Click here for an animation with a 5-minute cadence), is able to highlight the region of low ceilings and visibilities because Rapid Refresh Data supplies information about near-surface saturation that is lacking in satellite-only products such as the Brightness Temperature Difference, below, or, say, the Nighttime Microphysics RGB that uses the Brightness Temperature Difference. A toggle including IFR Probability, Night Fog Brightness Temperature Difference, and Nighttime Microphysics is below (from 0902 UTC on 29 March). Only the IFR Probability has an obvious signal difference between regions with IFR Conditions and regions without.

GOES-16 Night Fog Brightness Temperature Difference (10.3 µm – 3.9 µm), 0002 – 1152 UTC at 20-minute timesteps (Click to enlarge)
GOES-16 IFR Probability, Night Fog Brightness Temperature Difference (10.3 µm – 3.9 µm), and Nighttime Microphysics at 0902 on 29 MArch 2018 (Click to enlarge)
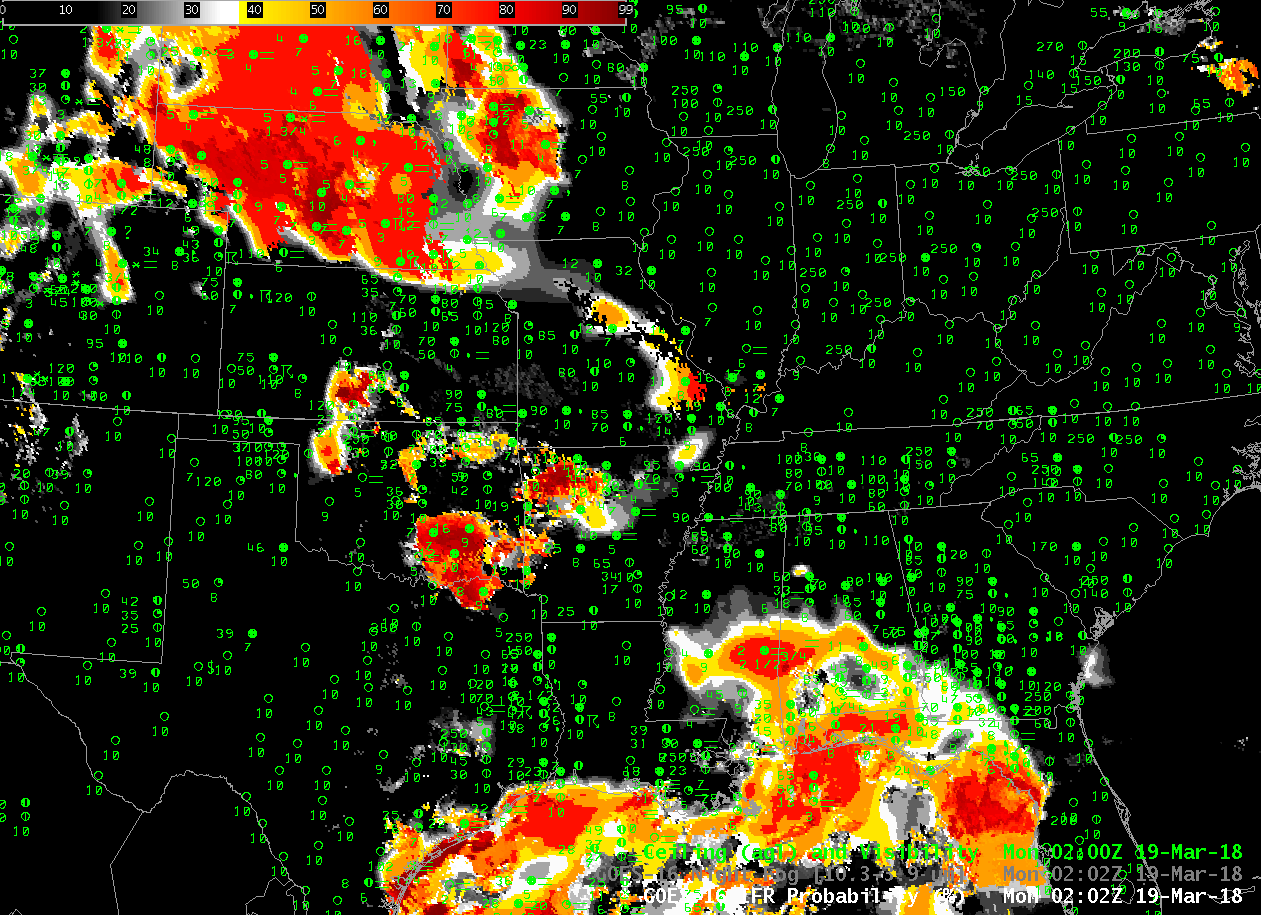
IFR Conditions with a Spring storm over the central United States

GOES-16 IFR Probability fields, every 10 minutes, from 0202 through 1412 UTC on 19 March 2018 (Click to animate)

Dense Fog Advisories (click here for graphical image from this site) and widespread IFR Conditions (click here for graphical image from this site) occurred as a nearly-occluded system spun slowly eastward across the central part of the United States on 19 March 2018. (Surface; 500-hPa). GOES-16 IFR Probability, shown above, (Click the image to see the animation) outlines two large areas where consistent IFR conditions develop/persist: the upper Plains, in states around Nebraska, and the Deep South.

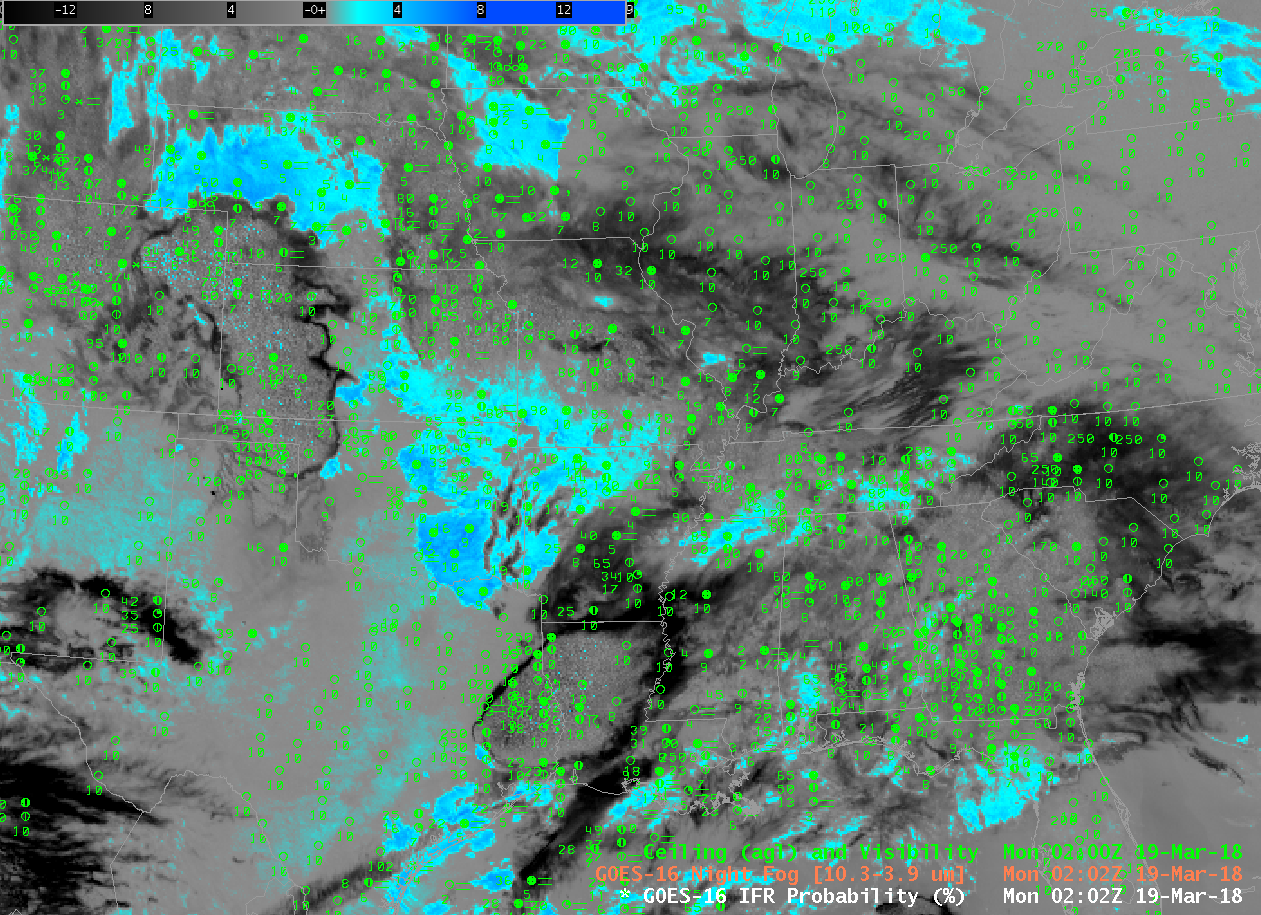
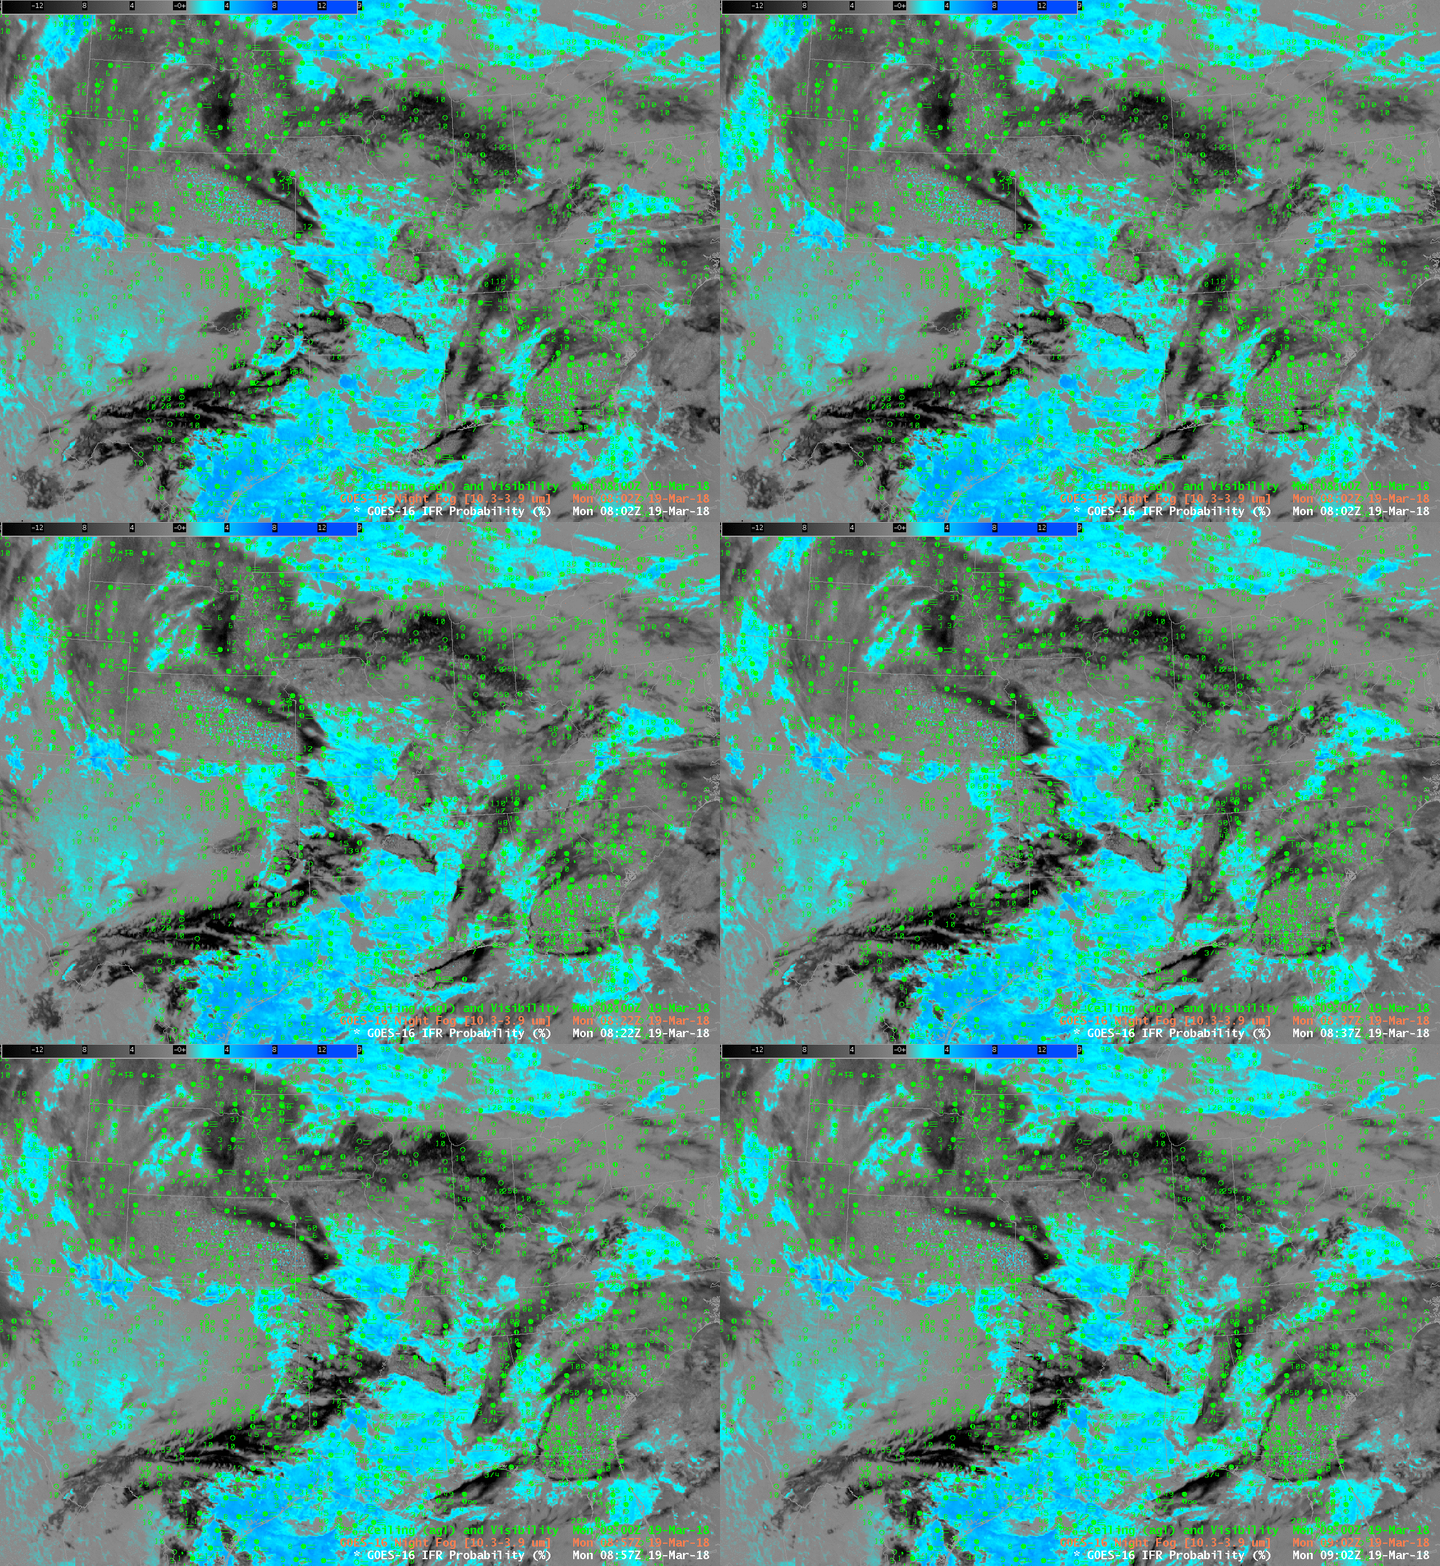
The GOES-16 Night Fog Brightness Temperature Difference field (10.3 µm – 3.9 µm), animation shown below, historically has been used to identify low stratus that is assumed to be fog at night. That detection suffers when high clouds are present (consistently on the morning of 19 March over Nebraska and surrounding states; occasionally over the Deep South as convection expels high-level cirrus into the atmosphere). Because IFR Probability fuses satellite data with Numerical Model estimates of low-level saturation (from the Rapid Refresh Model), it retains a strong signal of fog in regions where multiple clouds layers prevent the satellite from observing observed low stratus causing IFR conditions, such as over Nebraska, or over Mississippi at 0607 UTC.

GOES-16 Night Fog Brightness Temperature Difference (10.3 µm – 3.9 µm), 0202-1412 UTC on 19 March 2018 (Click to animate)

Note that there exists a Brightness Temperature Difference signal over the High Plains of Texas and New Mexico at, for example, 0800-0900 UTC. (See below). Persistent drought exists in that region (linked image from this site) and the dryness can alter the relative emissivities of the soils so that a signal develops (Click here for an earlier example).  There are no clouds in this region;  the Rapid Refresh model shows very dry air and the IFR Probability algorithm correctly diagnoses very small probabilities of IFR conditions.

GOES-16 Night Fog Brightness Temperature Difference (10.3 µm – 3.9 µm), 0802-0902 on 19 March 2018 (Click to enlarge)