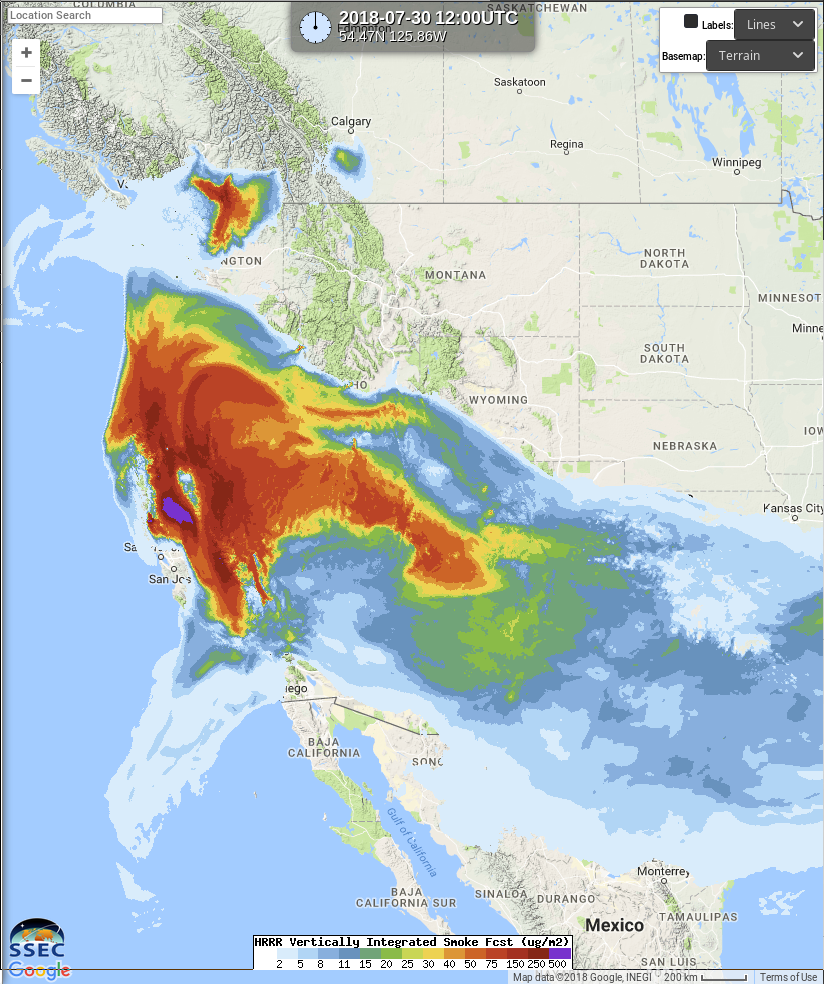
HRRR forecast of Vertically-Integrated Smoke over the Pacific Northwest (for more information see text), forecast valid at 1200 UTC on 30 July 2018 (Click to enlarge)
When smoke covers a geographic region, visible detection of low-level fog is difficult because smoke can scatter or obscure the signal from the low-level clouds. The image above shows a Vertically Integrated Smoke Forecast from a High-Resolution Rapid Refresh Model simulation in Real Earth (link). Thick smoke was predicted to occur over the coast of Oregon.
The animation below steps through the GOES-R IFR Probability, and then the ‘Blue Band’ (0.47 µm), the ‘Red Band’) (0.64 µm), the ABI channel with the highest spatial resolution, the ‘Veggie Band’ (0.86 µm) and the ‘Snow/Ice Band’ (1.61 µm). Two things of note: Because of the low sun angle, and the enhanced forward-scattering properties of smoke at low sun angle, it is very hard to detect fog through the smoke in the visible wavelengths near Sunrise. As the wavelength of the observation increases, scattering is less of an issue. In addition, smoke is more transparent to longer wavelength radiation. Thus, the cloud edges become more apparent under the smoke in the 0.86 µm and especially the 1.61 µm imagery compared to the visible.
GOES-16 IFR Probability, and GOES-16 Single Bands (Band 1, 0.47 µm, Band 2, 0.64 µm, Band 3, 0.86 µm and Band 5, 1.61 µm) at 1342 UTC on 30 July 2018, along with surface observations of Ceilings, Visibility, and Visibility Restrictions at 1400 UTC. (Click to enlarge)
GOES-16 IFR Probability can indicate the regions of fog and corresponding restrictions in visibility because it relies on longer wavelength observations from GOES-16 (3.9 µm and 10.3 µm, principally) and information about low-level saturation from the Rapid Refresh model. Smoke is mostly transparent to radiation in the infrared unless it becomes extraordinarily thick (indeed, that is one reason why smoke is difficult to detect at night); thus, the brightness temperature difference between the shortwave (3.9 µm) and longwave (10.3 µm) infrared channels on GOES-16’s ABI can highlight cloud tops made up of water droplets that occur underneath elevated smoke.
As the Sun gets higher in the sky, fog edges beneath the smoke become more apparent because forward scattering decreases. The animation below of the visible confirms this. In contrast, the fog edge in the IFR Probability is well-represented during the entire animation (although the horizontal resolution of the infrared channels on GOES-16 (at the sub-satellite point) is only two kilometers vs. 1/2-km for the Red Visible).
Note that IFR conditions are also occurring during this animation due to smoke over southwest Oregon. GOES-R IFR probability detects only cloud-forced IFR conditions, but not IFR conditions because of thick smoke only. Again, this is because smoke detection in the infrared is a challenge for ABI Channels and Rapid Refresh Model output does not as yet predict visibility restrictions due to smoke.
GOES-16 ABI ‘Red Visible’ Imagery (0.64 µm), 1342 – 1557 UTC on 30 July 2018, along with surface observations of Ceilings, Visibility, and Visibility Restrictions (Click to enlarge)
GOES-16 IFR Probability, 1342 – 1557 UTC on 30 July 2018, along with surface observations of Ceilings, Visibility, and Visibility Restrictions (Click to enlarge)