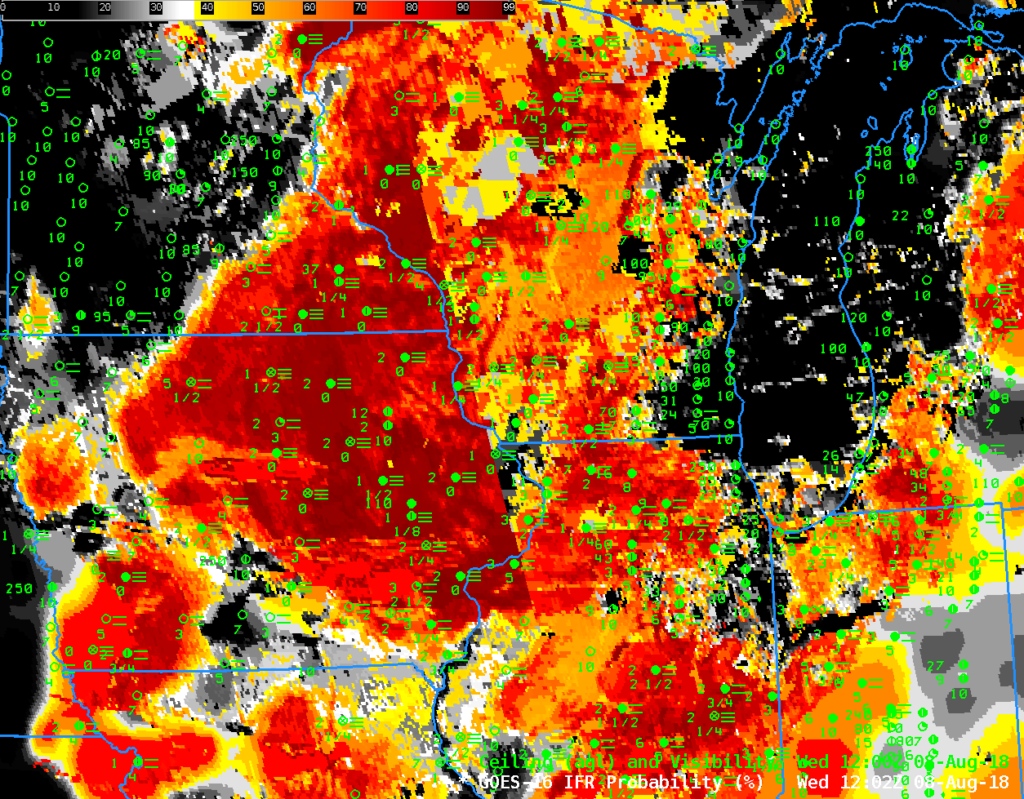
The longer August nights over the upper Midwest (for example, Madison Wisconsin’s night is about 70 minutes longer now than it was at the Summer Solstice) can allow for dense fog to form when light winds and clear skies follow a cloudy, damp day. The animation above shows the evolution of the GOES-R IFR Probability fields as the dense fog develops, a fog for which advisories were issued. The horizontal extent of the widespread fog is captured well in the IFR Probability fields. There are a couple of things worth noting.
There is a subtle — but noticeable — change in the IFR Probability Fields each hour in the animation. That change is related to model data in this fused product. Rapid Refresh Model output are used to identify regions of low-level saturation that must occur with fog. (The inclusion of this data helps IFR Probability better distinguish — compared to satellite imagery alone — between elevated stratus and fog). When output from newer model runs is incorporated (and that happens every hour), the IFR probability fields are affected. The amount of change is testimony to whether the sequential runs of the Rapid Refresh are consistent in capturing the developing fog. In this case, there were differences from one model run to the next.
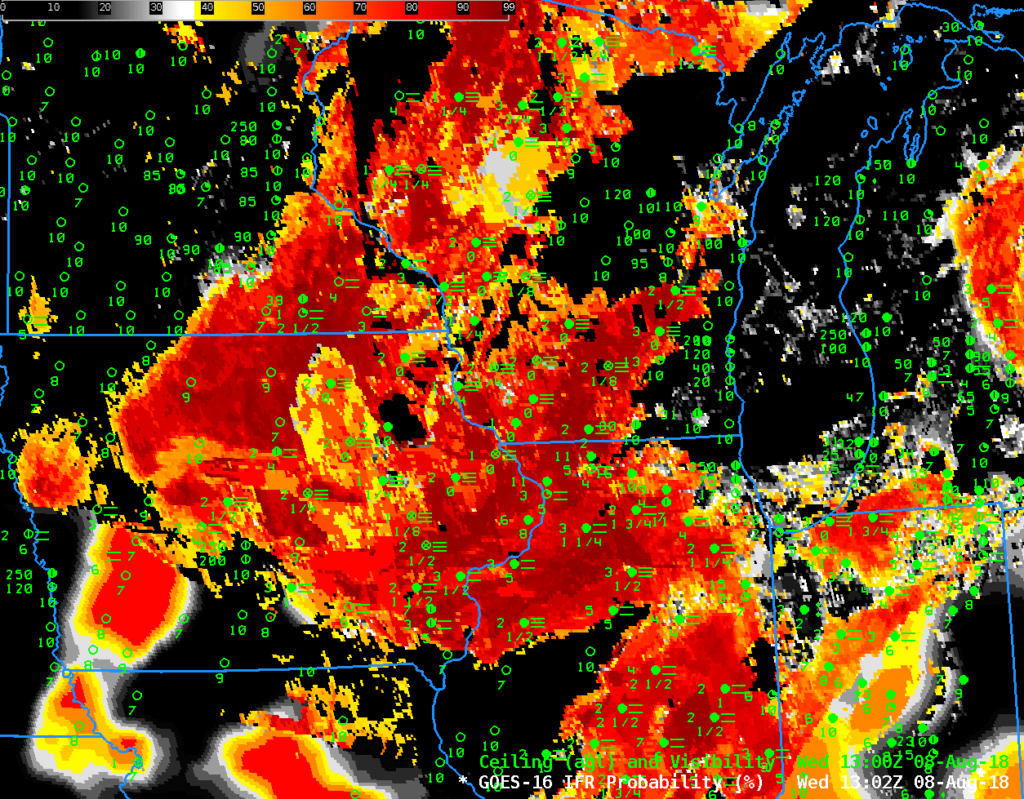
Two boundaries are apparent in the animation above, captured in the 1202 UTC image above, and in the 1302 UTC image below. These boundaries are related to the Terminator, the dividing line between night and day. During an hour around sunrise, rapid changes in reflected 3.9 µm solar radiation make the detection of low clouds difficult. Temporal adjustments are incorporated into the IFR Probability fields to create a cleaner field. In the 1202 UTC image, above, the effects of sunrise are occurring along the NNW-SSE oriented boundary near the Mississippi River in southwestern WI (The boundary is parallel to the Terminator line, so it will be vertical — parallel to a Longitudinal Line — on the Equinoxes). In the 1302 UTC image, below, the second boundary is over far northwestern Wisconsin, far southeastern Minnesota, and eastern Iowa. The region between these two westward-propagating boundaries is where information from previous times is used in the IFR Probability fields. Thus, when the second boundary passes, you may observe rapid changes in IFR Probability fields.
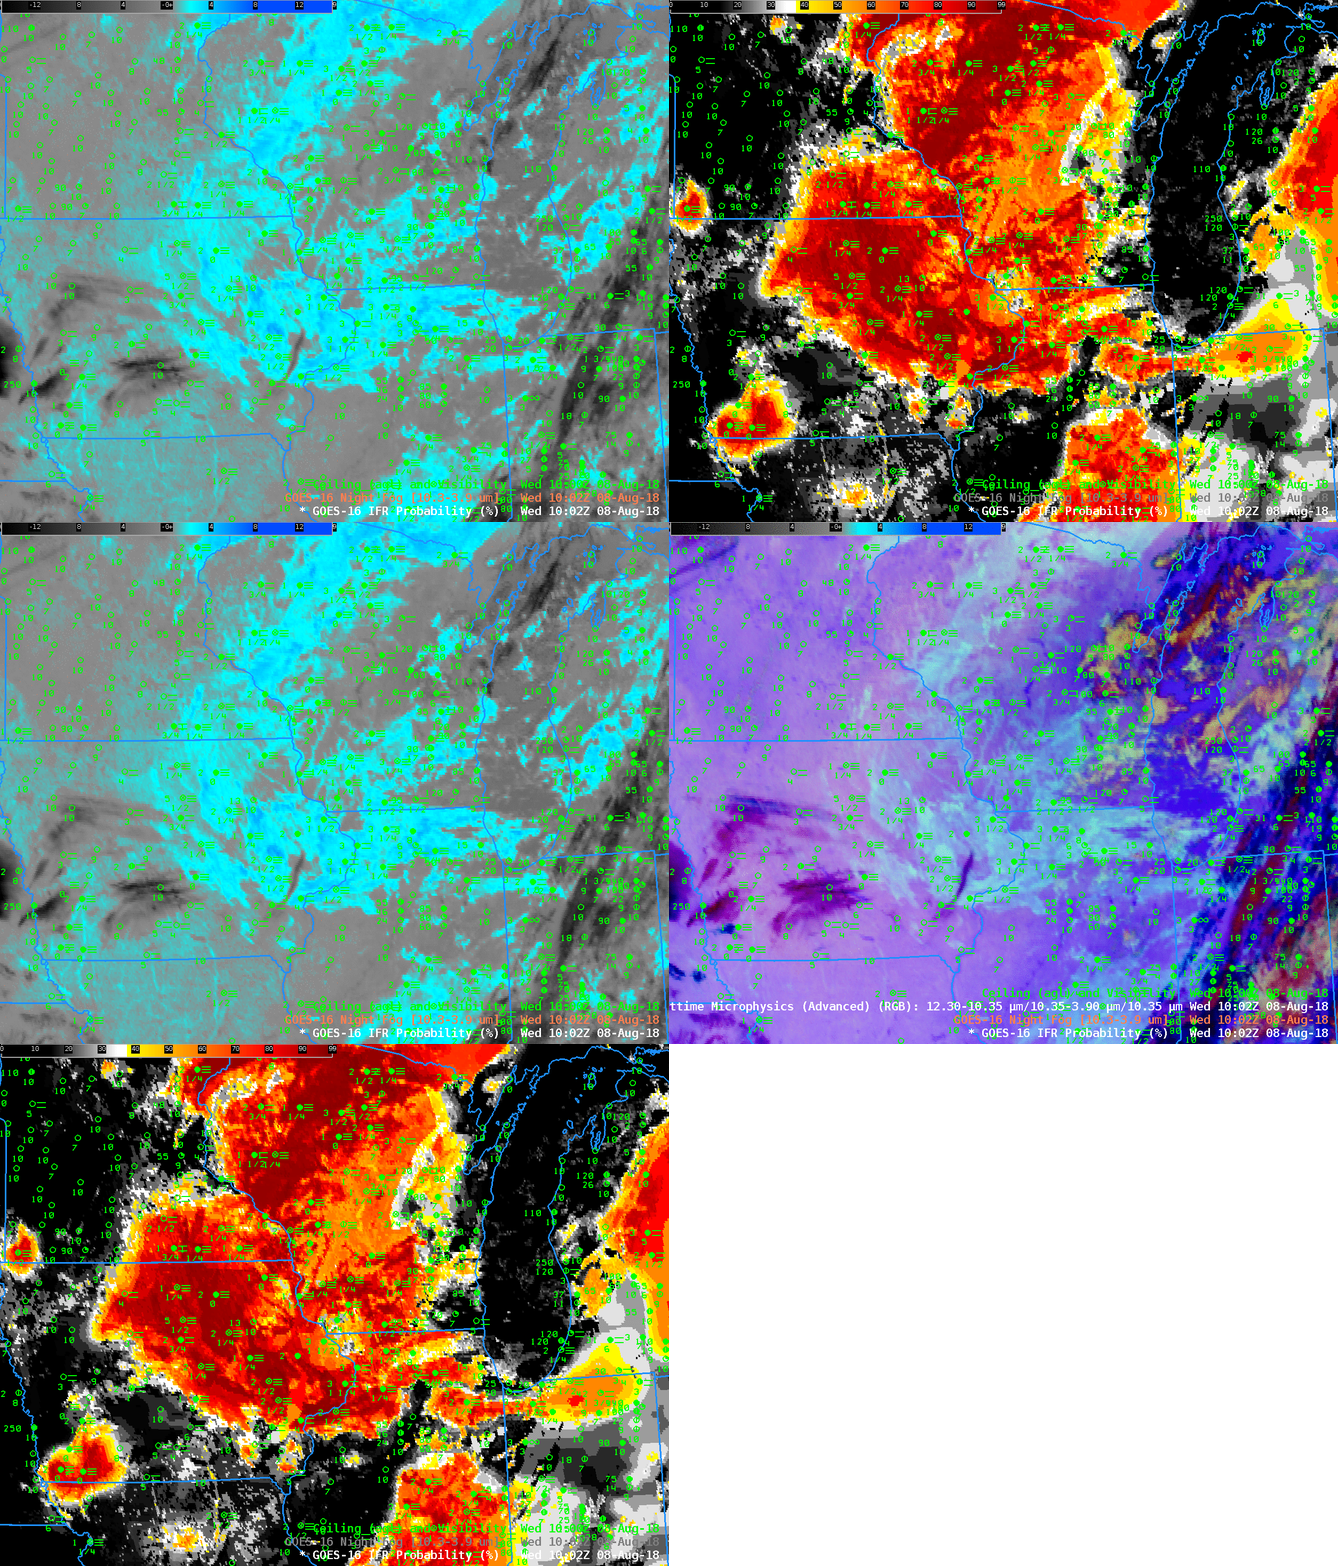
The Night Fog Brightness Temperature Difference (10.3 µm – 3.9 µm) can be used to detect stratus, and that field is also a constituent (the ‘green’ part) of the Advanced Nighttime Microphysics RGB. The animation below compares these two products used to detect stratus with IFR Probability at 1002 UTC on 8 August 2018. The Night Fog Brightness Temperature Difference fails to highlight regions of fog over central WI (and elsewhere), so neither it nor the RGB give a consistent signal over the entire fog-shrouded region.


