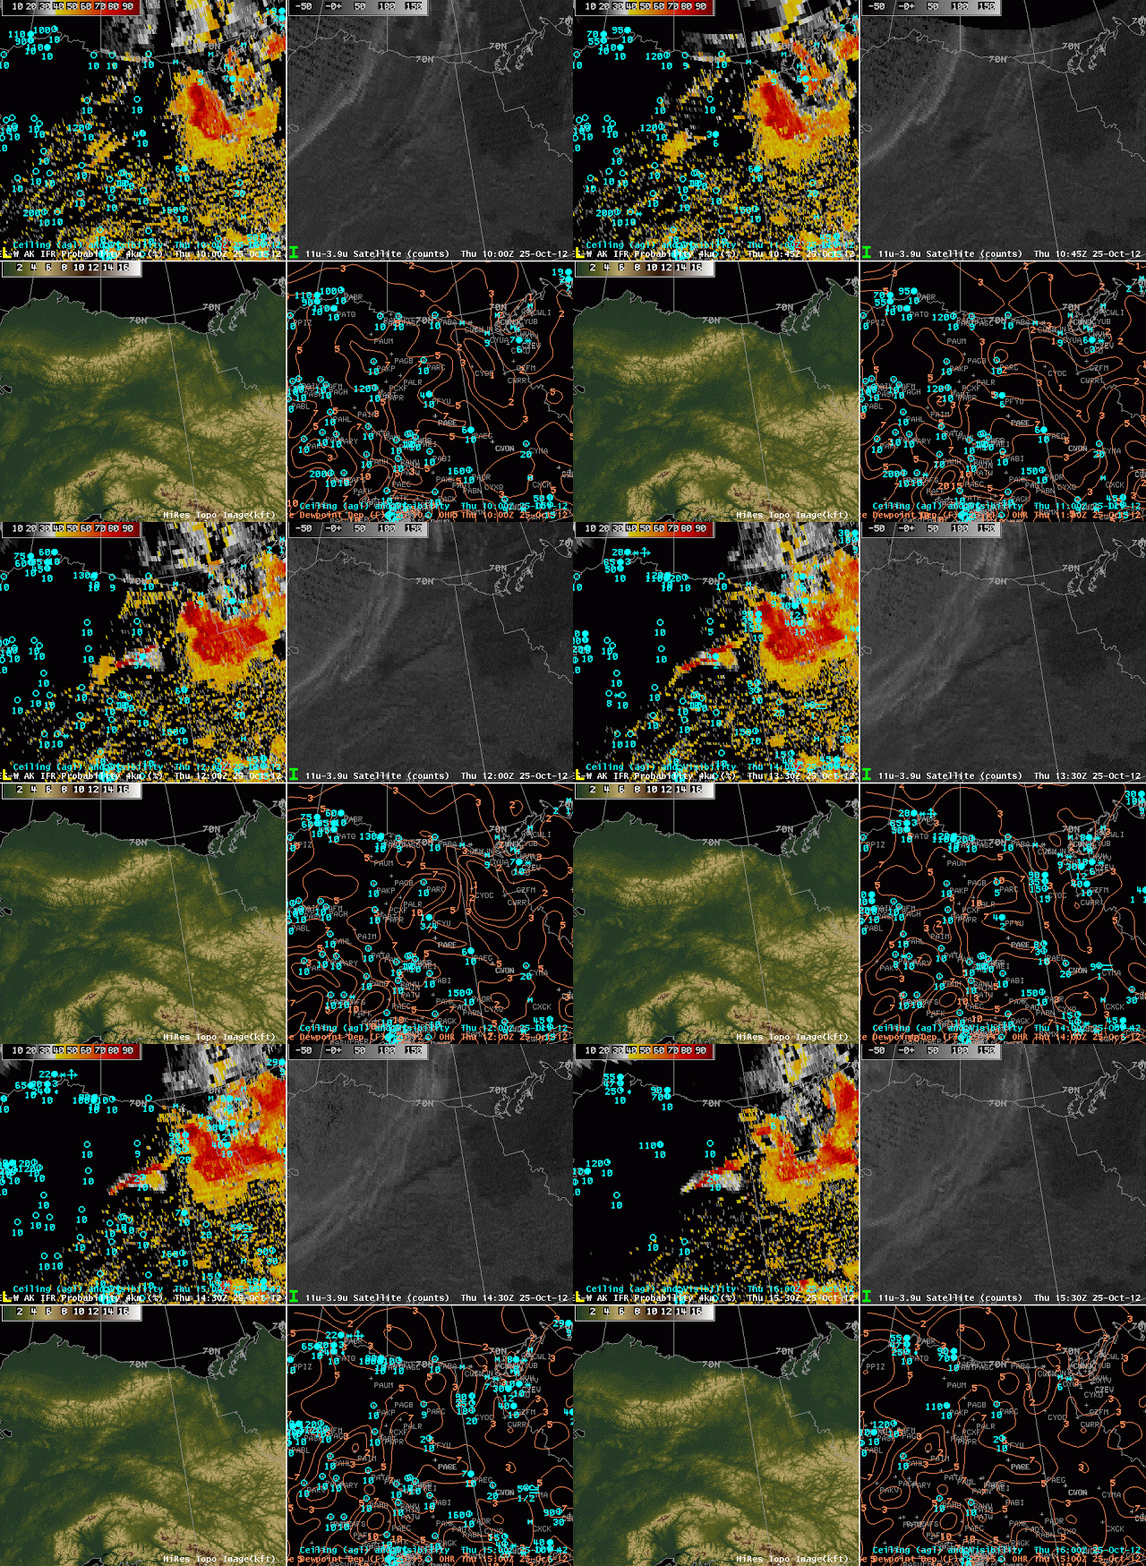
Detection of fog and low stratus in Alaska present some unique challenges related both to the very low sun angle that is common there, and the large GOES-West pixel size. Nevertheless, the fused product does give important information in a state where small planes are ubiquitous for transport between towns. The loop above shows the development of IFR conditions within the Yukon River valley in east-central Alaska; note the reduction in visibility that occurs at Fort Yukon (and only there) as the IFR probabilities increase. IFR probabilities also increase in the Yukon Territory of Canada. The lack of surface observations there highlights another challenge in Alaska: Verification of predictions of IFR conditions.
Category Archives: Terrain
GOES-R Probabilities evolve as the night progresses
MODIS and VIIRS yield satellite information that can be used to detect fog/low stratus at high spatial resolution. In the exa,ple above, the VIIRS brightness temperature difference product highlights many river valleys as possibly cloud-filled over eastern Kentucky, southern Ohio and southwestern West Virginia. The coarser resolution of the GOES satellite pixel precludes such fine-scale detection. Note, however, that both satellite platforms detect the presence of stratiform water clouds over north-central Ohio where surface observations show only mid-level cloudiness. IFR probabilities are confined to the spine of the Appalachians from the Laurel Mountains near Johnstown (PA) southward towards southern West Virginia. How do things evolve with time?
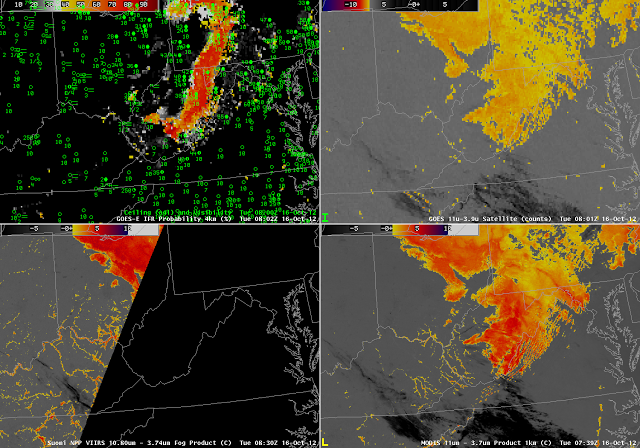 |
| As above, but from near 0800 UTC |
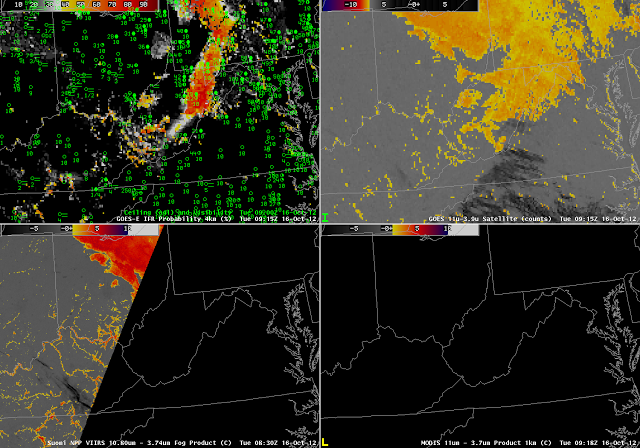 |
| As above, but from near 0915 UTC |
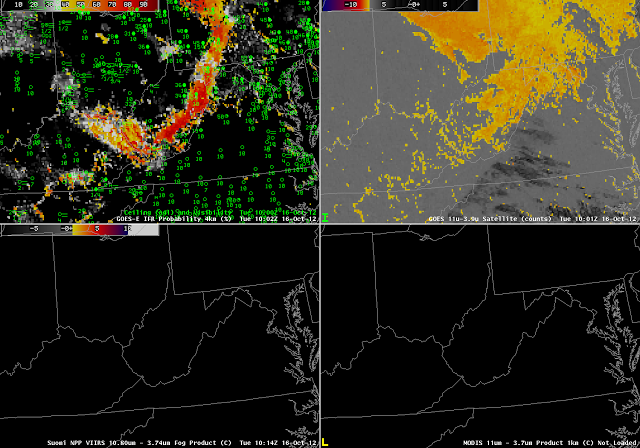 |
| As above, but from near 1000 UTC |
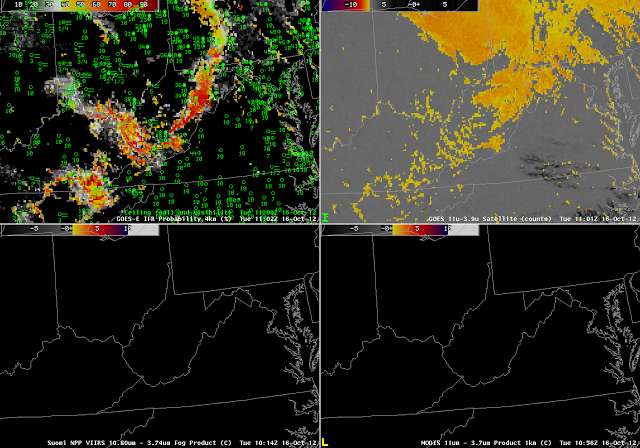 |
| As above, but from near 1100 UTC |
The power of GOES imagery in this case is to show the evolution of the fog/low stratus field. Even at this only-hourly timestep, the development of regions of IFR conditions is evident, and those developing conditions occur in tandem with increasing probabilities in the GOES-R IFR Probability field. Throughout the night, the GOES brightness temperature difference field flags the unimportant (from an aviation standpoint) stratus deck over northcentral Ohio, and the IFR probability field, which field also uses Rapid Refresh Model data, discounts the satellite signal. By 1100 UTC, the river valley signal has strengthened enough in the GOES imagery to appear, and a corresponding increase in IFR probability occurs.
IFR Probability can also be computed using MODIS data (below). The 0739 UTC MODIS data, shown at the top of this blog post, highlights — as does GOES — the stratus deck over northern Ohio. The MODIS-based IFR probabilities, however, do not highlight that cloud-deck, by design. Note also that the higher-resolution MODIS imagery, because it detects river valley fogs at 0739 UTC, also has a strong IFR probability signal there. Pixel resolution on GOES-R will be intermediate between MODIS and present GOES.
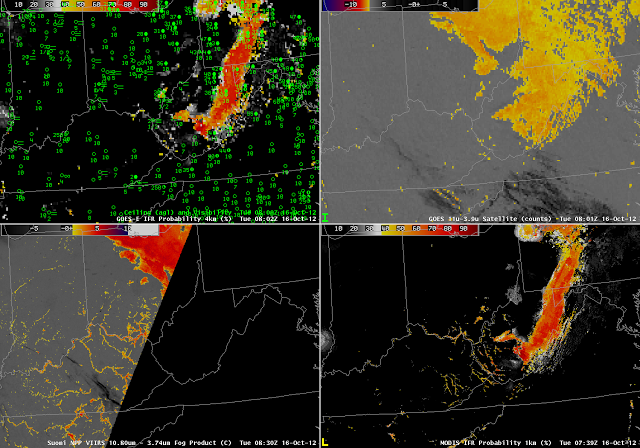 |
| As at top, for near 0800 UTC, but with MODIS-based IFR probabilities in the lower right |
Fog/Low clouds over Alaska
 |
| Hourly images of GOES-West GOES-R IFR Probabilities over Alaska, 10 September 2012 |
IFR Probabilities and how they trend with time can help a forecaster determine the most likely regions where IFR conditions are occurring, and where they may occur in the near future. The animation above illustrates several key facts about the product.
The region over interior Alaska is one where both Rapid Refresh model data and satellite imagery are being used to produce the IFR product. This is related to the pixelated aspect of the field in that region. The high probabilities at the top of the image correspond to the location of the Brooks Range — higher topography there means IFR conditions are more common as the terrain rises into any low clouds that are present. There is a region of modest IFR probabilities over the Bering Sea north of the Aleutians and west of the mainland. These values are relatively low (orange and yellow color), and uniform, because they are computed with the Rapid Refresh data only. There is a region that moves in from the western edge that includes satellite data as well, and that is reflected both in the increased pixelated look to the field, and in the higher probabilities. (Note that St. Paul Island — PASN — is reporting IFR conditions during this time) When model data only are used in the computation of GOES-R IFR Probabilities (as occurs, for example, in regions of multiple cloud layers, or where a single high cirrus deck is present), probabilities are lower than in regions where satellite data also is used. Very high probabilities occur only where satellite data can be used to gauge IFR probabilities. Note also in this image that the western edge of the Rapid Refresh domain is obvious, west of 170 W longitude.
Note that in the inland region of enhanced IFR probabilities, Galena AK is near the highest values, and it is experiencing reduced visibilities and IFR conditions with freezing fog at 1400 UTC. Those conditions continued through 1600 UTC (below).
 |
| GOES-R IFR Probabilities computed from GOES-West and Rapid Refresh, 1600 UTC 10 September 2012 |
IFR Probabilities during an extratropical cyclone in the Gulf of Alaska
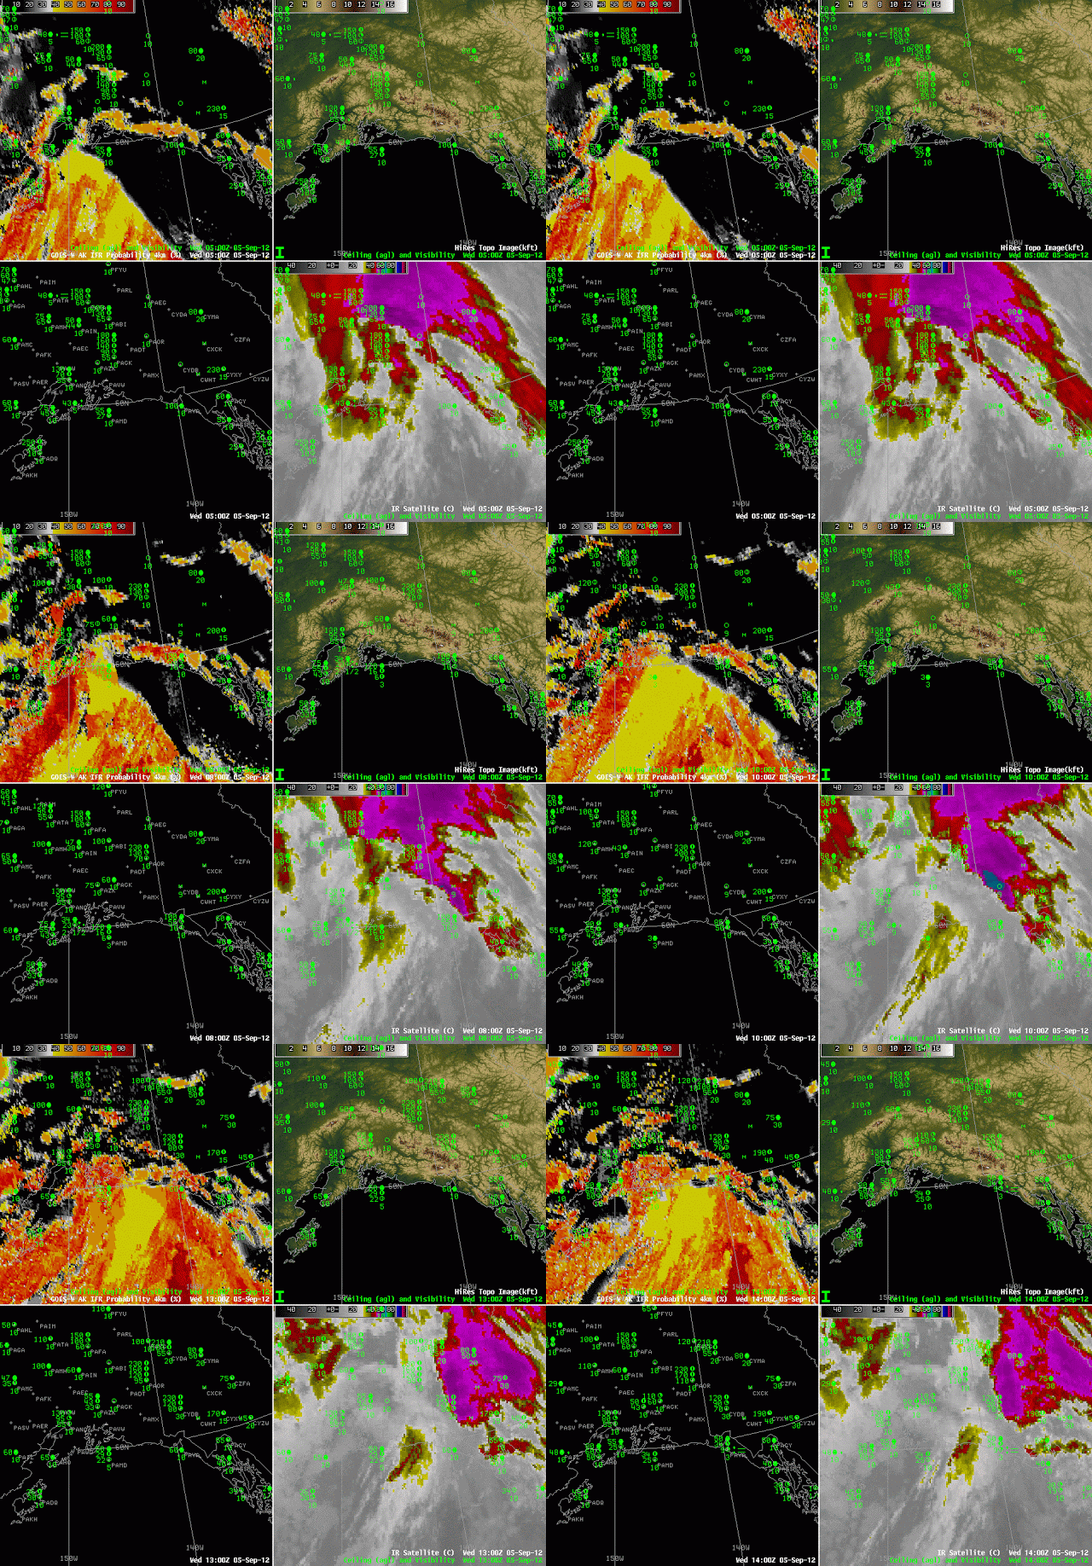 |
| GOES-R IFR Probabilities (Upper left), Color-enhanced Topography (Upper right), Surface Observations and ceilings (Lower Left), Enhanced 10.7 imagery (Lower right) |
Oceanic storms will generate IFR conditions, and the GOES-R IFR Probability fields, a fused product that blends satellite and model information, provides an indication of how and when visibilities decrease. The animation above, at hourly intervals, shows the steady advance of higher IFR probabilities eastward through the Gulf of Alaska. Note how the observations at Middleton Island (PAMD) and at Yalutat (PAYA) both transition to IFR conditions as the ‘front’ of higher probabilities passes — around 0700 UTC at PAMD and around 1300 UTC at PAYA.
The IFR probability field includes regions that are characteristic of model-only predictors being used (the large yellow region that stretches NNE-SSW over the Gulf of Alaska at 1200 UTC) and regions where both model and satellite data are used (the more pixelated region south of the Aleutians at the end of the animation). When model predictors only are used, probabilities are typically lower than when both model and satellite predictors are used.
GOES-R Fog/Low Stratus in Alaska
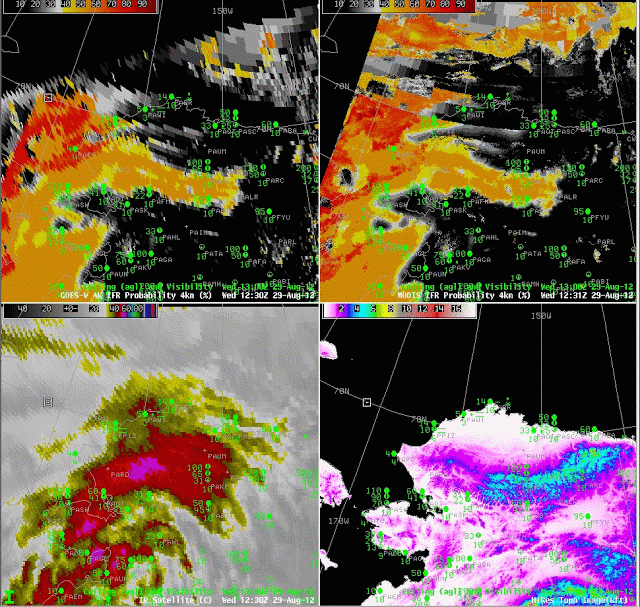
Alaska poses unique challenges in both Fog/Low stratus detection and in aviation forecasting. For example, there are very few observation sites — airports — where verification of products can occur. The abundance of small aircraft — bush aircraft — means that aviation support is critical in remote regions where such aircraft will operate. Alaska is also far enough north that the GOES-West pixel footprint size is very large, making detection of small-scale fog events difficult.
The series of images above document some of these issues. The GOES-R IFR Probabilities computed with GOES-West data (upper left) and MODIS data (upper right) show similar patterns. But the far superior resolution inherent in polar orbiters over Alaska results in far greater detail in the MODIS product. This is a case with multiple cloud layers over northern Alaska (as evidenced by the 10.7 window channel image, lower left); the enhanced IFR probabilities along the Brooks Range in northern Alaska are mostly model-driven (the model used in that region is the Rapid Refresh (the boundary between the Rapid Refresh and the GFS is apparent in the upper left image over the Bering Sea and over far northern Alaska). The model suggests IFR conditions are possible in an elevated stratus cloud that surrounds the Brooks Range. That is, the terrain is rising up into the clouds.
Valley Fog over Appalachia
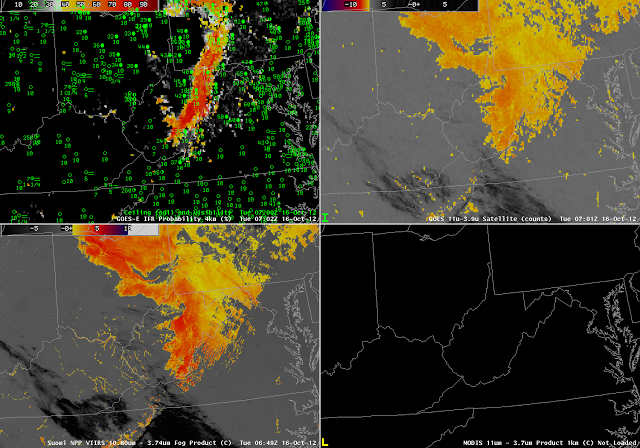
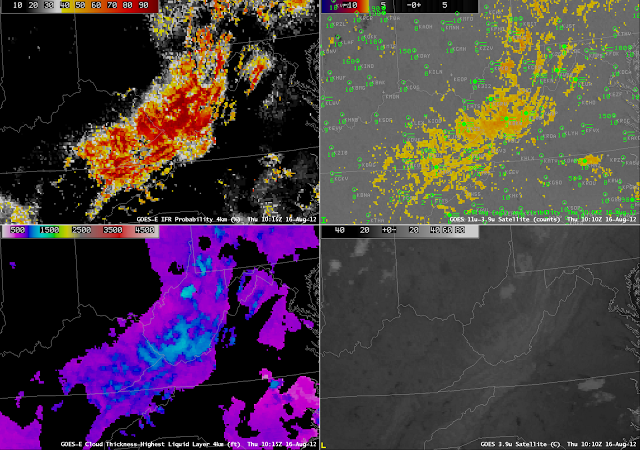
The radiation fog example over West Virginia and surrounding states on 16 August highlights characteristic strengths of the GOES-R Fog/Low Stratus products. Note, for example, how the enhanced brightness temperature field shows no apparent signal over the Ohio River Valley along the western border of West Virginia, despite the presence of IFR conditions at Pt. Pleasant (K3I2) and Huntington (KHTS). In contrast, the IFR probability does the suggest the possibility of visibility obstructions in the valley.
Note the region of low cloud over north-central North Carolina. The feature is quite apparent in the 3.9-micrometer imagery, and the brightness temperature difference field also has a maximum return there. This cloud is likely elevated stratus (brightness temperatures were generally in the single digits Celsius), and the IFR Probability field correctly diminishes the strong satellite predictor signal there.
Terrain
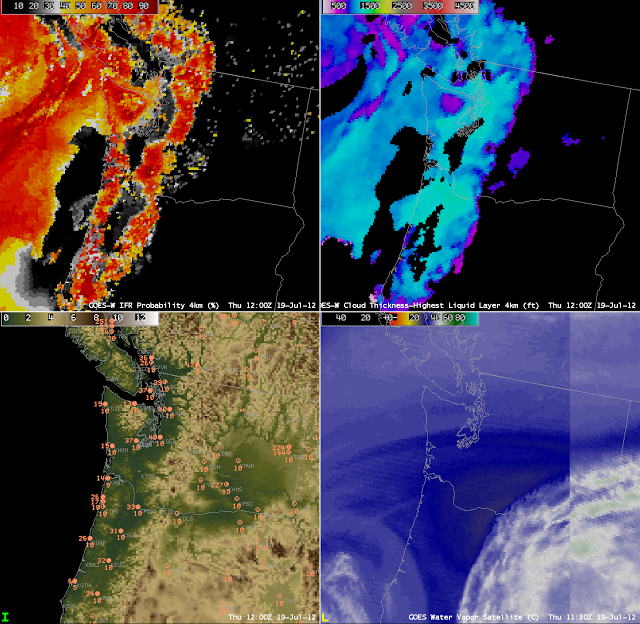 |
|
| GOES-R IFR Probabilities (Upper left), GOES-R Cloud Thickness (Upper right), Terrain with surface plots of Ceiling (above MSL) and visibility (lower left) and the GOES-15/GOES-13 Water vapor imagery |
When terrain rises up into the clouds, IFR conditions occur, and the GOES-R IFR product shows that effect. These images from ~1200 UTC on 19 July 2012 show two regions of IFR conditions over the Pacific Northwest — along the spine of the coastal range from the Olympic Mountains south to the Oregon Coast Range and along the Cascades from east of Seattle southward to Oregon. The observations shown in the lower left (with ceilings above mean sea level, plotted over topography) are consistent with the IFR probabilities: Low probability over the region between the coastal range and the Cascades, and high probability in regions over the Cascades where the height exceeds the observed ceilings over, say, Seattle and Portland, and high probabilities along the Coastal Range where heights exceed the observed ceilings along the coast.

