 |
| GOES-R IFR Probabilities (Upper Left), Brightness Temperature Difference (10.7 micrometers – 3.9 micrometers) (Upper Right), GOES-R Cloud Thickness (Lower Left), GOES-East 3.9 micrometer imagery (Lower Right) |
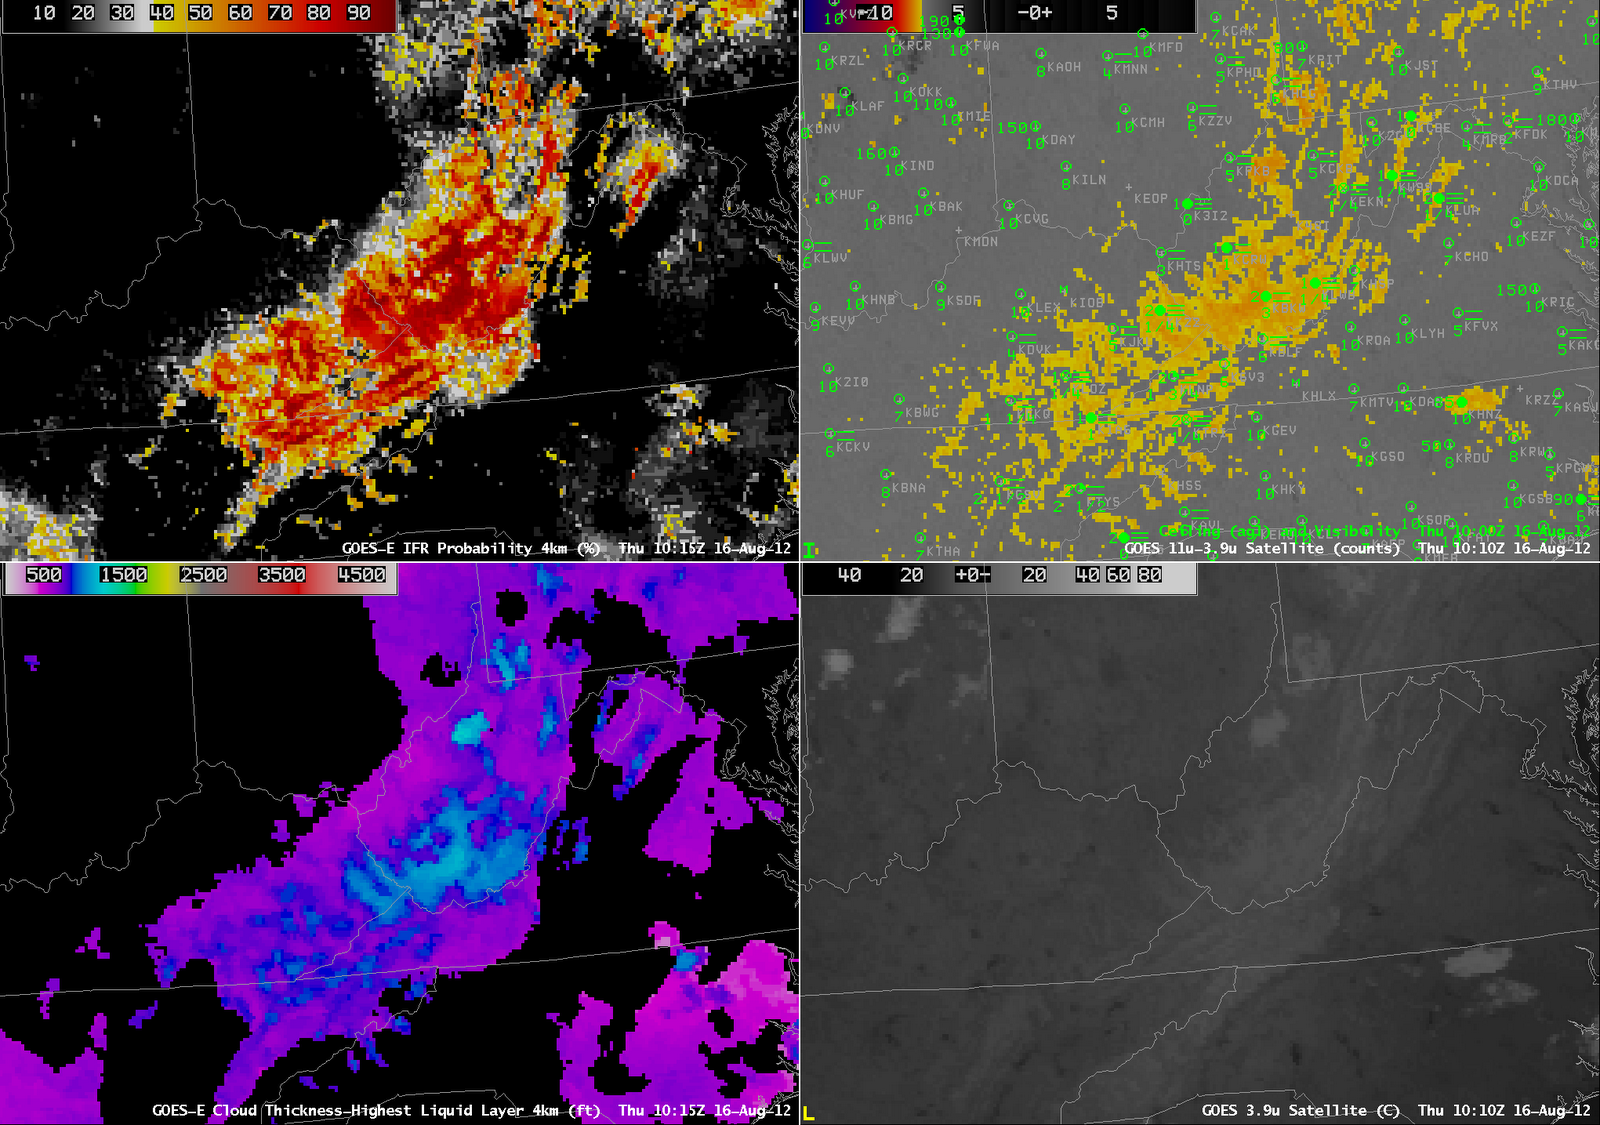
The radiation fog example over West Virginia and surrounding states on 16 August highlights characteristic strengths of the GOES-R Fog/Low Stratus products. Note, for example, how the enhanced brightness temperature field shows no apparent signal over the Ohio River Valley along the western border of West Virginia, despite the presence of IFR conditions at Pt. Pleasant (K3I2) and Huntington (KHTS). In contrast, the IFR probability does the suggest the possibility of visibility obstructions in the valley.
Note the region of low cloud over north-central North Carolina. The feature is quite apparent in the 3.9-micrometer imagery, and the brightness temperature difference field also has a maximum return there. This cloud is likely elevated stratus (brightness temperatures were generally in the single digits Celsius), and the IFR Probability field correctly diminishes the strong satellite predictor signal there.