Category Archives: Terrain

GOES Resolution might miss valley fog (Plus: What does Stray Light look like?)

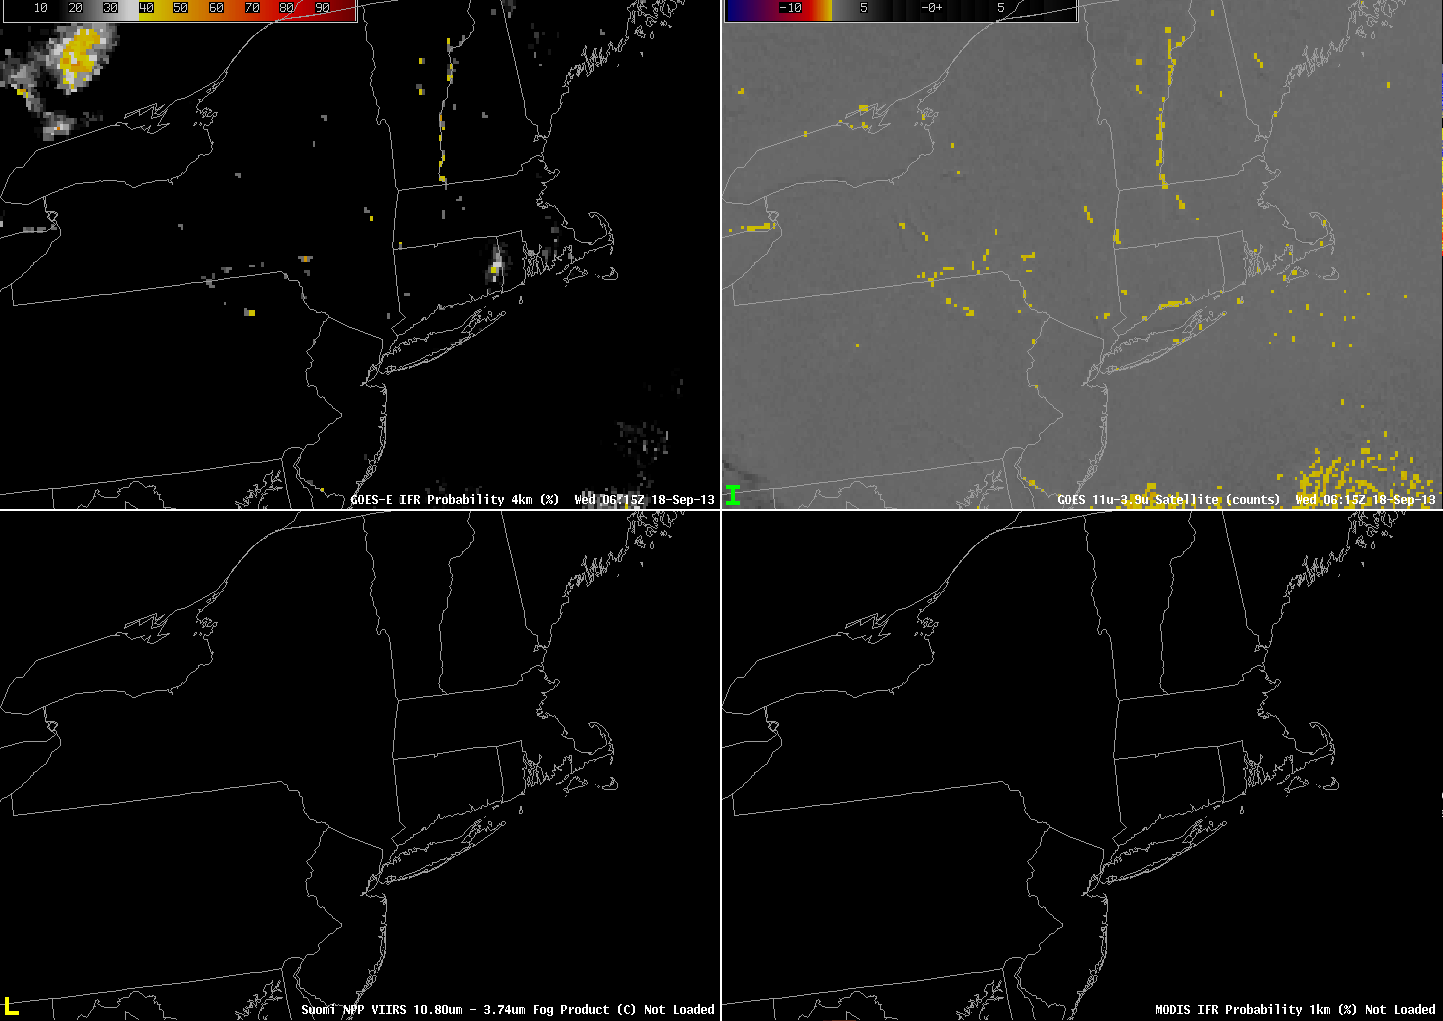
GOES_IFR_PROB_20130918_0615

GOES-R IFR Probability (Upper Left), GOES-East Brightness Temperature Difference (Upper Right), Suomi/NPP Brightness Temperature Difference (Lower Left), MODIS-based IFR Probability (Lower Right), all imagery at 0615 UTC on 18 September 2013 (click image to enlarge)

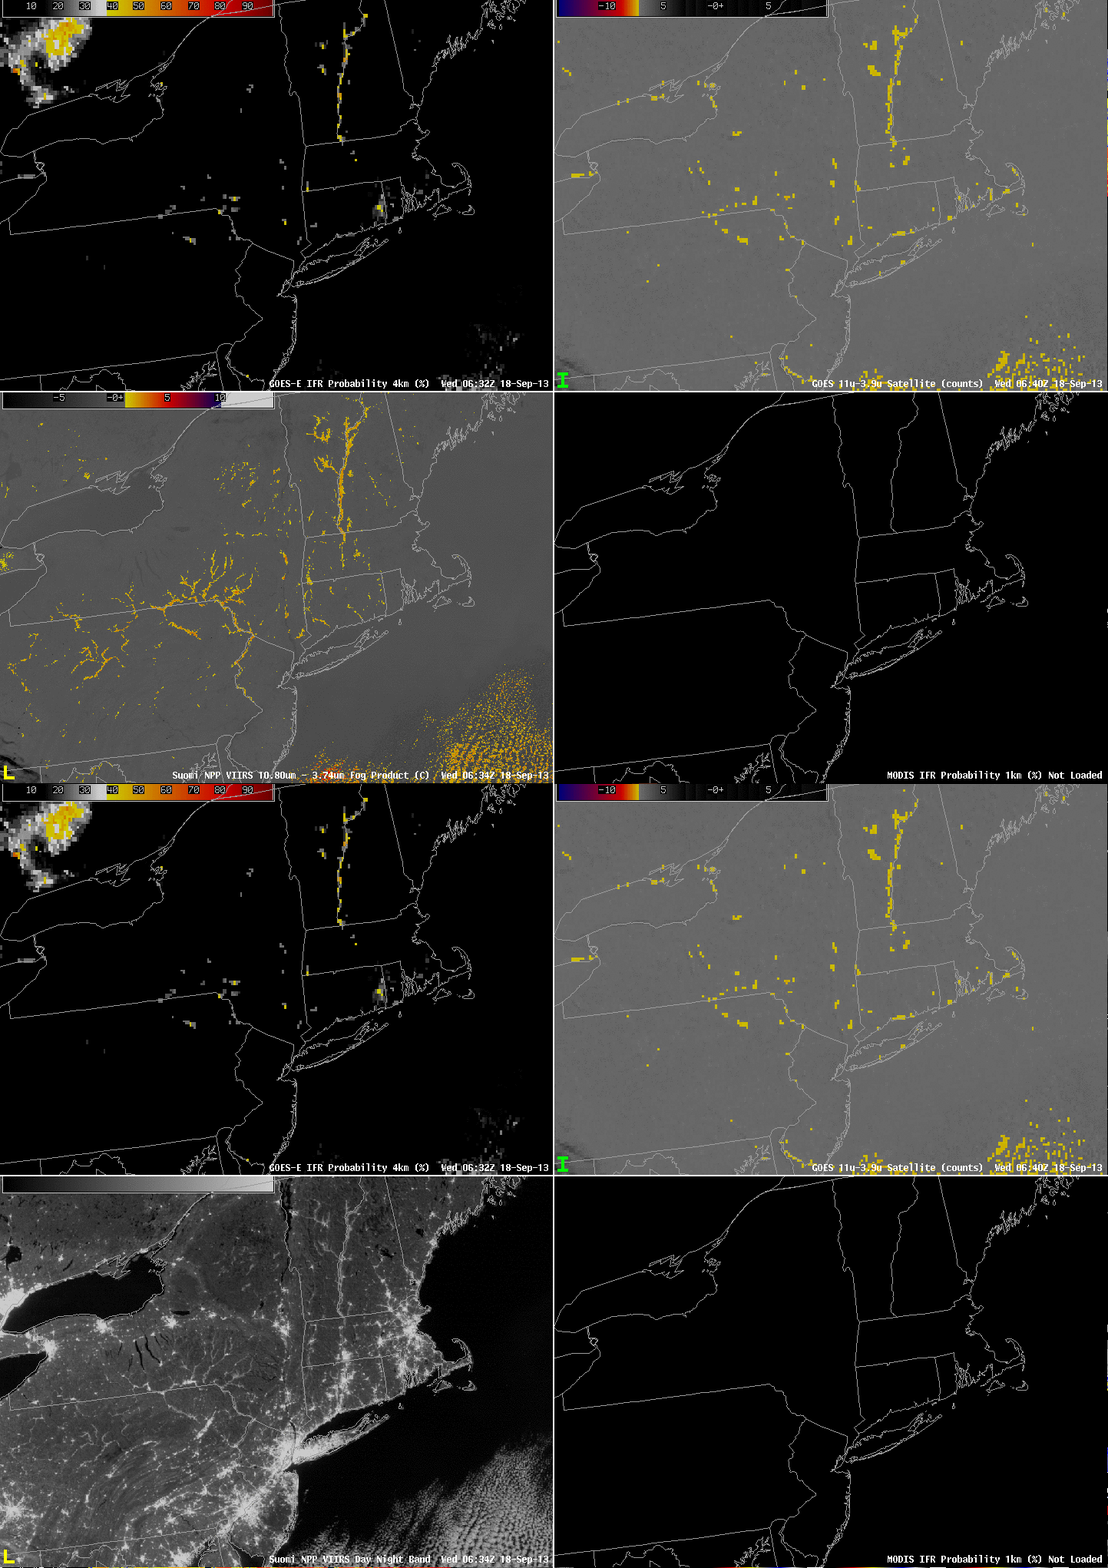
Nominal GOES resolution for the Brightness Temperature Difference product that is used in the GOES-R IFR Probability is 4 km at the sub-satellite point, and it worsens as you move into mid-latitudes. Rapid Refresh Model resolution is even coarser than the satellite. When fog is forming in narrow valleys, then, there can be a significant lag in the time from when it starts to form to when the satellite data, and the satellite/model fused product, detects it. In the 0615 UTC image above, for example, only a few pixels of strong GOES-detected Brightness Temperature Difference, and enhanced IFR Probabilities, exist. In the 0630 UTC image, below, there has been little change in the GOES-based imagery. However, the Suomi/NPP data at the time, at 1-km resolution, suggests fog is forming in many of the river valleys of Pennsylvania, but it is still sub-gridscale as far as GOES can detect.
VIIRS_DNBBTD_20130918_0634loop

GOES-R IFR Probability (Upper Left), GOES-East Brightness Temperature Difference (Upper Right), Toggle between Suomi/NPP Day/Night band imagery and Suomi/NPP Brightness Temperature Difference (Lower Left), MODIS-based IFR Probability (Lower Right), all imagery at ~0630 UTC on 18 September 2013 (click image to enlarge)
GOES_IFR_PROB_20130918_0645

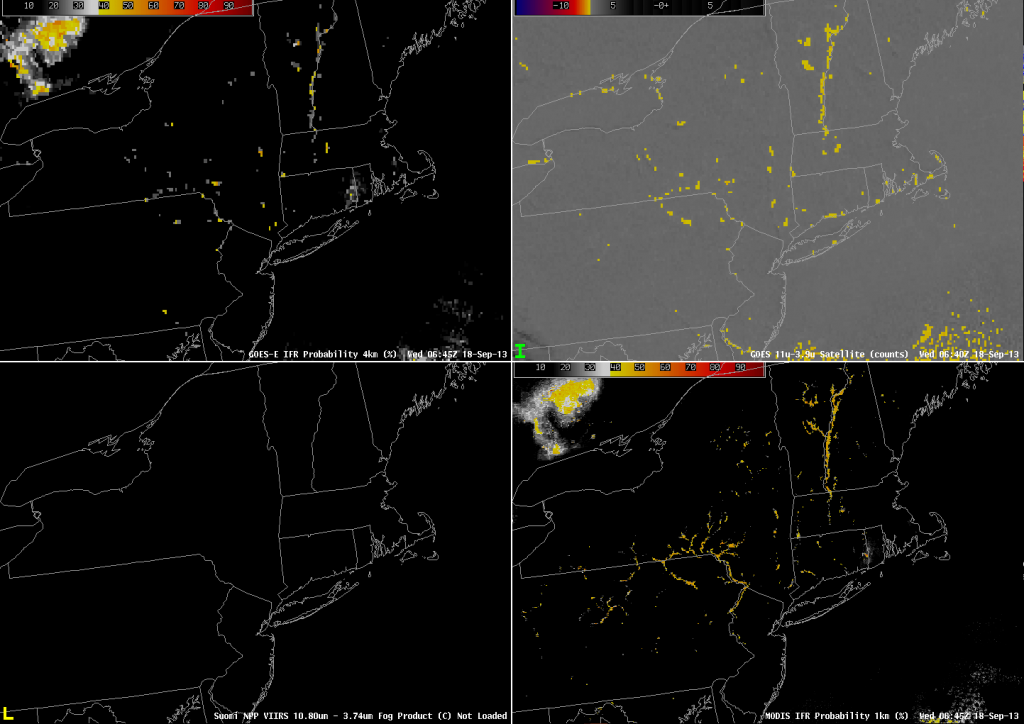
GOES-R IFR Probability (Upper Left), GOES-East Brightness Temperature Difference (Upper Right), Suomi/NPP Brightness Temperature Difference (Lower Left), MODIS-based IFR Probability (Lower Right), all imagery at 0645 UTC on 18 September 2013 (click image to enlarge)

Fifteen minutes later, the MODIS-based IFR probabilities (above) suggest a strong possibility of IFR conditions in many of the river valleys of Pennsylvania. However, Suomi/NPP and MODIS data come from polar orbiters so that high resolution information is infrequent. When GOES-R is launched, ABI will have nominal 2-km resolution in the infrared, which resolution is intermediate between GOES and MODIS.

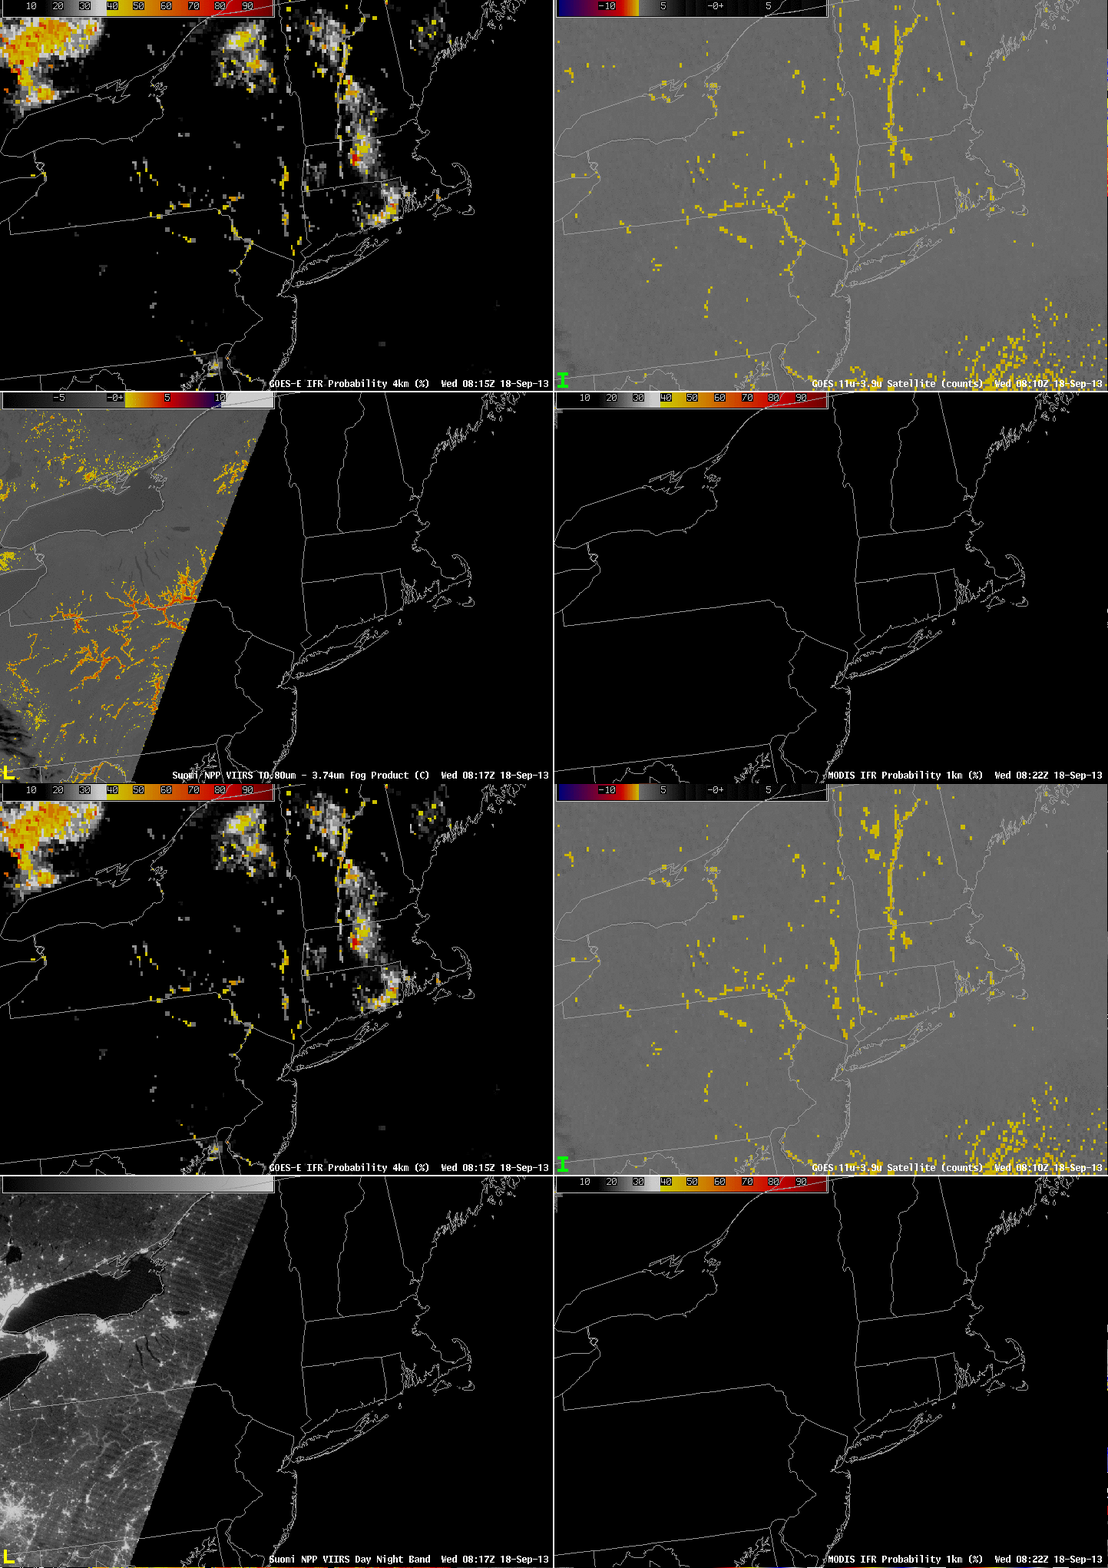
The higher-resolution polar orbiters’ occasional views can give a forecaster an important heads’ up for fog formation. By 0815 UTC the GOES-based information is showing higher IFR probabilities in the river valleys of Pennsylvania, but a Suomi/NPP overpass shows that it is still underestimating the areal extent of the fog.
VIIRS_DNBBTD_20130918_0817loop

GOES-R IFR Probability (Upper Left), GOES-East Brightness Temperature Difference (Upper Right), Toggle between Suomi/NPP Day/Night band imagery and Suomi/NPP Brightness Temperature Difference (Lower Left), MODIS-based IFR Probability (Lower Right), all imagery at ~0815 UTC on 18 September 2013 (click image to enlarge)

Note that this is a time of year when stray light does occasionally enter the GOES signal, causing contamination. This occurred — and was very obvious — around 0400 UTC on 18 September. As is typical, it was present for only one scan. See below.

GOES_CLD_THICK_20130918loop

GOES-R IFR Probability (Upper Left), GOES-East Brightness Temperature Difference (Upper Right), GOES-R Cloud Thickness (Lower Left), MODIS-based IFR Probability (Lower Right), all imagery at ~0815 UTC on 18 September 2013 (click image to enlarge)

Resolution: GOES vs. MODIS and Suomi/NPP over Appalachia

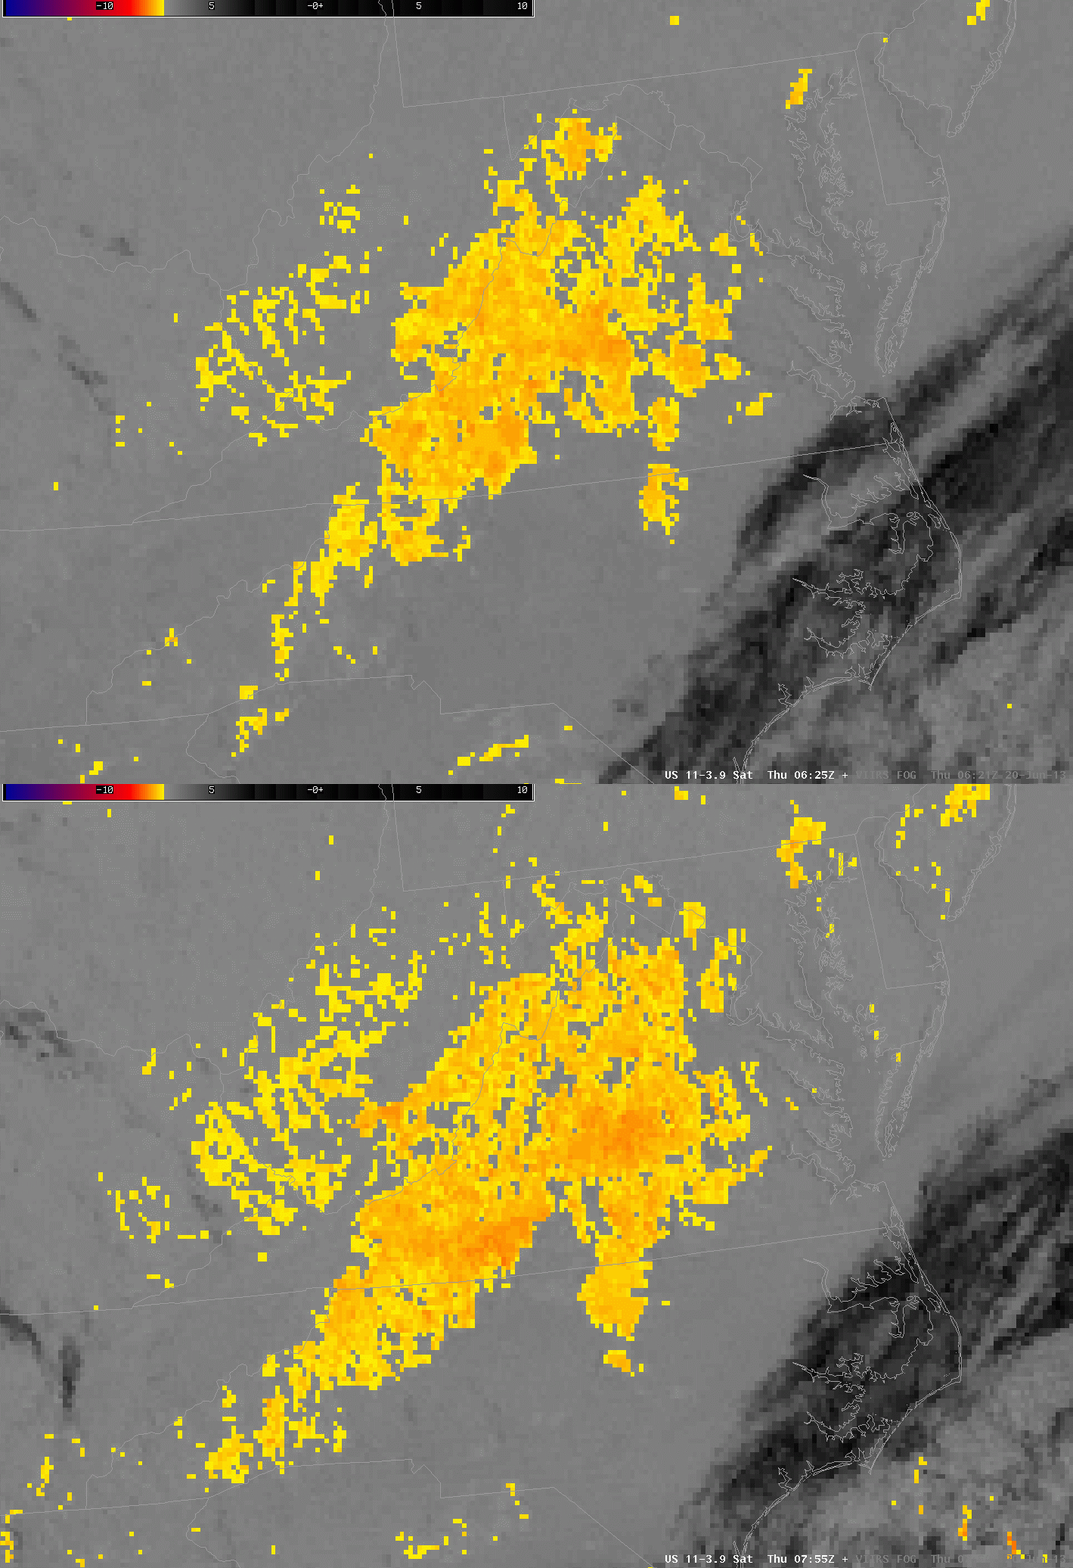
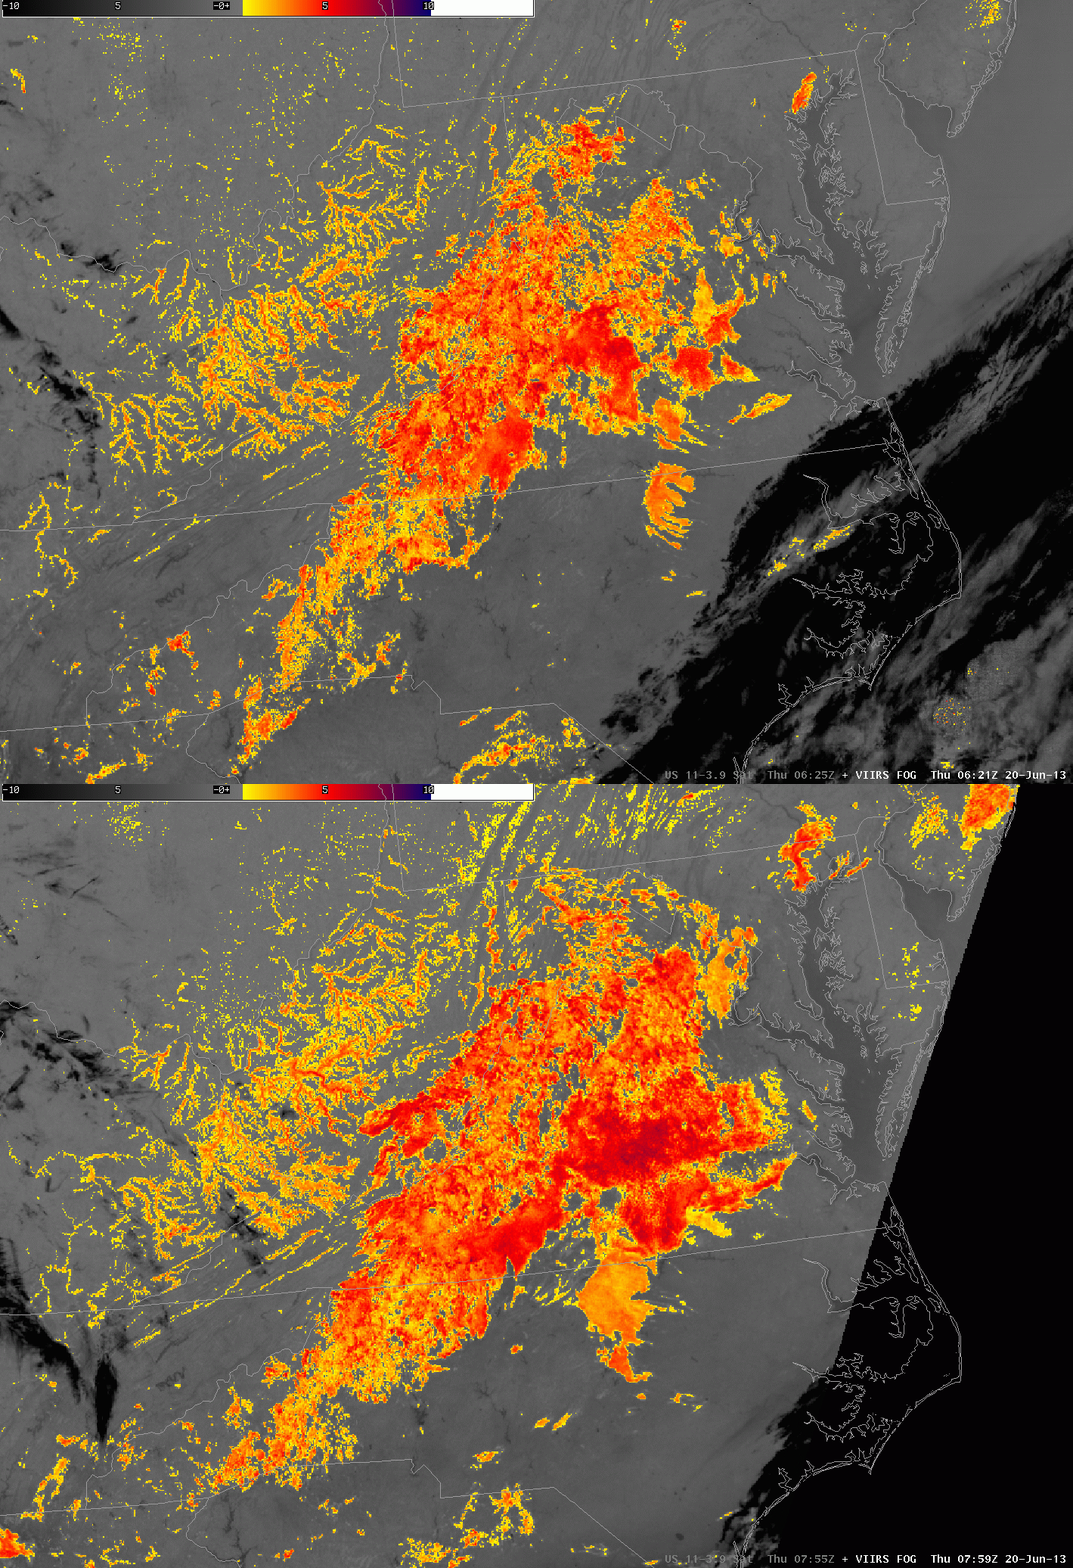
Brightness Temperature Difference (11µm – 3.74µm) at 0621 and 0750 UTC on 20 June 2013.  Data from VIIRS instrument on Suomi/NPP
Brightness Temperature Difference (10.7 µm – 3.9 µm) at 0625 and 0755 UTC on 20 June 2013.  Data from Imager GOES-East.

The GOES Imager, with a nominal (sub-satellite point) resolution of 4 km, has trouble detecting fog when that fog forms over very narrow valleys, as are common over the central Appalachians of the eastern United States.  Compare the views from the GOES Imager (the bottom images) to the view from the Suomi/NPP VIIRS instrument that has 1-km resolution.  VIIRS is much better able to capture the dendritic nature of valley fog, and also to detect it at all when the horizontal scale is very small (for example, the southwest-to-northeast oriented valleys in extreme southwest Virginia).  Thus, a signal will appear first in the high-resolution 1-km polar orbiter data, sometimes several hours before it appears in the coarser-resolution GOES Imager data.

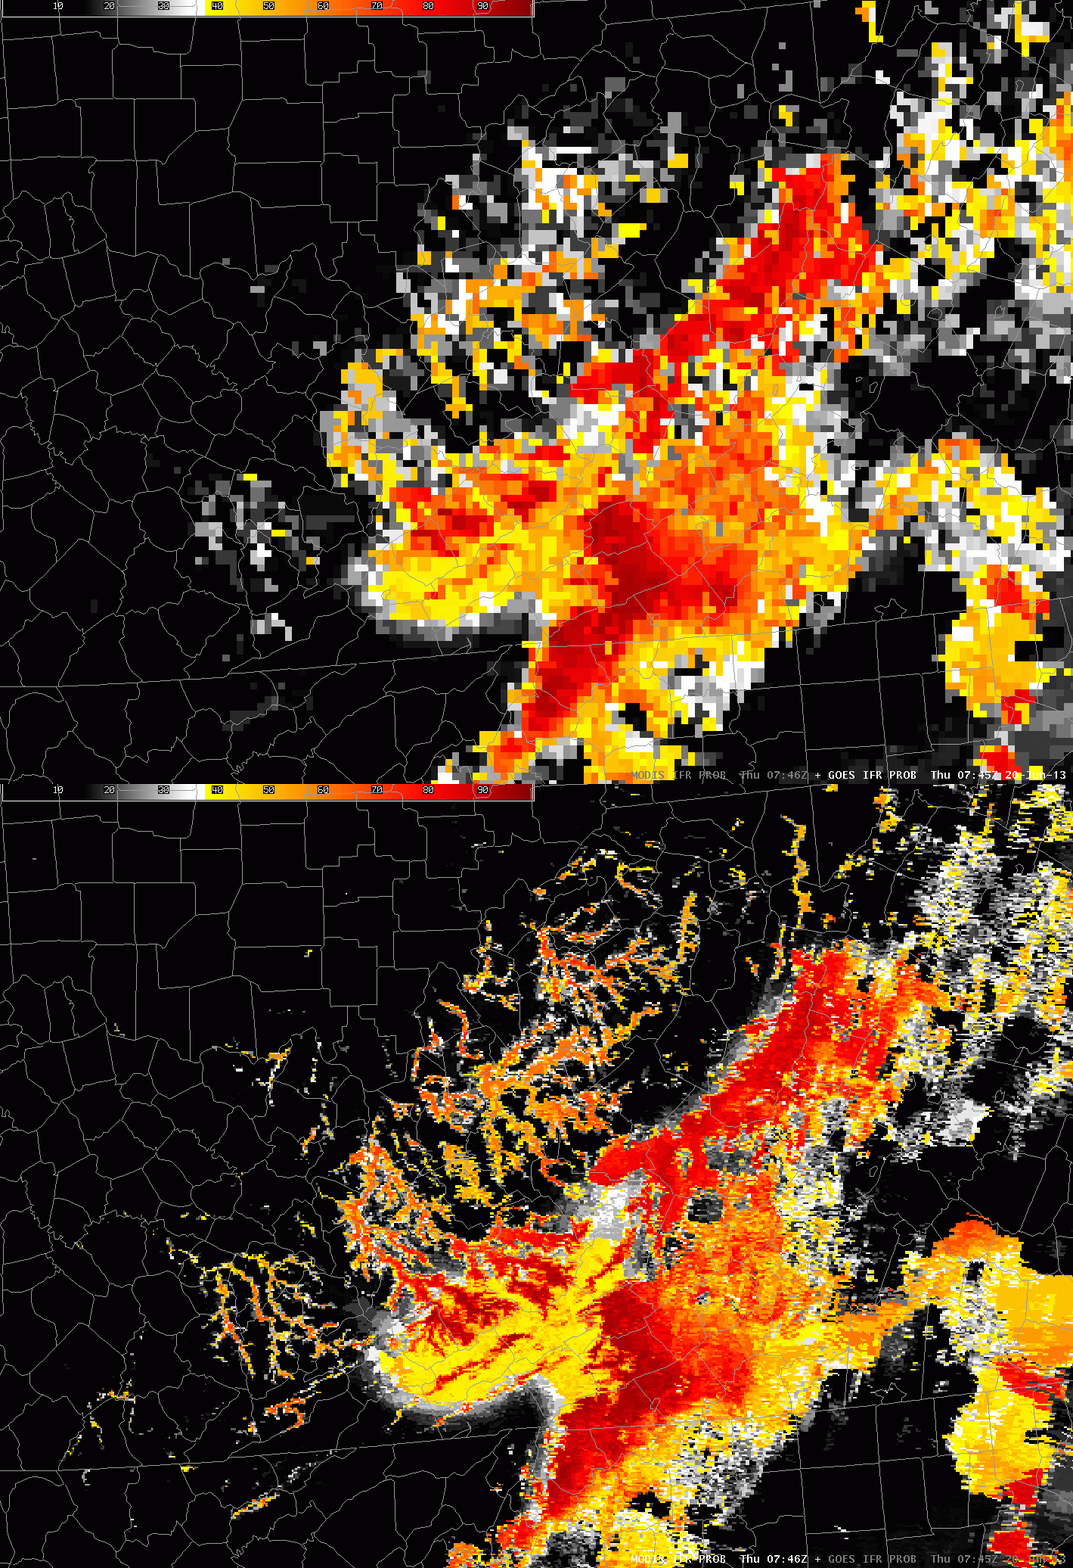
These resolution issues that are apparent in the Brightness Temperature Difference fields, above, the traditional method of detecting fog and low stratus, carry over to the GOES-R IFR Probability fields.  Imagery below, from 0745 UTC on 20 June 2013 suggests that the higher-resolution MODIS data better captures the structure of fog in mountain valleys.  Note also the horizontal shift in the field that occurs because of the GOES parallax shift.

GOES-R IFR Probability fields computed from GOES-East and from Aqua MODIS data, 0745 UTC on 20 June 2013

Radiation Fog over the Allegheny Mountains of Pennsylvania

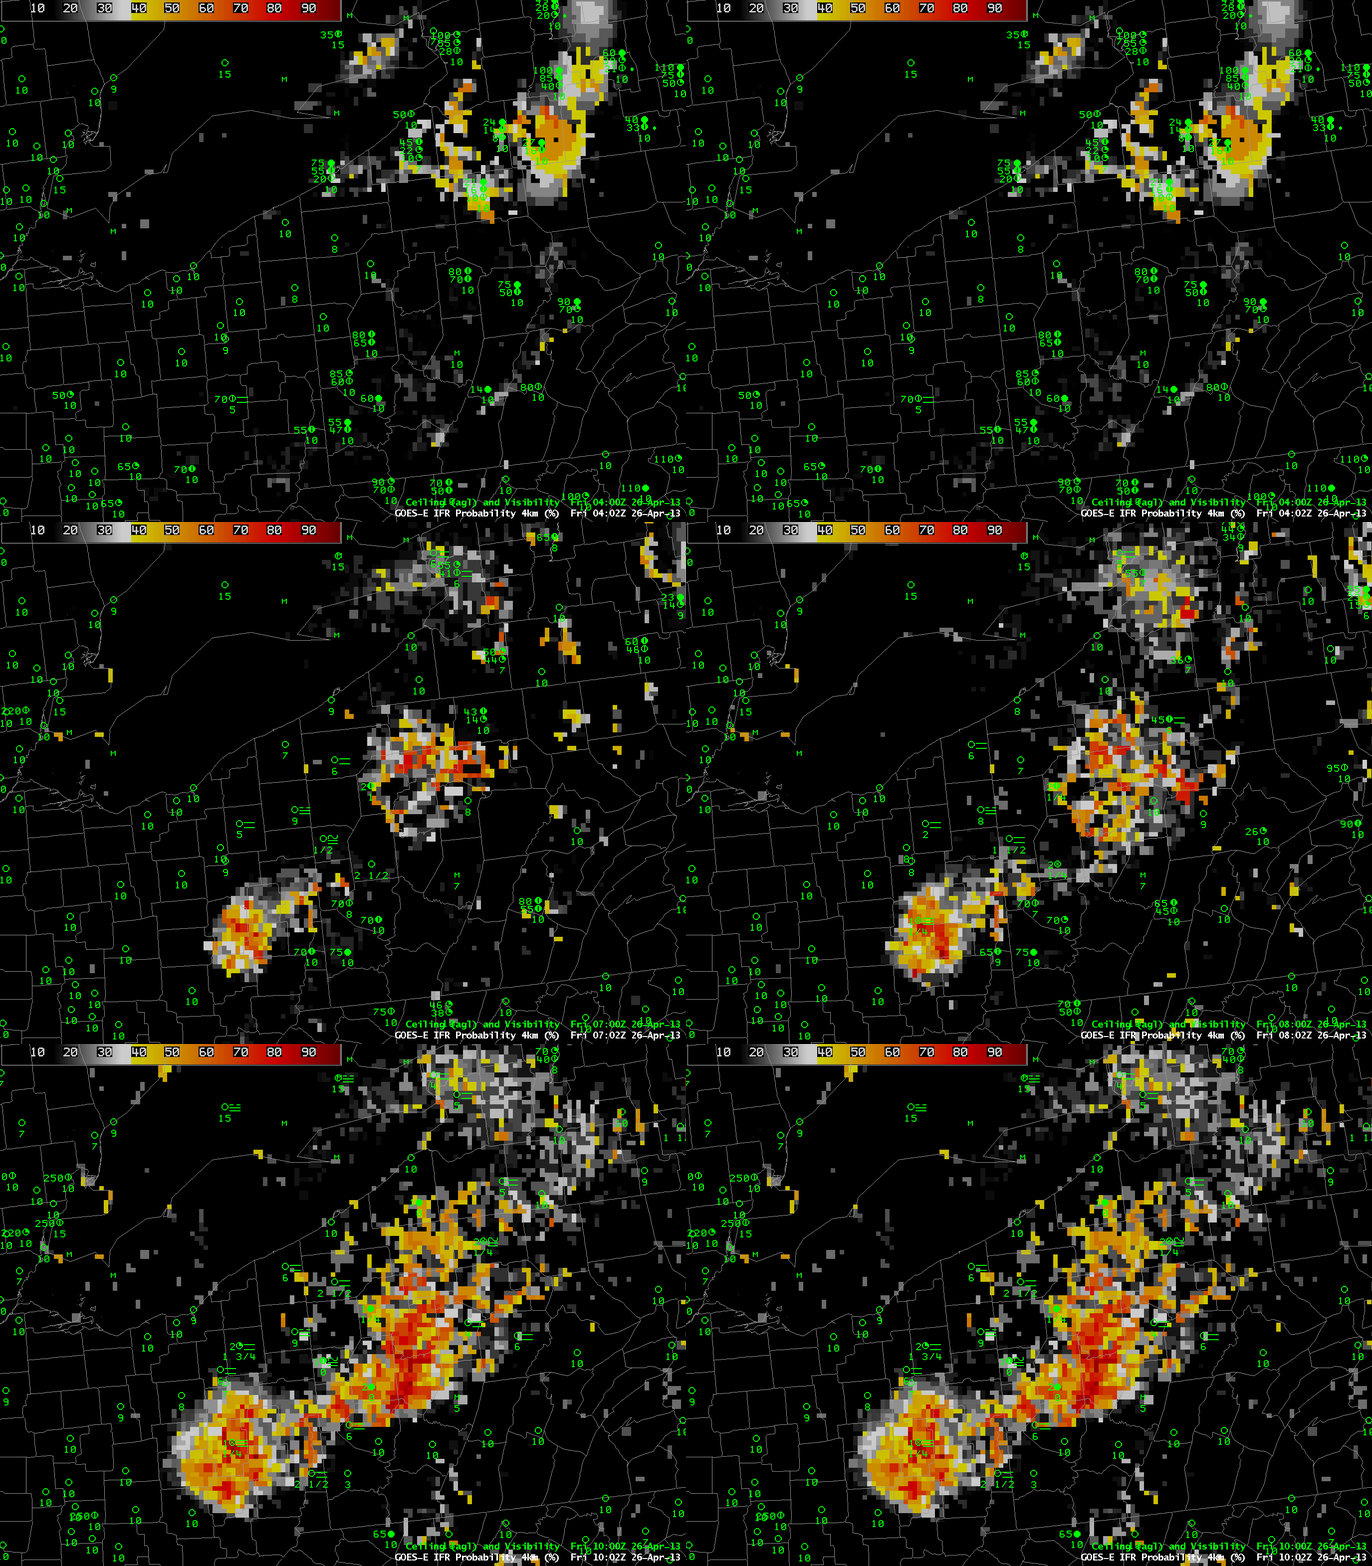
GOES-R IFR Probabilities computed using GOES-East data, hourly from 0400 UTC through 1000 UTC (excluding 0500 UTC), 26 April 2013

GOES-R IFR Probabilities show a region over the Allegheny Mountains of northwest Pennsylvania slowly acquiring higher and higher probabilities, as ceilings and visibilities drop.  How did this product perform relative to traditional fog detection imagery (the brightness temperature difference product) and relative to data from Polar Orbiting satellites?  (The 0500 UTC imagery is excluded from the animation above because Stray Light Contamination in the 3.9 channel was apparent in the IFR probability fields).

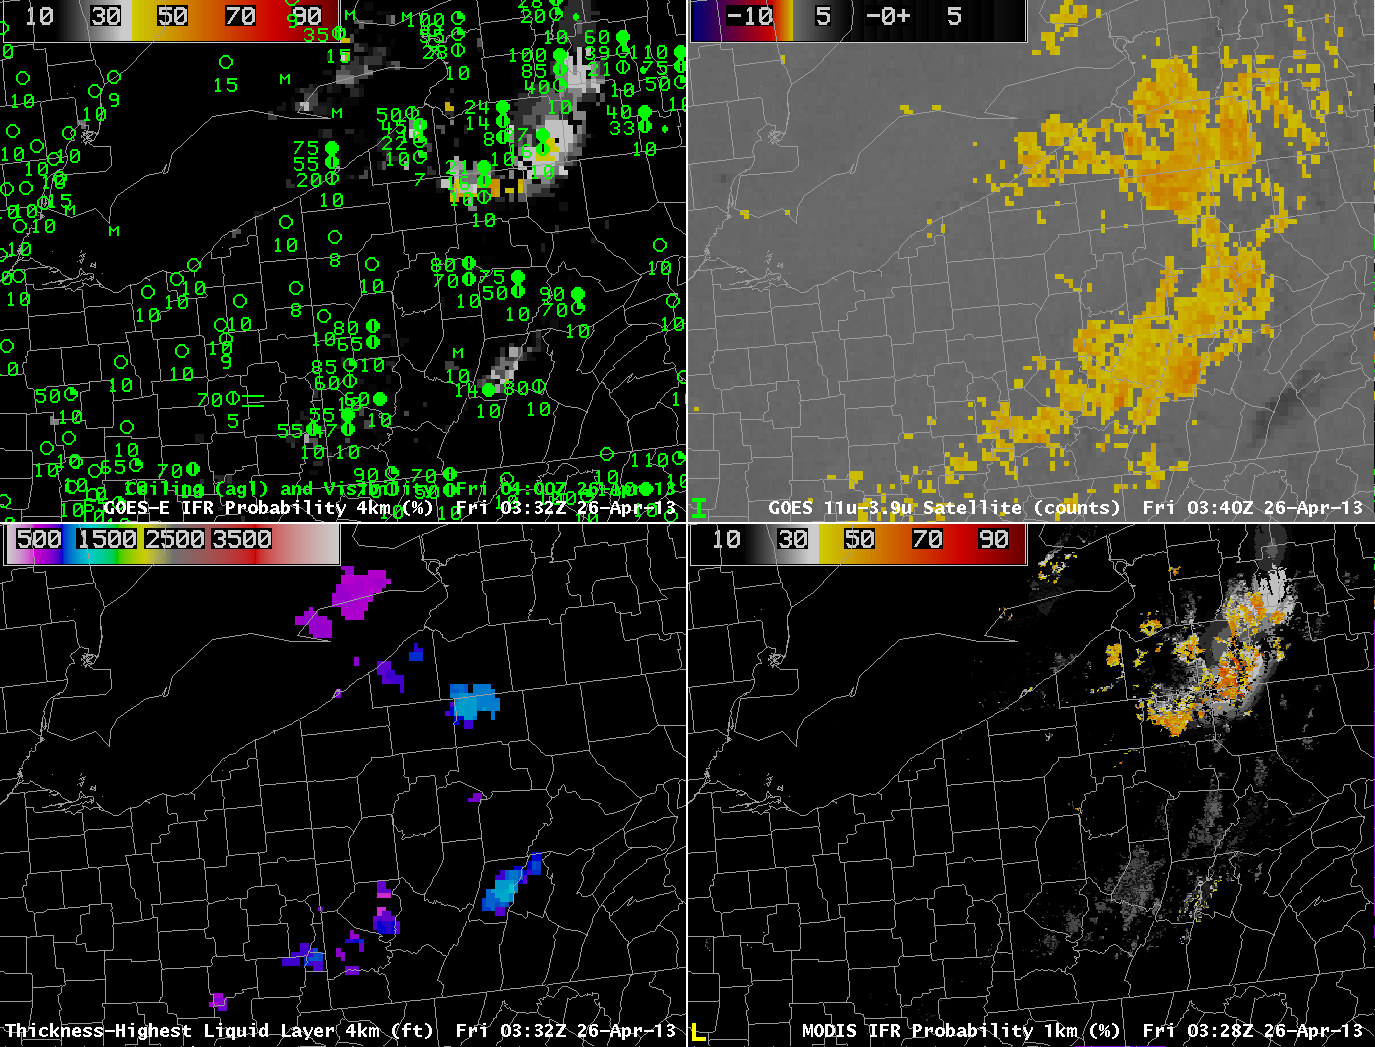
GOES-R IFR Probability computed from GOES-East, 0332 UTC (Upper Left), GOES-East Brightness temperature Difference field (10.7µm – 3.9µm) at 0340 UTC (Upper Right), GOES-R Cloud Thickness (Lower left), GOES-R IFR Probability computed from MODIS data, 0328 UTC (Lower Left).

The ‘traditional’ method of fog detection that exploits emissivity difference of water clouds at 10.7µm and 3.9 µm, upper right in the figure above, at about 0330 UTC, just as the radiation fog was starting to develop, shows clouds detected over north-central Pennsylvania, but also from Centre County southwestward to the Laurel Highlands and to West Virginia.  GOES-based and MODIS-based IFR Probability fields have very low probabilities with these primarily mid-level clouds.

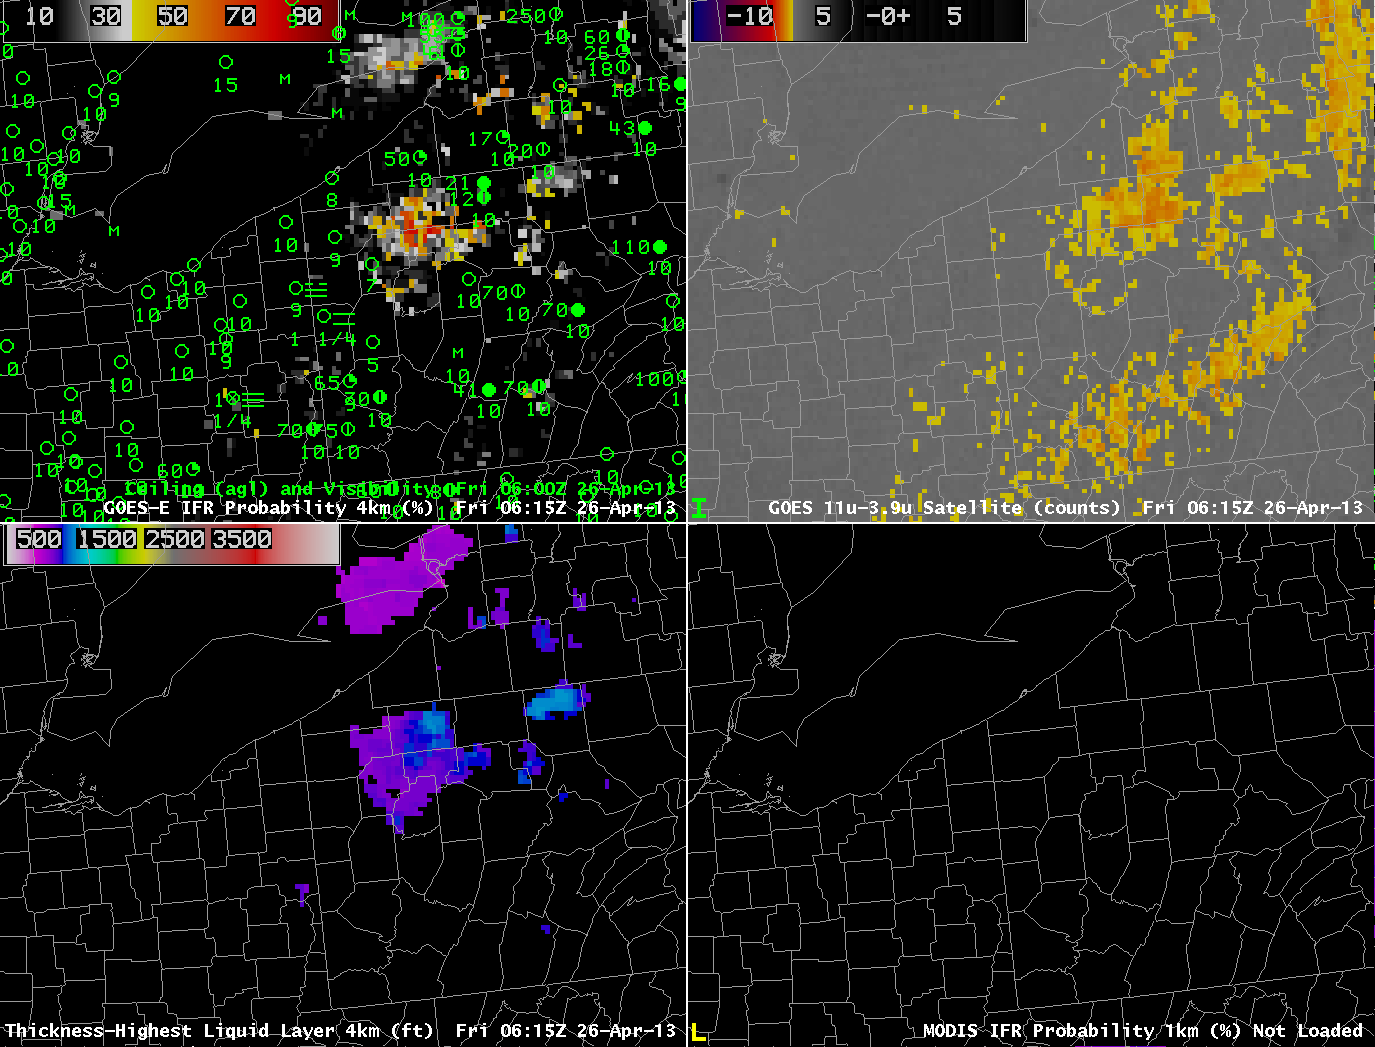
As above, but at 0615 UTC 26 April 2013

By 0615 UTC, IFR probabilities continue to increase over north-central Pennsylvania, and they remain low over southern and central Pennsylvania where mid-level clouds are reported (4100-foot ceilings at Johnstown, for example).

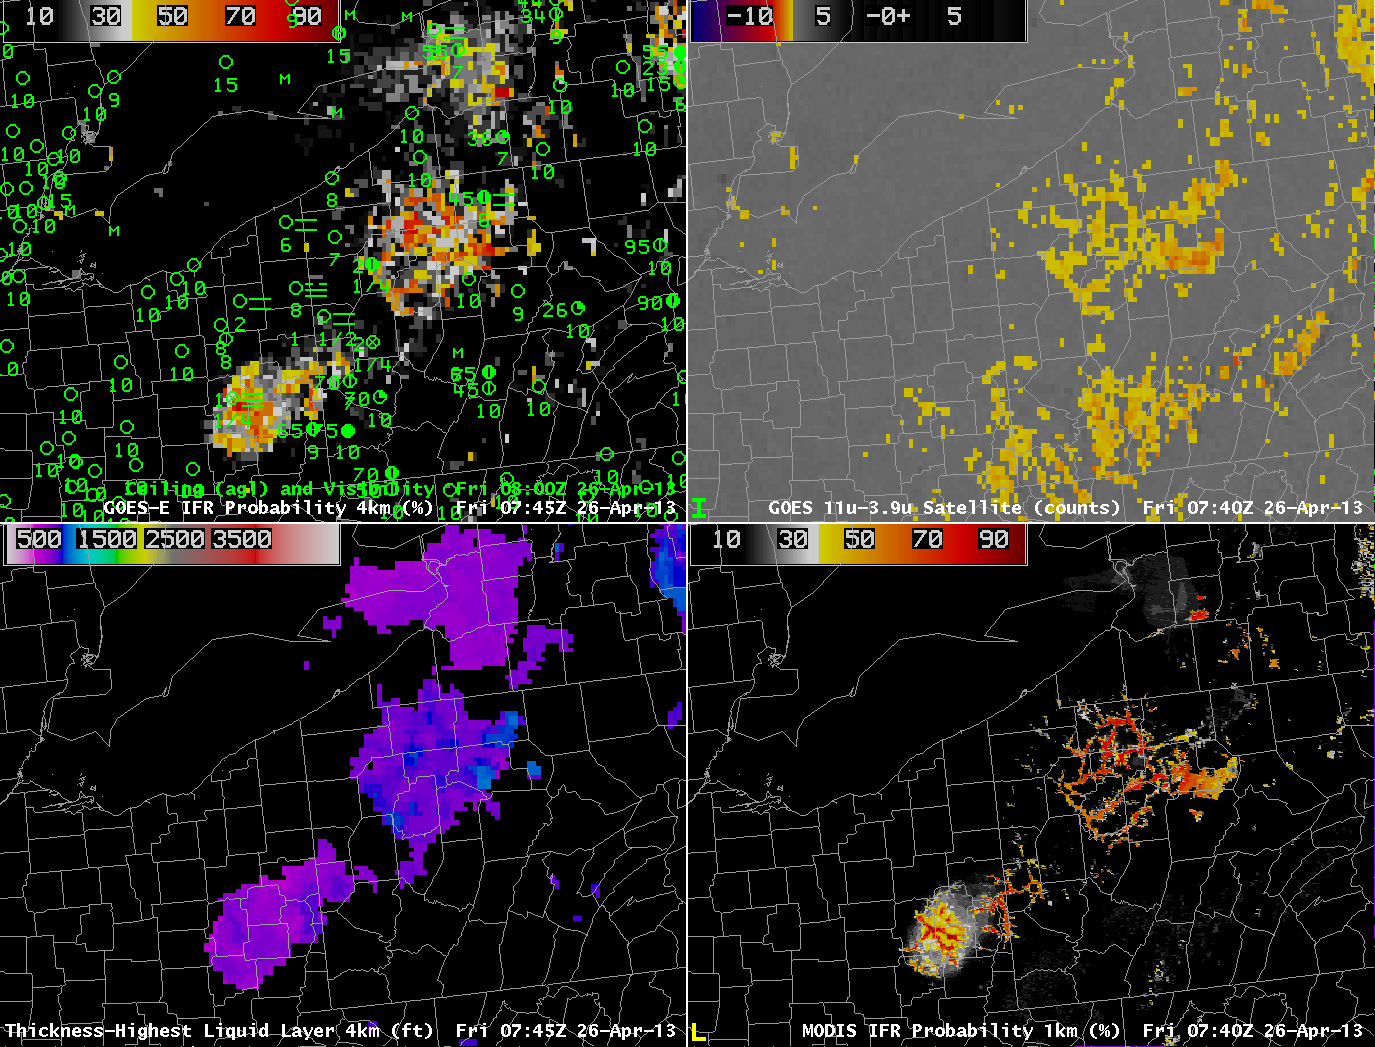
As above, but at 0740 UTC 26 April 2013

Another MODIS overpass at 0740 UTC better resolves the character of the developing fog and low stratus over north-central Pennsylvania.  Very high IFR probabilities in the MODIS-based fields outline the river valleys of the Allegheny Plateau in north-Central Pennsylvania.  GOES-based IFR Probabilities are high, but GOES lacks the resolution to view clearly the individual river valleys.

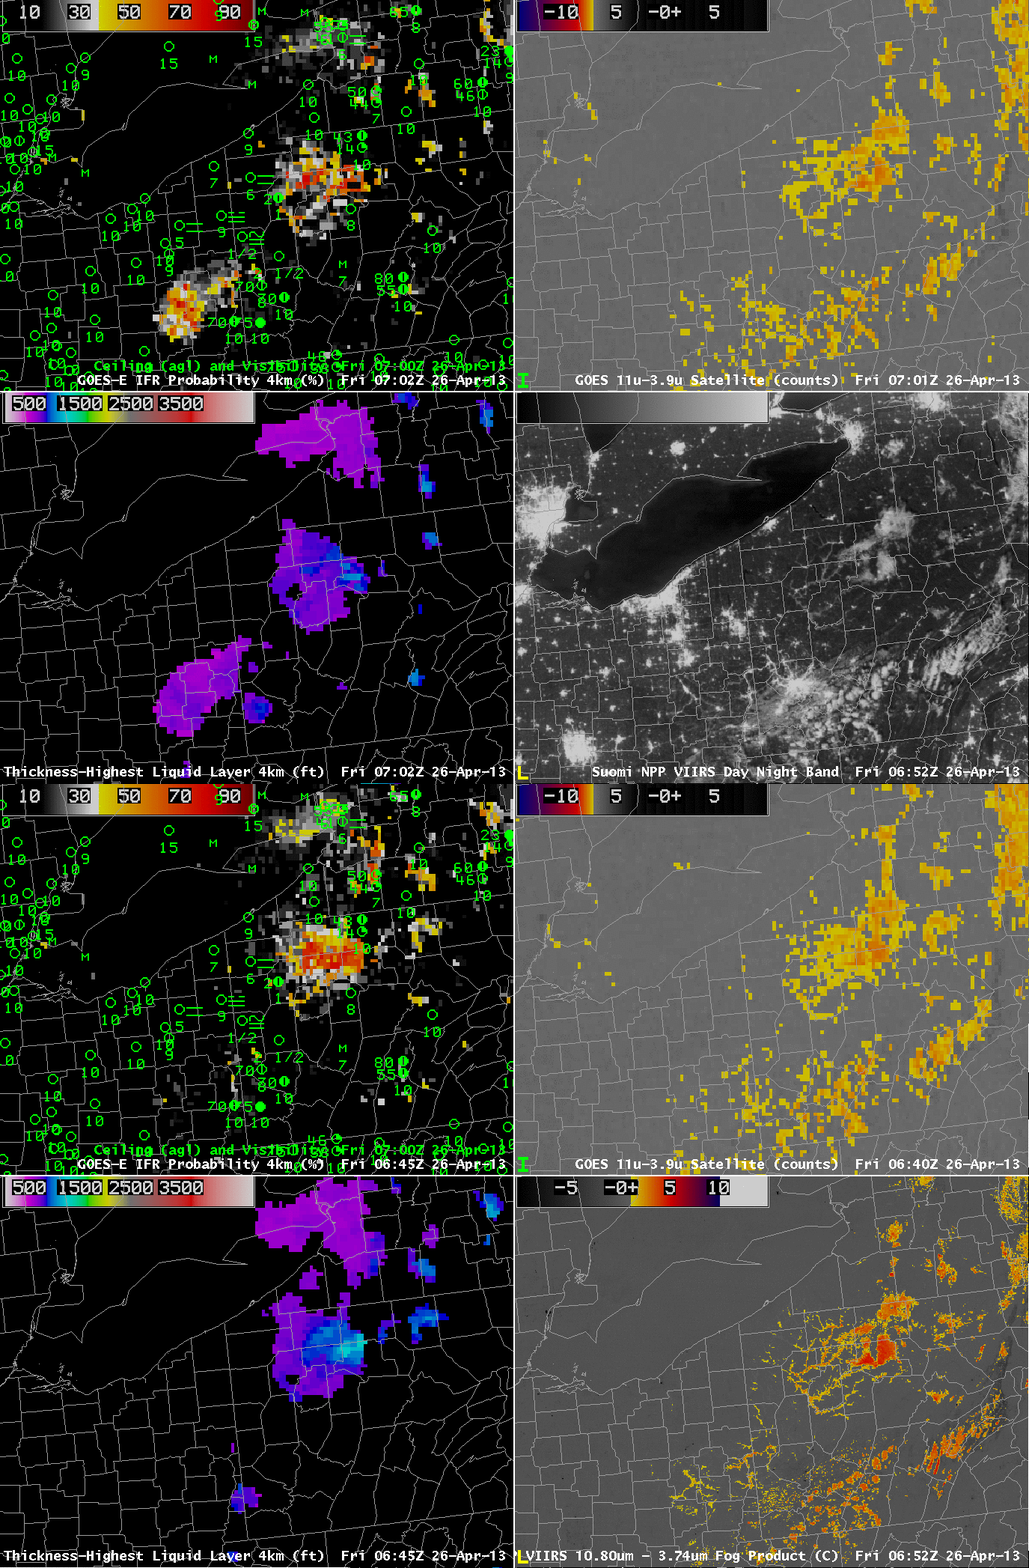
As above, but with Suomi/NPP brightness temperature difference (10.8 µm- 3.74µm) and Day-Night Visible imagery in the bottom right (0652 UTC), with the GOES-R IFR Probabilities (Upper Left), GOES-E Brightness Temperature Difference field (Upper Right), and GOES-R Cloud Thickness toggling between 0645 and 0702 UTC.

Suomi/NPP can also give information at high resolution about the evolving fog field.  The tendrils of fog developing in the river valleys are evident in the visible imagery created using reflected lunar illumination (A mostly full moon was present the morning of 26 April) and those water-based clouds are also highlighted in the Suomi/NPP Brightness Temperature Difference Field.  The clouds over the Laurel Highlands are higher clouds — they are casting shadows visible in the Day/Night band.

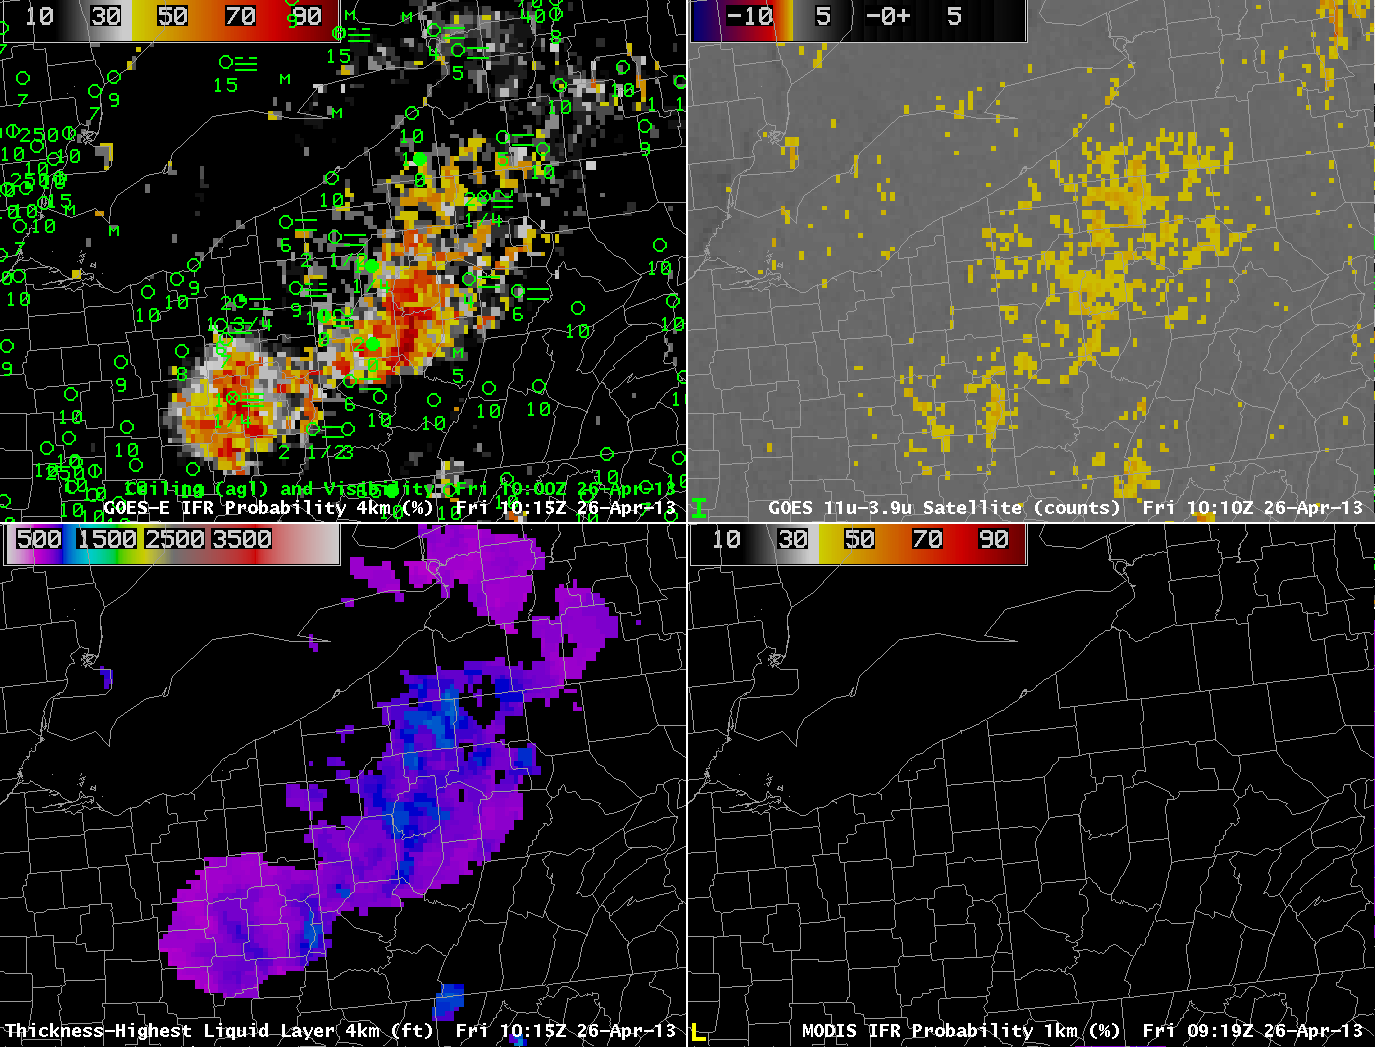
As in the figure above, but for 1015 UTC 26 April 2013

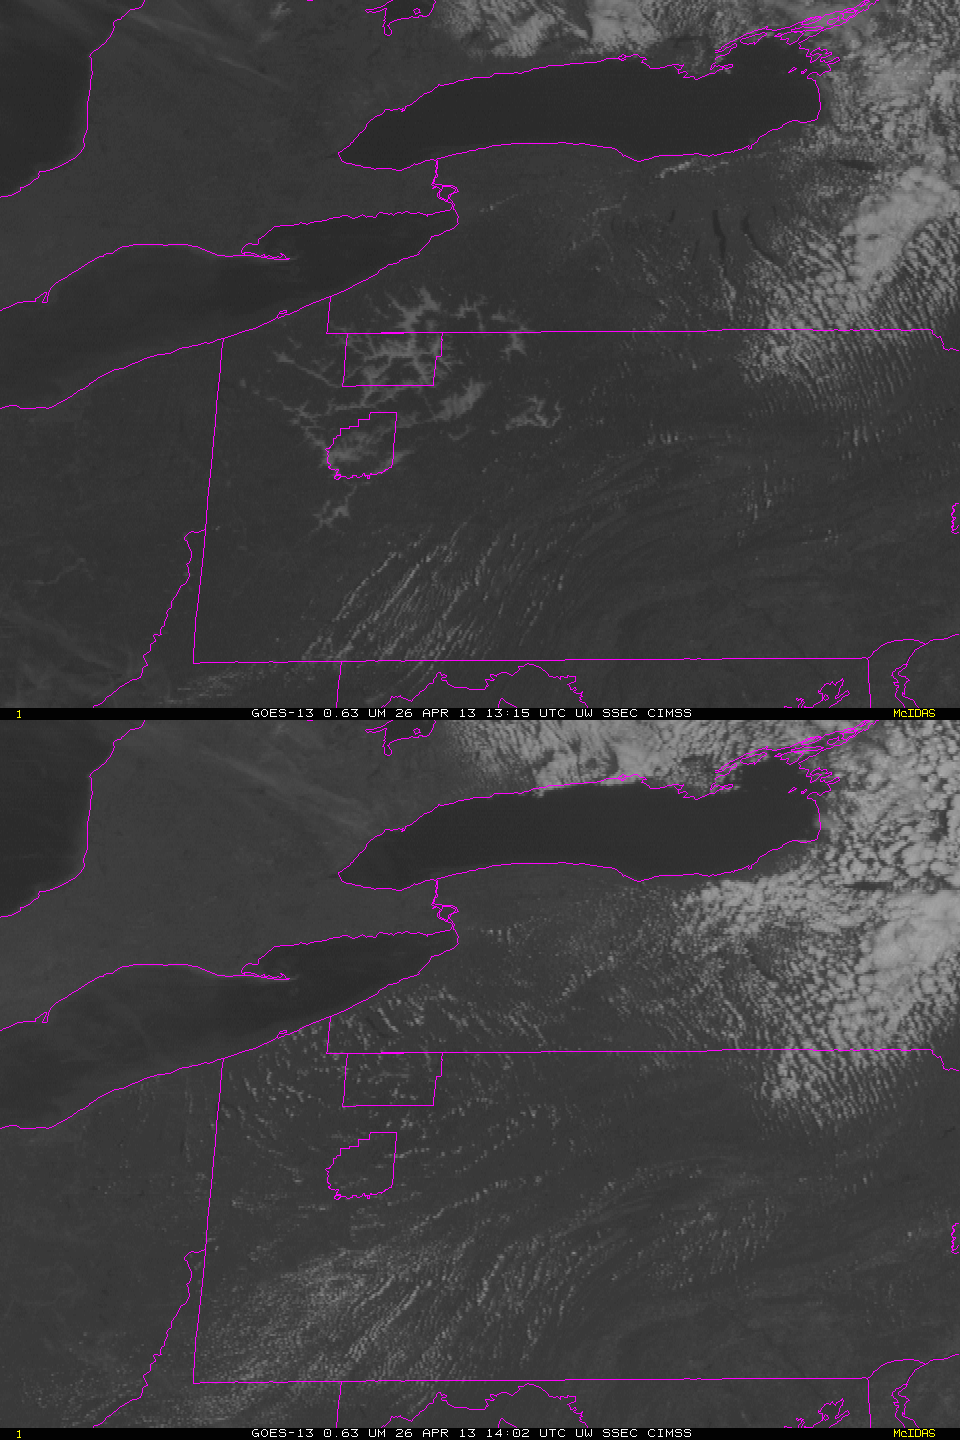
The final GOES-R Cloud Thickness field before twilight conditions, above, shows maximum thicknesses of 900 feet over Warren County, Pennsylvania, and around 850 feet over southern Clarion County.  According to this link, such a radiation fog will burn off in less than 3 hours after sunrise.  The animation below of visible imagery at 1315 and 1402 UTC shows the fog, initially widespread in river valleys at 1315 UTC mostly gone by 1402 UTC.

GOES-13 Visible Imagery, 1315 and 1402 UTC, 26 April 2013.  Warren and Clarion Counties are highlighted.

Cold frontal passage in Oregon

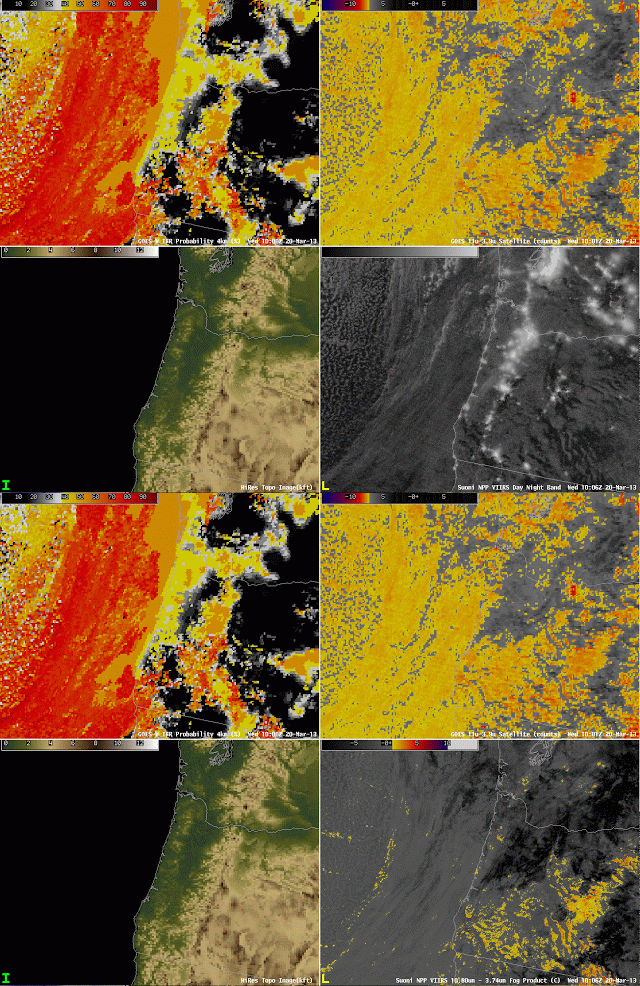
GOES-R IFR Probabilities (Upper Left), GOES-West Brightness Temperature Difference (10.7 µm – 3.9 µm) (Upper Right), Topography (Lower Left), GOES-West Water Vapor Imagery (6.7 µm) (Lower Left), hourly from 0400 through 1700 UTC 20 March 2013.

The animation above of the Fog/Low Stratus and Brightness Temperature difference highlights the difficulty that the traditional brightness temperature difference product encounters when multiple cloud layers are present, as you might expect to be present given the water vapor imagery.  At the beginning of the animation, highest IFR probabilities exist over the elevated terrain that surrounds the Willamette Valley in Oregon.  There were also high probabilities off shore.  As the frontal region moves onshore, IFR probabilities increase on shore.   Note also how the GOES-R IFR Probability field is a more coherent one whereas the traditional brightness temperature difference field from GOES contains many separate areas of return that make it harder to see the big picture.  The brightness temperature difference also suffers from stray light contamination at 1000 UTC — but that contamination does not propagate into the GOES-R IFR probability field.

GOES-R IFR Probabilities computed from GOES-West (Upper Left), GOES-West Brightness Temperature Difference (10.7 µm – 3.9 µm) (Upper Right), Topography (Lower Left), Toggle between Suomi/NPP Brightness Temperature Difference (10.8 µm – 3.74 µm) and Day/Night Band, all imagery near 1000 UTC on 20 March 2013

The imagery above shows how straylight contamination in the shortwave IR (3.9 µm) can influence the brightness temperature difference.  The GOES imagery shows the effects (just at this 1000 UTC image, which is also included in the animation above), but that ‘contamination’ does not propagate strongly into the GOES-R IFR Probability.  Note also that the Suomi/NPP Brightness Temperature Difference shows none of the stray light contamination.  Lunar illumination  allows the nighttime visualization of the clouds off the west coast of the US.  As this frontal band moves over Oregon, reduced visibilities result, but only the GOES-R IFR probabilities accurately capture the location of the frontal band because of the multiple cloud layers that exist.

Fog in California’s Central Valley

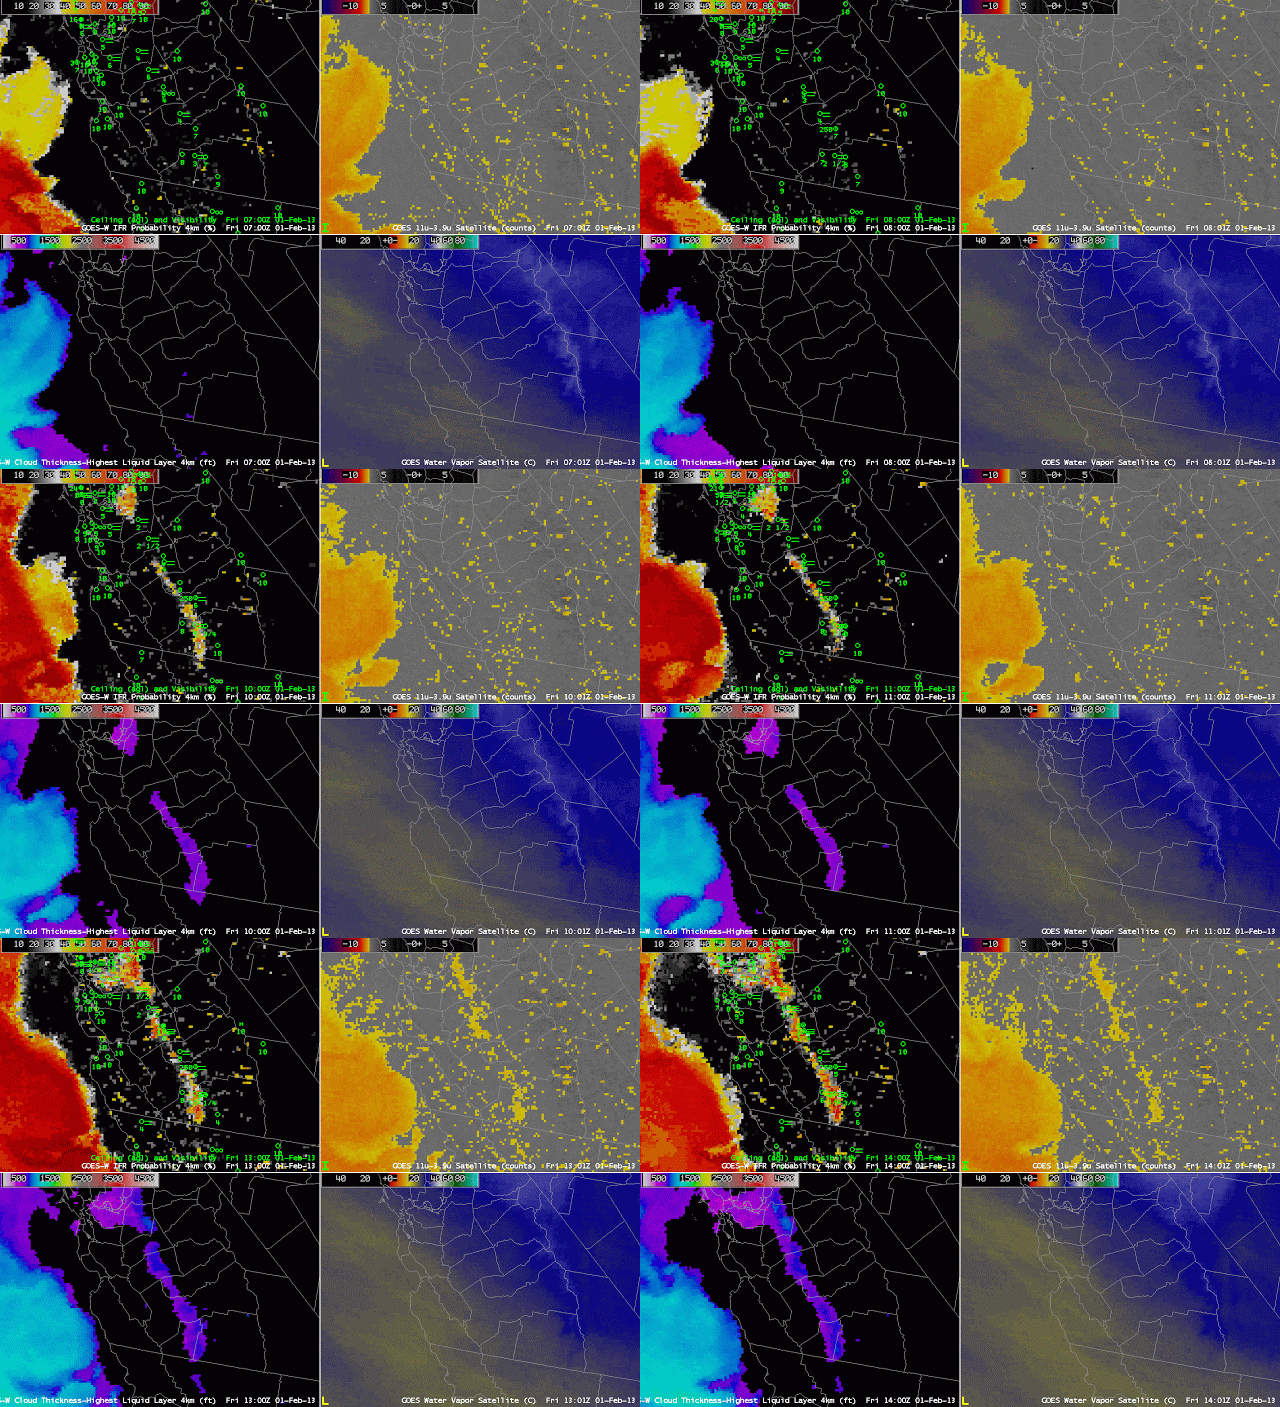
GOES-R IFR Probabilities (Upper Left), GOES-West Brightness Temperature Difference (10.7 µm – 3.9 µm) (Upper Right), GOES-R Cloud Thickness (Lower Left), GOES-West Water Vapor imagery (6.7 µm)

Fog developed in the early morning of February 1, 2013, in California’s Central Valley, the combination of the San Joaquin valley to the south and the Sacramento Valley to the north.  The imagery above shows the GOES-R Fog/Low Stratus product and the traditional fog product, the brightness temperature difference between 10.7 µm and 3.9 µm.  The GOES-R Product (IFR Probability) is first in highlighting the development of fog near the San Joaquin River and reductions in visibility occur in sync with the increase of IFR probabilities. The traditional GOES-West brightness temperature difference product displays considerable signal in the first hours of the animation above, but there is no organization to the signal.  Eventually, however, the brightness temperature difference signal does include the fog and low stratus in the Valley.

IFR Conditions surround California’s Central Valley

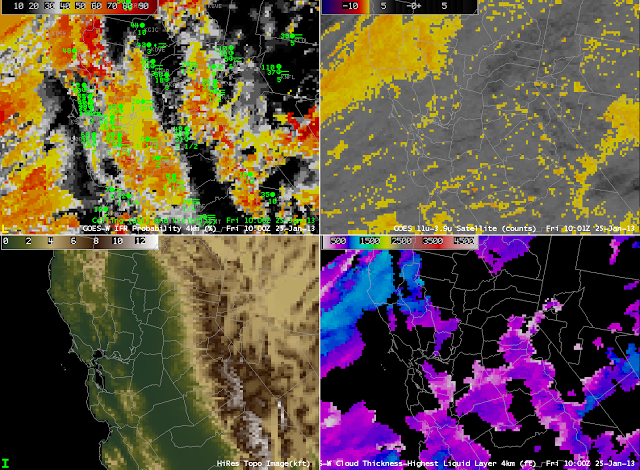
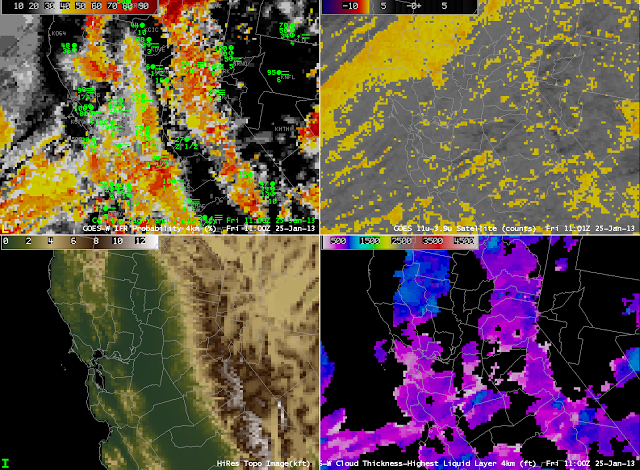
GOES-R IFR Probabilities compted from GOES-West (Upper Left), GOES-West Brightness Temperature Difference (10.7 µm- 3.9 µm) (Upper Right), Central Valley Topography (Lower Left), GOES-R Cloud Thickness of Highest single liquid layer (Lower Right), 1000 UTC on 25 January 2013

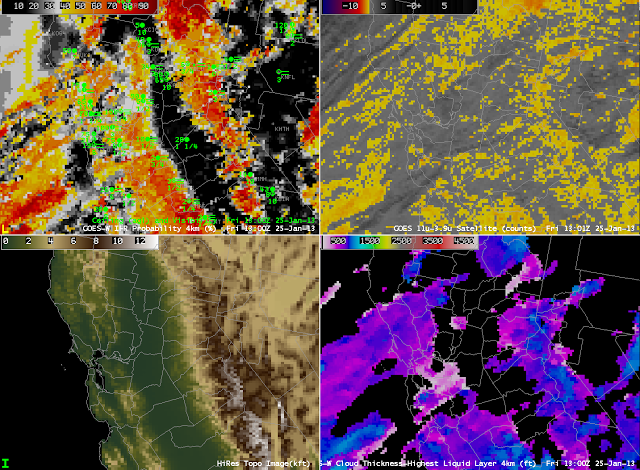
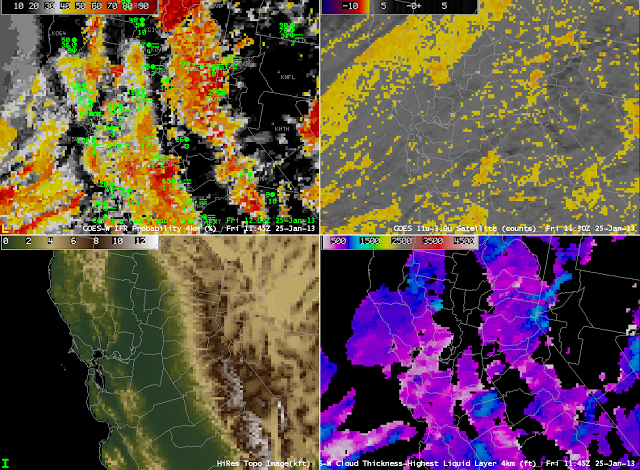
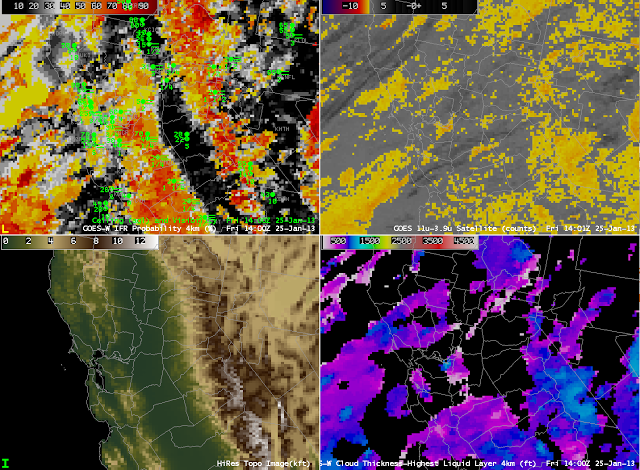
GOES-R IFR Probabilities suggest the presence of IFR conditions both to the west and to the east of California’s San Joaquin Valley, providing a much more coherent signal of IFR conditions than can be discerned from the traditional Brightness Temperature Difference Product.  That traditional product is hamstrung by the multiple cloud layers present over the West Coast as an extratropical cyclone approaches from the Pacific Ocean.  The signal present at 1000 UTC (and earlier) continues through most of the morning.  The synthesis of Satellite Predictors and Model Predictors (Rapid Refresh Model) in the Naive Bayesian Model produces a product that gives better information in this case on exactly where IFR conditions are most likely.

As above, but at 1100 UTC

As above, but at 1145 UTC

As above, but at 1300 UTC

As above, but at 1400 UTC

Fog/Low Stratus in eastern Washington State

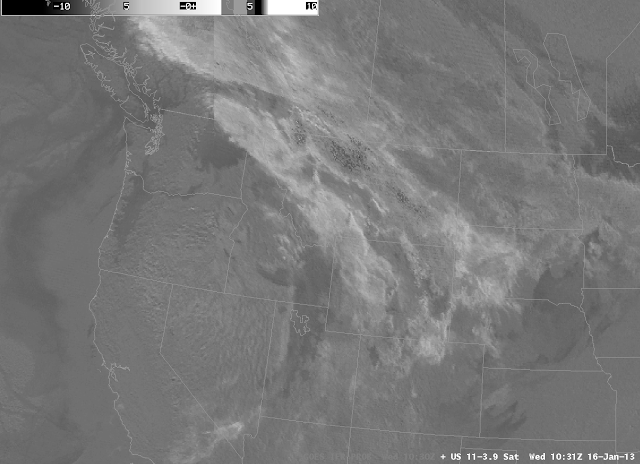
Brightness Temperature Difference plot over the NW USA, 1031 UTC 16 January

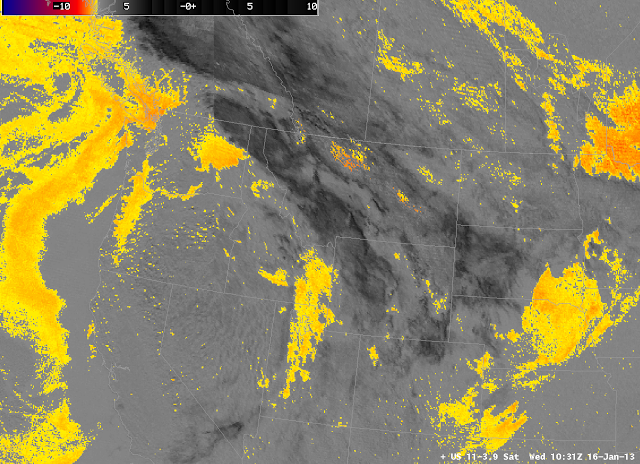
The plot above shows the default enhancement the brightness temperature difference product traditionally used to highlight regions of low clouds and fog.  The greyscale nature of the product can make interpretation difficult.  However, if a suitable enhancement is applied (below), such that fog and low clouds are enhanced, interpretation is easier.

As above, but color-enhanced.

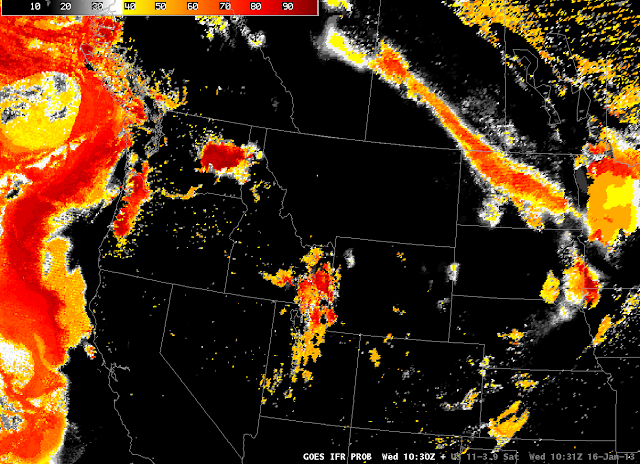
This image suggests the presence of fog or low stratus (or both) off the west coast of the US, in and around Salt Lake City, near Spokane, and in the Willamette Valley and Columbia River Valley.  It is difficult to tell if the regions are associated with restrictions in visibility because an elevated stratus deck and a fog bank look very similar in the brightness temperature difference field.  Therefore, the GOES-R Fog/Low Stratus IFR Probability field was developed to highlight regions where IFR conditions are most likely.  That product is shown below.

GOES-R IFR Probabilities, 1030 UTC on 16 January

Compare the IFR probability field to the Brightness Temperature Difference field above it.  Several things are apparent.  Highest probabilities for visibility restrictions are centered near Spokane, WA.  There is a region of higher IFR probabilities in North Dakota that is missing entirely in the Brightness Temperature Difference product.  IFR probabilities over Utah vary more than the Brightness Temperature Difference signal.  The differences all arise from the model data that are used to better highlight where low-level saturation is occurring.

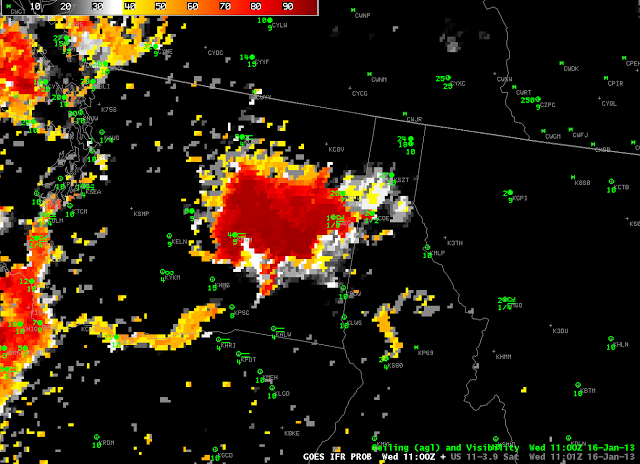
IFR Probabilities and observations of Ceilings/visibilities from 1100 UTC on 16 January.

This zoomed-in imagery shows that, indeed, visibility restrictions (IFR conditions) are occurring in eastern Washington.  The strength of the fused product is that is provide a coherent signal over a larger area, so you can better define the region of IFR conditions than is possible with surface observations alone.  The region of higher IFR probabilities over North Dakota is also associated with IFR and near-IFR conditions in a northwest-southeast oriented strip including Harvey and Jamestown, ND (not shown).

Know your Terrain!

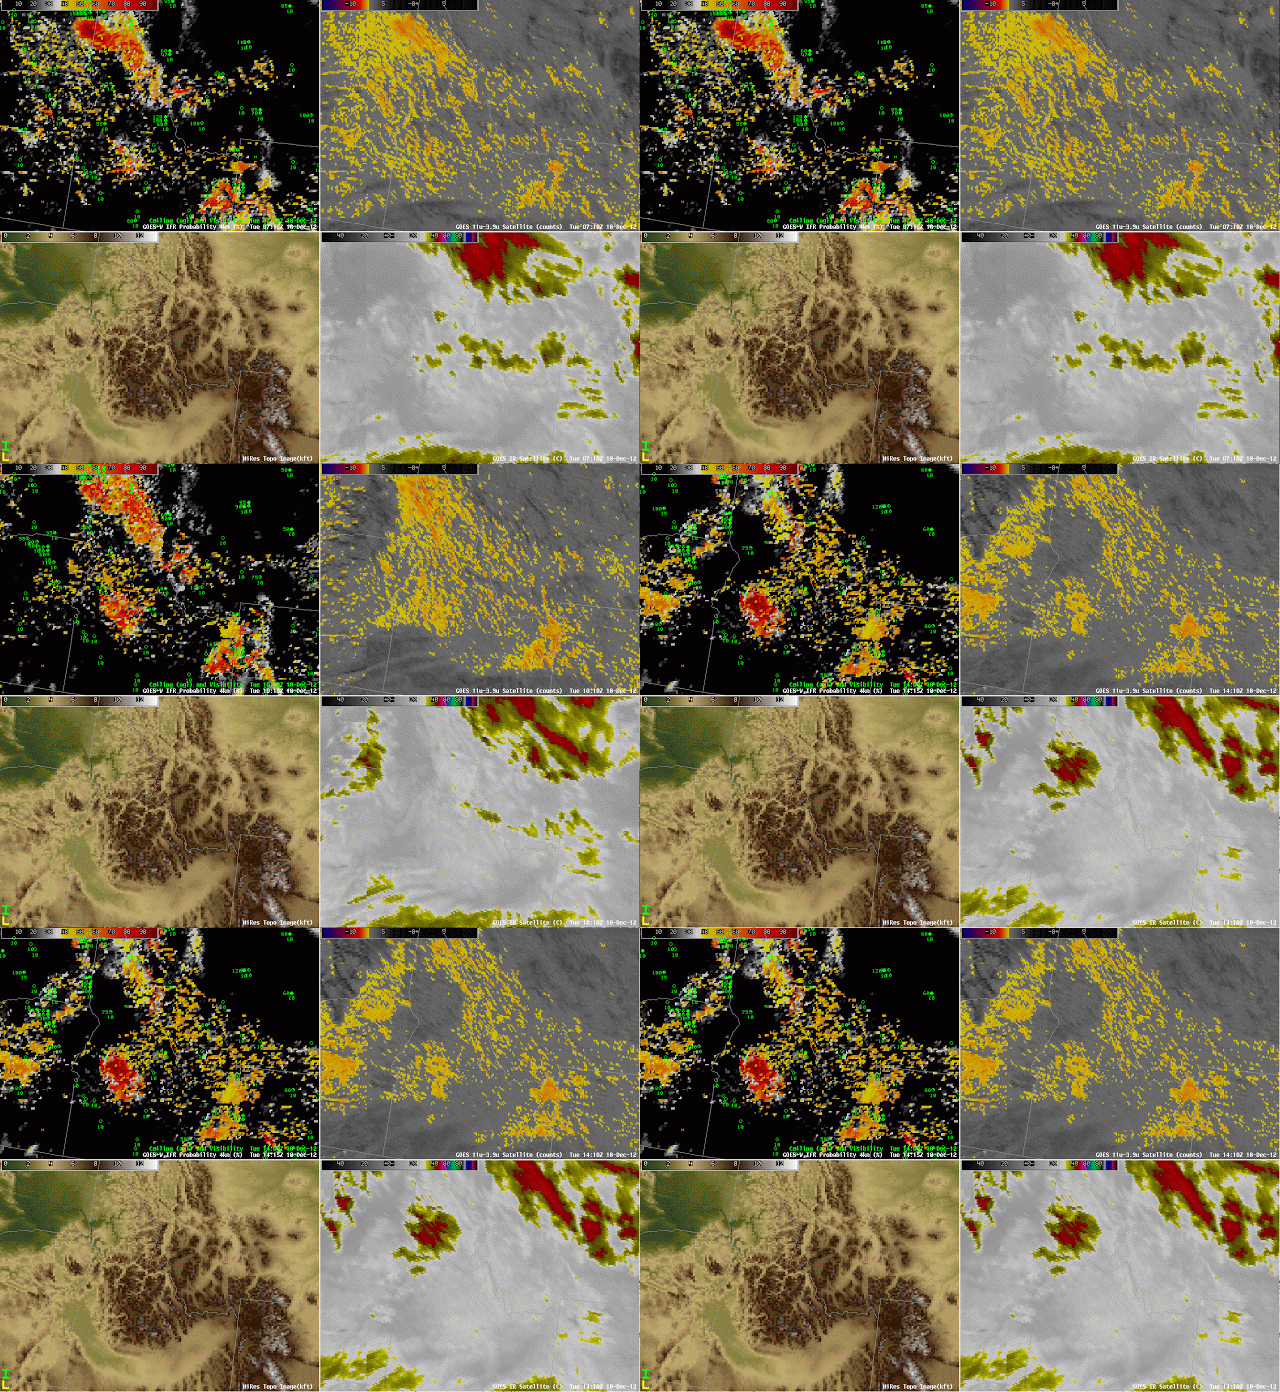
GOES-R IFR Probabilities (Upper left), GOES Brightness Temperature Difference (10.7 – 3.9 ) (Upper Right), color-enhanced Topography (Lower Left), Window Channel Infrared (10.7 ) (Lower Right).  Imagery from 0715, 1015 and 1415 UTC 18 December 2012.

Interpretation of the GOES-R IFR probability must include a consideration of terrain height, because a cloud bank that exists over a valley as elevated stratus can quickly become fog or low stratus as the ground rises into the fog on the sides of the valleys.  This happens with some frequency over the Sierra Nevada next to California’s San Joaquin valley, but it is also apparent in the images above over the higher terrain of central Idaho near the Snake River Valley.  A strong IFR Probability signal develops over central Idaho and also over eastern Idaho/northwest Wyoming where high terrain exists.

Fog in California’s San Joaquin Valley

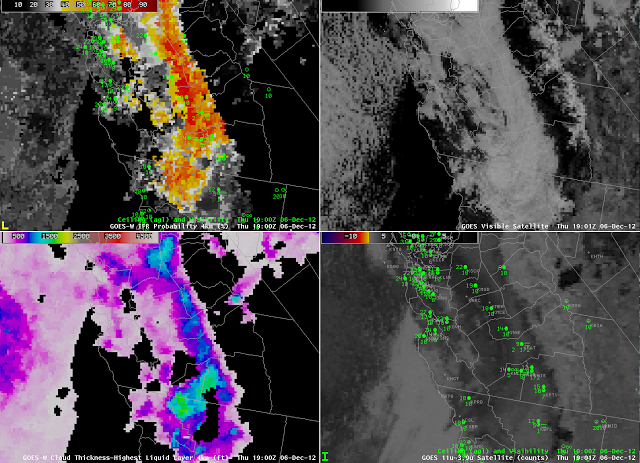
GOES-R IFR Probabilities, computed from GOES-West (Upper Left), GOES-West Visible Imagery (0.62 µm) (Upper Right), GOES-R Cloud Thickness (Lower Left), GOES-West Brightness Temperature Difference (10.7 µm – 3.9 µm) (Lower Right)

Fog is persisting in California’s San Joaquin Valley today, and the GOES-R IFR Probability and Cloud Thickness products both are describing its spatial extent.  The lowest clouds are banked against the western side of the valley, with visibilities lowest, and IFR probabilities highest, from Bakersfield to Fresno to points north.  The Sacramento Valley (not shown) is not showing visibilities near IFR conditions, and the IFR probabilities in that part of California are lower.

IFR Conditions over Southwest Alaska

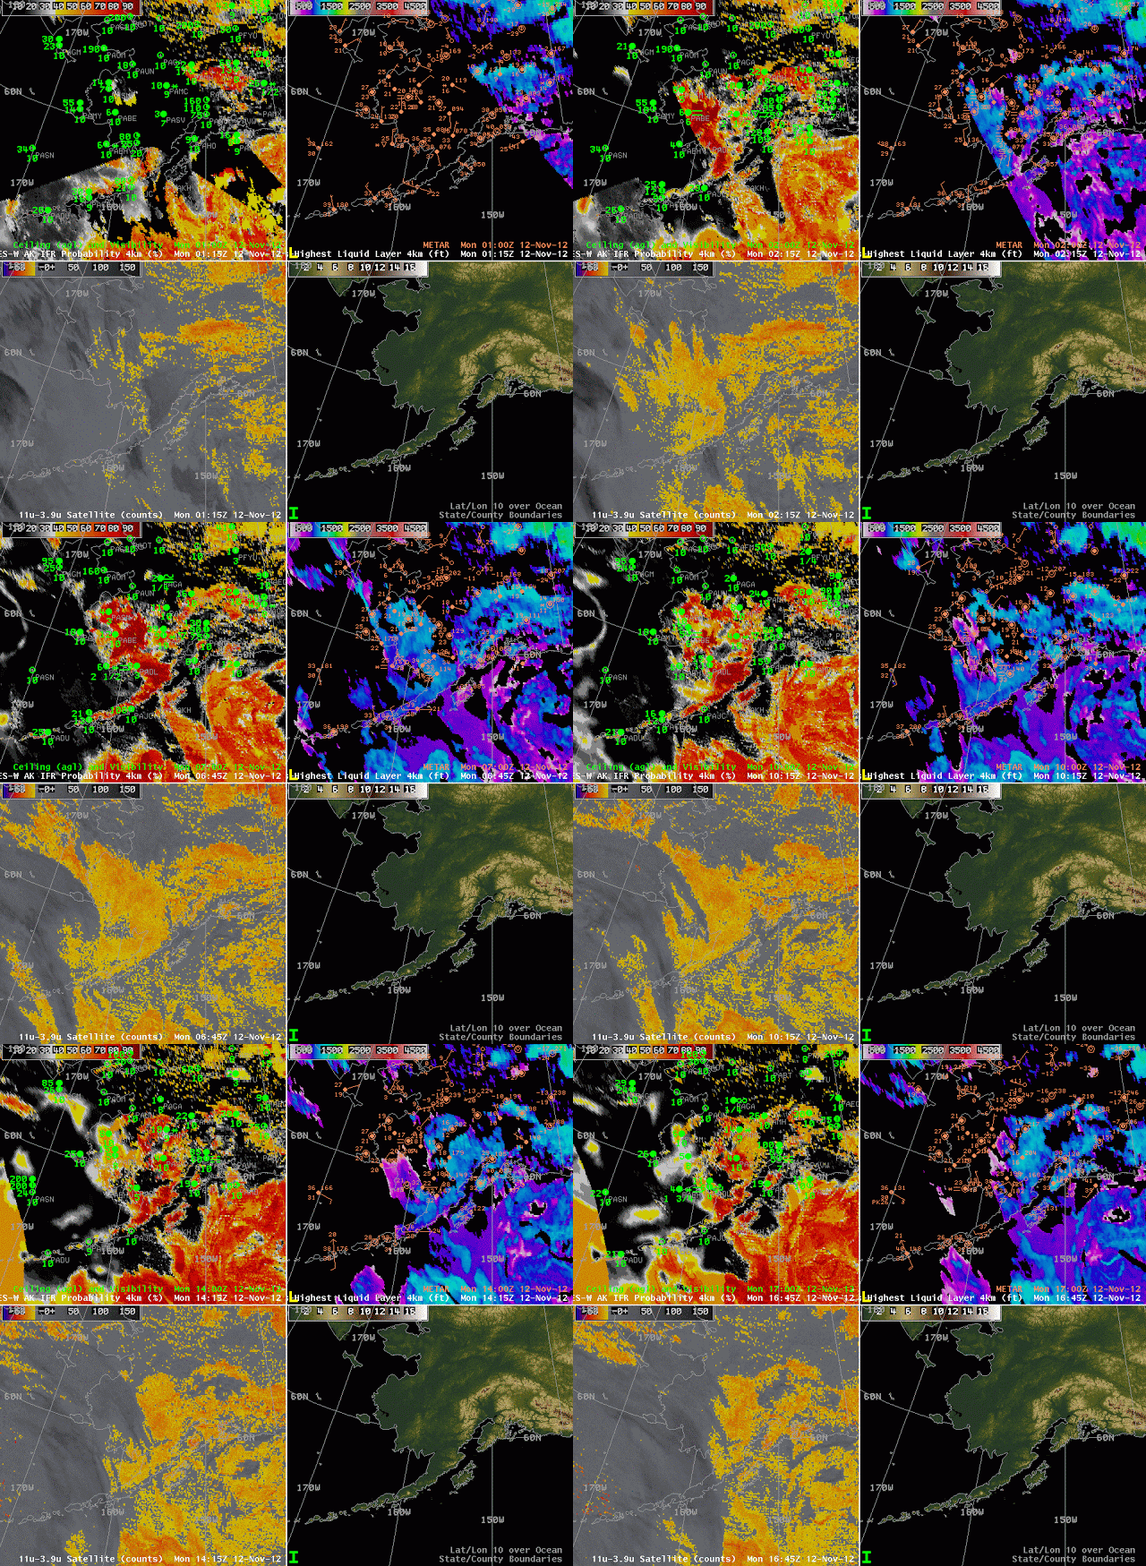
GOES-R IFR Probabilities computed using GOES-West and Rapid Refresh Data (Upper Left), GOES-R Cloud Thickness (Upper Right), GOES-West Brightness Temperature Difference (10.7 µm – 3.9 µm) (Lower Left), Topography over Southwest Alaska (Lower Right).

(Stations discussed below:  Bethel (PABE) and McGrath (PAMC) on the Kuskokwim River, Sparrevohn Air Force Base (PASV), Dillingham (PADL), Cape Newehnam Air Force Base (PAEH) and St. Marys (PASM) on the Yukon River)

Portions of Southwestern Alaska in the Kuskokwim and Yukon River valleys experienced IFR or near-IFR conditions overnight between 11 and 12 November.  How did the half-hourly animations of GOES-R IFR probability and cloud thickness (as well as the traditional brightness temperature difference product) depict those reduced visibilities?

The beginning of this animation shows the effect of twilight conditions on the Cloud Thickness Product (upper right);  this product shows the thickness of the highest boundary layer cloud during non-twilight conditions.  If twilight conditions are occurring, or if higher clouds are moving into a region (as is occurring over Nushagak and Bristol Bays near Dillingham at the end of the animation), then the product is not generated.

The area of IFR conditions over southwest Alaska from St. Marys to Sparrevohn, McGrath and Bethel southwestward to Dillingham is depicted will in the IFR Probability fields.  Light winds in this region are allowing the low clouds to develop.  Relatively high values of IFR Probabilities, and the pixelated look to the field mean that both satellite and model predictors are being used over most of this region in computing the IFR probabilities.  An exception occurs over Cape Newenham near the end of the animation when lower IFR probabilities and a smoother field suggest that satellite-based predictors are not being used (because of the presence of multiple cloud layers).  This is also true of regions in the far southwestern part of the shown domain at the end of the animation.