Category Archives: Suomi/NPP

Low clouds and Fog along the West Coast

Low clouds and fog developed along the west coast this morning. From the Monterey (CA) AFD:

FXUS66 KMTR 141143
AFDMTR

AREA FORECAST DISCUSSION
NATIONAL WEATHER SERVICE SAN FRANCISCO BAY AREA
443 AM PDT FRI MAR 14 2014

.SYNOPSIS…AFTER A BIT OF COOLING TODAY…A WARM AND DRY UPPER LEVEL
RIDGE OF HIGH PRESSURE WILL BUILD STRONGLY INTO THE WEST COAST
OVER THE WEEKEND. THIS WILL RESULT IN AFTERNOON TEMPERATURES
REACHING WELL ABOVE SEASONAL NORMS…AND POSSIBLY TO NEAR RECORD
LEVELS FOR THESE DATES. THIS WARM-UP WILL BE SHORT-LIVED HOWEVER…WITH
INCREASED ONSHORE FLOW AND A SIGNIFICANTLY COOLER AIR MASS MOVING
IN ALOFT THE FIRST PART OF NEXT WEEK. DRY CONDITIONS ARE EXPECTED
TO CONTINUE THROUGH MID WEEK…BUT THEN WITH UPPER LEVEL TROUGHING
AND A CHANCE OF RAIN FOR THE OUTER PORTION OF THE FORECAST PERIOD.

&&

.DISCUSSION…AS OF 4:10 AM PDT FRIDAY…THE DRY TAIL END OF A
WEATHER SYSTEM MOVING IN TO THE PACIFIC NORTHWEST IS APPROACHING
OUR DISTRICT…AND RESULTING IN ENHANCEMENT OF THE MARINE LAYER
AND A RETURN OF THE MARINE STRATUS. LATEST GOES FOG PRODUCT
IMAGERY…AND IN RATHER SPECTACULAR DETAIL JUST REC’D SUOMI VIIRS
NIGHTTIME HIGH RES VISUAL IMAGE…SHOW COVERAGE ALONG MUCH OF THE
COAST FROM PT REYES SOUTH TO THE VICINITY OF THE MONTEREY
PENINSULA…AND A BROAD SWATH EXTENDING INLAND ACROSS SAN
FRANCISCO AND THROUGH THE GOLDEN GATE TO THE EAST BAY. LATEST
BODEGA BAY AND FT ORD PROFILER DATA INDICATE A MARINE LAYER DEPTH
OF ABOUT 1300 FT. SOME THIN HIGH CLOUDS ARE ALSO PASSING THROUGH ABOVE.

NAM MODEL AND IN-HOUSE LOCAL WRF MODEL BOUNDARY LAYER RH OUTPUT
BOTH INDICATE STRATUS SHOULD GENERALLY CLEAR BY MIDDAY…EXCEPT
ALONG THE SAN MATEO COAST AND IN THE VICINITY OF THE MONTEREY
PENINSULA. EXPECT AFTERNOON HIGHS TO BE AROUND 3 TO 5 DEGS COOLER
THAN ON THURSDAY…BUT STILL WELL ABOVE SEASONAL NORMS ESPECIALLY
INLAND.

GOES_IFR_PROB_20140314loop

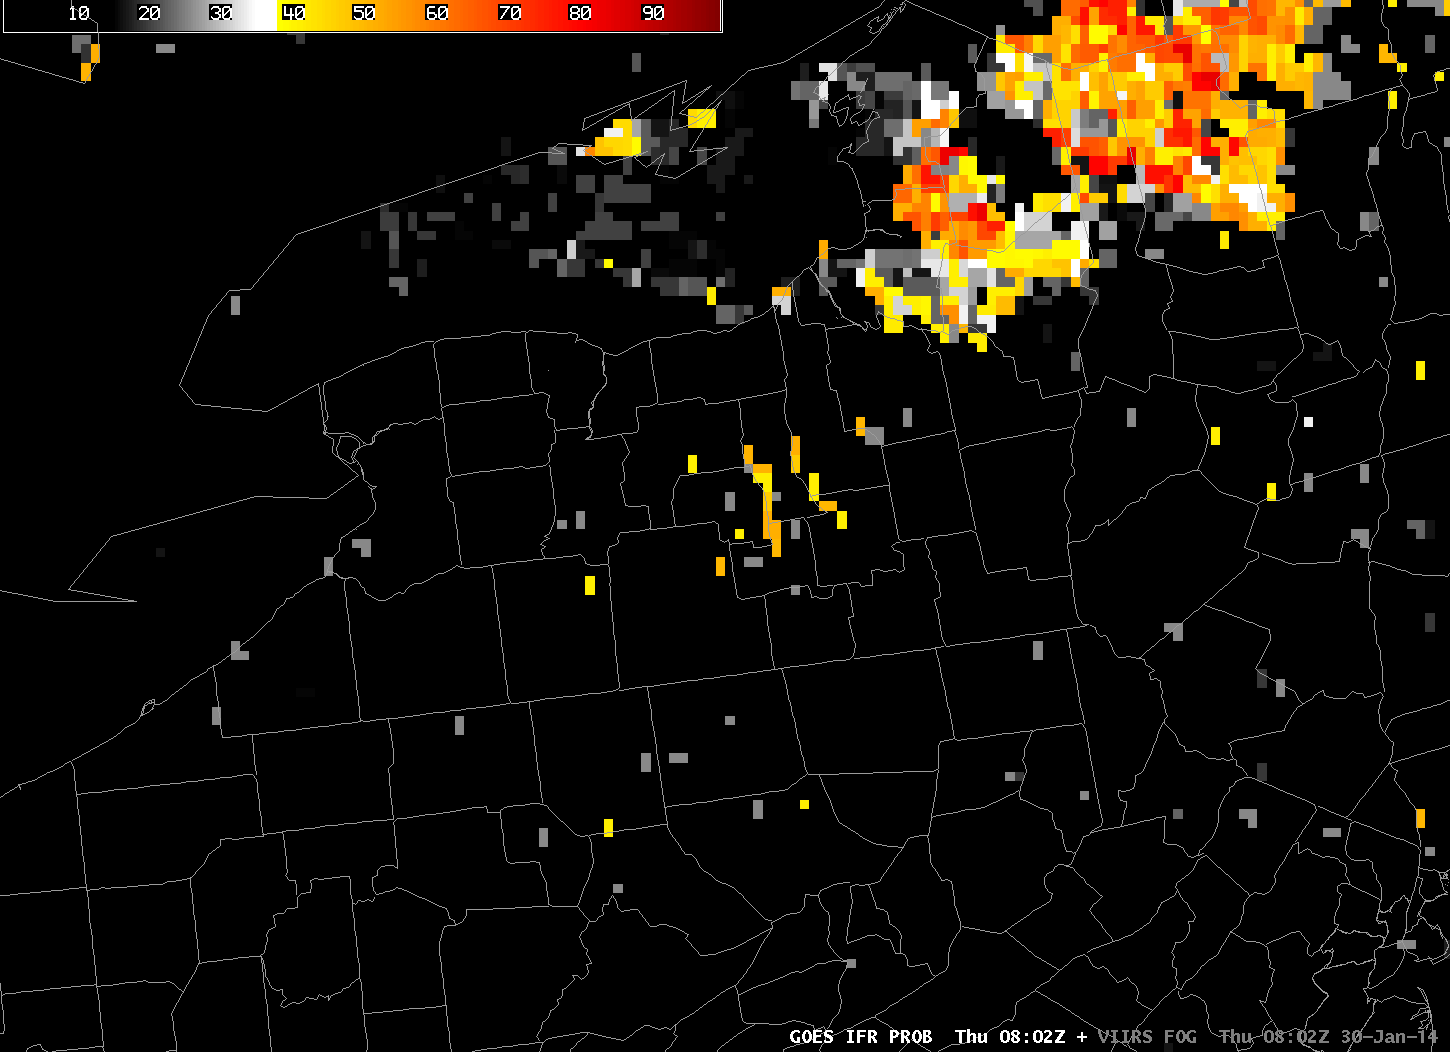
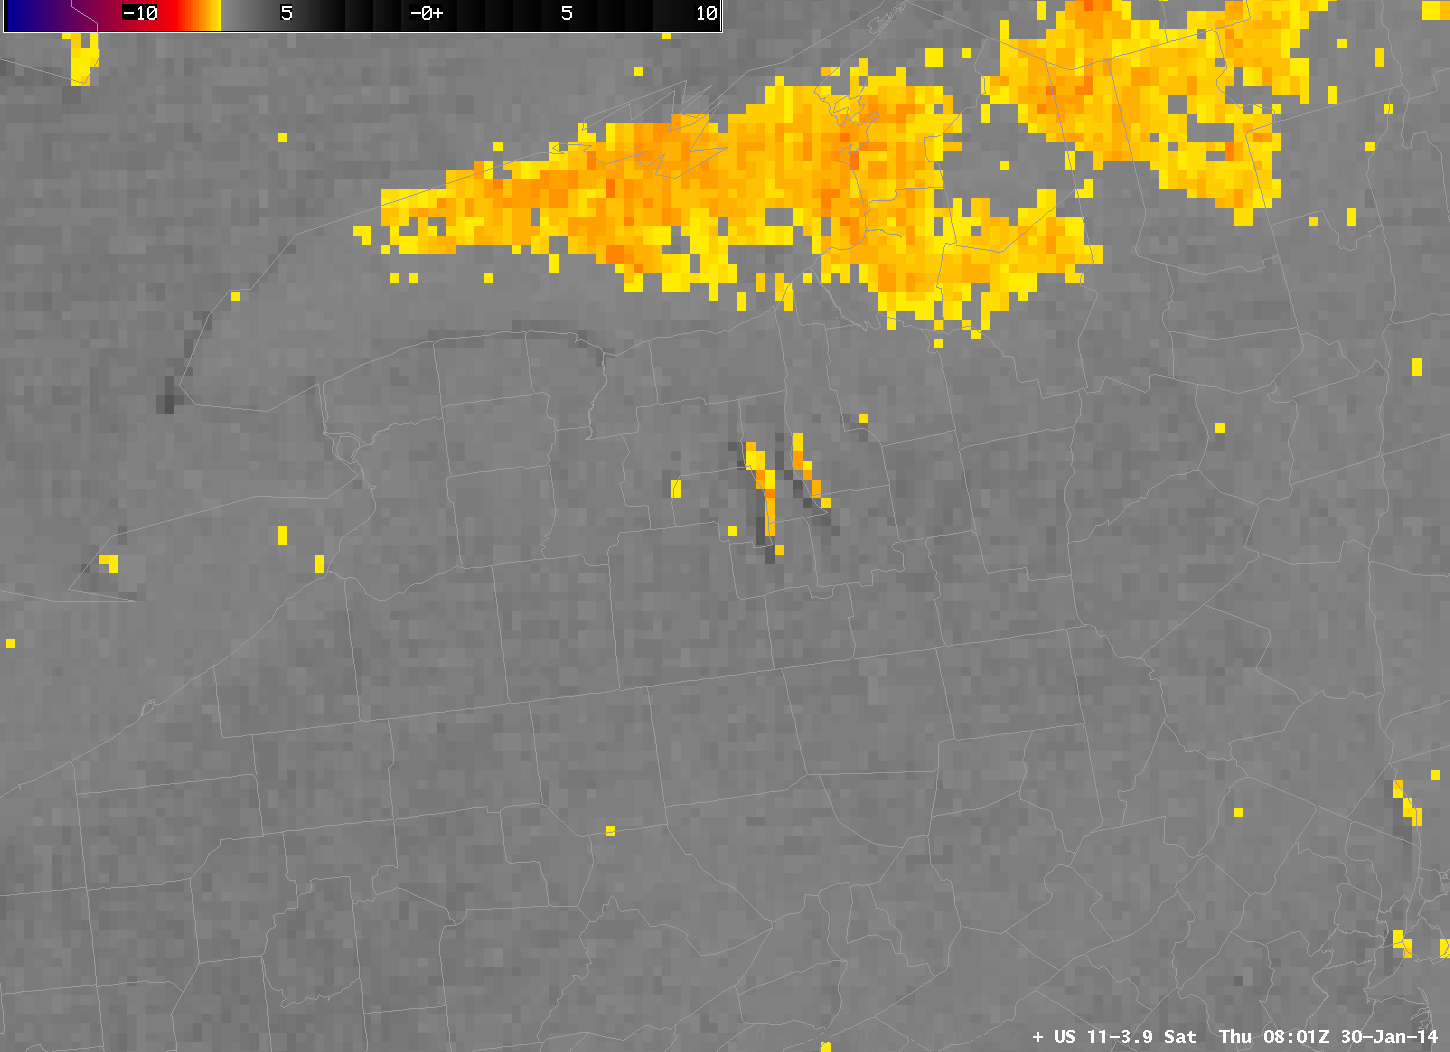
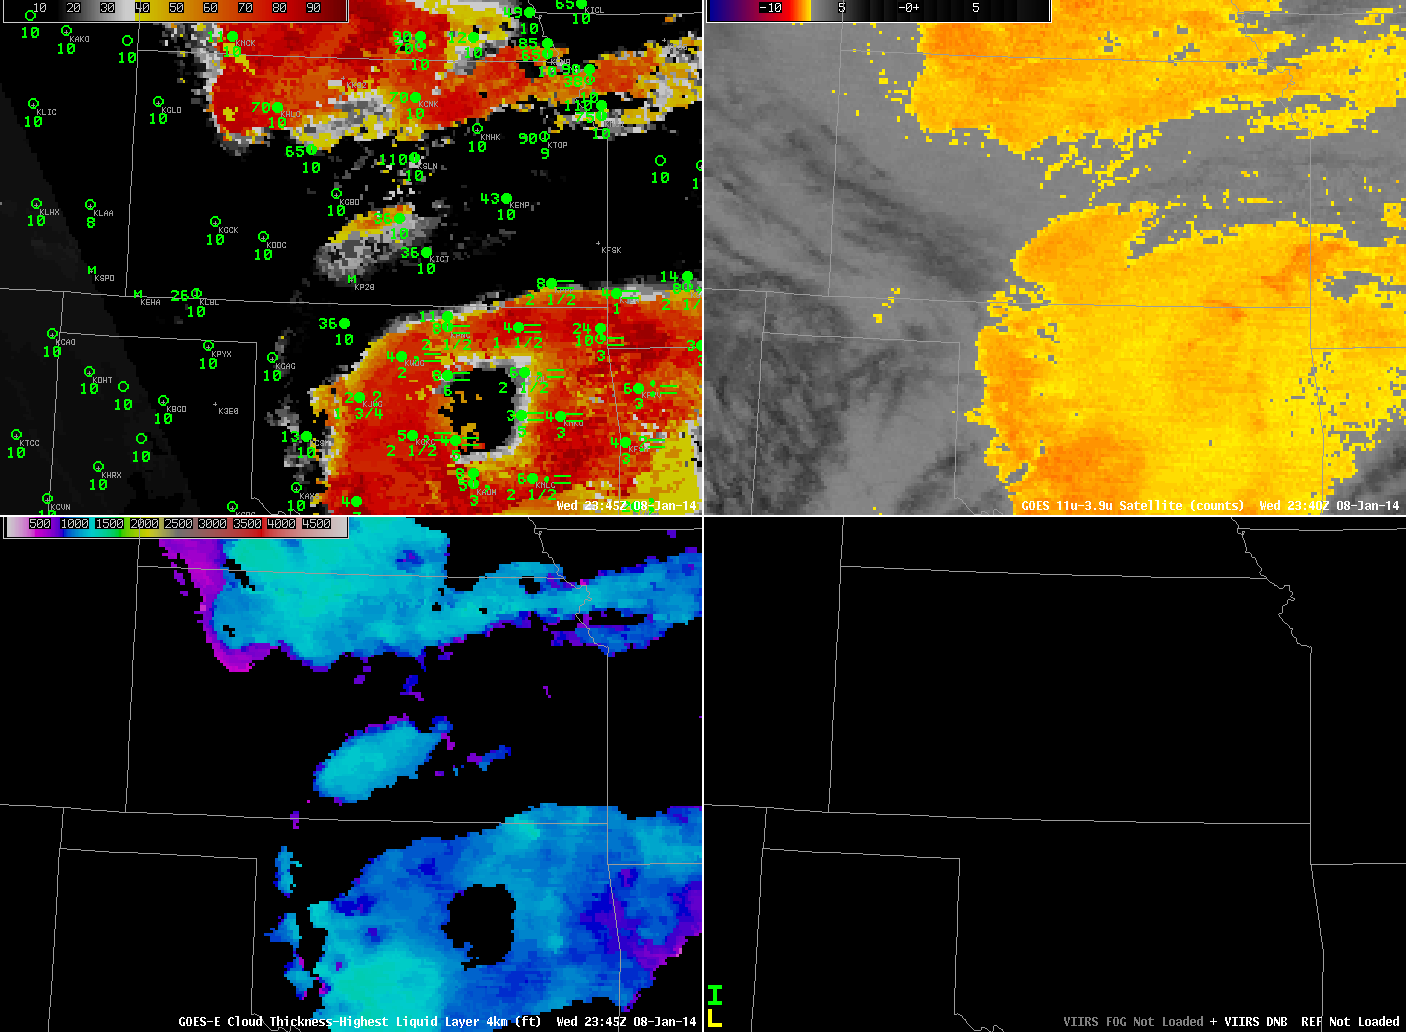
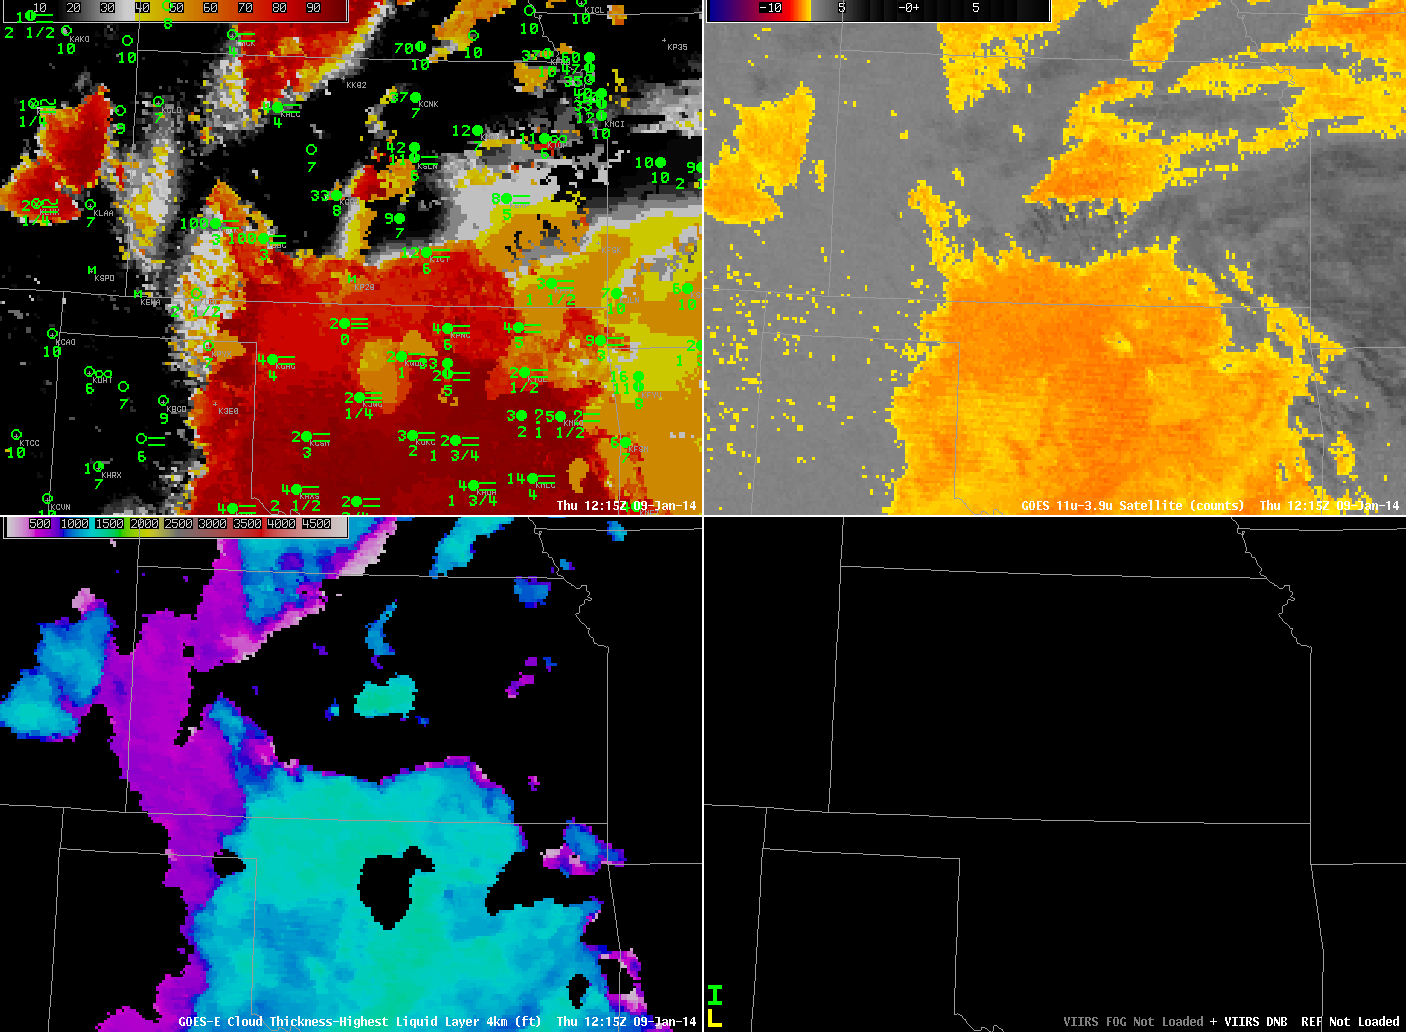
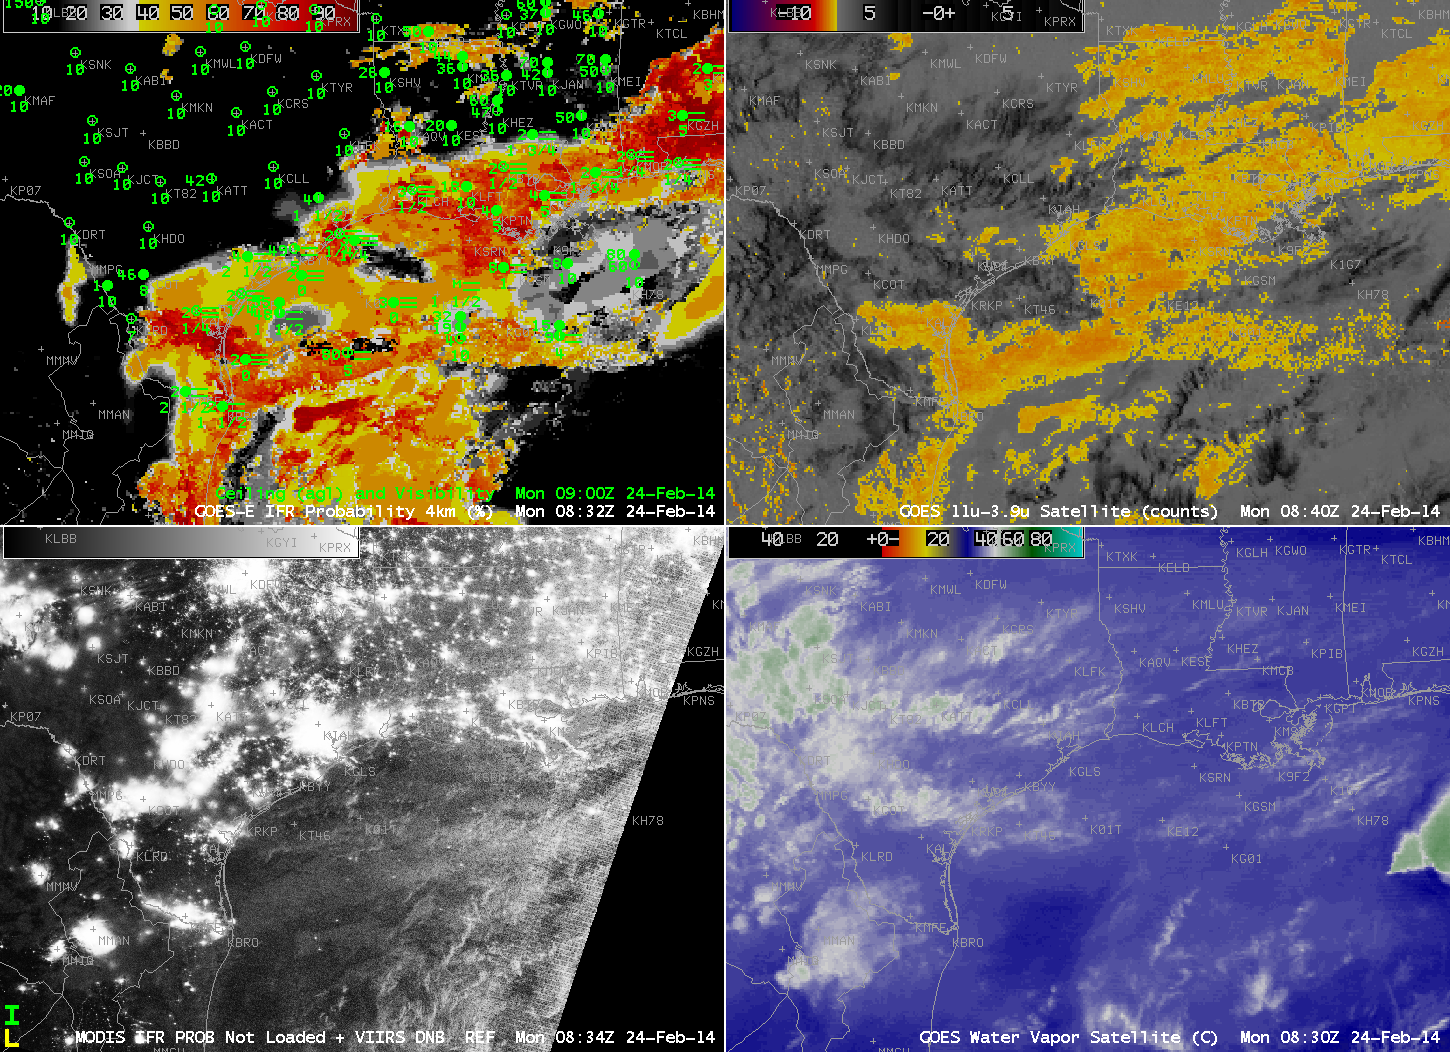
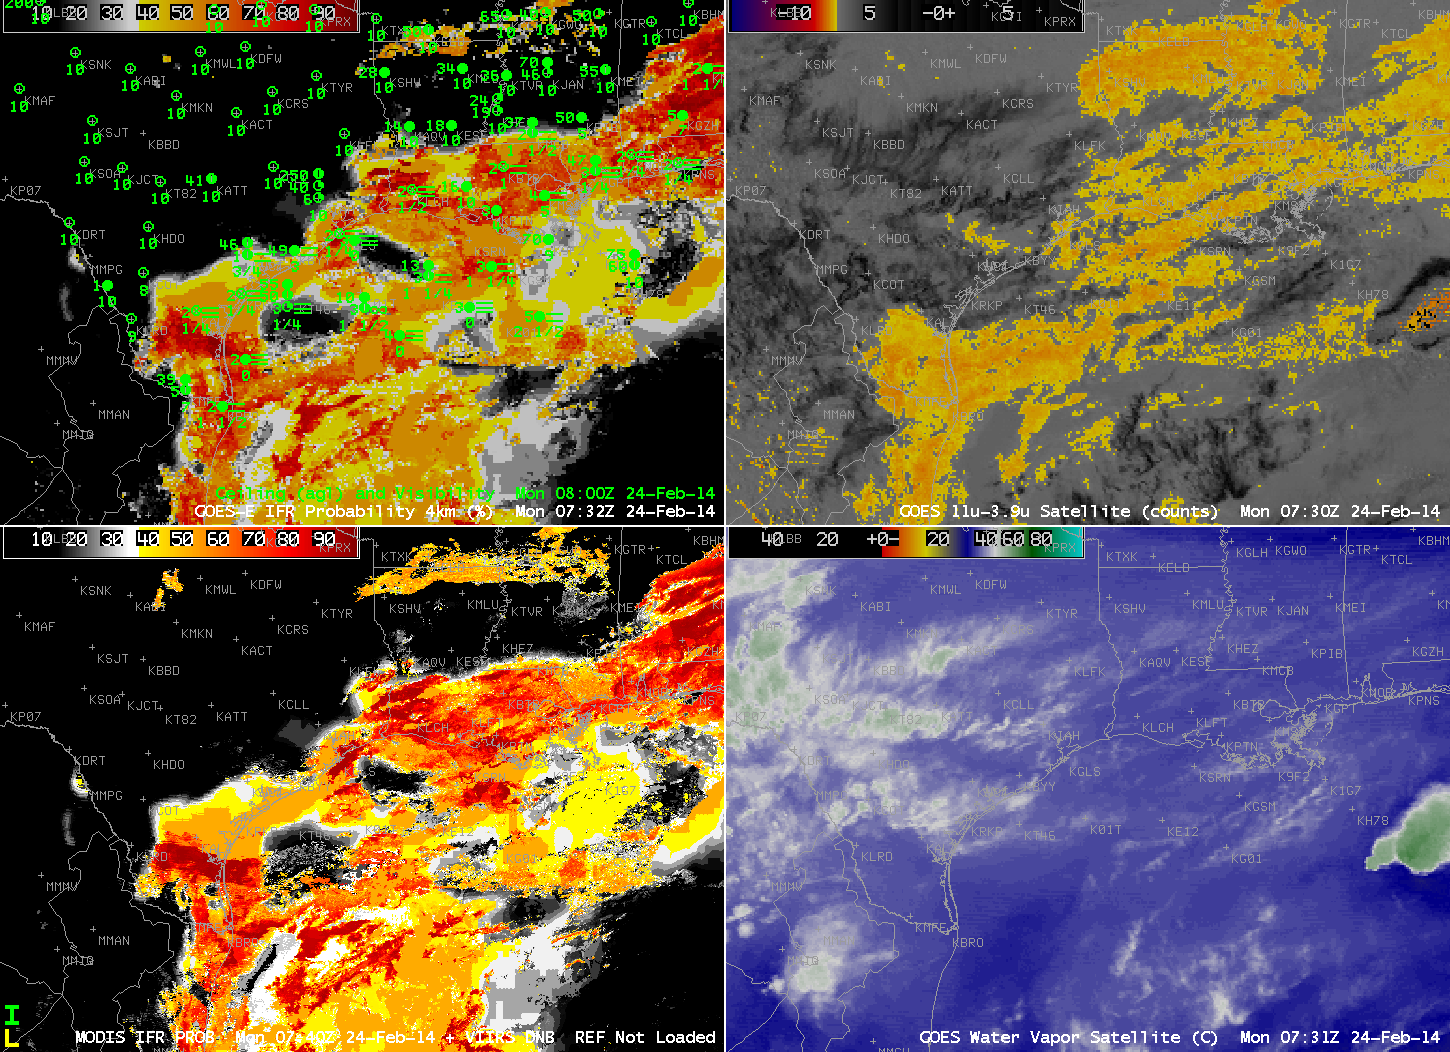
GOES-R IFR Probabilities computed from GOES-15 (Upper Left), GOES-West Brightness Temperature Differences (10.7 µm – 3.9 µm) (Upper Right), GOES-R Cloud Thickness (Lower Left), Suomi/NPP Day/Night Band (Lower Right), all hourly times as indicated (click to enlarge)

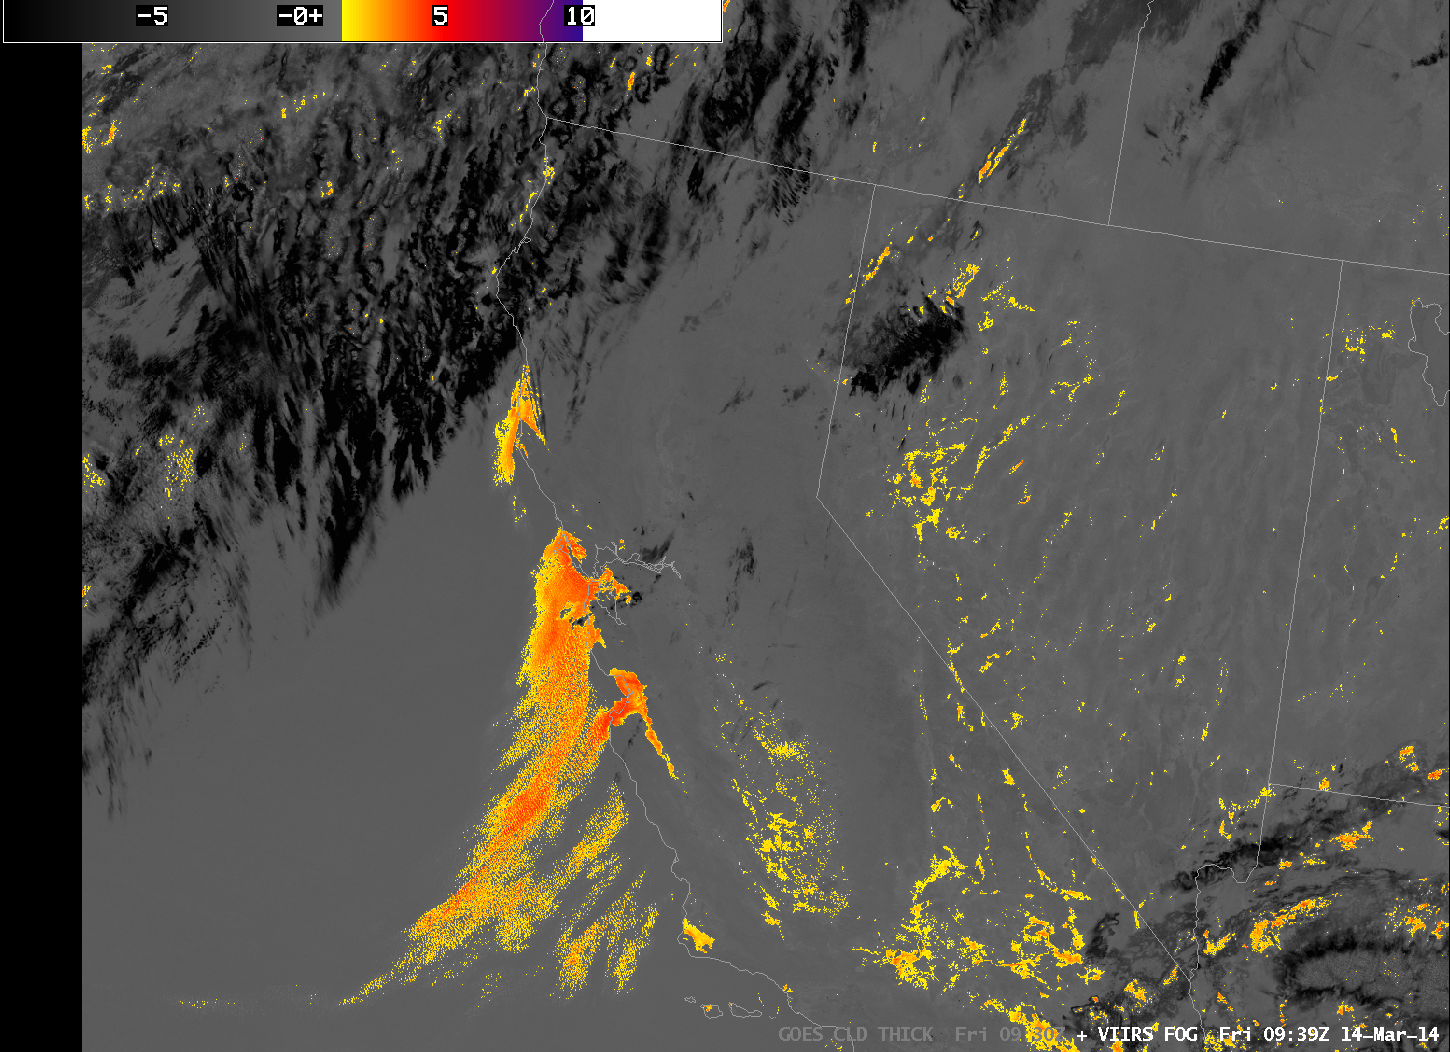
The animation of satellite and satellite-derived fields, above, shows how the GOES-R and GOES-West fields depicted the development of the low clouds. Note how the brightness temperature difference fields over CA and NV throughout the animation have a speckled appearance. These positive signals are due not to the presence of fog/low clouds but rather to differences in emissivity properties of the dry land. Near the end of the animation, high clouds are widespread over northern California. For such cases, the brightness temperature difference product provides little information about low-level clouds. However, the GOES-R IFR Probability field, because it blends together information from satellite and from Rapid Refresh does provide a signal under clouds. It is a much smoother signal because it does vary from one satellite pixel to the next, and the Probability values are smaller because satellite predictors cannot be used in the algorithm.

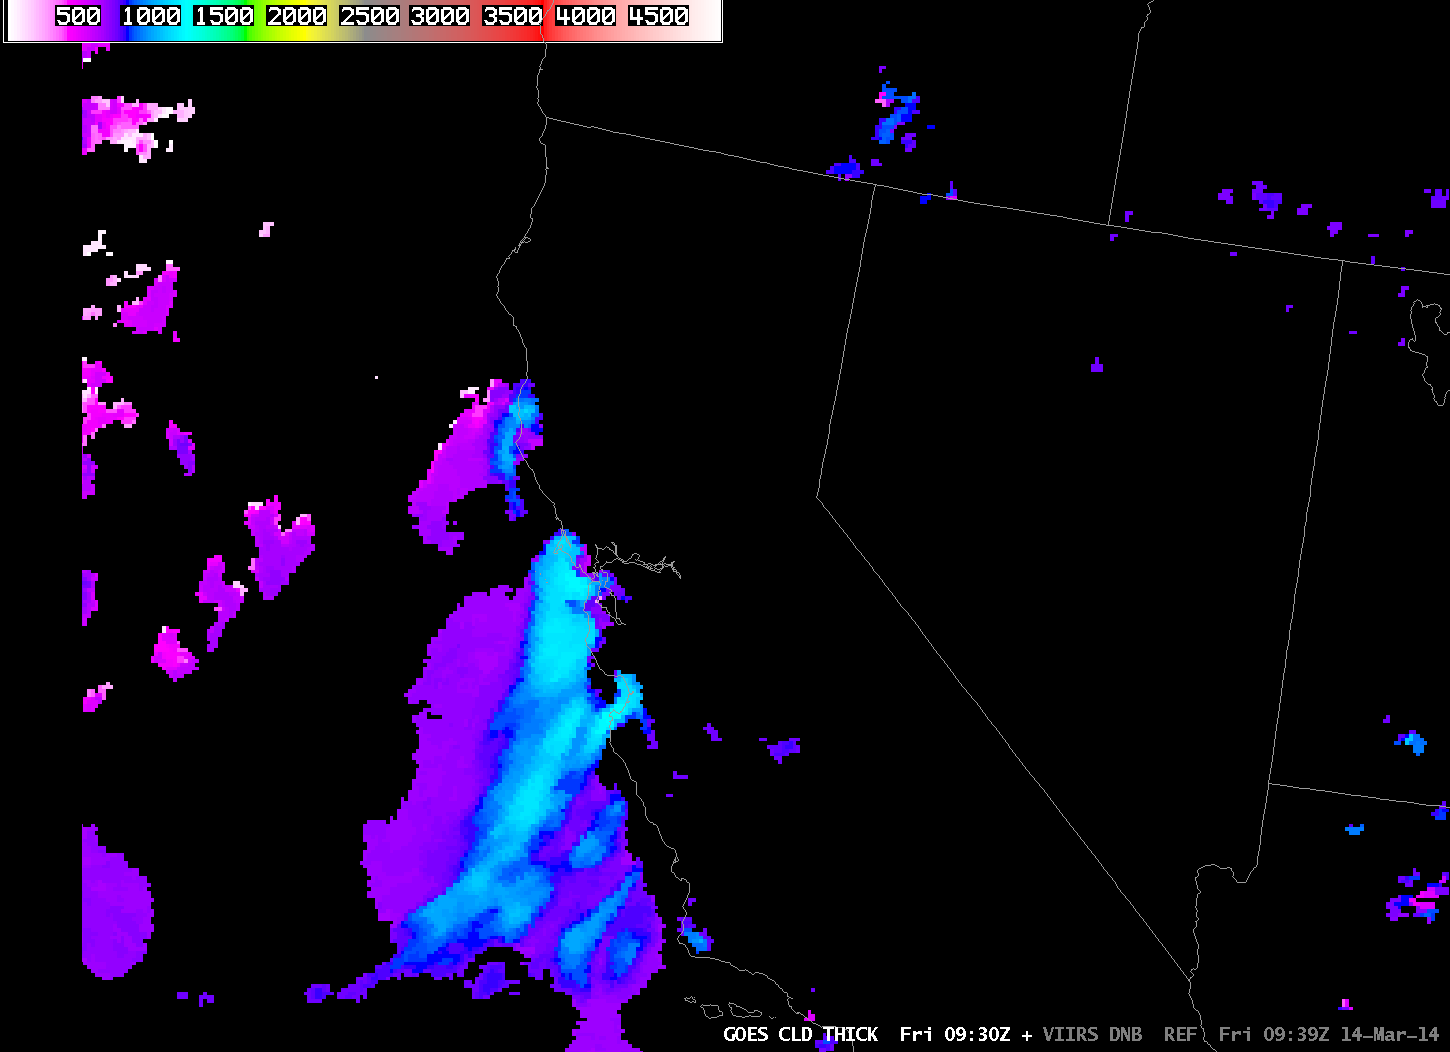
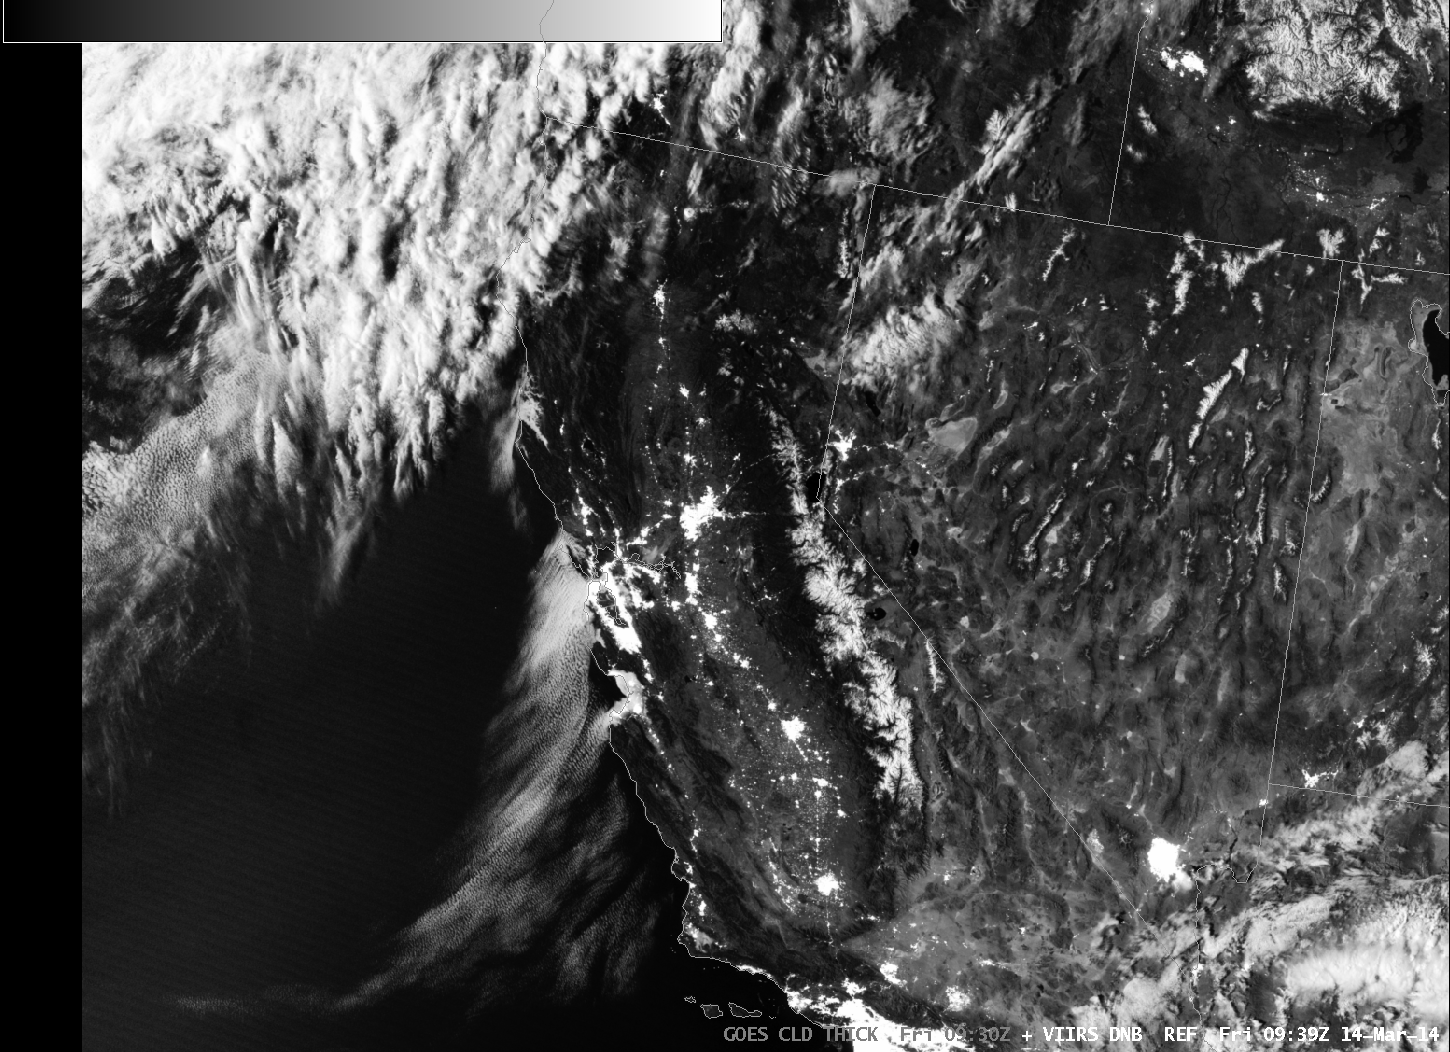
The AFD above notes the Day/Night band, and also the depth of the marine stratus. The toggle of Cloud Thickness, Day/Night Band, and brightness temperature difference, below (useful to distinguish white clouds from white city lights!), shows a nice overlap between the GOES-R product and the clouds detected at high resolution by Suomi/NPP. Cloud thickness is around 1150 feet at Bodega Bay, and closer to 1250 feet at Fort Ord, in good agreement with the profile data cited.

VIIRS_DNB__REF_GOES_CLD_THICK_20140314_09

Toggle of GOES-R Cloud Thickness, Suomi/NPP Brightness Temperature Difference and Day/Night Band (click to enlarge)

Fog over northeast Florida and coastal Georgia and South Carolina

GOES_IFR_PROB_20140304loop

GOES-R IFR Probabilities computed from GOES-13 (Upper left); GOES-East Brightness Temperature Differences (10.7 µm – 3.9 µm) (Upper Right); MODIS-based IFR Probabilities or VIIRS-based Brightness Temperature Difference (11.35 µm – 3.74 µm) (Lower Left); GOES-R Cloud Thickness computed from GOES-East (Lower Right) (click to play animation)

Cold air has swept down the east coast into northern Florida, and the leading edge of that cold air, marked by a shift to northeasterly winds and low clouds, shows up well in the GOES-R IFR Probability fields, displayed above, because the airmass with the northeasterly winds also included low clouds/fog. Note in the animation how IFR conditions develop in Jacksonville as the higher IFR probabilities slide southward. Similarly, IFR conditions diminish over Savannah as IFR Probabilities drop.

This is a case for which the heritage method of detecting fog had difficulties because multiple cloud layers existed. For example, a stratus deck over central Florida shows up very well in the brightness temperature difference field from both GOES and VIIRS, but IFR conditions are not initially seen there (and GOES-R IFR Probabilities are small). The GOES-R Cloud Thickness is not computed in regions with multiple cloud layers, typically, because it shows the thickness of the highest water-based cloud layer. If any overlaying cloud layer at high levels contains ice, the field is not computed.

Sea fog over the western Gulf of Mexico

The National Weather Service in Houston/Galveston has issued Dense Fog advisories for Sea Fog in the easterly flow south of a cold front draped across the northern Gulf:

MARINE WEATHER STATEMENT
NATIONAL WEATHER SERVICE HOUSTON/GALVESTON TX
602 PM CST SUN FEB 23 2014

GMZ330-335-350-355-370-375-260000-
MATAGORDA BAY-GALVESTON BAY-
WATERS FROM FREEPORT TO THE MATAGORDA SHIP CHANNEL OUT 20 NM-
WATERS FROM HIGH ISLAND TO FREEPORT OUT 20 NM-
WATERS FROM FREEPORT TO THE MATAGORDA SHIP CHANNEL 20 NM TO 60 NM-
WATERS FROM HIGH ISLAND TO FREEPORT 20 TO 60 NM-
602 PM CST SUN FEB 23 2014

…DENSE SEA FOG POSSIBLE ACROSS THE AREA FOR THE NEXT SEVERAL DAYS…

AREAS OF SEA FOG…SOME DENSE WITH VISIBILITIES OF 1 NM OR LESS…WILL
CONTINUE TO BE POSSIBLE IN AND AROUND THE GALVESTON AND MATAGORDA BAY
AREAS ALONG WITH THE UPPER TEXAS COASTAL WATERS OUT TO APPROXIMATELY
20 NM. DENSE FOG ADVISORIES MIGHT BE NEEDED.

LITTLE CHANGE IN THIS PATTERN IS EXPECTED UNTIL THE PASSAGE OF THE NEXT
COLD FRONT SOME TIME AROUND LATE TUESDAY NIGHT OR EARLY WEDNESDAY
MORNING.

MARINERS SHOULD BE PREPARED FOR SUDDEN CHANGES IN VISIBILITY OVER SHORT
DISTANCES. REDUCE YOUR SPEED AND KEEP A LOOKOUT FOR OTHER VESSELS…BUOYS
AND BREAKWATERS. KEEP YOUR NAVIGATION LIGHTS ON. INEXPERIENCED MARINERS…
ESPECIALLY THOSE OPERATING SMALLER CRAFT OR NOT EQUIPPED WITH RADAR…SHOULD
CONSIDER SEEKING SAFE HARBOR.

$$

How does the GOES-R IFR Probability field handle this event?

GOES_IFR_PROB_20140224loop

GOES-Based GOES-R IFR Probabilities (Upper Left), GOES-East Brightness Temperature Difference Fields (10.7 µm – 3.9 µm) (Upper Right), Suomi/NPP Day/Night band and MODIS-based IFR Probability fields (Lower Left), GOES-East Water Vapor Imagery (6.7 µm)(Lower Right), hourly from 0400 UTC through 1600 UTC 14 February 2014 (click image to enlarge)

IFR Probabilities are correctly limited to coastal regions of east Texas, with high values off shore. The brightness temperature difference field has difficulty identifying regions of low clouds over the Gulf of Mexico because of southwesterly flow aloft that contains mid- and high-level cloudiness. The relatively flat field over the Gulf — large values, but little variability — correspond to regions where high clouds exist. These high clouds prevent satellite predictors from being used in the IFR Probability algorithm because the brightness temperature difference does not observe low clouds, so only the Rapid Refresh model output is used to compute the IFR Probability. Therefore the IFR Probability fields are a bit flatter. Where there are breaks in the high clouds, the brightness temperature difference field can be used in the IFR Probability algorithm, and the computed IFR Probability is larger. In addition, the character of the probability field is more pixelated like a satellite image.

The bottom left image in the 4-panel composite above includes both the Day/Night band from Suomi/NPP (an image that — because of scant lunar illumination — gives little distinct information about the clouds present) and a MODIS-based IFR Probability field. For selected still imagery of ~0830 UTC Suomi/NPP click here; click here for ~0730 UTC MODIS-based IFR probability.

IFR Probability Fields are an early-alert for Developing Fog

GOES_IFR_PROB_20140214loop

GOES-R IFR Probabilities from 0400 through 1400 UTC on 14 February 2014 (click image to enlarge)

Fog and Low clouds resulted in IFR conditions along a long swath of the western Gulf Coast today. IFR Probability fields warned of the development of these conditions long before a strong signal appeared in the traditional brightness temperature difference fields. The animation above, of hourly GOES-R IFR Probability fields (and surface observations of ceiling and visibility). There are indications by 0615 and 0702 that fog/low stratus is developing, and those indications are matched by some observations of IFR conditions. By 0915 UTC, widespread IFR conditions are present from southwest Louisiana southwestward through coastal Texas.

GOESMODIS_IFR_20140214_0845

GOES-R IFR Probabilities, MODIS IFR Probabilities, and MODIS Brightness Temperature Difference fields, all from ~0845 UTC 14 February 2014 (click image to enlarge)

MODIS data can be used to generate IFR Probabilities as well, as shown above. The MODIS-based and GOES-based fields both generally overlap regions with developing IFR conditions. The MODIS-based Brightness temperature difference product (called MODIS FOG in the image annotation) shows little signal in central Louisiana/east Texas (near Lufkin, for example) or southwest of Houston, two places where near-IFR conditions are developing (and where the IFR Probability fields have a signal).

VIIRS_DNB_FOG_20140214toggle

GOES-R IFR Probabilities, MODIS IFR Probabilities, and MODIS Brightness Temperature Difference fields, all from ~0845 UTC 14 February 2014 (click image to enlarge)

Suomi/NPP data (Brightness Temperature Difference fields, and the Day/Night band) from the same hour (0822 UTC) as the MODIS data similarly underpredicts the areal extend of the developing IFR conditions.

GOES_IFR_PROB_20140214_4panelloop

GOES-Based GOES-R IFR Probabilities (Upper Left), GOES-East Brightness Temperature Difference Fields (Upper Right), GOES-R Cloud Thickness (Lower Left), GOES-East Visible Imagery (Lower Right), hourly from 0400 UTC through 1600 UTC 14 February 2014 (click image to enlarge)

The animation above shows hourly views of GOES-R IFR Probability and GOES-East Brightness Temperature Difference fields. There is little discernible signal in the brightness temperature difference field until about 0915 UTC (several hours after the IFR Probability field has been suggesting fog development). Thus the GOES-R IFR Probability field is giving better lead time is diagnosing where visibility restrictions might occur/be occurring. In addition, the GOES-R Cloud Thickness product shows that the thickest fog/stratus field just before sunrise is just east of Austin/San Antonio, and that is the last region to clear out after sunrise.

The presence of high clouds has an effect on both the IFR Probability fields and the brightness temperature difference field. When high clouds are present (in the brightness temperature difference enhancement used, high clouds are dark), IFR Probabilities drop in value and the field becomes flatter because satellite data cannot be used in the computation of the IFR Probability Field.

IFR Conditions over the southern Plains

GOES_IFR_PROB_20140210loop

GOES-R IFR Probabilities from 0100 through 1500 UTC on 10 February 2014 (click image to enlarge)

Cold air dropping southward through the southern Plains is sometimes shunted westward towards higher elevation on the Equatorward side of the Polar High that anchors the cold air. That upslope flow facilitates the development of fog and low stratus. That was the case today, and the southward and westward movement of low clouds/fog is obvious in the IFR Probability field animation shown above. Much of the High Plains south of Kansas had reduced visibility and lowered ceilings, and IFR Probabilities were high.

The IFR Probability field does a better job of outlining where the low clouds associated with IFR Conditions are present. Compare the half-hourly loop above to the hourly loop of the Brightness Temperature Difference (10.7 µm – 3.9 µm), below. Regions with multiple cloud layers show little signal in the brightness temperature field, and the flip in signal at sunrise — as 3.9 µm radiation from the Sun is reflected off the clouds, overwhelming the emitted signal — is obvious.

US_11-3.9_Sat_20140210loop

GOES-East Brightness Temperature Difference (10.7 µm – 3.9 µm) 0300 through 1500 UTC on 10 February 2014 (click image to enlarge)

Polar-orbiting satellites can give high-resolution views of scenes. Suomi/NPP carries the VIIRS instrument, which has a Day/Night band and 11.35 and 3.74 µm channels, shown below in a toggle. Of course, these views are telling you something about the top of the clouds only. Whether of not visibility/ceiling restrictions are happening is unknown. GOES-R IFR Probability algorithms have not yet been configured for Suomi/NPP data (such a configuration is complicated by the lack of a water vapor channel on VIIRS). The characteristic signal of high clouds — dark features in the enhancement used — shows up in the VIIRS Brightness Temperature Difference field.

VIIRS_20140210_0756

Suomi/NPP VIIRS Day/Night band and Brightness Temperature Difference (11.35 µm – 3.74 µm) at 0756 UTC on 10 February 2014 (click image to enlarge)

MODIS data includes water vapor imagery, and thus GOES-R IFR Probability fields can be computed using MODIS data, as shown below from 0907 UTC. This toggle includes MODIS-based Brightness Temperature Differences, MODIS-based GOES-R IFR Probabilities, GOES-based GOES-R IFR Probabilities and GOES Brightness Temperature Differences. The shortcoming of the MODIS-based data is obvious (it doesn’t view the entire scene), but its strength (excellent spatial resolution) is also apparent.

MODIS_GOES_BTD_IFR_0900

MODIS Brightness Temperature Difference (11 µm – 3.9 µm), MODIS-based GOES-R IFR Probabilities, GOES-based GOES-R IFR Probabilities and GOES-East Brightness Temperature Differences (10.7 µm – 3.9 µm) at ~0910 UTC on 10 February 2014 (click image to enlarge)

GOES-R IFR Probability signal because of co-registration errors

GOES_IFR_PROB_20140130_0802

GOES-R IFR Probabilities at 0802 UTC, 30 January 2014 (click image to enlarge)

Special Update, 17 November 2014.

GOES-R IFR Probabilities on the morning of 30 January suggested the likelihood of fog along some of the Finger Lakes of upstate New York. These high probabilities arise because the Brightness Temperature Difference (10.7 µm – 3.9 µm) Product, below, shows a signal there. Note, however, that the Brightness Temperature Difference has a shadow; this is the sign that the co-registration error that is present between the 10.7 µm and 3.9 µm channels is producing a fictitious signal of fog over the lake. Such errors have been discussed here and elsewhere in the past.

US_11-3.9_Sat_20140130_0801

GOES-East Brightness Temperature Difference (10.7 µm – 3.9 µm) at 0801 UTC, 30 January 2014 (click image to enlarge)

Evidence that fog is not present is available in Suomi/NPP data taken at the same time as the GOES data, above. The toggle, below, of Day/Night Band imagery and of the brightness temperature difference (11.35 µm – 3.74 µm) from VIIRS shows scant evidence of fog/low stratus near the Finger Lakes. Because the moon is new, lunar illumination is at a minimum and surface features in the Day/Night band are not distinct, but the dark waters of the lakes are apparent.

VIIRS_FOGDNB_20140130_0802

Suomi/NPP VIIRS Day/Night band and Brightness Temperature Difference (11.35 µm – 3.74 µm) at 0802 UTC, 30 January 2014 (click image to enlarge)

MODIS data also suggests no fog/low stratus in the region. Both the brightness temperature difference field and the MODIS-based IFR Probabilities, below, support a forecast that does not mention fog around the Finger Lakes.

MODIS_FOG_IFRPROB_20140130_0746

MODIS Brightness Temperature Difference (11 µm – 3.74 µm) and MODIS-based GOES-R IFR Probabilities at 0746 UTC, 30 January 2014 (click image to enlarge)


=====================================================================

Update, 17 November 2014

NOAA/NESDIS has tested a software fix to align better the longwave infrared (10.7 µm) and shortwave infrared (3.9 µm) channels. The toggle below is of the Brightness Temperature Difference Field with (After co-registration correction) and without (Prior to co-registration correction) the realignment.

BTD_BeforeAfterFix

GOES-13 Brightness Temperature Difference Fields at 0802 UTC, 30 January 2014, with and without the co-registration correction as indicated (Photo Credit: UW-Madison CIMSS; Click to enlarge)

The correction of the co-registration error translates into more realistic IFR Probabilities in/around the Finger Lakes. In this case, IFR Probabilities are reduced because the false strong signal from the satellite is not present because of more accurate co-registration.

IFR_BeforeAfterFix

GOES-R IFR Probability fields computed Prior to and After co-registration correction, data from 0802 UTC 30 January 2014. IFR Probability fields with the corrected co-registration data are more accurate. (Photo Credit: UW-Madison CIMSS; Click to enlarge)

Dense fog on the East Coast

VIIRS_DNB_FOG_20140115toggle

GOES-East IFR Probabilities and surface plots of visibilities/ceilings at 0615 UTC 15 January (Upper Left), GOES-East Brightness Temperature Difference (10.7 µm – 3.9 µm), 0615 UTC 15 January (Upper Right), GOES-R Cloud Thickness, 0615 UTC 15 January (Lower Left), and Suomi/NPP Day/Night Band and Brightness Temperature Difference toggle (11.35 µm – 3.74 µm), 0605 UTC 15 January (Lower Right)(click image to enlarge)

The image above documents the GOES-R IFR Probability field during a fog event over the East Coast. Note how the IFR Probability field shows more horizontal uniformity than the traditional brightness temperature difference field over eastern Pennsylvania (where IFR conditions are reported). For example, both Selinsgrove along the Susquehanna and Reading in south-central Pennsylvania report IFR conditions in regions where the IFR Probability field has a strong return, but where the brightness temperature difference field’s diagnosis is less certain.

The Suomi/NPP field demonstrates the importance of higher resolution from polar orbiting satellites. Both the Day/Night Band and the brightness temperature difference fields suggest the presence of river valley fog over the West Branch of the Susquehanna and its many tributaries in central Pennsylvania. This continues at 0743 UTC, below, when Suomi/NPP’s subsequent overpass also viewed the Susquehanna valley. At both times, the river fog is too small-scale to be detected with GOES-13’s nominal 4-km pixel size.

VIIRS_DNB_FOG_20140115toggle

GOES-East IFR Probabilities and surface plots of visibilities/ceilings at 0745 UTC 15 January (Upper Left), GOES-East Brightness Temperature Difference (10.7 µm – 3.9 µm), 0745 UTC 15 January (Upper Right), GOES-R Cloud Thickness, 0745 UTC 15 January (Lower Left), and Suomi/NPP Day/Night Band and Brightness Temperature Difference toggle (11.35 µm – 3.74 µm), 0743 UTC 15 January (Lower Right)(click image to enlarge)

The animation of the fields, below, done to demonstrate the importance of GOES-13’s temporal resolution, shows how the GOES-R IFR Probability field accurately captures the extent of the fog, even as the sun rises and causes the sign of the brightness temperature difference to flip. The traditional brightness temperature difference field has difficulty both in maintaining a signal through sunrise, and it diagnosing the region of fog/low stratus over northcentral Pennsylvania in and around the Poconos and in the Susquehanna River valley. The IFR Probability field has a minimum over/around Mt. Pocono, where IFR conditions are not observed until close to sunrise. IFR probabilities are small over Altoona, where the brightness temperature difference field shows a strong signal developing late at night (and where observations suggest an elevated stratus deck). In this region, although the satellite suggests fog might be present, model conditions do not agree, and IFR Probabilities are correctly minimized.

GOES-R Cloud thickness suggests that the thickest blanket of fog is over New Jersey. This diagnosis continues up through the twilight conditions of sunrise, at which point Cloud thicknesses are no longer diagnosed.

GOES_IFR_PROB_20140115loop

GOES-East IFR Probabilities and surface plots of visibilities/ceilings (Upper Left), GOES-East Brightness Temperature Difference (10.7 µm – 3.9 µm) (Upper Right), GOES-R Cloud Thickness (Lower Left), and GOES-East Water Vapor (6.7 µm), all times as indicated (Lower Right)(click image to enlarge)

Widespread Advection Fog over the Midwest

GOES_IFR_PROB_20140110loop

GOES-East IFR Probabilities and surface plots of visibilities/ceilings and surface analysis of dewpoint at 0202, 0402, 0615, 0802, 1002 and 1215 UTC on 10 January 2014 (click image to enlarge)

The northward movement of moist air over a snow-covered surface allowed for widespread advection fog in the midwest overnight from January 9th to 10th. The animation, above, shows GOES-R IFR Probabilities at 2-hour time steps. Included in the plots are surface observations and cloud ceilings (documenting the widespread region of IFR conditions) and the RTMA Dewpoint analysis that shows the slow northward movement of dewpoints at the surface. As this moist air moves over the cold snow-covered surface (the snow analysis from the National Operational Hydrological Remote Sensing Center is below), advection fog is a result. The GOES-R IFR Probability fields do a fine job of outlining where the IFR conditions are observed.

nsm_depth_2014011005_National

Analysis of snow depth from NOHRSC, 0600 UTC, 10 January 2014 (click image to enlarge)

Note in the animation above how the presence of higher clouds moving up from the southwest affects the IFR Probability fields. As high clouds overspread the advection fog, satellite data can no longer be incorporated into the GOES-R IFR probability algorithm, and IFR Probabilities drop, in this case from values near 90% to values near 55%.

Polar-orbiting data can also give information about low clouds and fog. Temporal resolution is far superior to geostationary, as shown below. In cases of small-scale fog, polar orbiter data can give important information by identifying the first region of a developing fog. In large-scale cases such as this, high-resolution data can better identify edges to the fields. The MODIS data in this case does show high probabilities over the midwest; the brightness temperature difference field shows evidence of high clouds from central Iowa southwestward. As with the GOES data, the presence of high clouds results in lower IFR Probabilities.

MODIS_FOG_IFR_20140110_0814

Toggle between MODIS-based IFR Probabilities and Brightness Temperature Difference at 0814 UTC 10 January 2014 (click image to enlarge)

Suomi/NPP data, below, from the Day/Night band shows widespread cloudiness over the midwest. The clouds are illuminated by the moon, nearly full, setting at this time in the west. Shadows are being cast by high clouds on the lower clouds over western Minnesota. The brightness temperature difference fields from Suomi/NPP are very similar to the MODIS data. In contrast to MODIS, the VIIRS instrument does not have a water vapor sensor, so the IFR Probability algorithms are not directly transferable to Suomi/NPP VIIRS data.

VIIRS_FOG_DNB_20140110_0737

Toggle between Suomi/NPP Day/Night band and Brightness Temperature Difference at 0737 UTC 10 January 2014 (click image to enlarge)

IFR Conditions over Oklahoma and Kansas

GOES_IFR_PROB_20140108_2345

GOES-R IFR Probabilities from GOES-13 (upper left), GOES-13 Brightness Temperature Difference (10.7 µm – 3.9 µm) Fields (upper right), GOES-R Cloud Thickness from GOES-13 (lower left), Suomi/NPP Day/Night Band (lower right), ~2345 UTC 8 January 2014 (click image to enlarge)

IFR Conditions developed over portions of Kansas and Oklahoma (and adjacent states) overnight. How did the GOES-R IFR Probability field diagnose the development of this event? At ~0000 UTC, the traditional method of low stratus/fog detection (Brightness Temperature Difference) showed two regions over the Plains, one centered over Oklahoma, and one over the Kansas/Nebraska border. IFR Probabilities at the same time covered a smaller area; Wichita in particular had low IFR Probabilities despite a brightness temperature difference signal, and Wichita did not report IFR conditions at the time.

Note that high clouds are also present in the Brightness Temperature Difference field over western Kansas, the panhandles of Texas and Oklahoma, and New Mexico. In the enhancement used, high clouds are depicted as dark greys.

GOES_IFR_PROB_20140109_0202

As above, but at 0202 UTC 9 January 2014 (click image to enlarge)

By 0200 UTC (above), the high clouds have moved over parts of Oklahoma and Kansas. Consequently, there are regions over central Oklahoma and south-central Kansas where the brightness temperature difference field is not useful in detecting low stratus/fog that is occurring. The IFR Probability fields suggest the presence of low clouds despite the lack of satellite data because the IFR Probability Field also uses output from the Rapid Refresh Model that suggests saturation is occurring in those regions. Model data are also used where satellite data suggest low clouds/stratus are present to delineate where surface ceilings/visibilities are congruent with IFR conditions. As at 2345 UTC, Wichita is not reporting IFR conditions, although the brightness temperature difference field suggests IFR conditions might exist. The IFR Probability field correctly shows low values there.

GOES_IFR_PROB_20140109_0802_VIIRS

As above, but at 0802 UTC 9 January 2014. Suomi/NPP data is a toggle of Day/Night band and 11.35 µm – 3.74 µm brightness temperature difference (click image to enlarge)

By 0802 UTC, high clouds have overspread much of Oklahoma, yet IFR conditions are occurring at several locations. IFR probabilities nicely depict the widespread nature of this IFR event. Probabilities are reduced in regions where high clouds are present because the algorithm cannot use satellite predictors of low clouds/stratus there. Both the Day/Night band and the brightness temperature difference field give information about the top of the cloud deck — it’s hard to infer how the cloud base is behaving. The addition of Rapid Refresh model information on low-level saturation helps better define where IFR conditions are present.

GOES_IFR_PROB_20140109_0945_VIIRS

As above, but at 0945 UTC 9 January 2014. Suomi/NPP data is a toggle of Day/Night band and 11.35 µm – 3.74 µm brightness temperature difference (click image to enlarge)

By 0945 UTC, above, the time of the next Suomi/NPP overpass, the high clouds have started to move eastward out of Oklahoma. Consequently, satellite data can be used as one of the predictors in the IFR probability field, and IFR Probabilities over Oklahoma increase. By 1215 UTC (below), higher clouds have east out of the domain, and IFR Probabilities are high over the region of reduced ceilings/visibilities over Oklahoma. The algorithm continues to show lower probabilities in regions over Kansas where the Brightness temperature difference signals the presence of low stratus/fog but where IFR conditions are not present. Again, this is because the Rapid Refresh model in those regions is not showing low-level saturation.

GOES_IFR_PROB_20140109_1215

As above, but at 1215 UTC 9 January 2014 (click image to enlarge)

Note in the imagery above how the presence of high clouds affects the GOES-R Cloud Thickness. If the highest cloud detected is ice-based, no cloud thickness field is computed. GOES-R Cloud Thickness is the estimated thickness of the highest water-based cloud detected. If ice clouds are present, the highest water-based cloud cannot be detected by the satellite. Cloud Thickness is also not computed during twilight conditions. Those occurred just before the first image, top, and about an hour after the last image, above.

IFR Probabilities over the Pacific Northwest with a front

GOES_IFR_PROB_20140103loop

GOES-R IFR Probabilities from GOES-15 (upper left), GOES-15 Brightness Temperature Difference (10.7 µm – 3.9 µm) Fields (upper right), GOES-R Cloud Thickness from GOES-15 (lower left), Suomi/NPP Brightness Temperature Difference (lower right), times as indicated, 3 January 2014 (click image to animate)

One benefit of the GOES-R IFR probabilities is its consistency from hour to hour. In the animation above, the region of higher IFR Probabilities associated with a southward-propagating front over Oregon shows good hour-to-hour consistency. In contrast, the Brightness Temperature Difference field (upper right in the figure) suffers from the presence of higher clouds (denoted in the enhancement by darker regions). As the high IFR Probabilities expand southward into southern Oregon, reported visibilities/ceilings decrease towards IFR conditions. In the animation, regions of high clouds show up in the Cloud Thickness product as regions of missing data: Cloud Thickness is of the highest water-based cloud. If the highest cloud detected by satellite is mixed-phase, or ice, Cloud Thickness is not computed. Cloud Thickness is also not computed in the 1600 UTC imagery because that time is near sunrise, and cloud thickness is not computed in twilight conditions.

Suomi/NPP provided a view of the scene as well, and the Day/Night Band showed the band of frontal clouds well. The brightness temperature difference field suggests that the cloud band was not necessarily low cloudiness, although the higher IFR Probabilities (and reduced ceilings and visibilities) testify to the presence of low clouds underneath the middle- and higher-level clouds.

VIIRS_DNB_BTD_20140103_1000

GOES-R IFR Probabilities from GOES-15 (upper left), GOES-15 Brightness Temperature Difference (10.7 µm – 3.9 µm) Fields (upper right), GOES-R Cloud Thickness from GOES-15 (lower left), Toggle between Suomi/NPP Day/Night band and Brightness Temperature Difference (lower right), ~1000 UTC, 3 January 2014 (click image to enlarge)