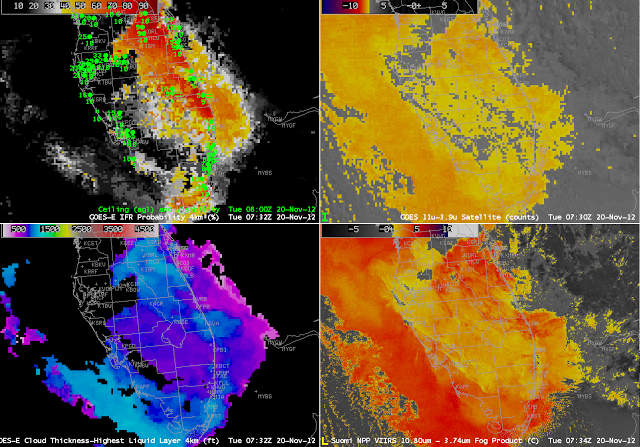
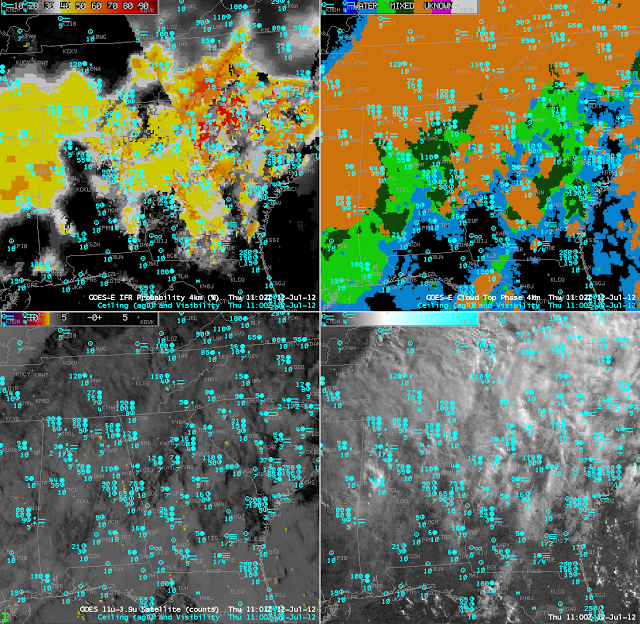
Tuesday morning’s low cloud/fog event over southern Florida is an excellent example of how the fused product better distinguishes between fog (that reduces visibility at the surface) and low stratus (that does not reduce visibility at the surface). The traditional brightness temperature difference products from both GOES (Upper Right) and VIIRS (Lower Right) show a strong signal over both Florida coasts — Atlantic and Gulf — but the IFR probabilities are highest along the Atlantic Coast — where IFR and near-IFR ceilings/visibilities are observed. Over and off the west coast of Florida, despite the very strong satellite signal, IFR probabilities are low because saturation is not occurring in the lowest part of the Rapid Refresh Model — and IFR conditions are not observed.
Category Archives: Southeast
GOES-R Fog Products vs. ‘Traditional’ Products over Florida
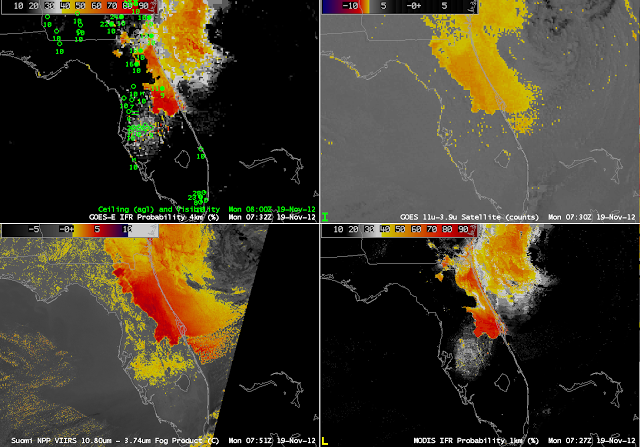
Fog and low clouds that developed over central Florida (again) on Monday morning, 19 November, highlight some strengths and shortcomings of the different fog detection techniques. The GOES-R IFR Probability (upper right) shows highest probabilities in the region where the traditional brightness temperature difference product has a distinct signal. But there is also a region of IFR probabilities (albeit low) east of Tampa Bay where the traditional brightness temperature difference product has no distinct signal. This is likely a region of developing fog/low stratus. Note that the higher-resolution Brightness Temperature Difference product from VIIRS on Suomi/NPP has a signal in that region, and the MODIS-based IFR Probability (lower right) field is also consistent with a developing fog/low stratus field. The low IFR Probabilities in the GOES-based signal should alert to the possibility of developing fog. Note that both the GOES-Based and MODIS-based IFR probabilities show a narrower strip of fog/low stratus south of Jacksonville than is represented in the GOES and Suomi/NPP Brightness Temperature Difference fields. In this region, the Rapid Refresh Model data are refining the satellite predictors to represent more accurately the distribution of fog/low stratus in the Rapid Refresh model output. The IFR Probabilities at 1000 UTC (below) shows that IFR conditions did indeed develop in that region of interior Florida to the east of Tampa.
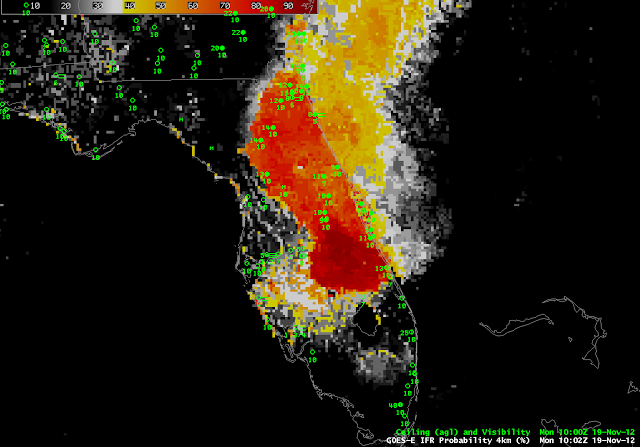 |
| GOES-R IFR Probabilities at 1002 UTC, computed from GOES-East and the Rapid Refresh Model |
The Traditional Brightness Temperature Difference field shows a signal that parallels the west-facing Gulf coasts of Florida. This signal arises from a co-registration error between the shortwave IR and longwave IR sensors on GOES (See this post for more examples). This co-registration error is diurnally varying and typically peaks between midnight and sunrise.
IFR Conditions under Cirrus in Florida
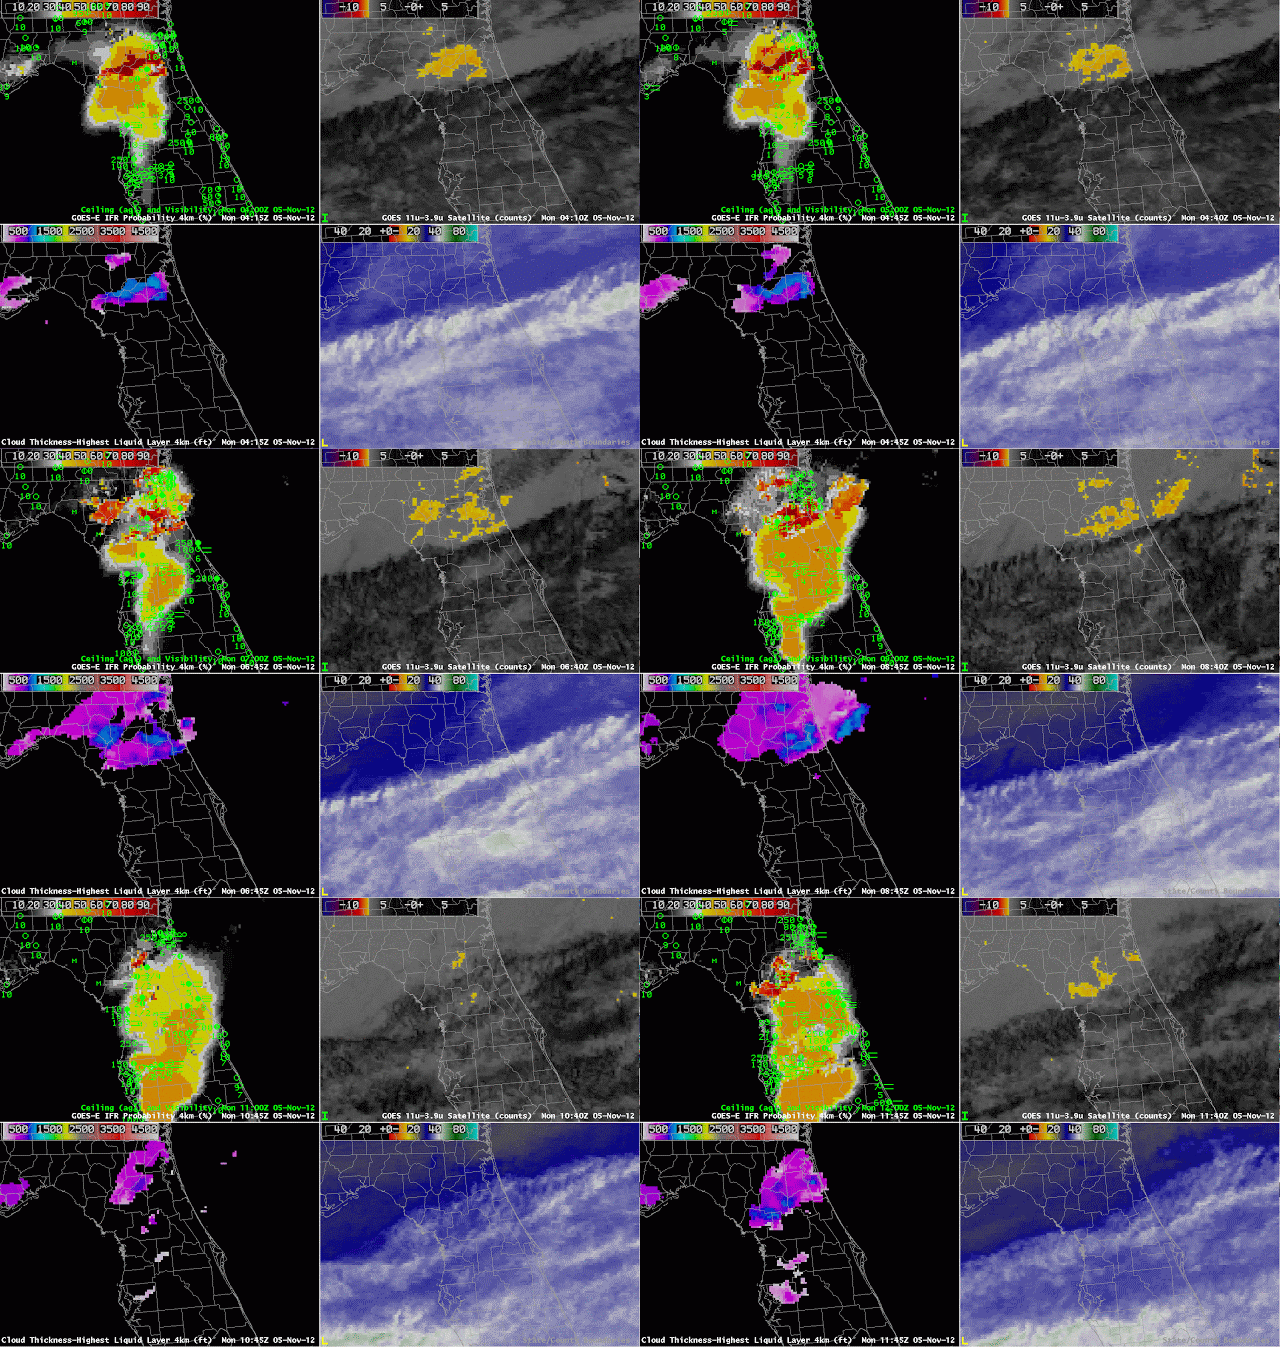
Fog developed over central Florida overnight underneath a thin cirrus (as indicated by both the water vapor and brightness temperature difference imagery). Cirrus clouds prevent the traditional brightness temperature difference field from identifying low fog/stratus because the high ice clouds are detected rather than the developing low-level water clouds. This is a case, then, when a fused product gives needed surface information to help diagnose the development of fog and low stratus. The brightness temperature difference product, the traditional method to detect fog and low stratus, is giving no information where dense fog is forming.
On this date, the development and expansion of the higher IFR probabilities over central Florida neatly matches the development of IFR conditions at the observing stations. Probabilities are not high because the satellite predictors are not contributing to the algorithm. It is important when interpreting the IFR probabilities to be aware of the presence of high clouds that will influence IFR probability values. Where the cirrus clouds are not present, notably over northeast Florida, IFR probabilities are much higher because satellite predictors there are contributing to the final probability.
This case also shows that the Cloud Thickness is only computed where the highest clouds detected is a water-based cloud. Underneath the cirrus shield, except for a few regions where there are apparently holes, cloud thickness is not computed.
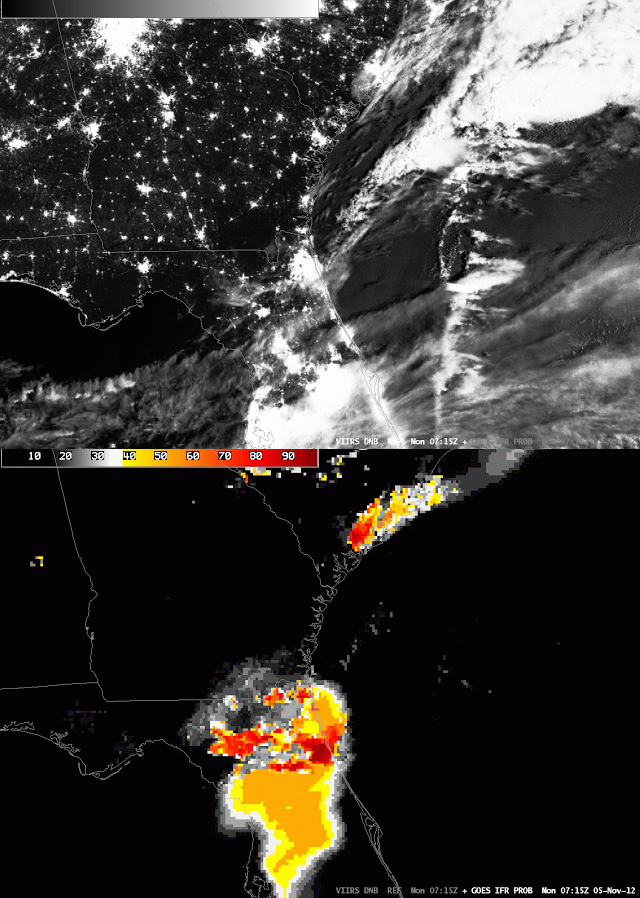 |
| GOES-R IFR Probabilities and Day/Night Band from VIIRS on Suomi/NPP, 0715 UTC 5 Nov |
The toggle above flips between the Day-Night band from VIIRS on Suomi/NPP and the GOES-R IFR probability at the same time. The thin cirrus shield is readily apparent, and the regions of fog are also visible in the Day/Night band over north-central Florida and over coastal South Carolina.
A MODIS-based IFR Probability (shown below) was also created at 0715 UTC, and it shows a pattern similar to that above. The pixelated part of the image corresponds to where satellite data are being used. The region with lower values, and a flatter field, was created using only model predictors and, as noted above, is characterized by lower probabilities. The highest probabilities are in regions where both satellite and model predictors are very confident that IFR conditions are present.
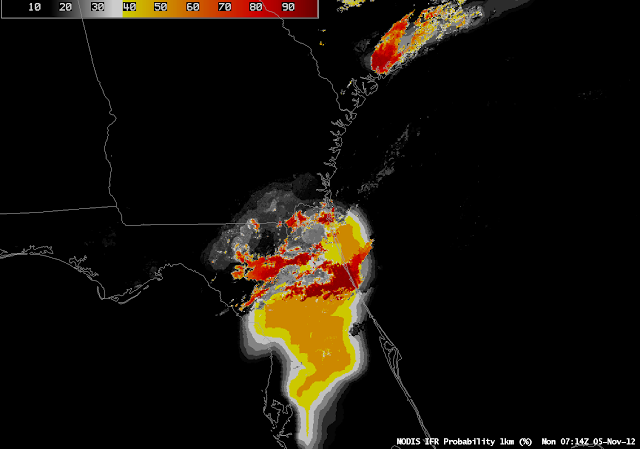 |
| MODIS-based GOES-R IFR Probabilities, Monday 5 Nov 2012, 0714 UTC |
Fog Over Florida
Light winds allowed for the development of radiation fog over Florida early in the morning of Oct 18th, 2012, and the GOES-R IFR Probability fields matched the development of the fog, with probabilities increasing over the course of the night as IFR conditions became more and more widespread. The GOES-R IFR Probability product fuses satellite data with Rapid Refresh model output (as well as ancillary data such as SSTs and surface emissivity).
An interesting aspect of this case is the development of a mid-level cloud deck — visible in the AVHRR brightness temperature difference field at 1031 UTC (and in the GOES-R cloud thickness product as well, from GOES) over the north-central part of the Florida Peninsula. A still image of the 10.7 micron field, below, plainly shows this mid-level feature. This region of mid-level clouds correlates well with a slight drop in the GOES-R IFR probabilities.
 |
| GOES-14 10.7 micron imagery, 1101 UTC. |
The Thickness of the lowest liquid cloud layer, upper right, can be correlated with fog dissipation time. The last image before twilight conditions, at 1115/1132 UTC, shows thicknesses peaking around 1000 ft. This corresponds to a dissipation time of at most 4 hours. Indeed, a visible image at 1415 UTC show that the fog has largely dissipated. The visibility at KJAX increases to 3 statute miles at 1419 UTC.
| GOES-14 visible imagery at 1415 UTC on 18 October 2012 |
Day/Night band and fog detection
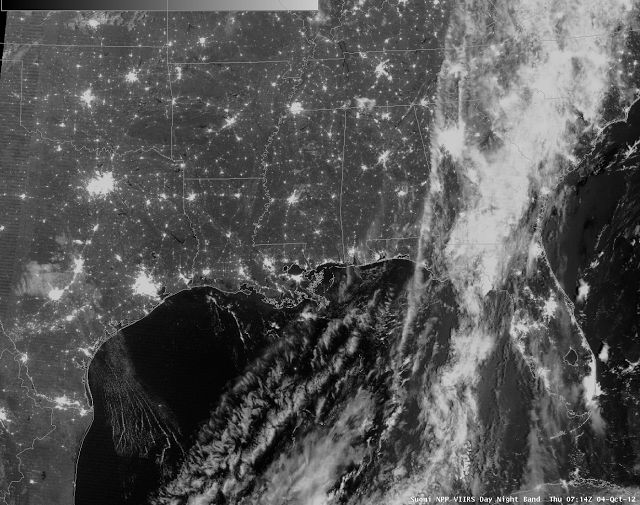 |
| Day/Night band from VIIRS on Suomi/NPP from 0714 UTC on 4 October 2012 |
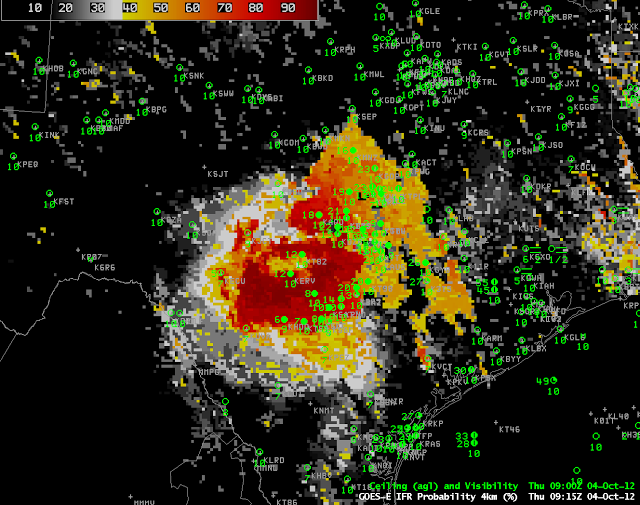
The day/night band imagery, above, shows fog/low clouds in the Hill Country west of San Antonio and Austin in south-central Texas. Additionally, there are low clouds over the Gulf of Mexico, with cloud street structures that suggest a south-southeasterly wind bringing moisture inland from the Gulf. The 0855 UTC day/night band image over the same domain, below, shows an expansion of the fog/low cloud signal.
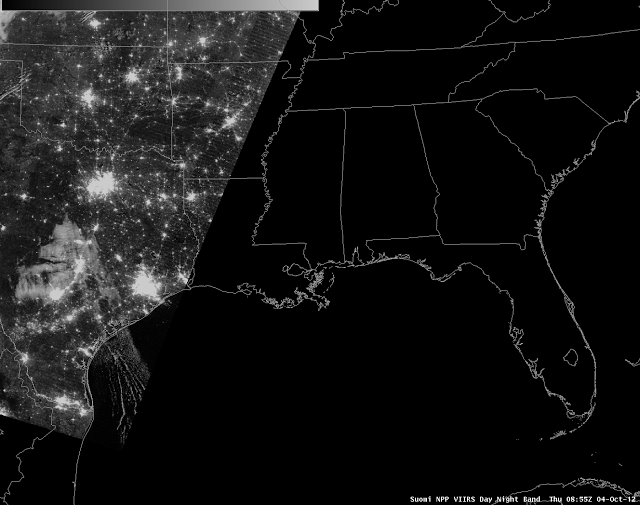 |
| Day/Night band from VIIRS on Suomi/NPP from 0855 UTC on 4 October 2012 |
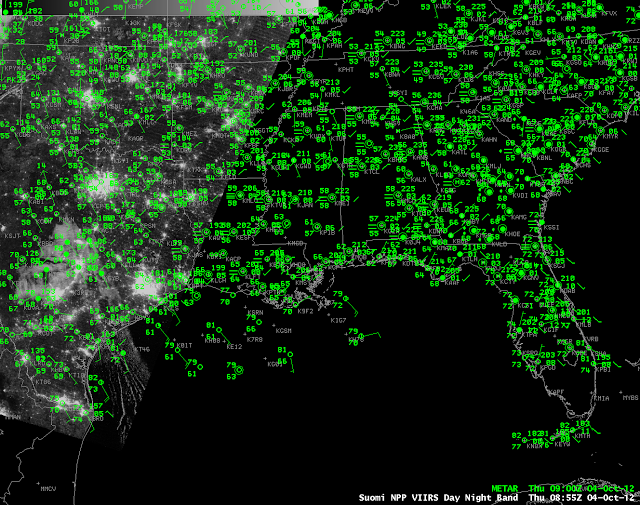 |
| Day/Night band from Suomi/NPP with observations overlain. |
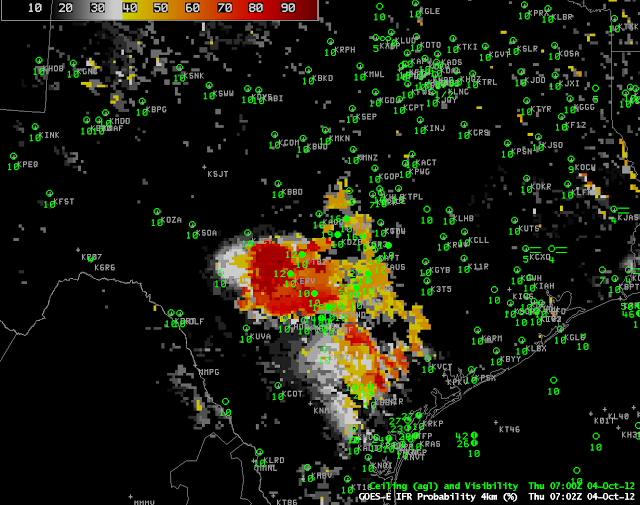
Observations suggest that the northern edge of the cloud streets over the extreme western Gulf of Mexico is the edge of a moisture gradient, and that that gradient extends inland to where the fog and low stratus are occurring. How did the GOES-R IFR Probability field perform on this day? The 0702 UTC (below) and 0915 UTC IFR probability fields show an increas in the areal extent of higher probabilities over the course of the night, consistent with the overnight cooling and the continued feed of moisture from the Gulf. By 0900 UTC, IFR observations are common in and near the region where IFR probabilities are high. This is a good example of how the Day/Night band and IFR Probabilities can be used in concert to understand the evolution of the fog/low stratus field over south Texas.
GOES-R IFR Probability gives information in the day too!
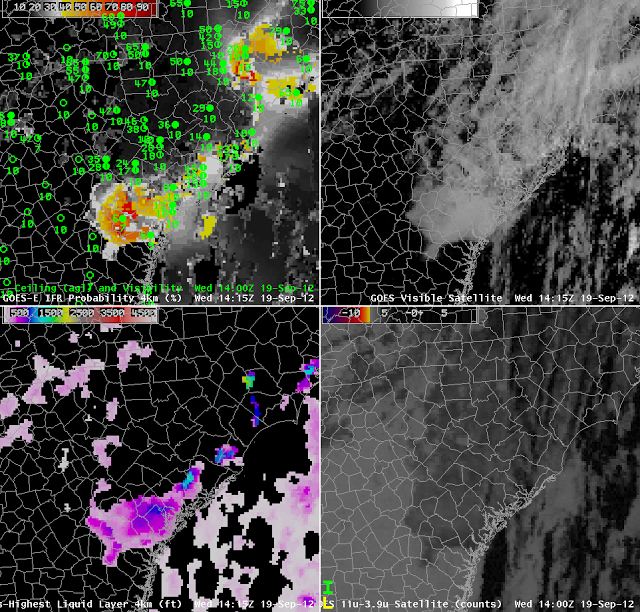 |
| GOES-R IFR Probability from GOES-East (Upper left), GOES-East Visible (Upper Right), GOES-R Cloud Thickness (Lower left) and GOES-East Brightness Temperature Difference (Lower Right) |
The GOES-R IFR Probability serves a useful purpose in the day: It highlights where, in a field of clouds, the lowest visibilities and ceilings are likely. In the image above from coastal North and South Carolina and Georgia. cloudiness is hugging the coast, as indicated both in the visible and in the tradiational brightness temperature difference product. Highest probabilities of IFR conditions are depicted near Statesboro and Savannah GA, where ceilings and visibilities are lowest.
Interpreting the GOES-R IFR Product in regions where Model and Satellite Predictors are used
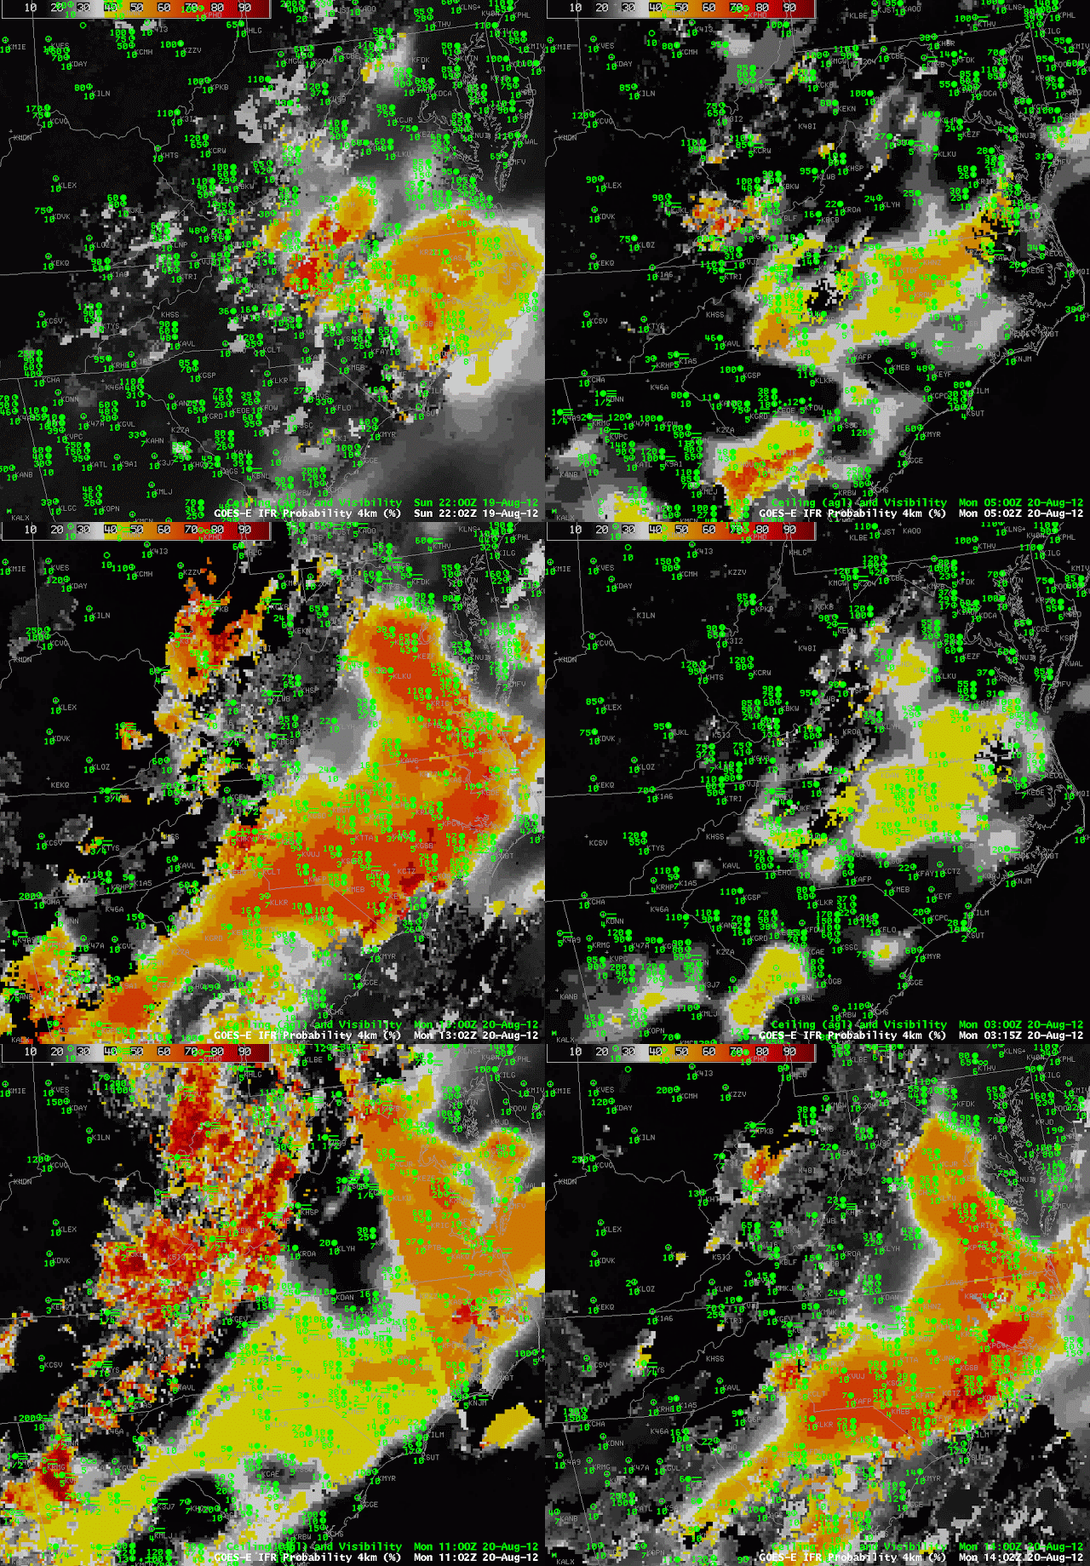 |
| GOES-R IFR Probabilities computed from GOES-East and from the Rapid Refresh, hourly from 2202 UTC on 19 August through 1402 UTC on 20 August |
The animation above demonstrates the different ways in which GOES-R probabilities can be detected, and the values that can occur. Much of the East Coast was under a multi-layer cloud deck (as shown below in the color-enhanced 0632 GOES-East 10.7 µm image). In those places, IFR probabilities will be computed using Rapid Refresh model output, and the character of the IFR probability field will differ from how the field looks when satellite data are used as IFR predictors.
For example, the smooth IFR probability field over North Carolina in this loop (especially from 0300 UTC to 0700 UTC) strongly indicates model-only predictors. Before and after that time there are small regions that are more pixelated, suggesting satellite input. At 0600 UTC, GOES-R IFR probabilities start to increase over West Virginia as overnight cooling allows temperatures to approach the dewpoint, and fog starts to develop. Probabilities become quite high by sunrise over and near West Virginia, and IFR conditions are evident. IFR probabilities where satellite and model data are used as predictors — as over West Virginia — are generally higher than regions where model data only are used (over North Carolina). Model data will always be included in the computation of IFR probabilities. In regions of multiple cloud layers, such as over North Carolina, it is used alone and IFR probabilities can be high. In regions of low clouds, such as over West Virginia, the model underscores what the satellite data are telling and IFR probabilities will be even higher. There can also be regions where the Satellite and Model predictors give conflicting information on the presence of fog/low stratus. In these regions, IFR probabilities will be somewhat lower.
Note that the terminator is present in this loop, both at sunset (2345 UTC) and at sunrise (the 1100 UTC imagery). The change in IFR probabilities that occur is evident as predictors that are used during the day change to or from those used at night. At 1100 UTC, probabilities are increasing by about 18% over North Carolina.
| GOES-13 10.7 µm imagery at 0632 UTC on 20 August 2012. |
IFR Probabilities under clouds
When atmospheric conditions support multiple cloud layers and low-level fog, the heritage method of fog/low cloud detection (the brightness temperature difference between the 10.8 and 3.9 µm channels) will yield little information because the highest cloud will likely include ice, and the brightness temperature difference exploits emissivity differences in water clouds. In these regions, the model output is vital to predict IFR probabilities. Because satellite predictors are giving no information in these regions, however, the overall probabilities are likely to be lower than the case where both satellite and model suggest the presence of fog. Expect the highest probabilities when both satellite model suggest the presence of fog. If only one of the predictors (satellite data or model data) suggests the presence of fog, IFR probabitilies will be lower.
In the example above, periodic episodes of IFR conditions are occurring over Georgia. Most of the IFR probability signal is coming from the Rapid Refresh, and there are hints that the model output is not quite reproducing the observed weather. If satellite data are not used as a predictor in the GOES-R IFR Probability product (because of high clouds), interpretation of the GOES-R IFR product is complicated by Rapid Refresh performance.
Fog Dissipation
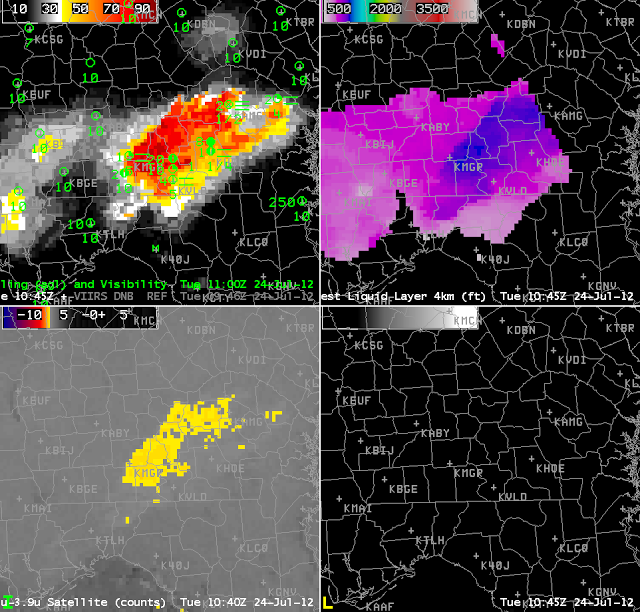
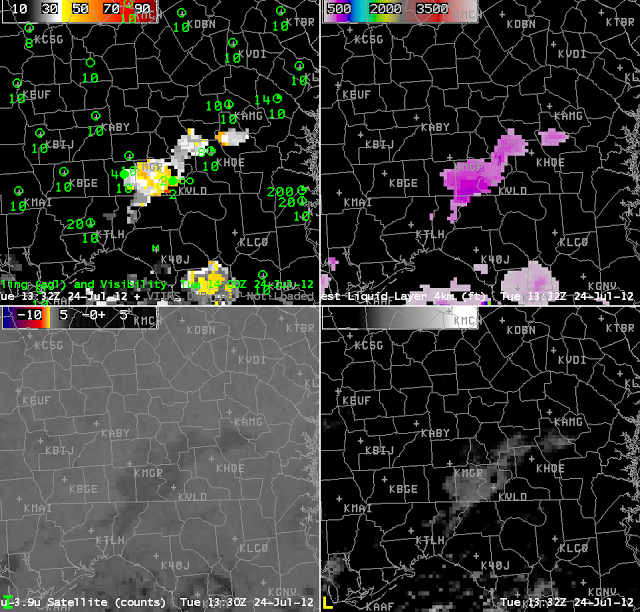
GOES-R Cloud thickness at the last valid time before sunrise (recall that Cloud Thickness is not available during twilight times) can be used as a predictor for where low clouds/fog (that formed via radiative processes) will linger longest after sunrise. In the image above, the thickest cloud — about 1000 feet thick — is diagnosed to be near KMGR (Moultrie, GA). It is in this area that the fog should be last to dissipate. The relationship between cloud thickness and time to dissipate was derived from Spring-time observations and is shown in the plot below. (You can download the figure here as a png or here as a pdf).
| This figure, from the GOES-R Fog/Low Stratus Training developed for the National Weather Service, shows dissipation time after sunrise as a function of Cloud Thickness |
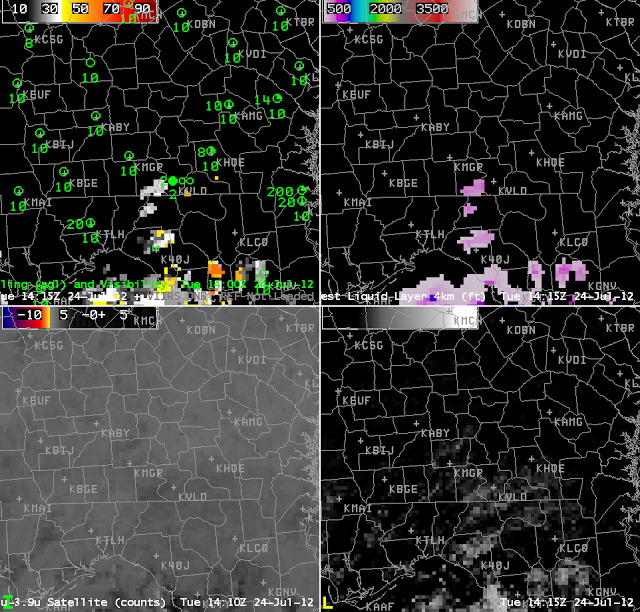
The visible imagery shows that fog is lingering as expected in the region between Moultrie and KVLD (Valdosta). By 1401 UTC, below, the fog has largely dissipated as cumulus convection starts to develop surrounding the region where fog had existed.
Fog and Low Stratus where it rains
Several things require explanation in these images. In the IFR probability mapping, the SSE to NNW boundary extending from near Jacksonville to Chattanooga is the terminator, the boundary between using nigthtime and daytime values in the look-up tables that are used to relate model and satellite fields to IFR probabilities. Note that the daytime values generally yield higher probabilities than the nighttime values, especially for regions where IFR probabilities are determined mostly from model output. Regions where that occurs — where model output drives the IFR probability output — are typically underneath widespread ice clouds, and the probability fields have a more uniform look to them. In the image above, more satellite data are being used over South Carolina, and the resultant IFR probability field has a more pixelated character. Note, however, how little information about fog and low stratus is present in the traditional brightness temperature difference field in the lower left. IFR flight rules are common from south central Georgia northeastward into South Carolina and over northern Mississippi.

