Category Archives: Multiple Cloud Layers

Advection/Radiation fog over the Upper Midwest

GOES-R IFR Probabilities at 0100, 0400 and 0800 UTC on 24 October 2012

Dewpoints in the low 60s (Fahrenheit) surging into the upper Midwest in late October heighten the chances of fog, and the GOES-R Fog/Low Stratus product did a commendable job of showing where the fog might be occurring.  The loop above shows the IFR Probabilities over Wisconsin, Iowa and Minnesota as well as visibility/ceiling observations.  The northwest-southeast edge of higher probabilities over southern to west-central Wisconsin at 0100 UTC matches the observations well:  IFR conditions prevail in regions north and east of that line.  Note also, at 0400 UTC, the skinny region of enhanced IFR probabilities that hugs the western shore of Lake Michigan.  Lake Michigan lake surface temperatures are in the low 40s, so dewpoints above 50 will result in a dense advection fog.  Heightened probabilities continue at 0800 UTC over northern and eastern Wisconsin, in agreement with observations.

Heritage Fog Detection, brightness temperature difference, at 0100, 0400 and 0800 UTC on 24 October

The Brightness temperature difference field historically has been used to diagnose the presence of low clouds, and the animation above shows the importance of using fused products — that include some kind of influence from surface observations as occurs in the Rapid Refresh — to clarify exactly where the low clouds that obstruct visibility are common.  Consider the field at 0100 UTC.  The IFR probability delineates between higher visibility over southern/western Wisconsin and lower visibilities north and east.  No such delineation occurs in the tradiational product because the brightness temperature difference alone cannot indicate the ceiling.

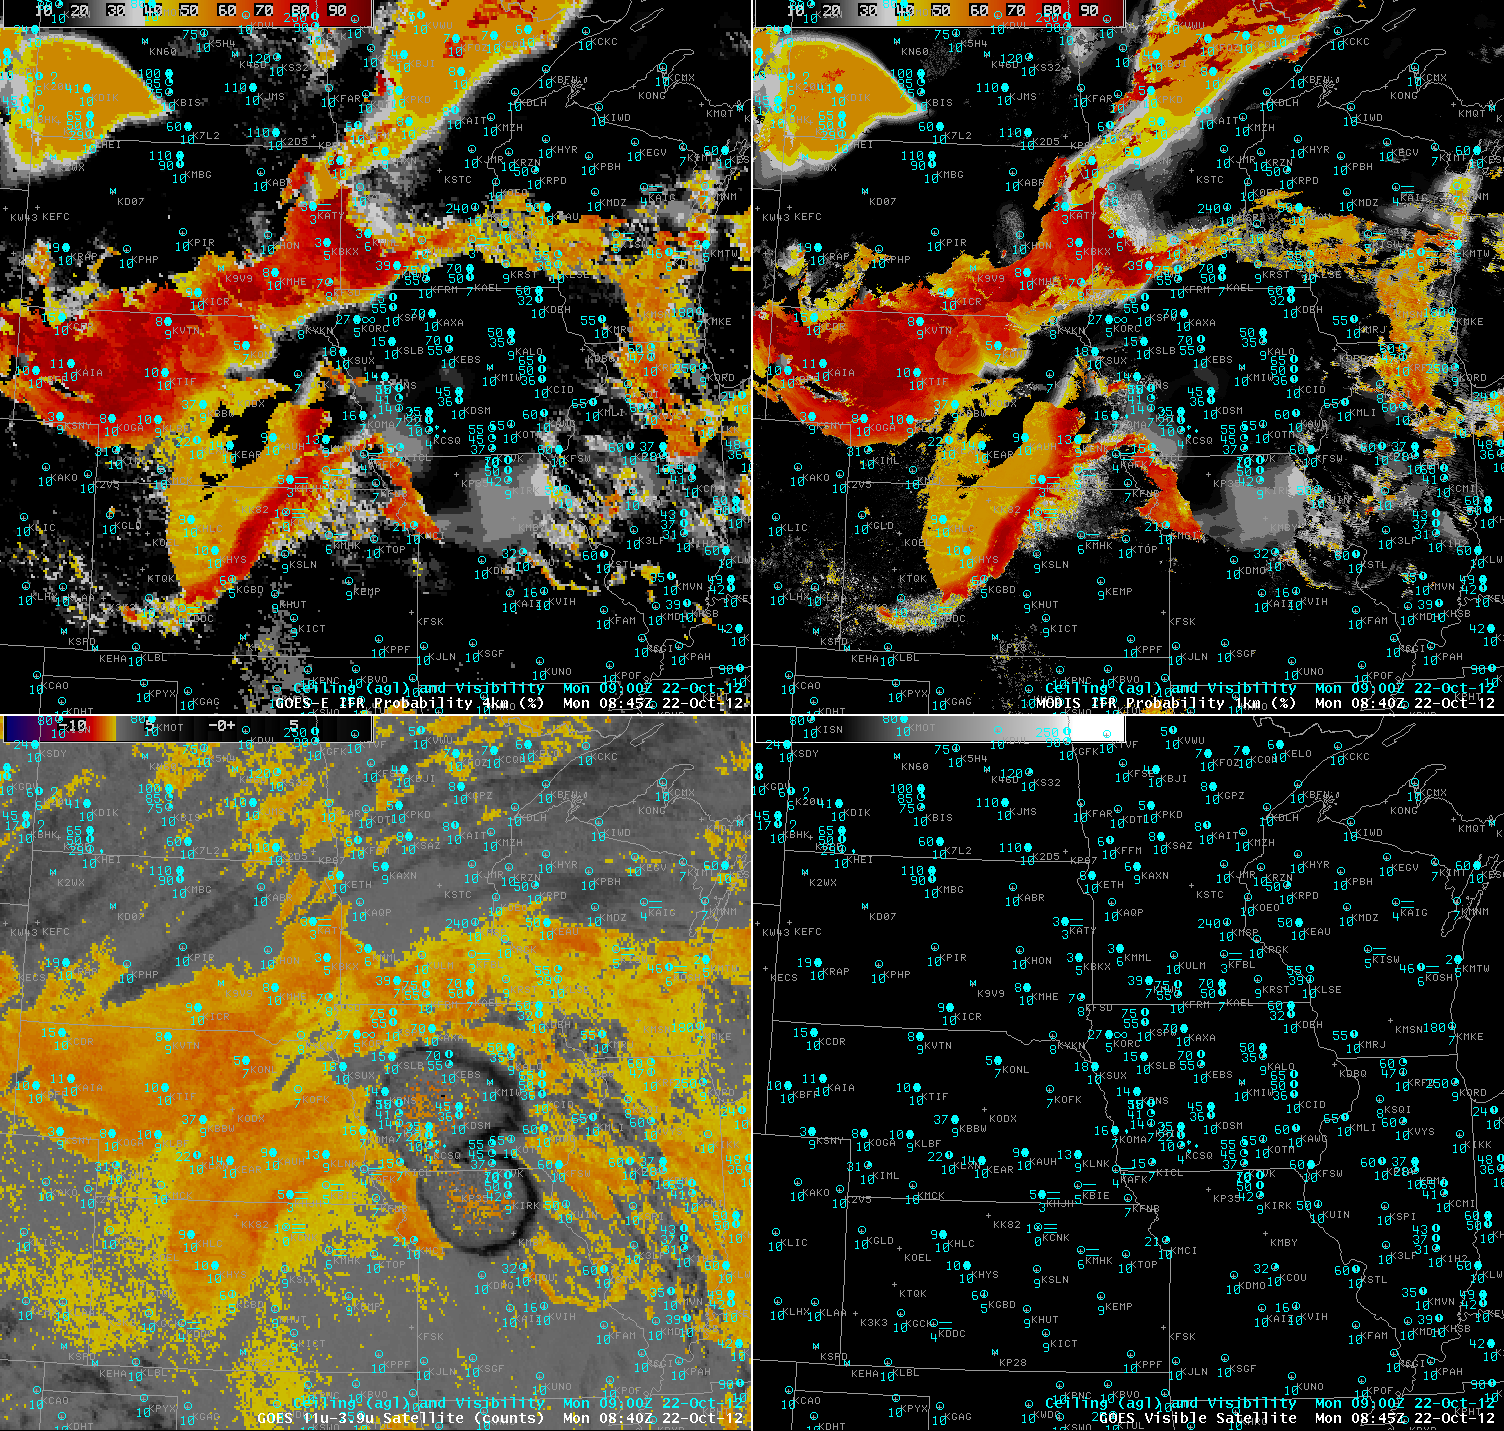
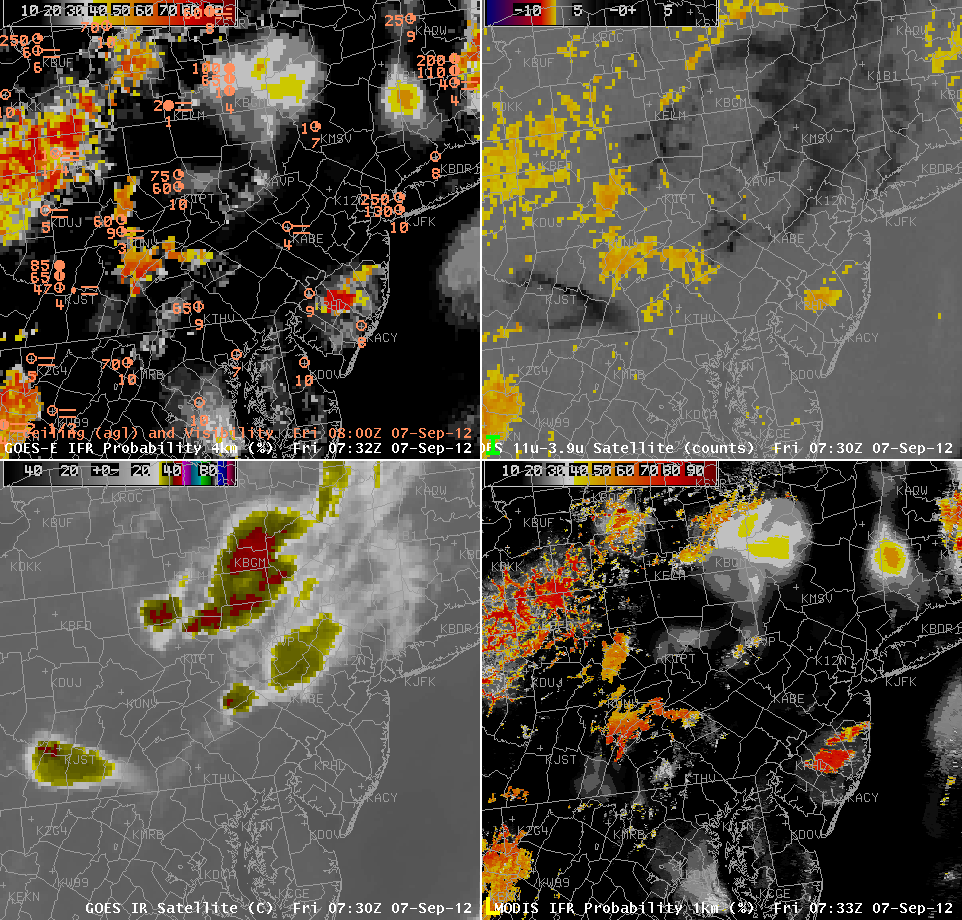
MODIS data is also used to create IFR Probability fields, and the 0417 UTC imagery is shown below.

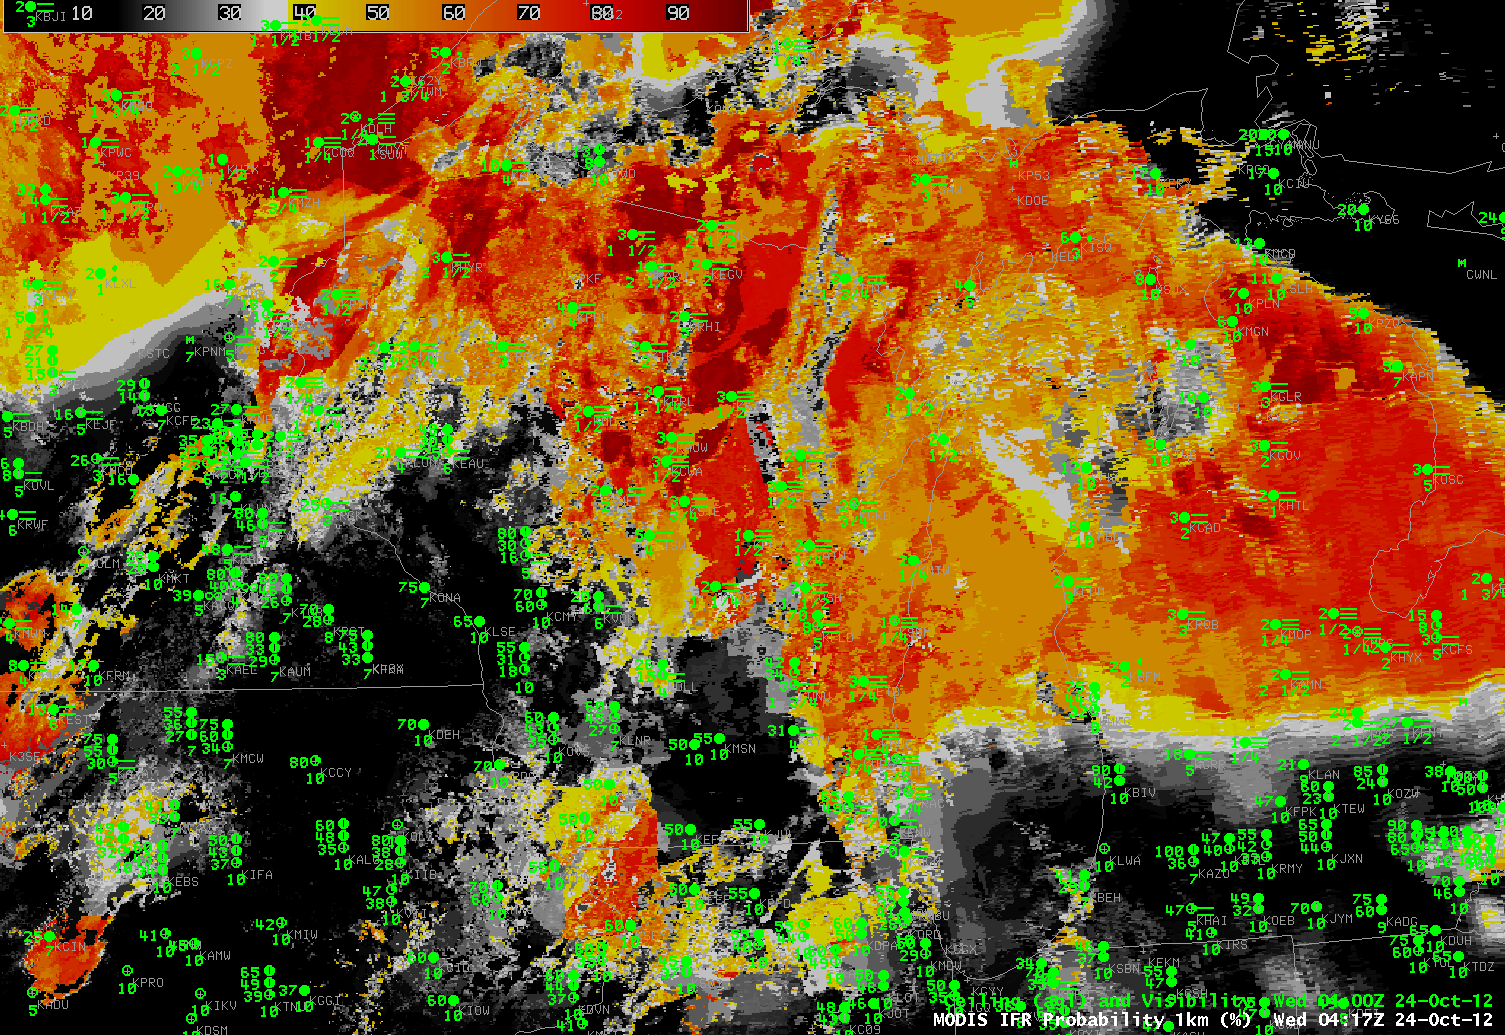
MODIS-based GOES-R IFR Probabilities, 0417 UTC 24 October.

Fog/Low Stratus over the Upper Midwest U.S.

GOES-R IFR probabilities (upper left), GOES-R LIFR probabilities (upper right), GOES-13 brightness temperature difference (3.9-11 µm) (lower left) and visible satellite image (lower right). Surface observations of visibility and cloud ceiling (above ground level) are overlaid on all 4 panels in blue

The GOES-R IFR probabilities are useful when monitoring the formation of fog and/or low stratus (FLS) clouds. In this case over the Upper Midwest U.S. FLS started forming over eastern South Dakota and quickly spread to adjacent states eventually becoming widespread over most of the Upper Midwest. Surface observations of IFR conditions correlate very well to the areas of high IFR probabilities denoted by the dark orange to red colors. In the animation above the GOES-R IFR probabilities track the formation of the FLS with high confidence, evidenced by the relatively high IFR probabilities. The traditionally-used 3.9-11 micron BTD product also detects the FLS, but has difficulty detecting the spatial extent of the hazardous areas of the cloud deck. During the initial formation before 10Z Surface observations over Iowa and S. Minnesota indicate that elevated clouds are present, but they do not meet the IFR criteria for surface visibility (< 3 miles) and/or cloud ceiling (<1000 ft) until after a cluster of showers and thunderstorms passes through. This cluster of showers and storms can be seen in the 3.9-11 micron BTD as the gray and black circular area moving east over Iowa. In these types of situations the satellite only approach does not provide any information on what's going on near the surface because the satellite can only view the top most cloud layer. Using a blended approach merging satellite information with modeled forecast data from the Rapid Refresh model the IFR probabilities can still provide useful information on the presence of hazardous low cloud conditions even when multiple cloud layers are present.

The GOES-R LIFR probabilities can be useful for gaining confidence on whether the FLS is near the surface or if the cloud deck is elevated. Areas of relatively higher IFR and LIFR probabilities usually correlate well to lower surface visibility observations while areas of relatively high IFR probabilities and low LIFR probabilities usually correspond to higher surface visibilities but low cloud ceilings.
When the Sun rises, reflected solar radiation makes using the traditional BTD very difficult. The GOES-R IFR probabilities are available both night and day so users will be able to use the products through sunrise and sunset with confidence. During the day the visible satellite image shows the smooth FLS deck over western Nebraska and what appears to be some cumuliform clouds over eastern Nebraska. Surface observations show IFR conditions are present over most of Nebraska and again correlate very well with high IFR probabilities, even in the presence of the overlaying cumuliform cloud deck.
GOES-R IFR probabilities applied to MODIS (upper left), GOES-R LIFR probabilities applied to MODIS (upper right), MODIS brightness temperature difference (3.9-11 µm) (lower left) and visible satellite image (lower right). Surface observations of visibility and cloud ceiling (above ground level) are overlaid on all 4 panels in blue
The GOES data is available at a high temporal resolution, but only has a spatial resolution of 4km. Applying the GOES-R FLS products to MODIS allows the use of a much high spatial resolution (1km) dataset. The downfall is that since MODIS is on a polar orbiting satellite it is only available a few times per day. However, the higher spatial resolution allows the user to see much more detail than can be obtained using GOES data.

IFR Probabilities in a large-scale rain event

GOES-R IFR Probabilities over Pennsylvania and surroundings hourly from 1300 to 1700 UTC on 18 September 2012, with ceiling and visibility plots overlain.

The traditional method for identifying fog and low stratus, the brightness temperature difference between the 10.7 µm and 3.9 µm channels, cannot work in cases with multiple cloud layers, or in cases with cirrus.  Such a cloud environment is increasingly common in cooler weather months as extratropical cyclones and frontogenetic events cause large-scale ascent.  It is still important to have a way to identify regions of low clouds/fog, and the fused product that considers both satellite data and rapid refresh model data accomplishes that task.

When only model data are used in the fused product, IFR probabilities will peak around 55% — the dark orange shading that is comon over much of central Pennsylvania — to 67% — the isolated pockets of darker red/orange over western Centre County.  Higher values — such as the red values over the lower Susquehanna Valley — exceeding 75% require both a satellite and model estimate (there is likely a gap in the high-level cloudiness here that allows the satellite to view the lowest clouds).

As the thick overcast over Pennsylvania breaks apart during the course of the morning in this animation, the IFR probability field takes on a more pixelation aspect and regions of high IFR probability appear.  Again, highest probabilities occur in regions where both satellite and model suggest IFR conditions are present.  When satellite data are not available, IFR probabilities will not be so high.

Note in this animation that southeast Pennsylvania and New Jersey, where visibilities/ceilings exceed IFR thresholds, are regions where IFR probabilities correctly remain low.  This suggests that the Rapid Refresh model is accurately simulating the evolution of the weather system.

Fog and low Stratus Chances near Philadelphia

The National Weather Service in Philadelphia/Mt. Holly NJ noted the possibility of fog formation in the moist airmass that supported showers and thundershowers over Pennsylvania on late Thursday.  From the forecast discussion issued at 0059 UTC on 7 September:

000
FXUS61 KPHI 070059
AFDPHI

AREA FORECAST DISCUSSION
NATIONAL WEATHER SERVICE MOUNT HOLLY NJ
859 PM EDT THU SEP 6 2012 
.... 
 
.NEAR TERM /UNTIL 6 AM FRIDAY MORNING/...

-- Changed Discussion --

DENSE GROUND FOG CONTINUES TO BE POTENTIAL PROBLEM OF THE NIGHT.
PUBLIC PRODUCTS UPDATED AT 555PM HAVE INCLUDED PATCHY DENSE FOG
IN MANY OF THE ZONES AND THE SHOWERS HAVE ENDED IN DE.

LIGHT WIND...CLEARING SKIES IN THE WAKE OF THE SHOWERS/SPRINKLES
EARLIER TODAY AND DEWPOINTS IN THE UPPER 60S TO AROUND 70 IN WHAT
SHOULD BE A MOSTLY CLEAR - NO WIND NIGHT WITH WEAK HIGH PRES IN PA
SPELLS TROUBLE...ESPECIALLY SINCE PATCHY LOW CIGS HAVE DEVELOPED
VCNTY KACY SINCE ABOUT 19Z...FIRST ALERT TO A BIGGER FOG/LOW CIG
PROBLEM.

GEOCAT SATELLITE AND SREF PROBS ARE NOT INDICATING MUCH FOG/LOW
CIG CHANCE AND MOST OF THE MET AND MAVMOS GUIDANCE IS NOT INTERESTED
IN FOG/LOW CIGS...YET THE MASS FIELDS OF BL AND SFC RH SEEM TO BE
MORE PLAUSIBLE. WE SHOULD KNOW BY 02Z AS A FEW OF THE TEMP/DEWS
START GETTING TO 100 PCT RH IN S NJ/DE
 
 
The possibility of fog remained a concern through the night, as noted in the forecast discussion from 0747 UTC:
000
FXUS61 KPHI 070747
AFDPHI

AREA FORECAST DISCUSSION
NATIONAL WEATHER SERVICE MOUNT HOLLY NJ
347 AM EDT FRI SEP 7 2012

........

-- End Changed Discussion --

&&

.NEAR TERM /UNTIL 6 PM THIS EVENING/...

-- Changed Discussion --

.....
WORTHWHILE FOG HAS NOT BEEN DEVELOPING OVERNIGHT. STEPPING OUTSIDE
WHILE IT IS CONSIDERABLY MURKIER THAN LAST NIGHT, ITS AS IF THE DEW
DEPOSITION (WHICH IS QUITE HEAVIER) IS TAKING AWAY FROM THE FOG.
GEOCAT IFR PROBS REMAIN LOW. WE STILL HAVE A COUPLE OF MORE HOURS
TO GO, WE WILL JUST KEEP THE MENTION OF SOME PATCHY/AREAS OF FOG IN
THE GRIDS, BUT STOP THERE.
 
 
The GOES-R IFR Probability product, shown below at hourly intervals starting at 0315 UTC,  shows modest probabilities of fog over the Delaware Valley,  and higher probabilities over the Pine Barrens of central New Jersey, justifying the forecast mention of patchy fog.  
GOES-R IFR Probabilities from GOES-East (Upper Left), Traditional Brightness Temperature Difference Product (Upper Right), enhanced window channel (Lower Left), GOES-R IFR Probabilities from MODIS (Lower left)
MODIS data can be used to compute IFR probabilities.  One comparison scene exists at the beginning of the hourly loop, and the finer detail over the valleys of southeast Pennsylvania is evident in the 0322 UTC image.  The MODIS image at 0739 UTC shows (below) similar fine-scale structures that can help a forecaster fine-tune the forecast.  IFR probabilities in the MODIS images definitely jump over central New Jersey between 0322 UTC and 0733 UTC.  Such a notable change is a tool for a forecaster to be alert to the possibility of fog/low stratus and IFR conditions.  Several stations in central New Jersey, including McGuire Air Force base (KWRI), Belmar/Farmingdale (KBLM) and Mill Valley (KMIV) did report borderline IFR conditions between 0700 and 1000 UTC.
GOES-R IFR Probabilities from GOES-East (Upper Left), Traditional Brightness Temperature Difference Product (Upper Right), enhanced window channel (Lower Left), GOES-R IFR Probabilities from MODIS (Lower left) from ca. 0730 UTC

IFR Probabilities during an extratropical cyclone in the Gulf of Alaska

GOES-R IFR Probabilities (Upper left), Color-enhanced Topography (Upper right), Surface Observations and ceilings (Lower Left), Enhanced 10.7 imagery (Lower right)

Oceanic storms will generate IFR conditions, and the GOES-R IFR Probability fields, a fused product that blends satellite and model information, provides an indication of how and when visibilities decrease.  The animation above, at hourly intervals, shows the steady advance of higher IFR probabilities eastward through the Gulf of Alaska.  Note how the observations at Middleton Island (PAMD) and at Yalutat (PAYA) both transition to IFR conditions as the ‘front’ of higher probabilities passes — around 0700 UTC at PAMD and around 1300 UTC at PAYA.

The IFR probability field includes regions that are characteristic of model-only predictors being used (the large yellow region that stretches NNE-SSW over the Gulf of Alaska at 1200 UTC) and regions where both model and satellite data are used (the more pixelated region south of the Aleutians at the end of the animation).  When model predictors only are used, probabilities are typically lower than when both model and satellite predictors are used.

GOES-R Fog and the Day/Night Band on VIIRS

GOES-R IFR Probabilities (upper left), Suomi/NPP VIIRS Day/Night Band (upper right), Brightness temperature difference (10.7 micrometers – 3.9 micrometers) from GOES (lower left), Brightness temrperature difference (11.35 micrometers – 3.74 micrometers) from Suomi/NPP VIIRS (lower right), all around 0930 UTC on 31 August.

The presence of the Day/Night band on the VIIRS instrument on the Suomi/NPP satellite offers a unique method of validating the presence of fog or stratus at night.  During times near full moon (such as the Blue Moon on 31 August), the Day/Night band can detect low clouds using light reflected from the moon.  The GOES-R IFR probabilities show fog and low/stratus over southwestern Oregon;  a larger region of fog/low stratus stretched from just north of Crescent City, CA (where IFR conditions are reported) southward down the coast.  Note also a small patch over southwestern Washington and coastal northwest Washington (where IFR conditions are reported.  Cirrus clouds that prevent the detection of fog/low stratus from satellite are present stretching northeastward from the ocean off the central Oregon coast into central Washington.  There is a small signal in the GOES-R IFR Probability field underneath this upper cloud feature.

GOES-R IFR probabilties (Upper left), Suomi/NPP VIIRS day/night band (upper right), GOES-West Brightness Temperature Difference between 10.7 and 3.9 micrometer channels (Lower left), Observations (Lower right), all around 1200 UTC, 31 August

AT 1200 UTC, some benefits of the GOES-R IFR probability field are apparent.  The noisy signal over central and eastern Oregon is reduced, and a signal is present also underneath the thin cirrus streak that persists over extreme northwest Oregon.

IFR in Alaska when a Large-Scale weather system is present

Animation of 1400 UTC Water vapor imagery, the 10.7 micron infrared image, the brightness temperature difference (10.7 – 3.9), the GOES-R IFR Probabilities computed from GOES data, the GOES-R IFR Probabilities computed from MODIS data, and the surface observations/ceilings.

The loop above cycles through the 1400 UTC Water vapor imagery, the 10.7 micron infrared image, the brightness temperature difference (10.7 – 3.9), the GOES-R IFR Probabilities computed from GOES data, the GOES-R IFR Probabilities computed from MODIS data, and the surface observations/ceilings.  The complex large-scale weather system over northwest Alaska is means that southerly winds over eastern Alaska are drawing moisture and cloudiness northward from the Gulf of Alaska.  Multiple cloud layers in this moist flow means that the traditional method of fog/low stratus detection (the brightness temperature difference between 10.7 and 3.9 micrometers) will be challenged.  Furthermore, on this particular day, IFR conditions (the observation map is below;  stations with IFR conditions are circled in red) are most frequent underneath the multiple cloud layers in the eastern part of the state, and at high levels, such as in the Brooks Range.

The GOES-R IFR probability field suggests higher possibilities of IFR conditions in regions where IFR conditions are observed:  near Anchorage, on the Aleutian peninsula and in the Brooks Range.

Observations over Alaska at 1500 UTC 31 August.  IFR conditions highlighted by red circles.

IFR over SW Alaska

GOES-R IFR Probabilities (upper left) computed from GOES-West, GOES-R IFR Probabilities computed from MODIS (upper right), Visible Imagery (bottom left), Topography (bottom right)

GOES-R probabilities are a fused product between satellite data and the Rapid Refresh model.  Model data are used only where multiple cloud layers are present and or where a single cirrus cloud level exists.  The character of the IFR probability field looks different when model data only is used.  IFR probabilities are lower when only model data are used.

IFR probabilities are well related to observations at Kodiak, for example.  As the higher probabilities increase from the southwest, ceilings lower, and eventually IFR conditions occur.  The better resolution of the MODIS imagery, below, allows far finer-scale structures to be resolved in the imagery.

GOES-R IFR Probabilities (upper left) computed from GOES-West, GOES-R IFR Probabilities computed from MODIS (upper right), Visible Imagery (bottom left), Topography (bottom right)

Note how the smaller probabilities are downwind of the Aleutians.  Visible imagery — at the end of the animation — distinctly shows the clear region.

IFR Conditions in Isaac

GOES-R IFR Probability Field associated with Tropical Storm Isaac

The multiple cloud layers associated with a tropical system, and the extensive cirrus shield that is spawned by rainbands, makes it very difficult for the traditional brightness temperature difference product to be used to highlight regions of low stratus and fog.  This is when model data are vital in a fused product to highlight regions of aviation hazards, as shown in this loop.  There is a change in probability as the Sun rises that is associated with changes in the weights given to various predictors.  The color table suggests a very abrupt change.  In reality, values increase from 10 to 15 percentage points.

Note how well the IFR probability field matches the regions of IFR and near IFR conditions in the loop above.  This is testament to the accuracy of the model data, and to the relationships developed between model fields and IFR observations.