, GOES-East Brightness Temperature Difference (Upper Right, 10.7 µm - 3.9 µm), MODIS-based GOES-R IFR Probabilities (Lower Left), GOES-based GOES-R Cloud Thickness (Lower Right) (click image to play animation)")
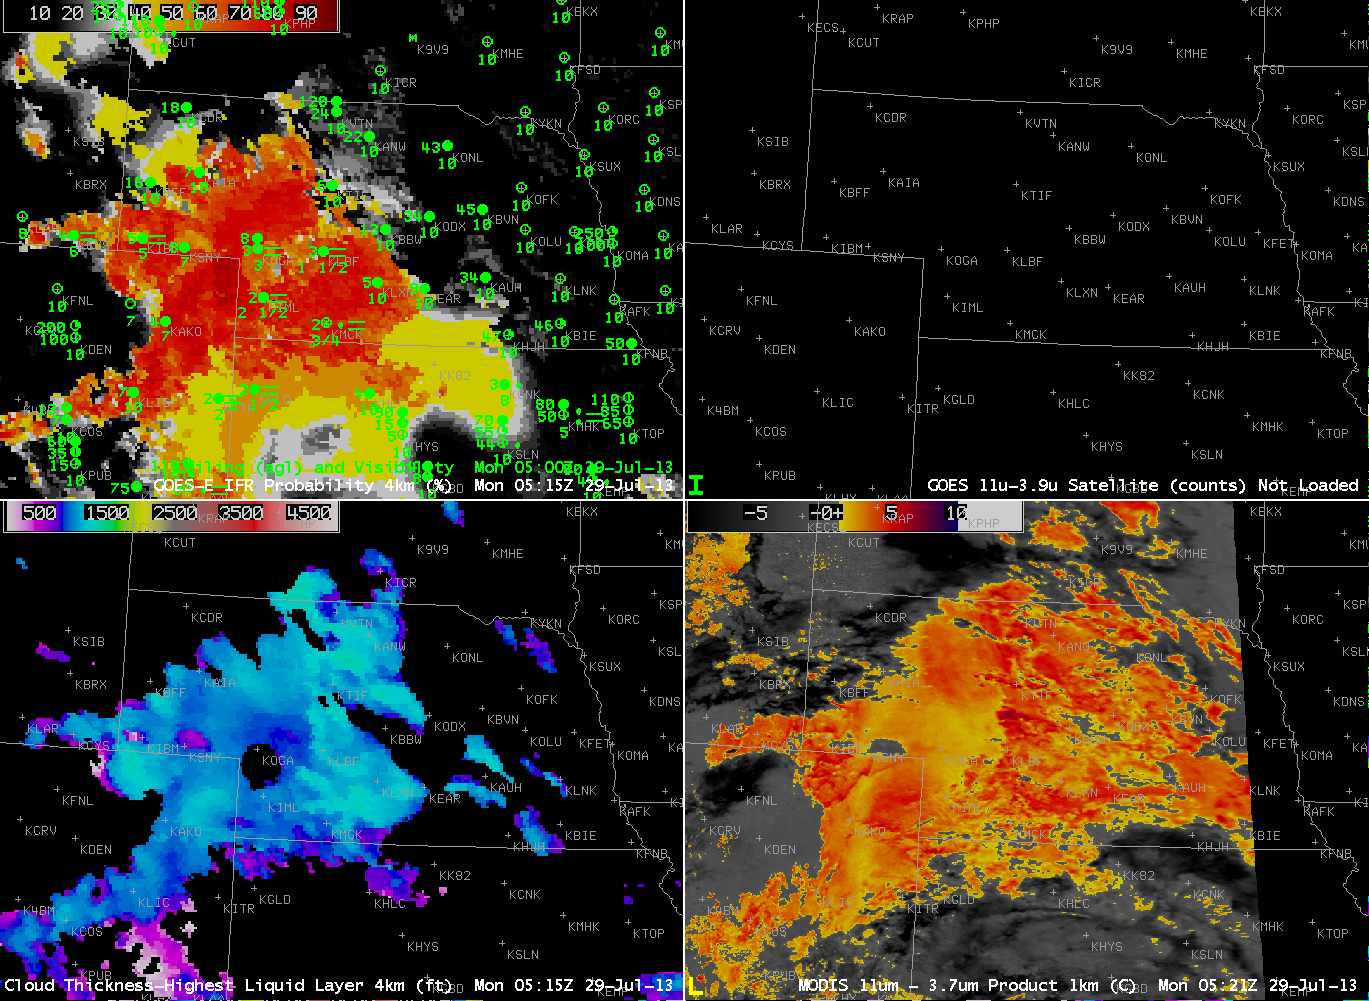
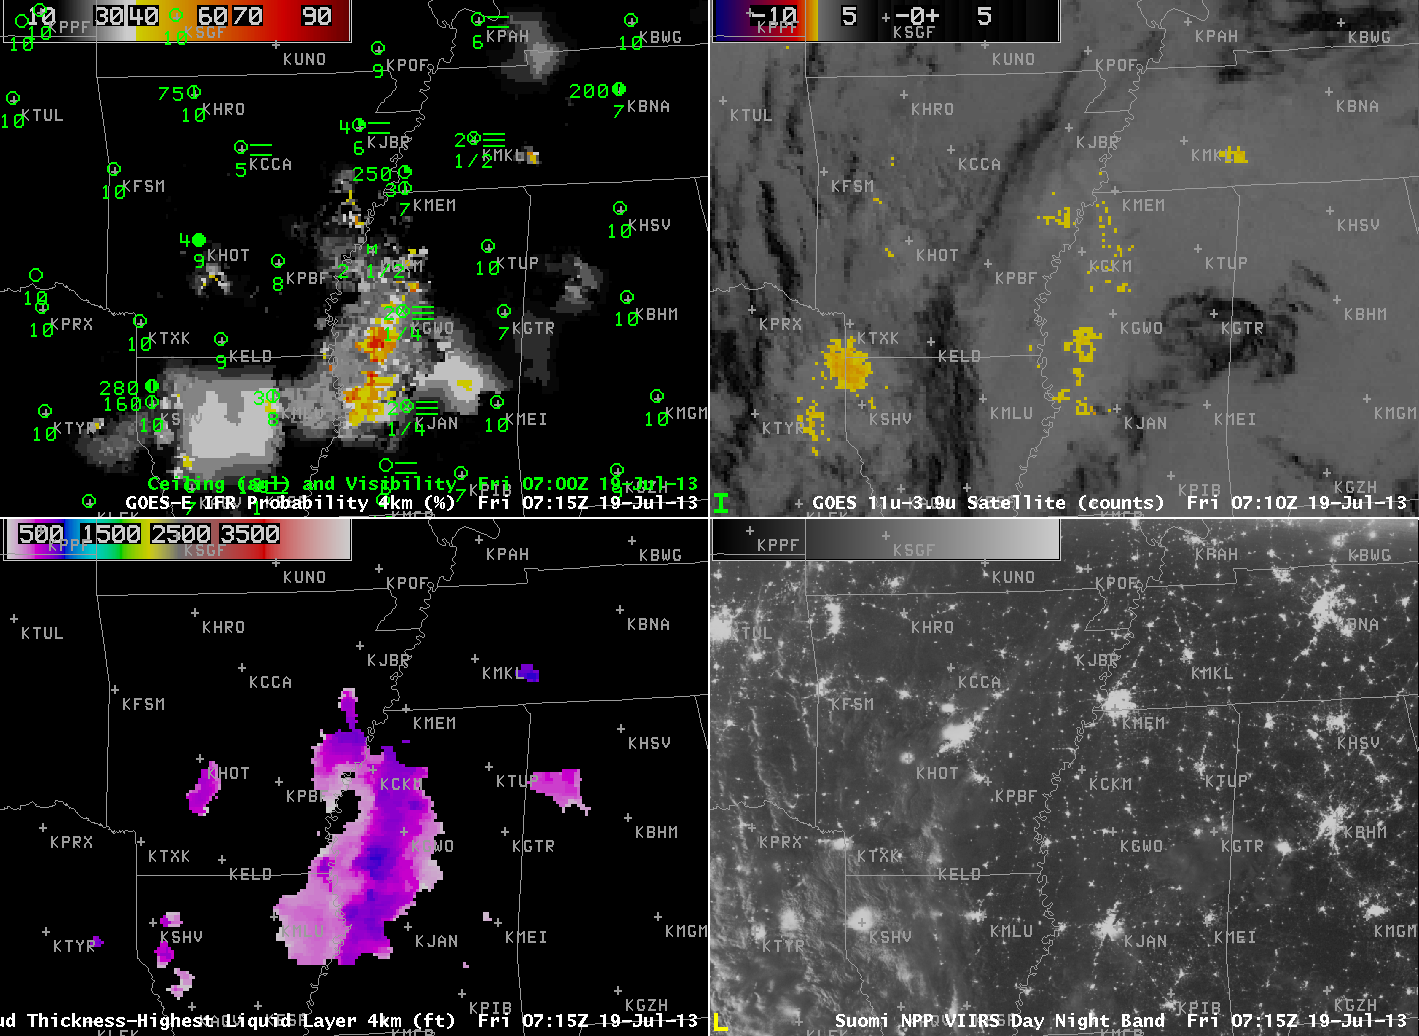
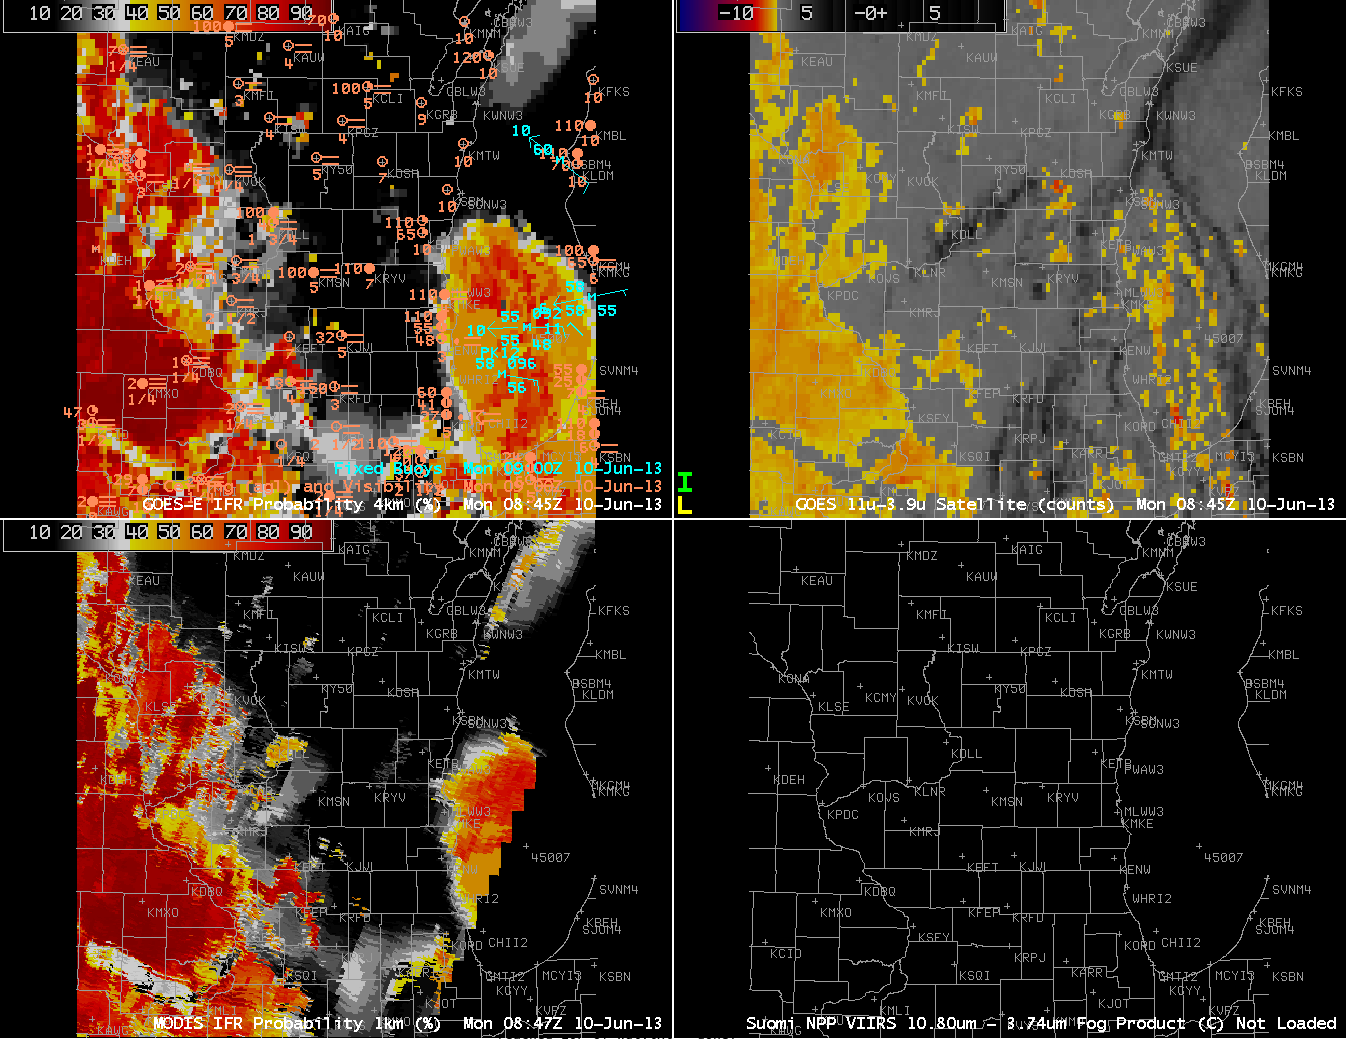
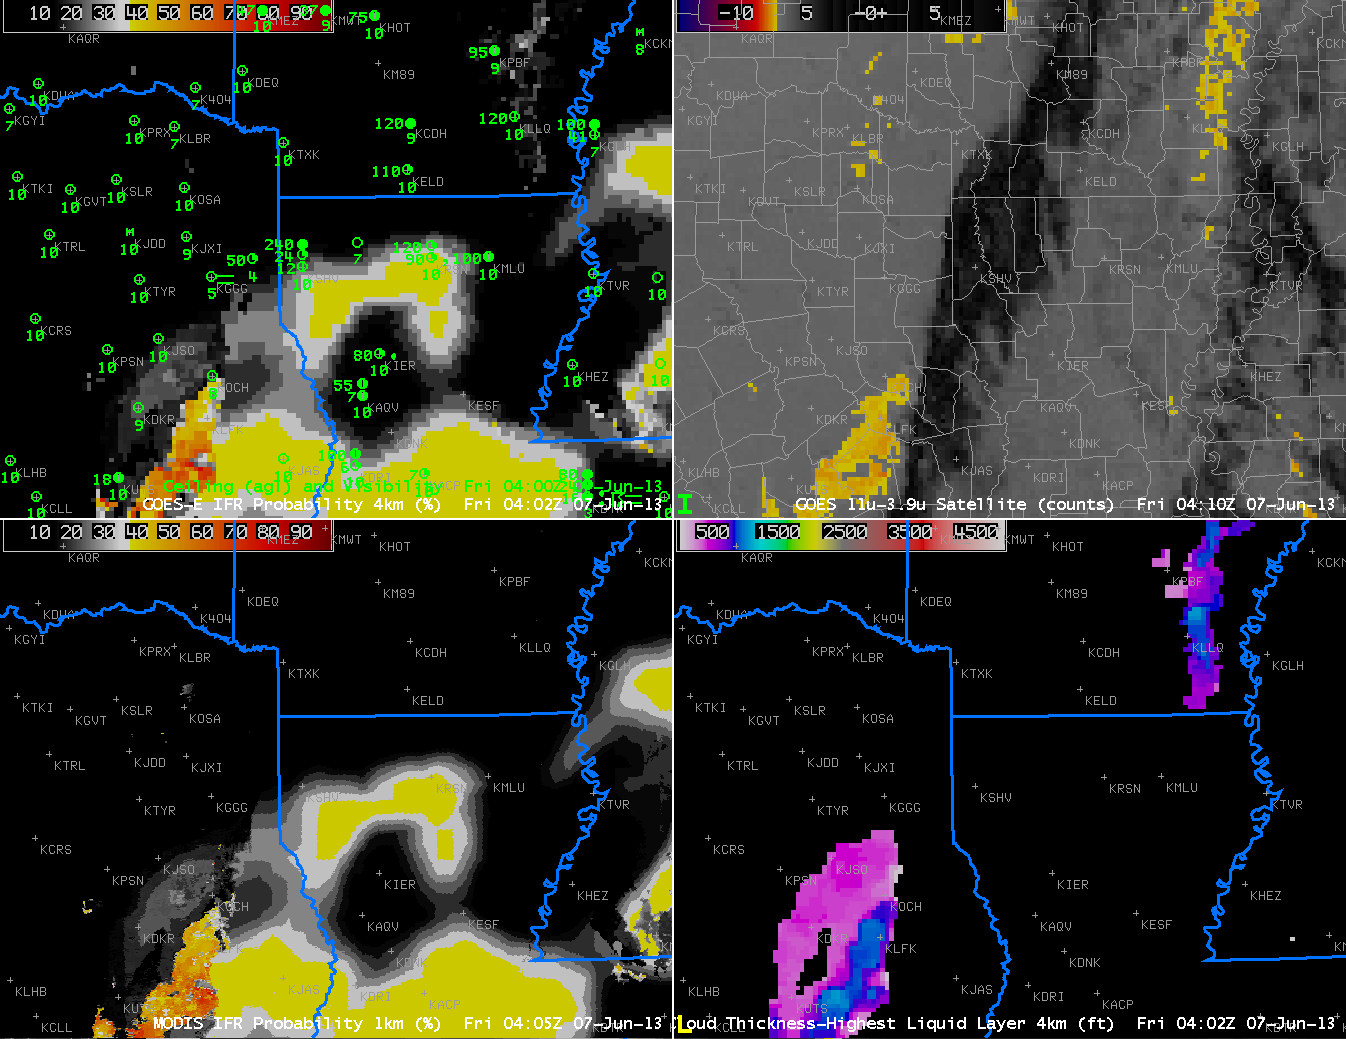
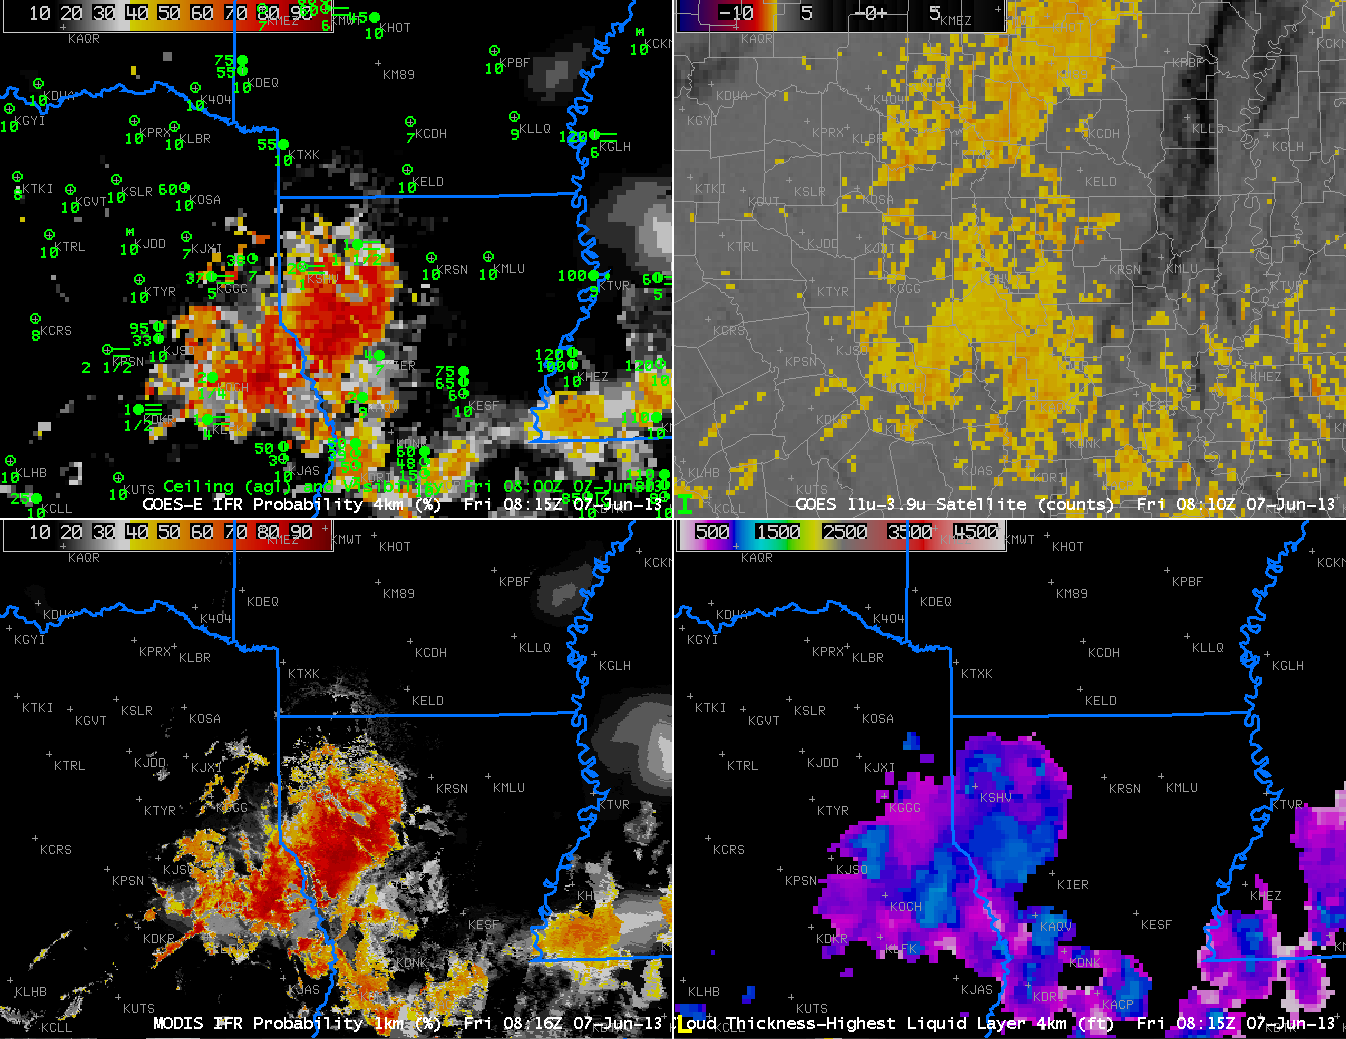
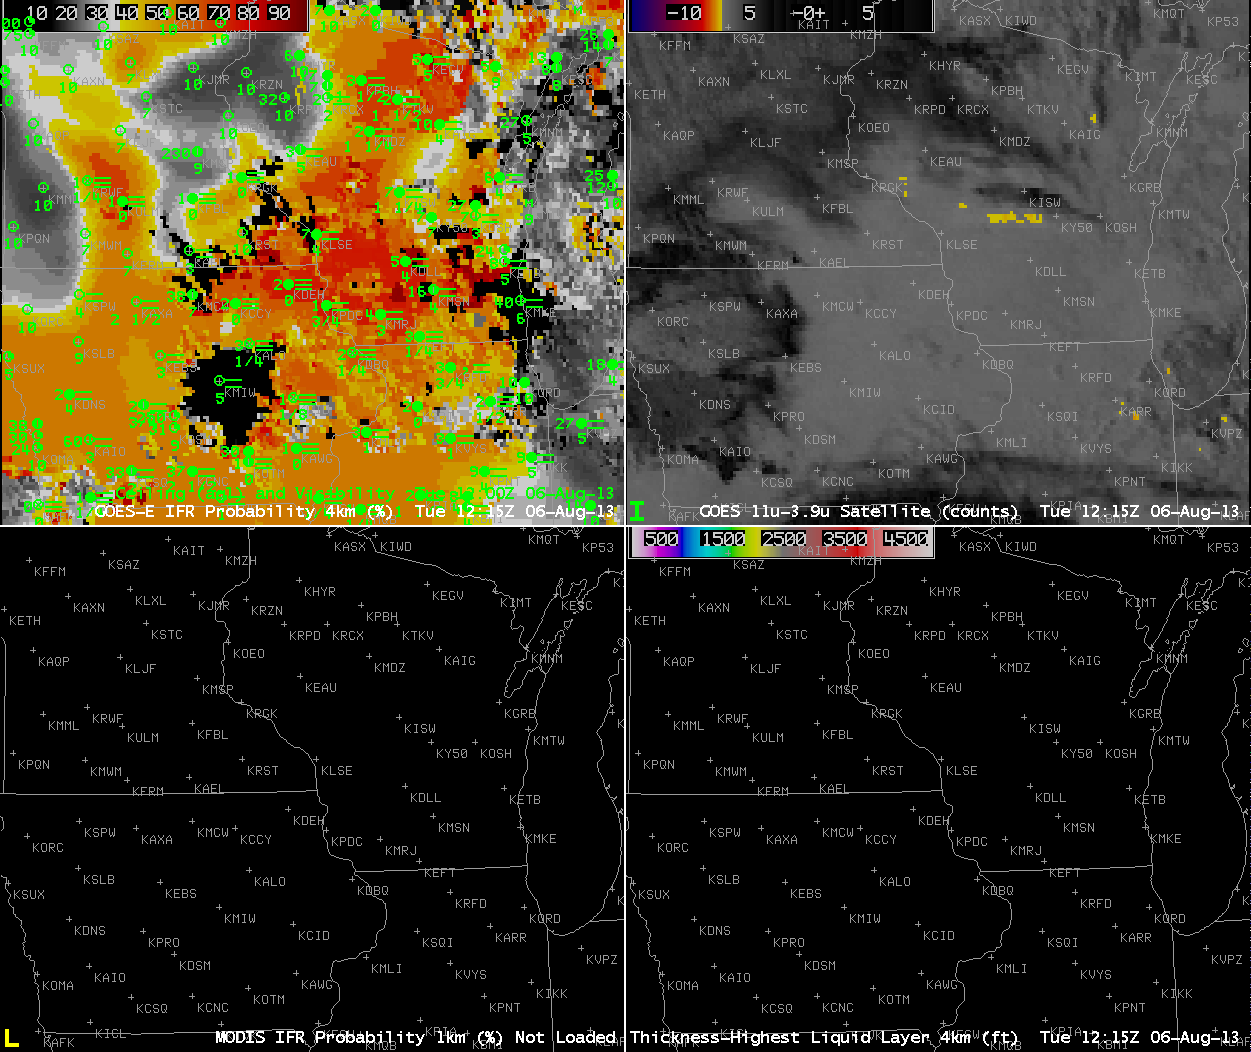
GOES-based GOES-R IFR Probabilities (Upper Left), GOES-East Brightness Temperature Difference (Upper Right, 10.7 µm – 3.9 µm), MODIS-based GOES-R IFR Probabilities (Lower Left), GOES-based GOES-R Cloud Thickness (Lower Right) (click image to play animation)
As nights lengthen in the upper Midwest in late Summer, the probability of fog development increases, especially on nights after light rainfall. The hourly animation, above, shows the gradual areal increase in high IFR probabilities that occurs as surface visibilities fall. Several aspects to the animation bear investigation. Note, for example, that at the start of the animation, the brightness temperature difference field, the traditional method used for fog detection, has a strong signal over eastern Illinois and western Indiana, a region where IFR conditions are not reported. This is a region of stratus clouds. Rapid Refresh model data that are incorporated into the GOES-R algorithm screens out these mid-level clouds; IFR probabilities in that region are correctly negligible. The end of the animation, 1215 UTC, occurs after sunrise, and reflected 3.9 µm solar radiation is affecting the brightness temperature difference field. The solar radiation complicates the use of the brightness temperature difference field as the sun rises. (Note also in that 1215 UTC image that GOES-R Cloud Thickness is not computed as it is during twilight conditions).
The VIIRS instrument on board Suomi/NPP includes a day/night band that uses reflected Earth Glow and reflected lunar light to detect clouds. When the moon has set (or near times of the new moon — and the new moon occurs on August 6th, the date of these images), the scant illumination from Earthglow only makes low cloud detection a challenge. The brightness temperature difference product will still detect water-based cloudiness, however, as shown in the toggle above. However, the brightness temperature difference product does not include information on the cloud base, only on the cloud top. Incorporation of Suomi/NPP data into the GOES-R IFR Probability algorithm is ongoing.


